
Ascending Performance of Scientific Balloons with Buoyant Gas–Air Mixture Inflation for Designated Ceiling Height
 ,
,
Abstract
:1. Introduction
2. Theoretical Model
2.1. Inflation Model
2.2. Thermal Physics Properties
2.2.1. Heat Transfer Coefficient
2.2.2. Heat Capacity
2.2.3. Balloon Model
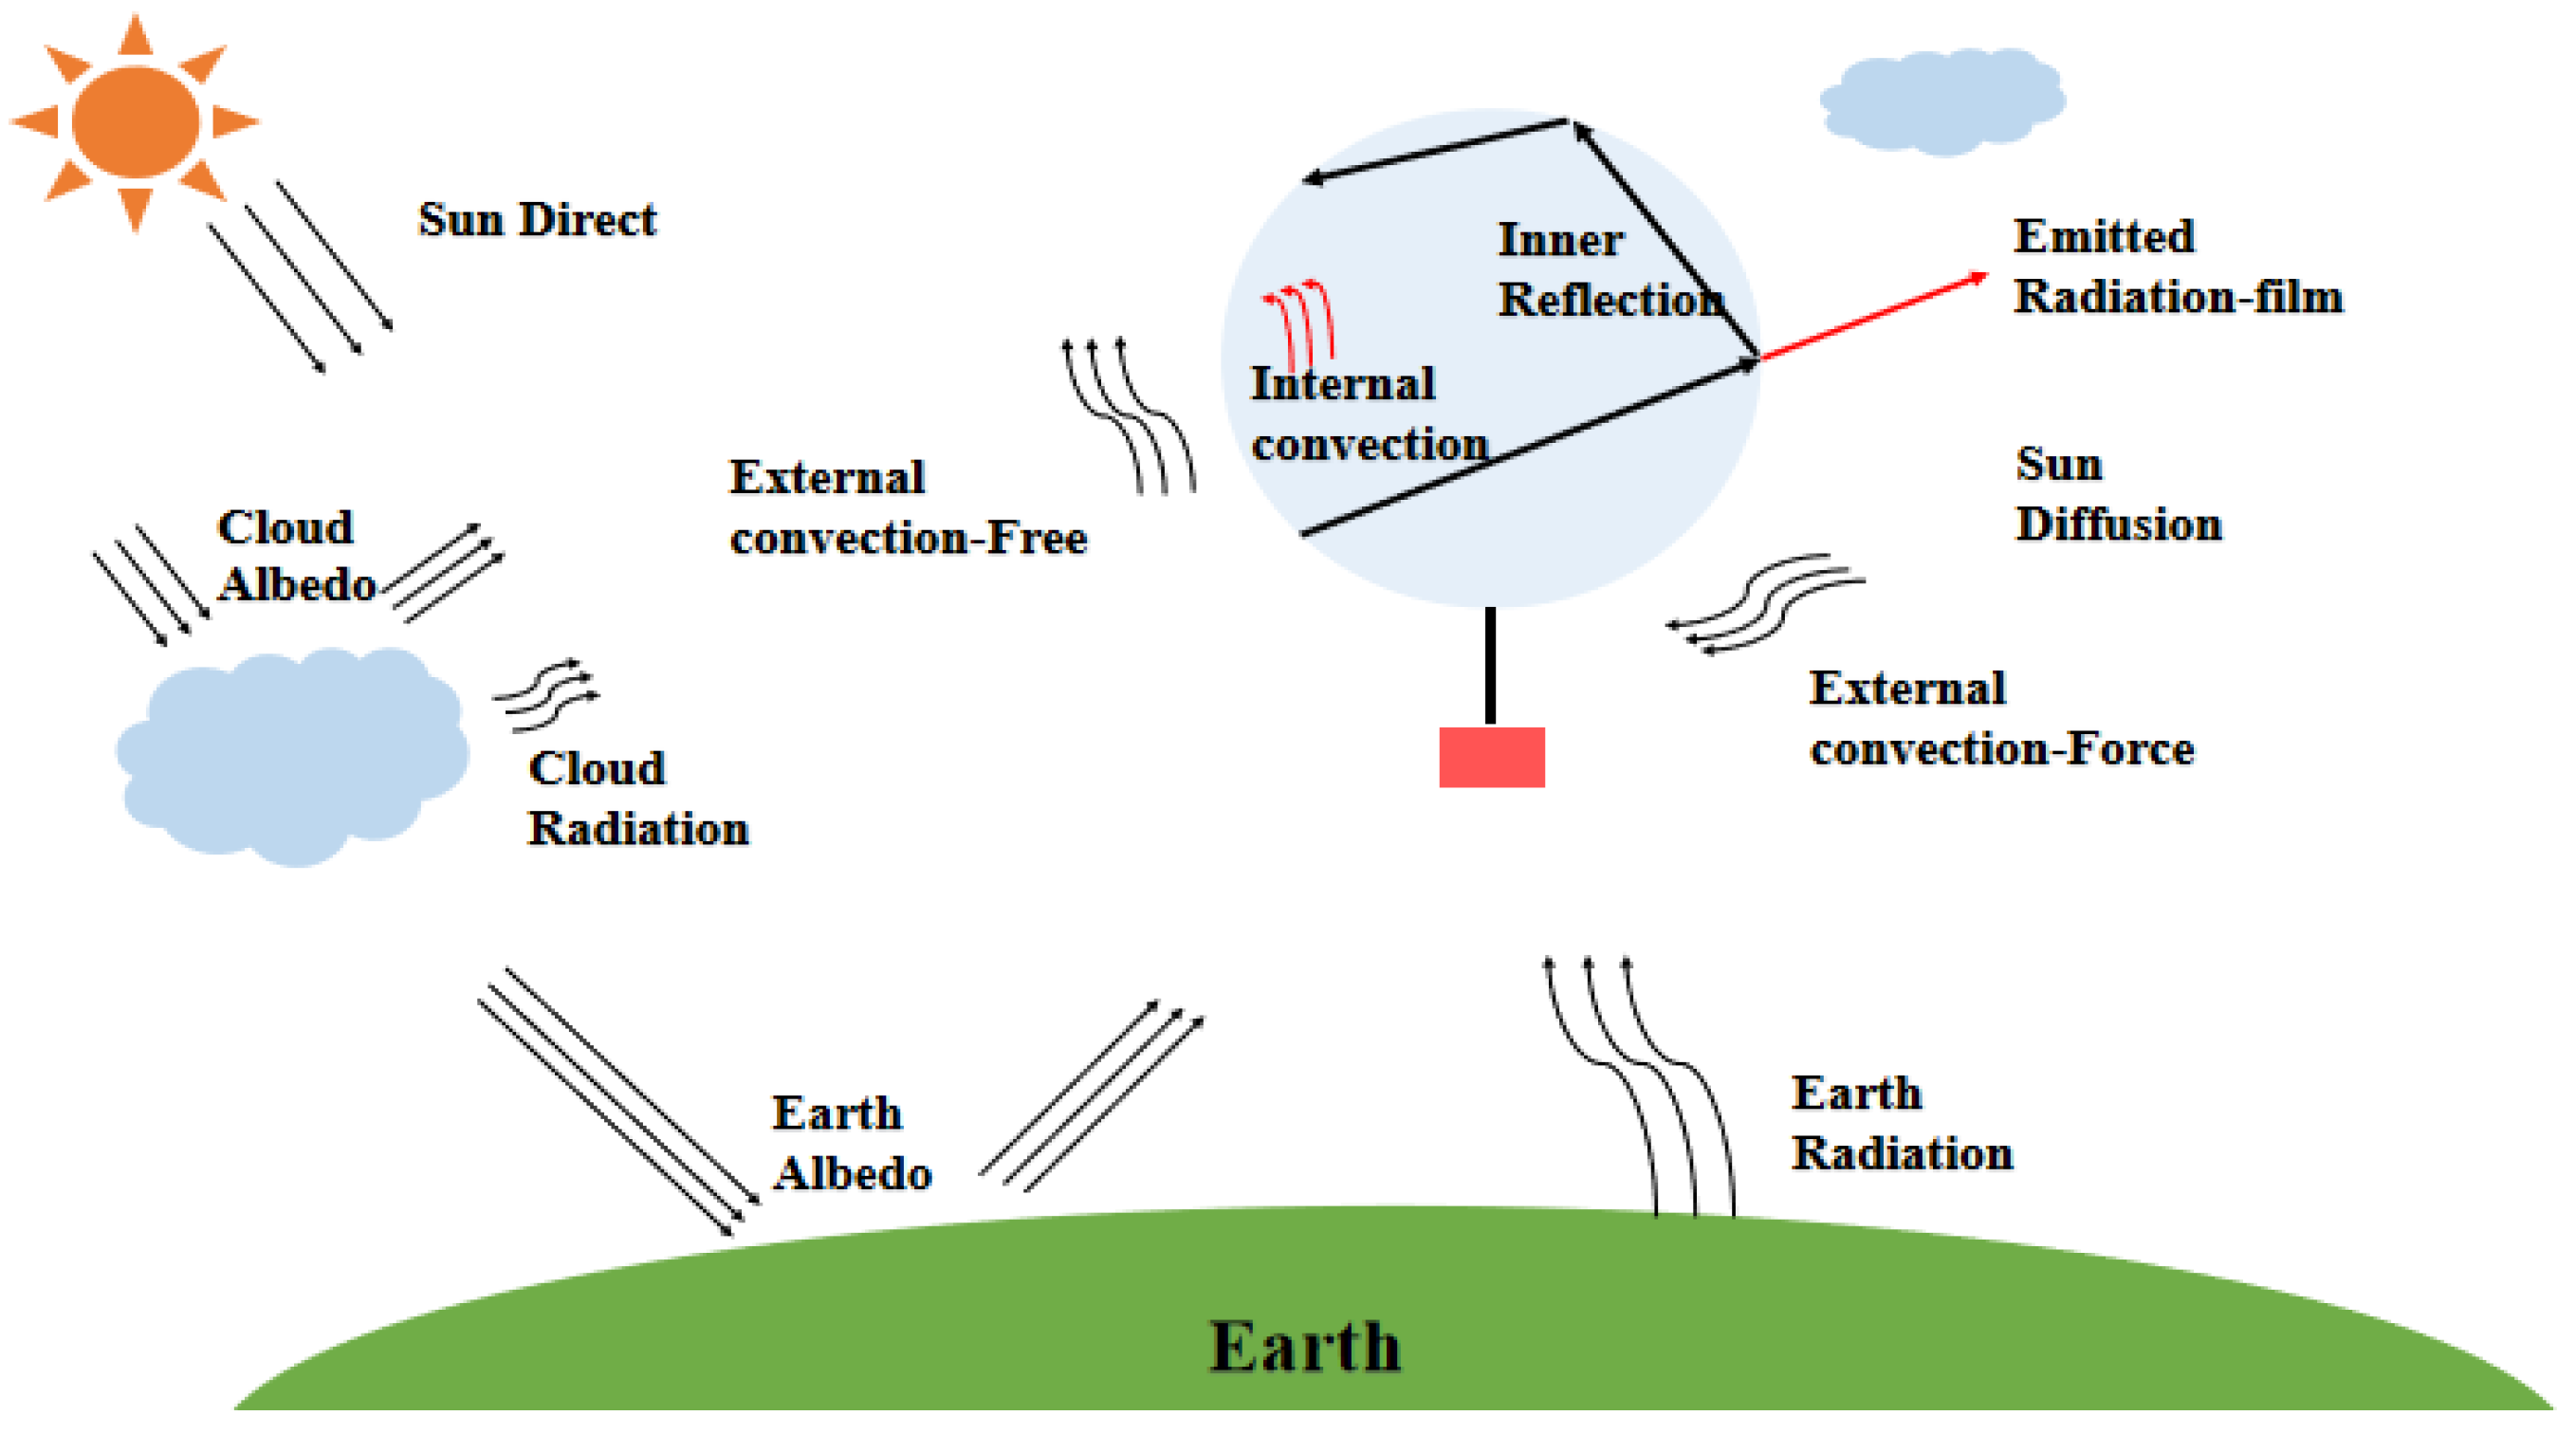
2.2.4. Thermal Environment
- 1. Solar radiation
- (1) Solar radiation on the film [33]
- 2. Infrared radiation from the Earth and sky
- (1) The effective IR radiation absorbance of the balloon film
- (2) The effective IR radiation absorbance of the balloon gas [42]
- 3. The thermal interchange of the film [34]
- 4. Balloon film emits heat radiation
- 5. The heat emission of the balloon gas
- 6. External convection
- 7. Internal convection [34]
2.2.5. Thermal Differential Equation
- 1. Balloon gas differential equation
- 2. Balloon film differential equation
2.3. Dynamic Model
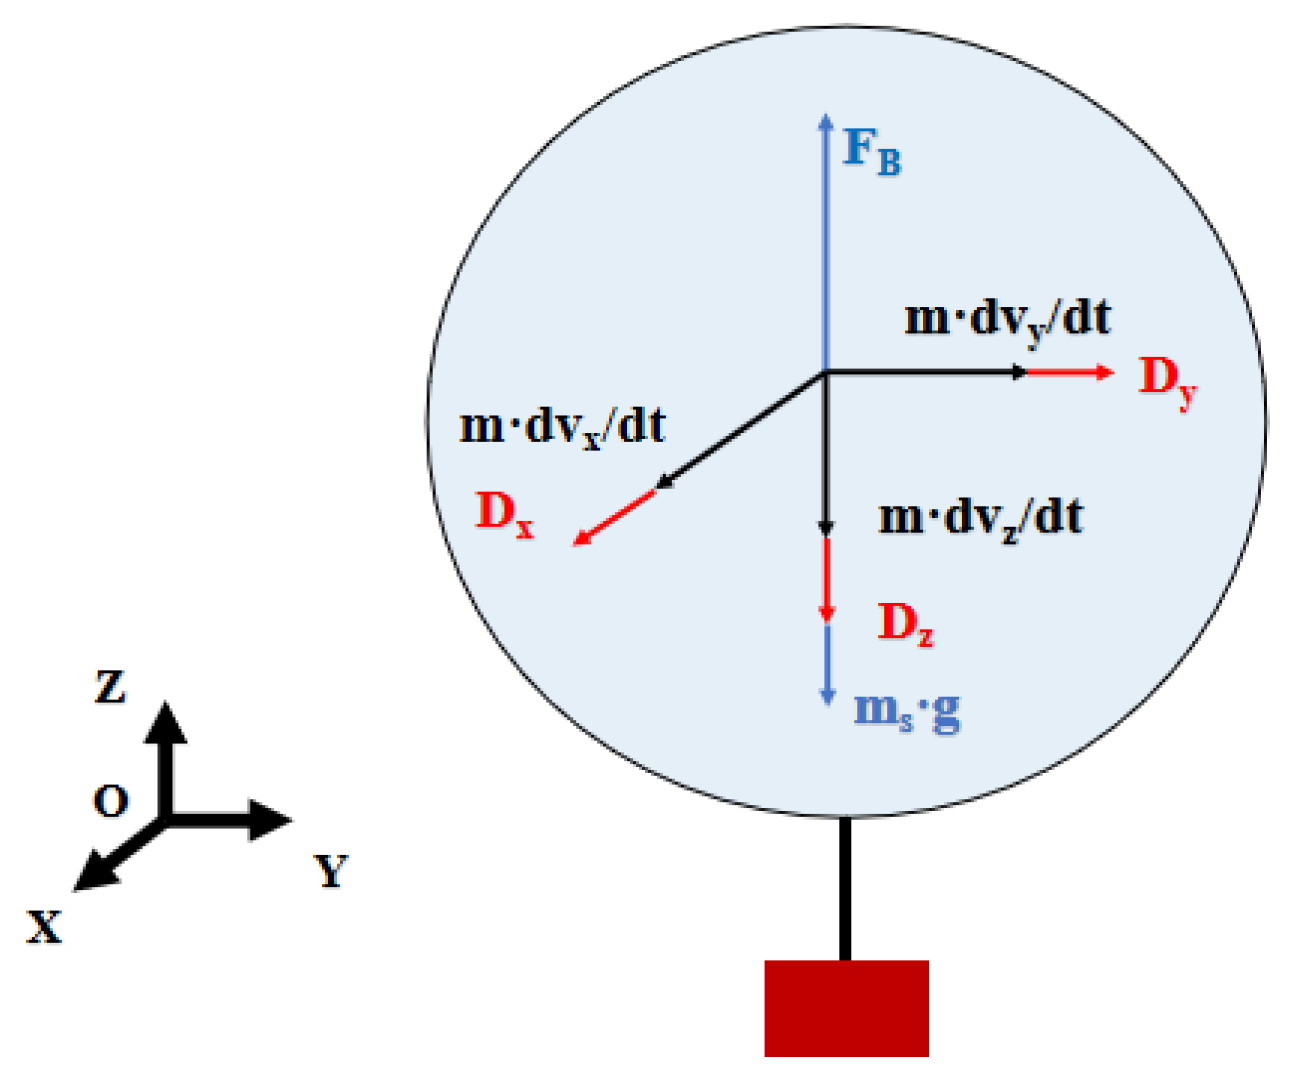
2.3.1. Force Analysis
2.3.2. Vertical Direction Difference Model
2.3.3. X/Y Direction Difference Model
3. Simulation
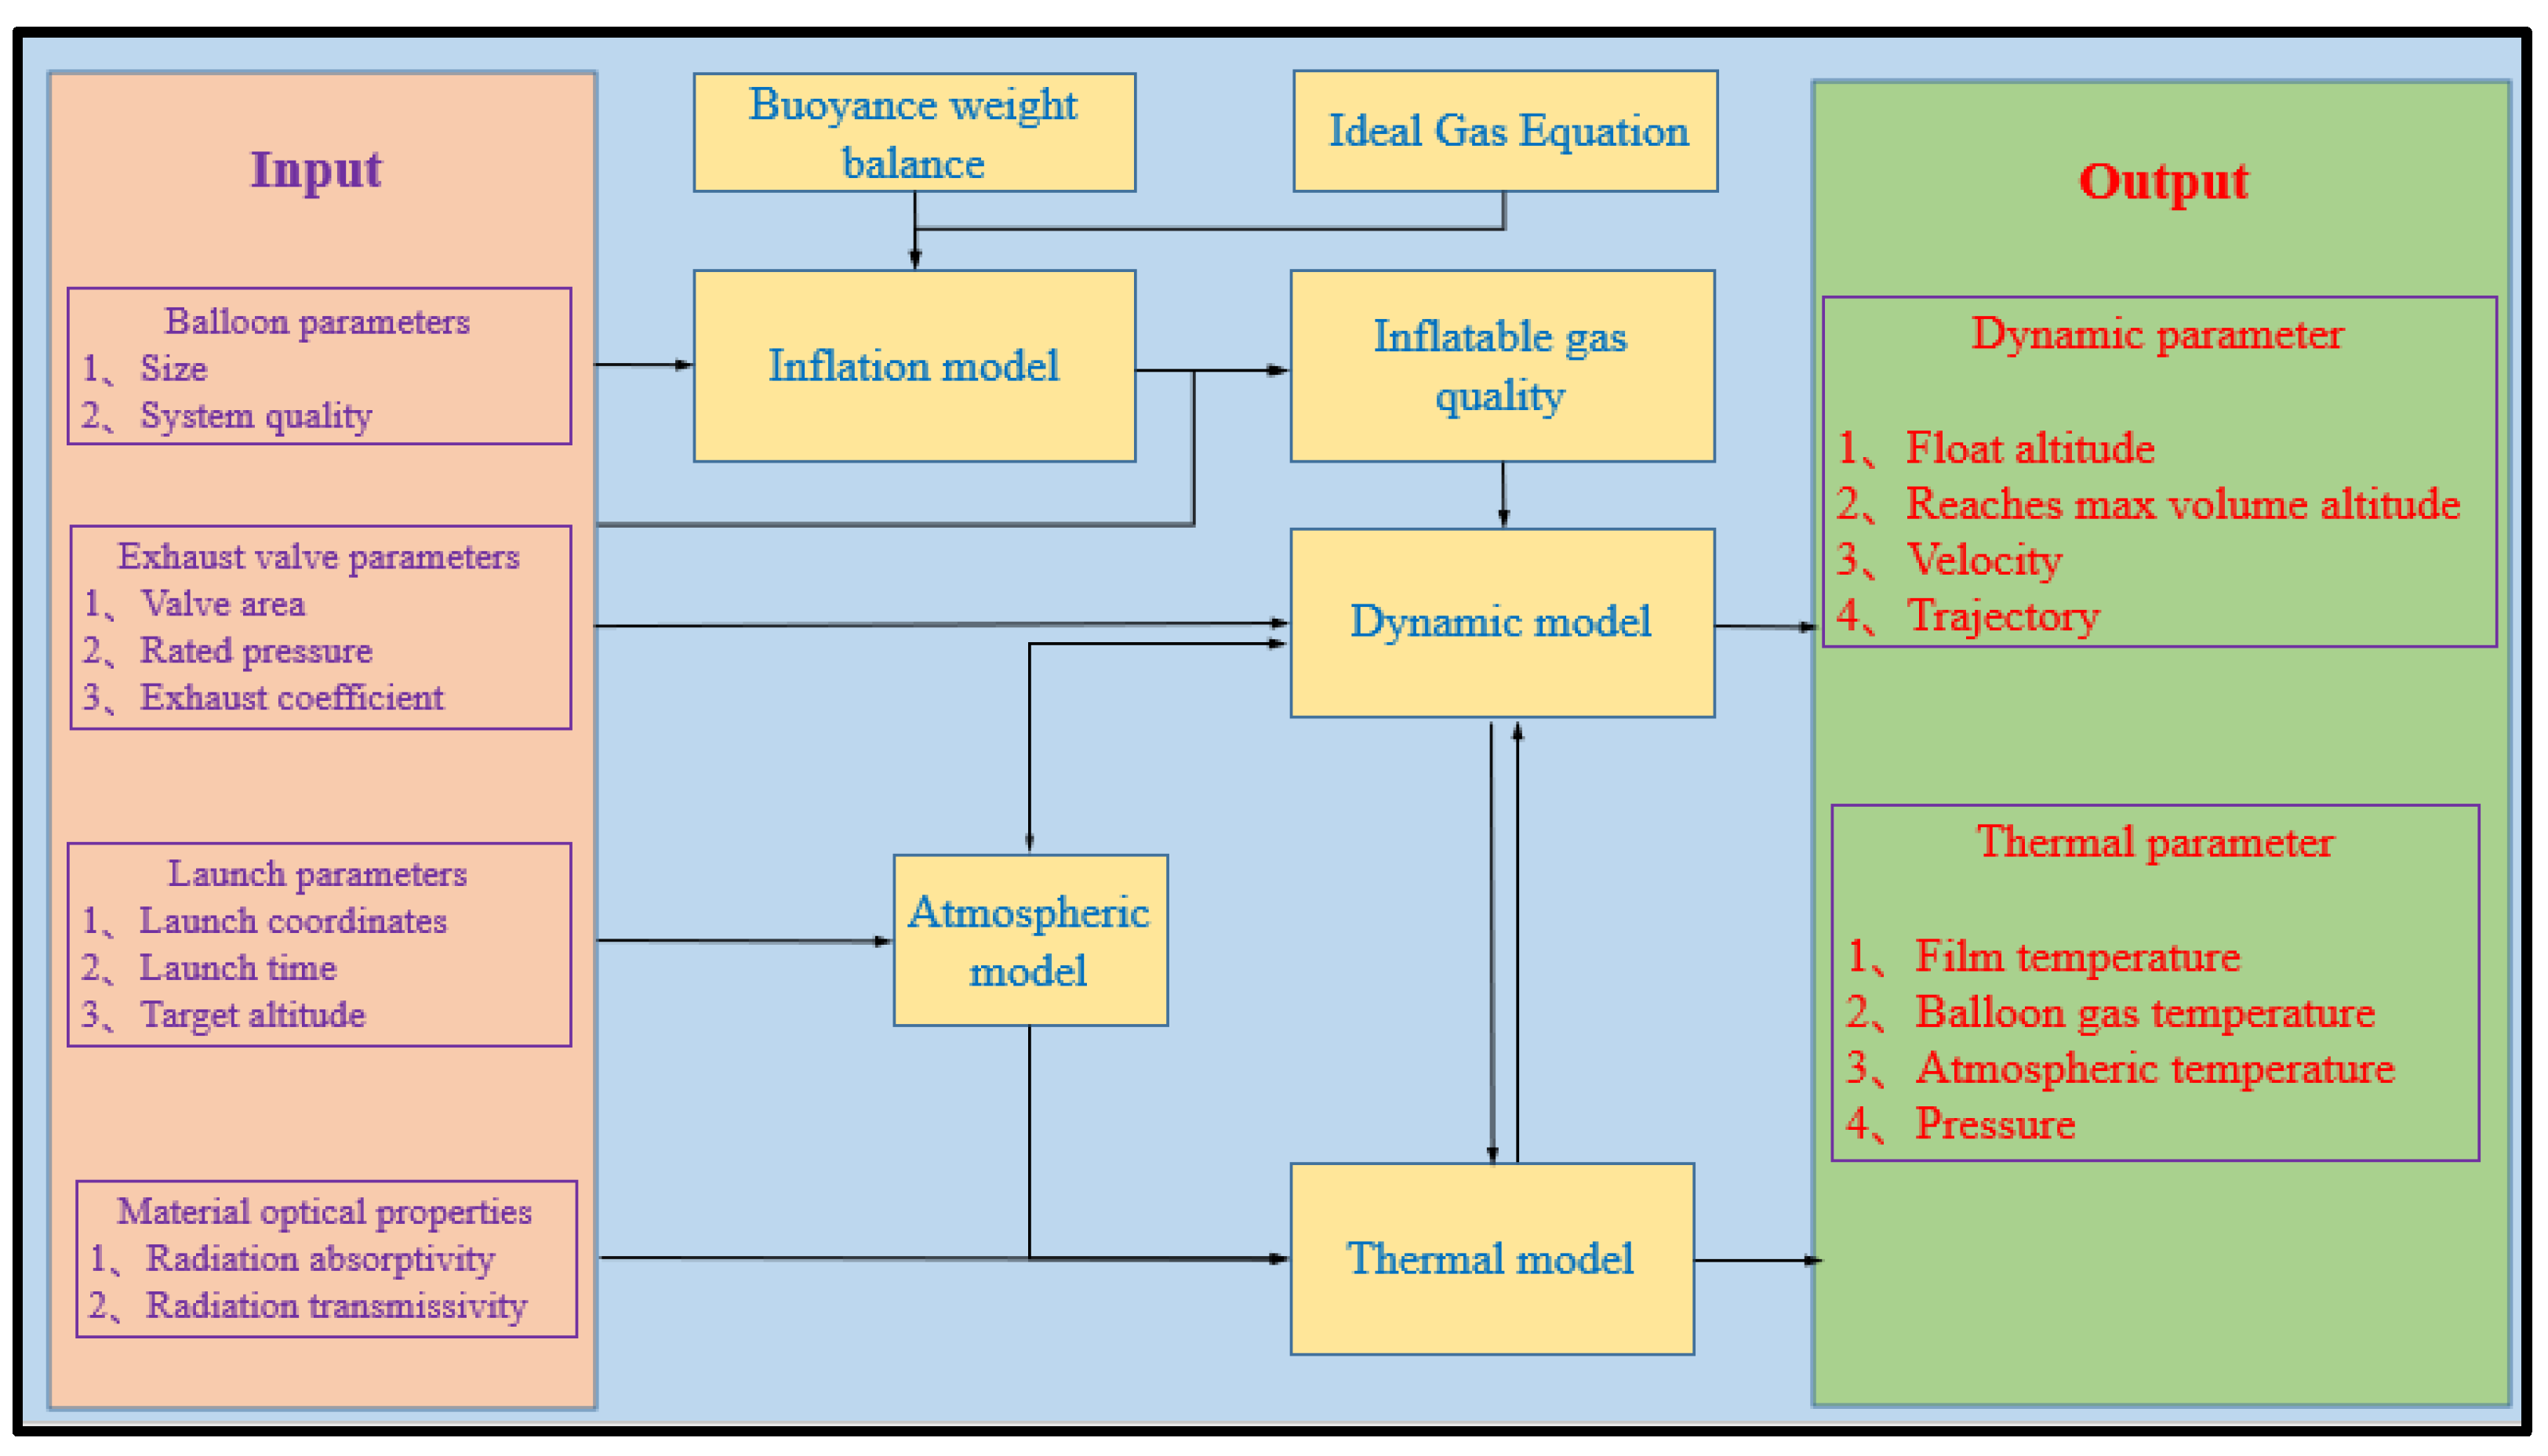
3.1. Simulation Program Framework
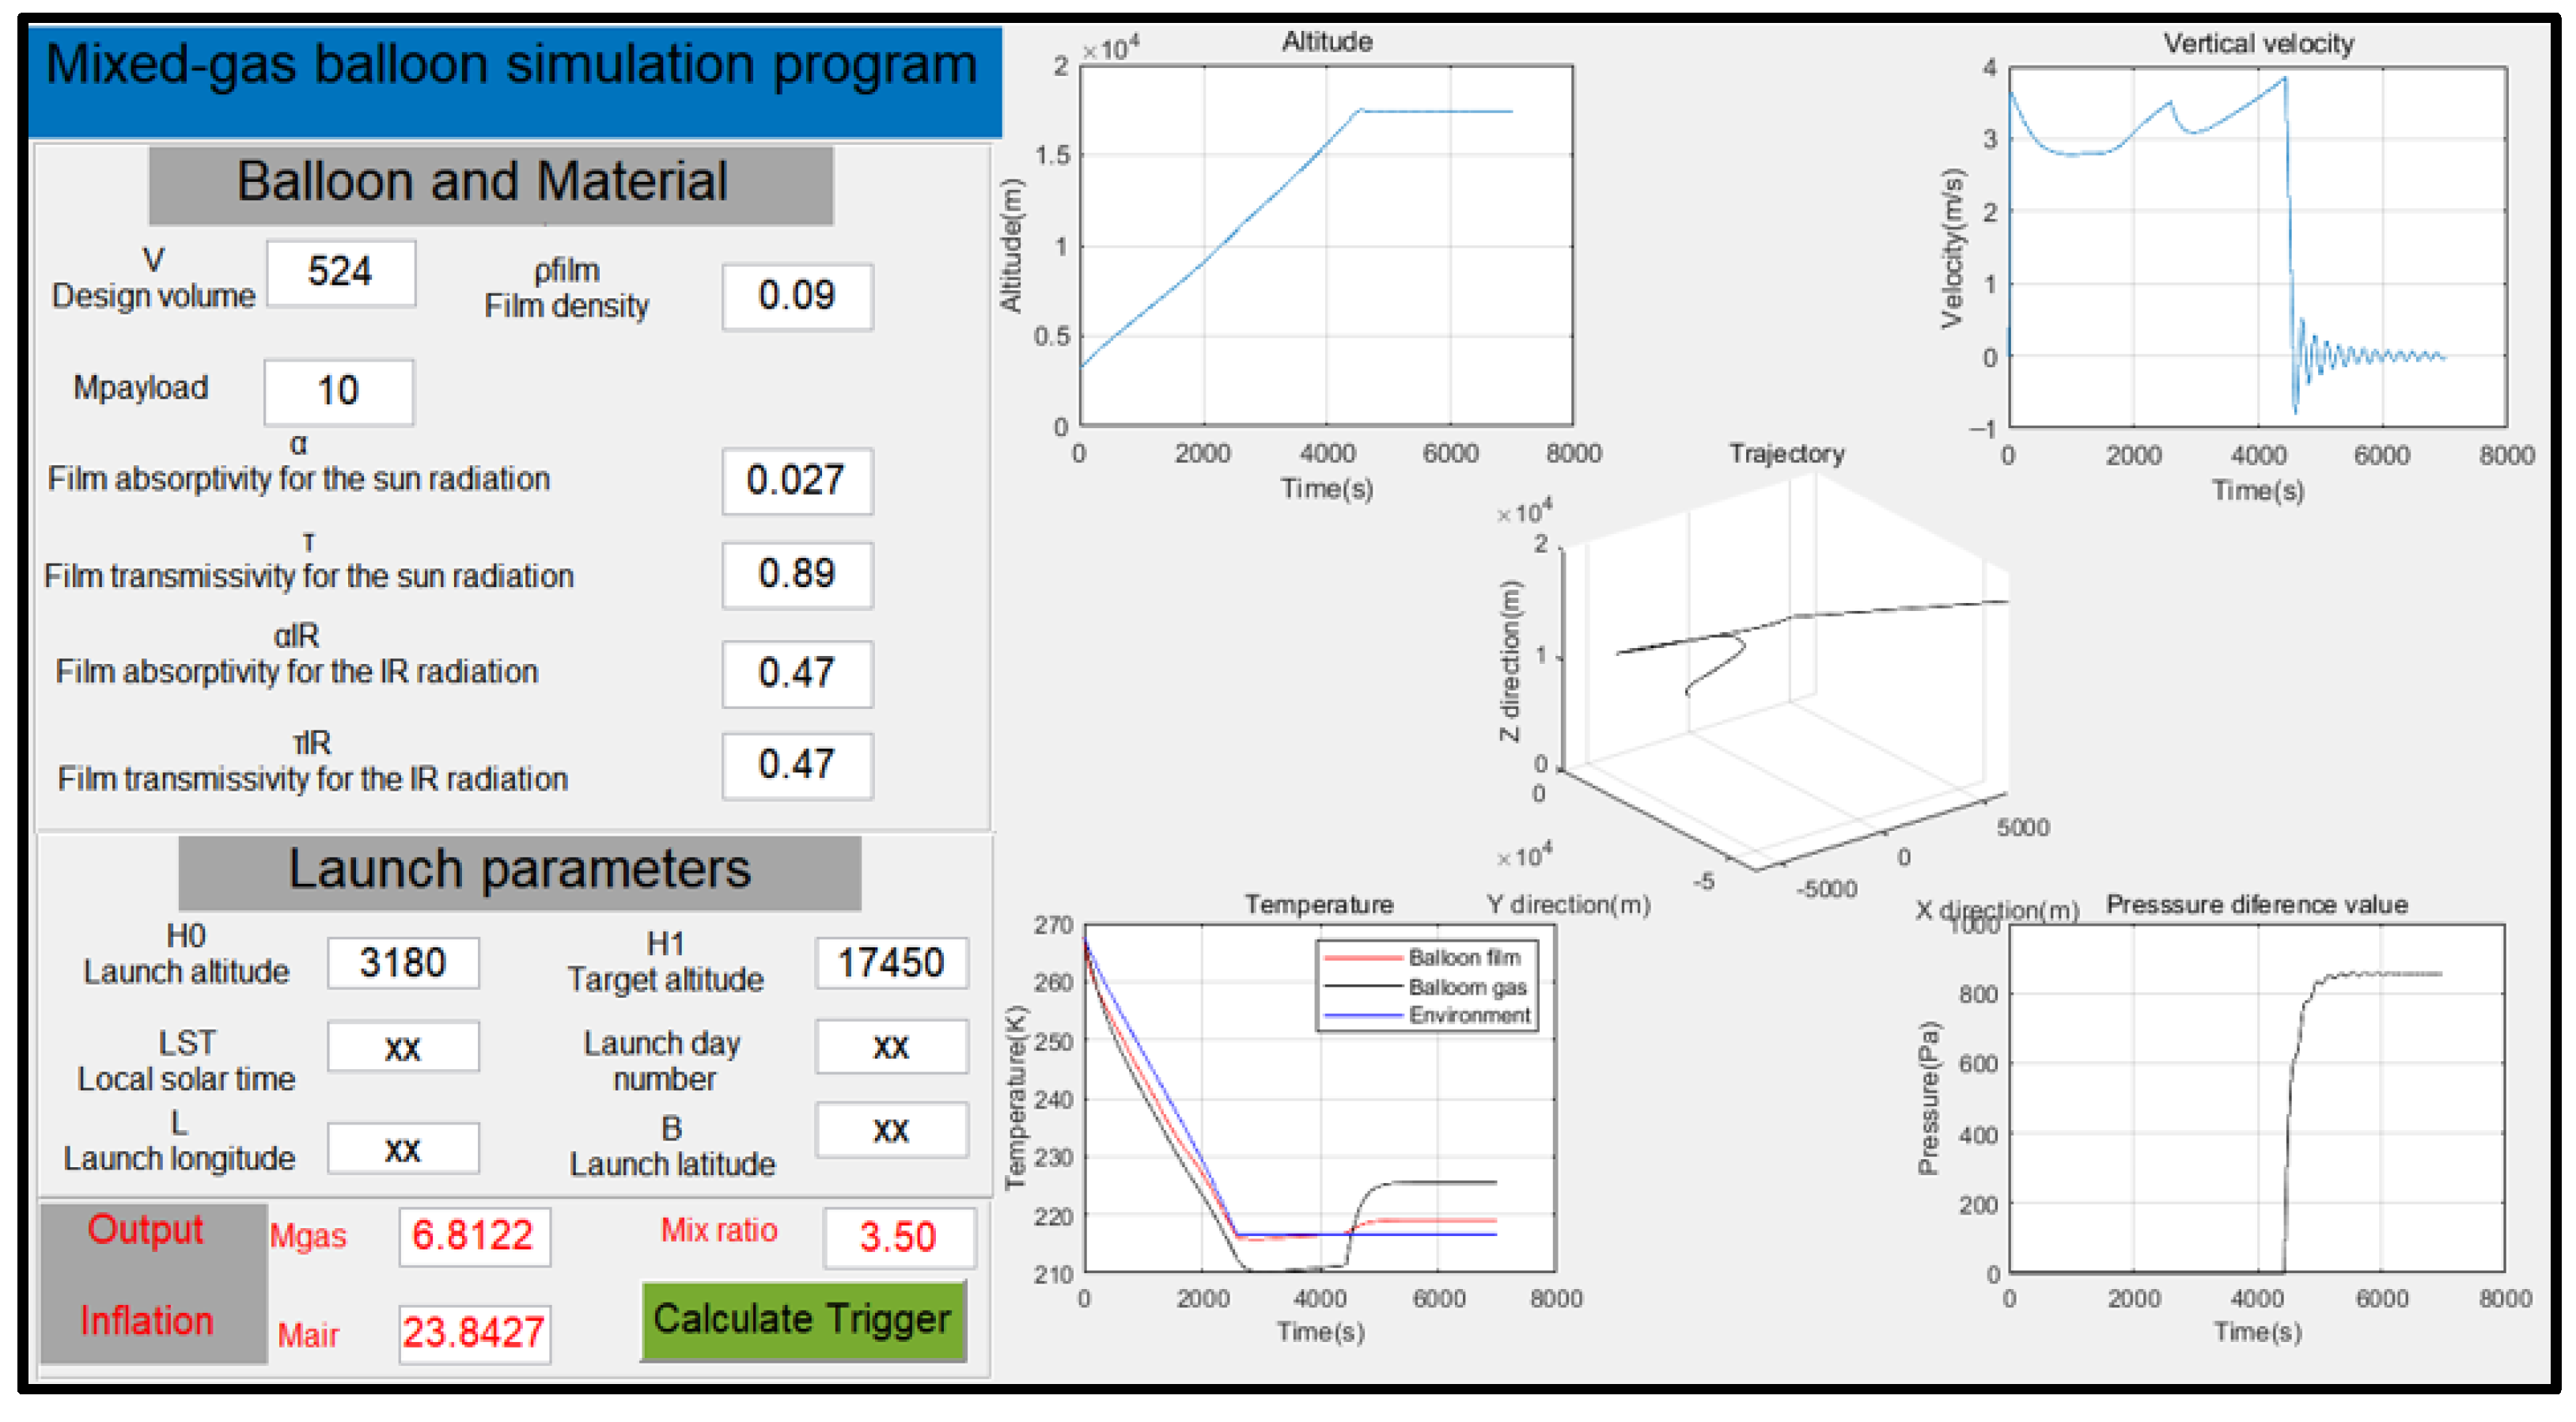
3.2. GUI Program
3.3. Balloon Parameters
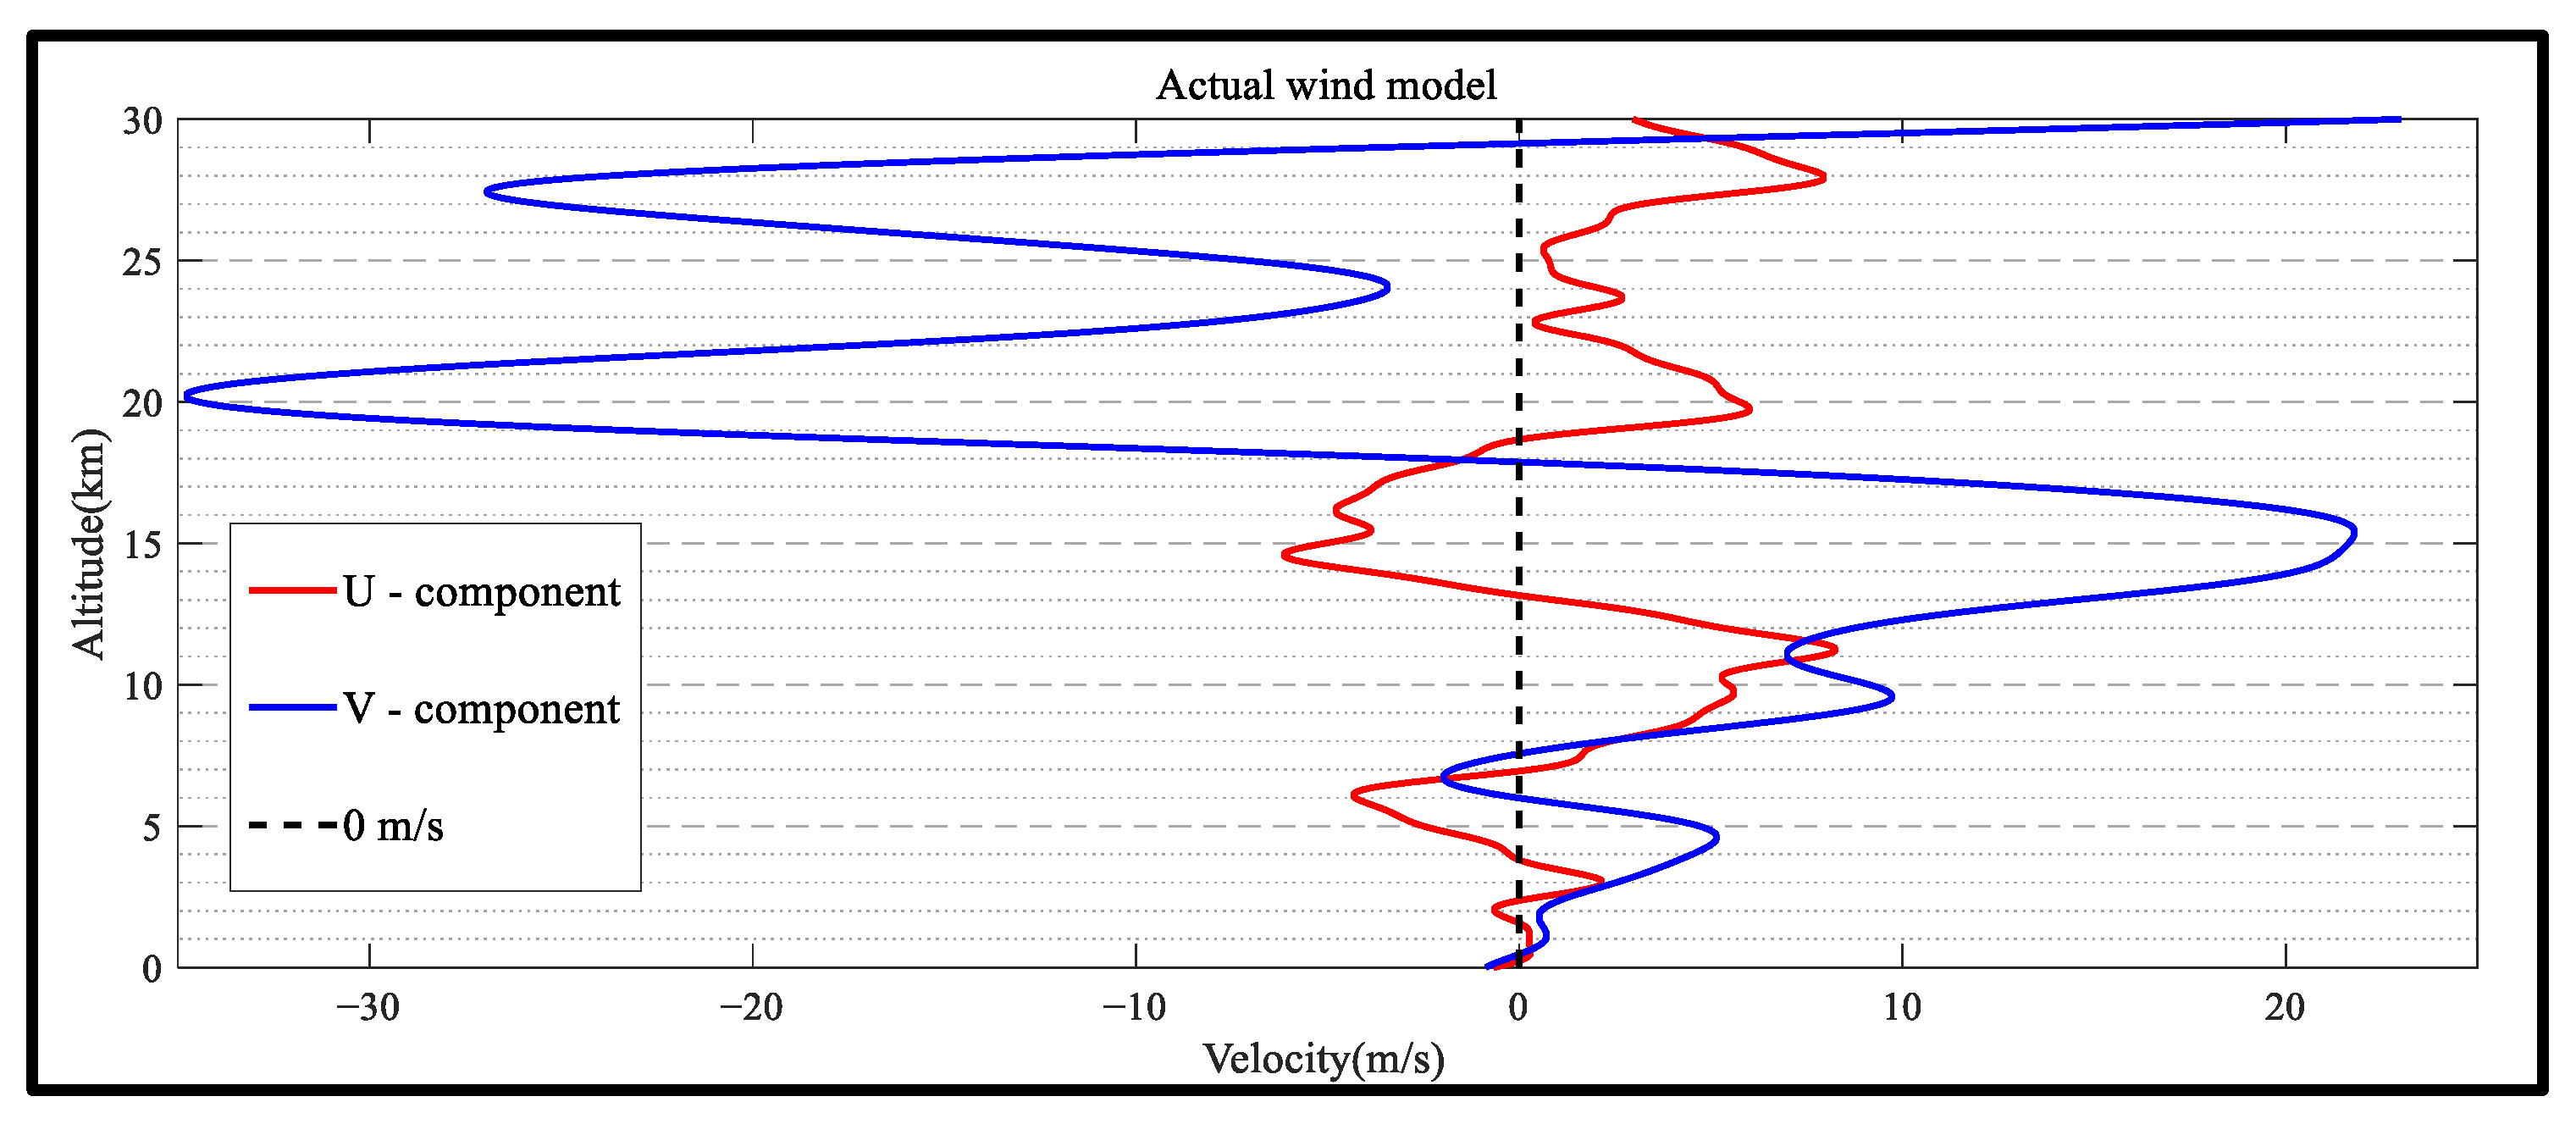
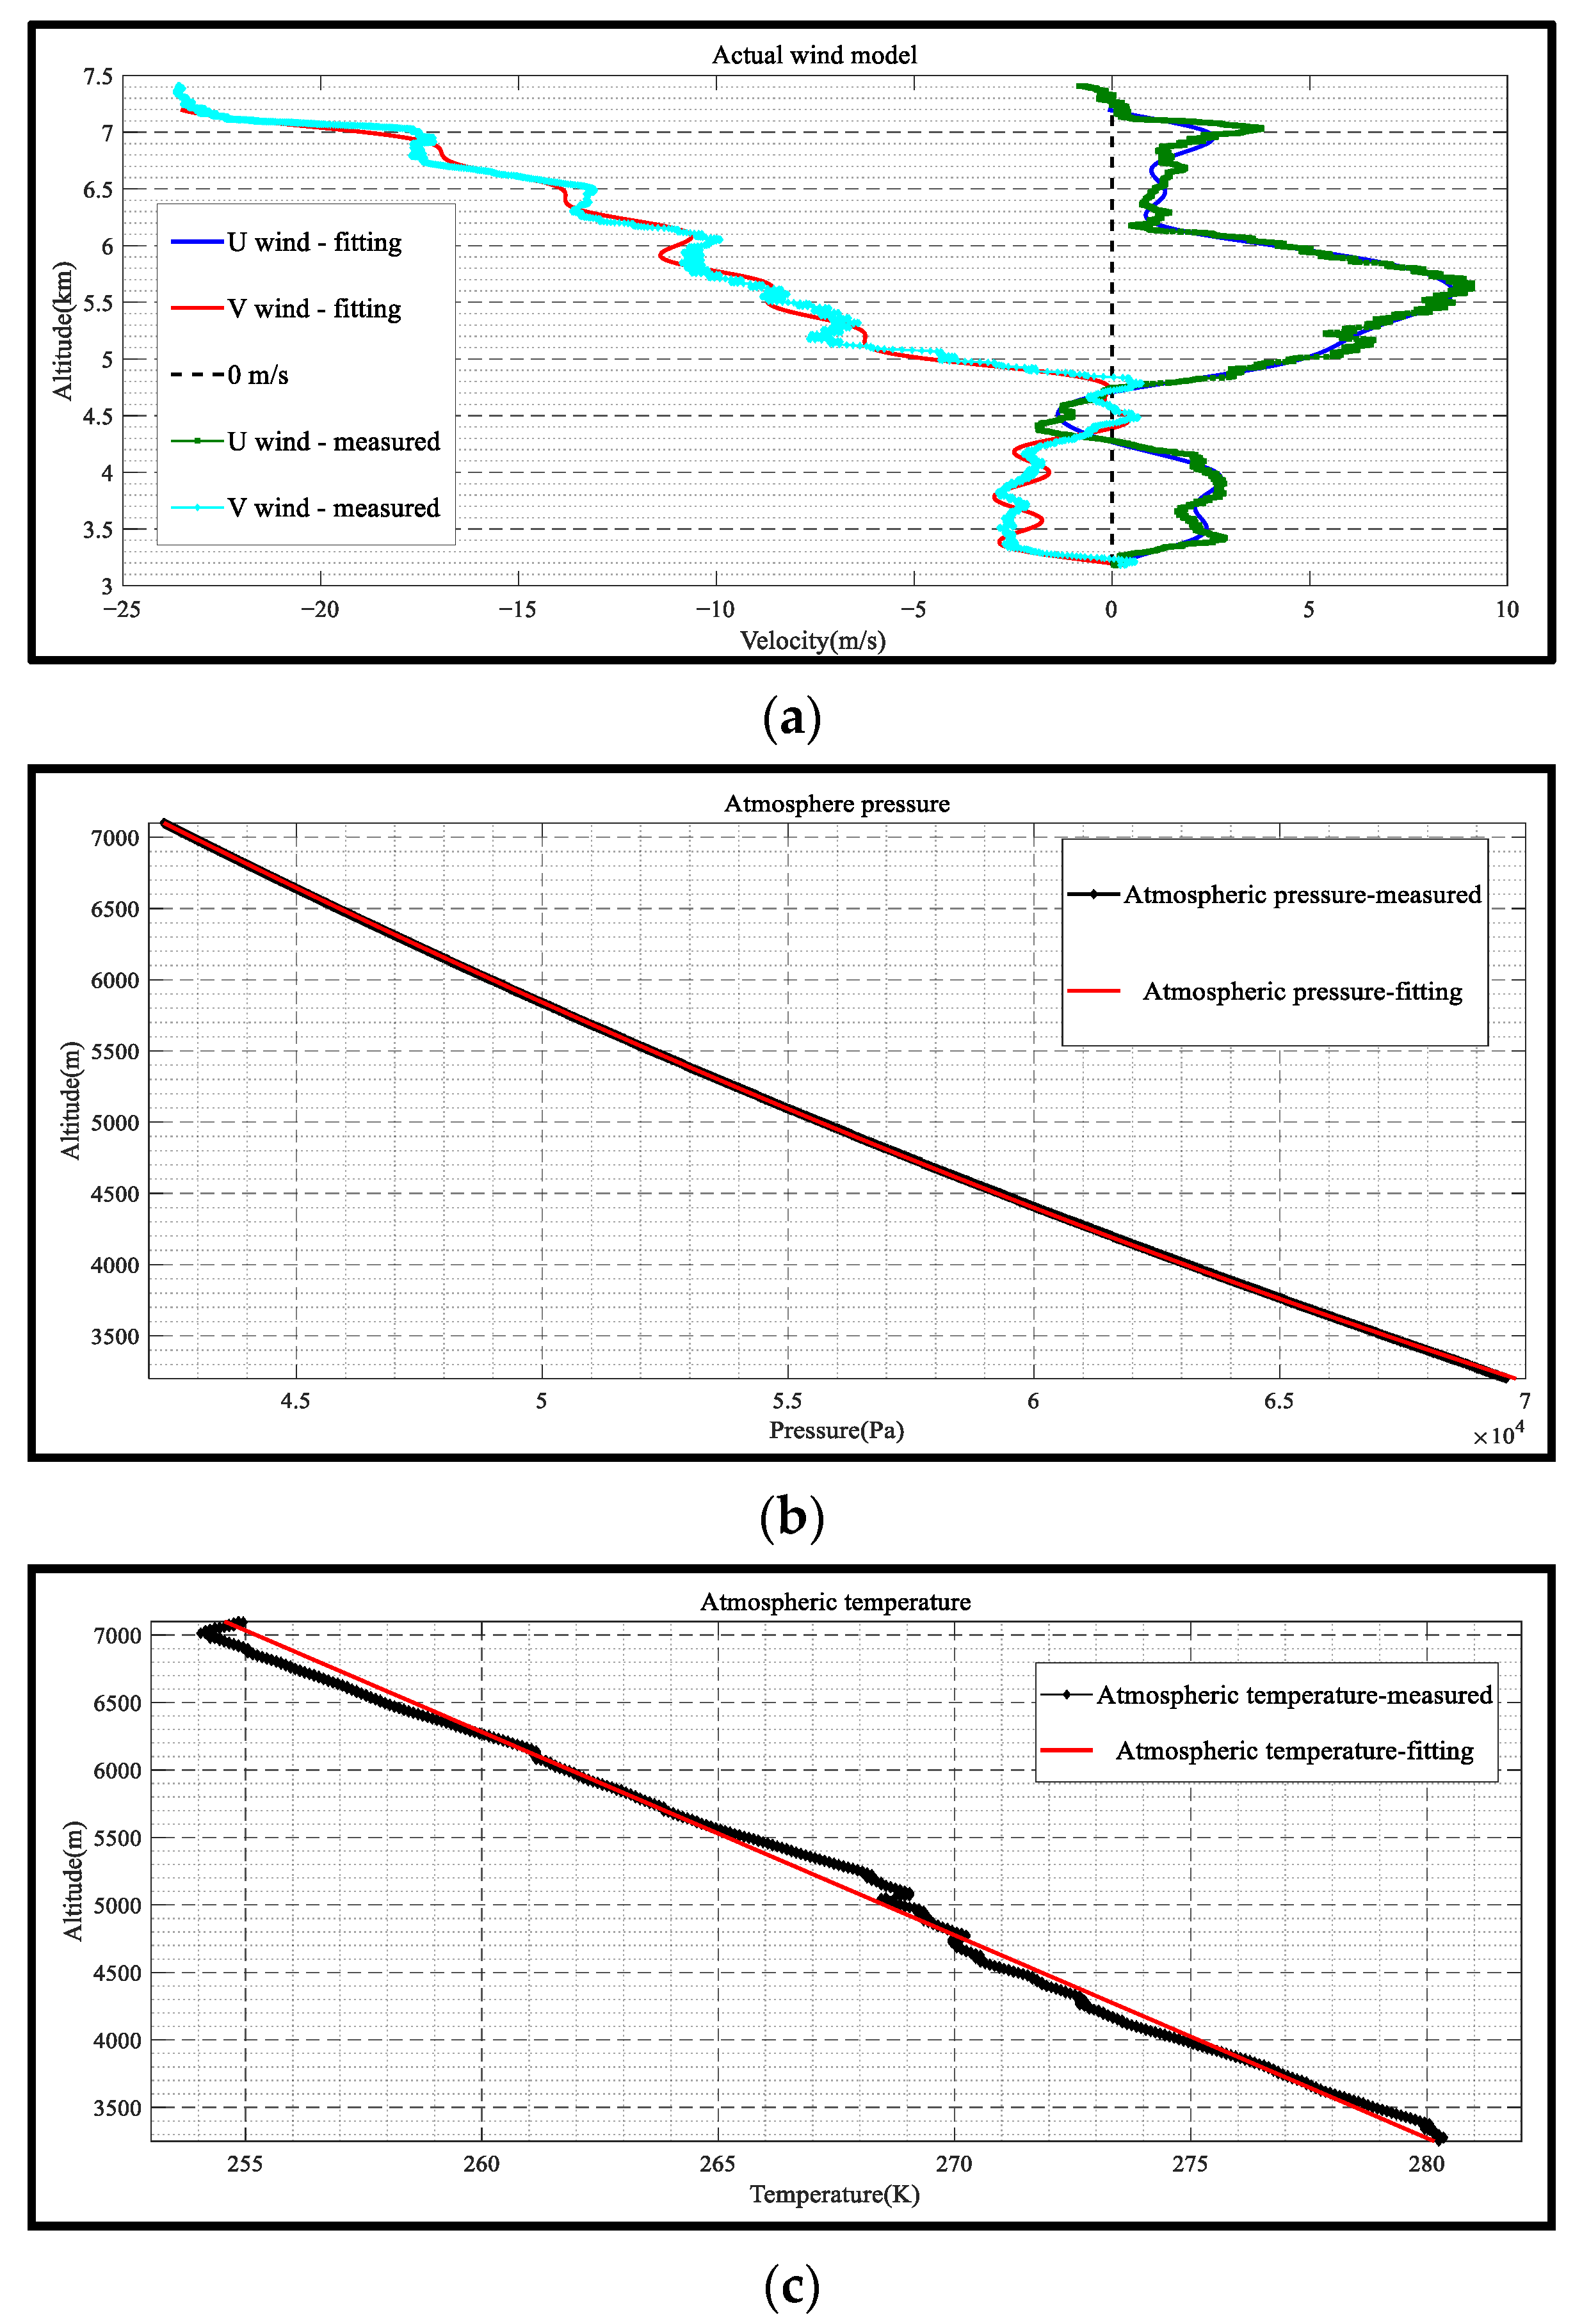
3.4. Wind Model
3.5. Analysis of Simulation
3.5.1. Dynamic Simulation
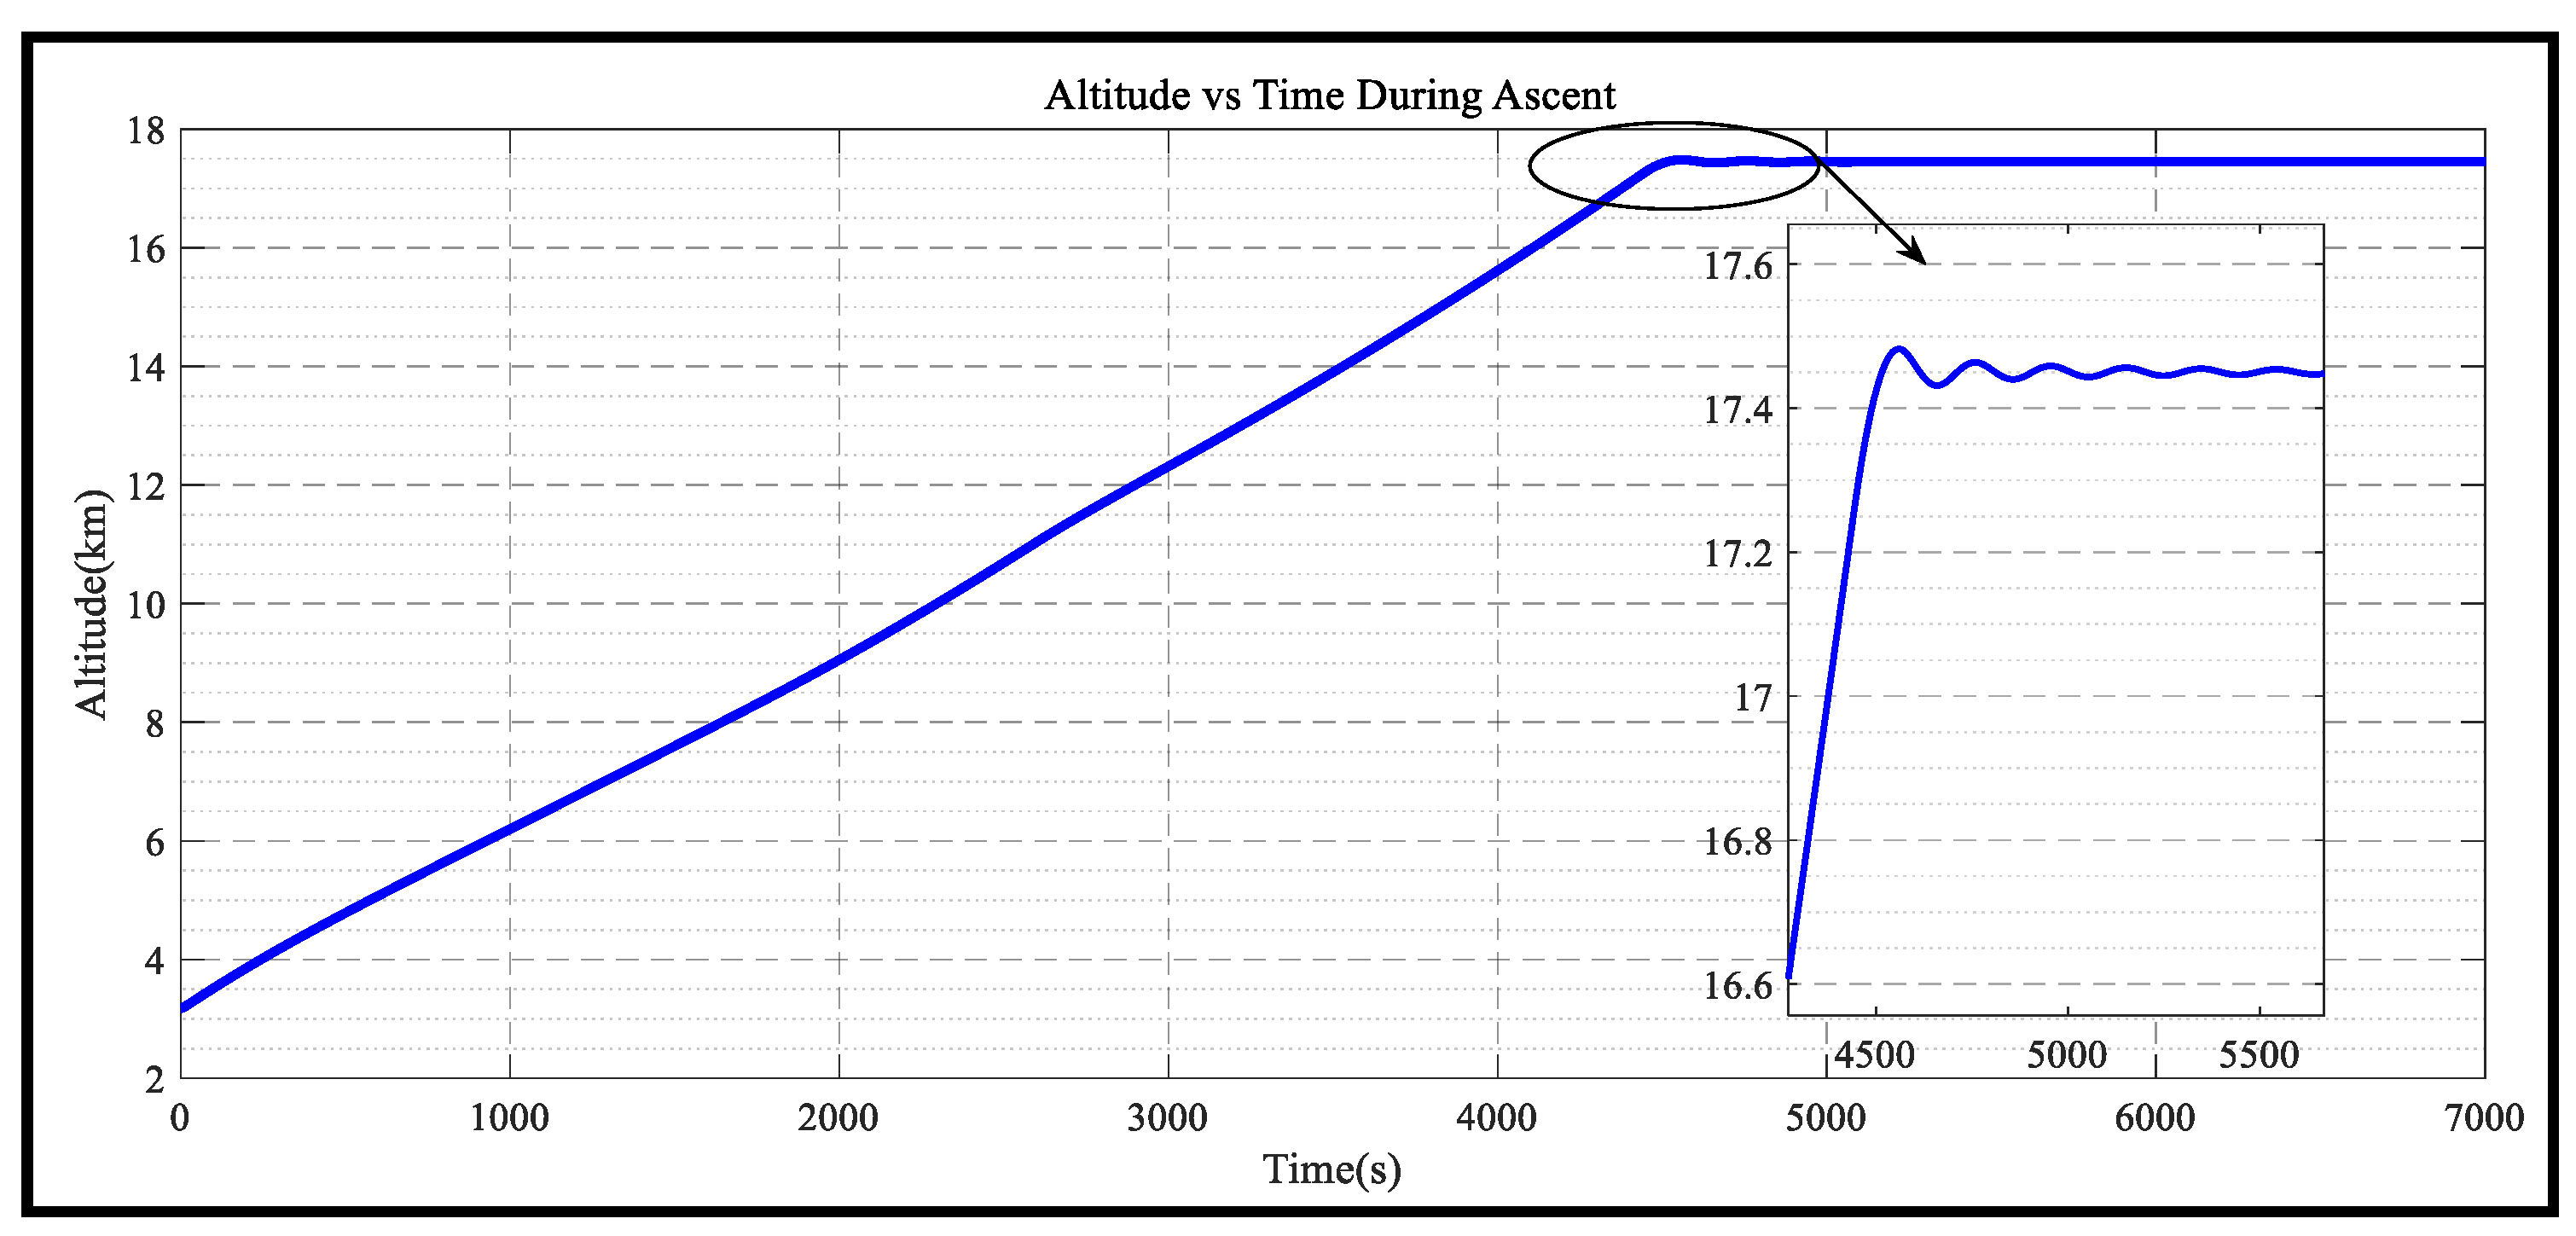
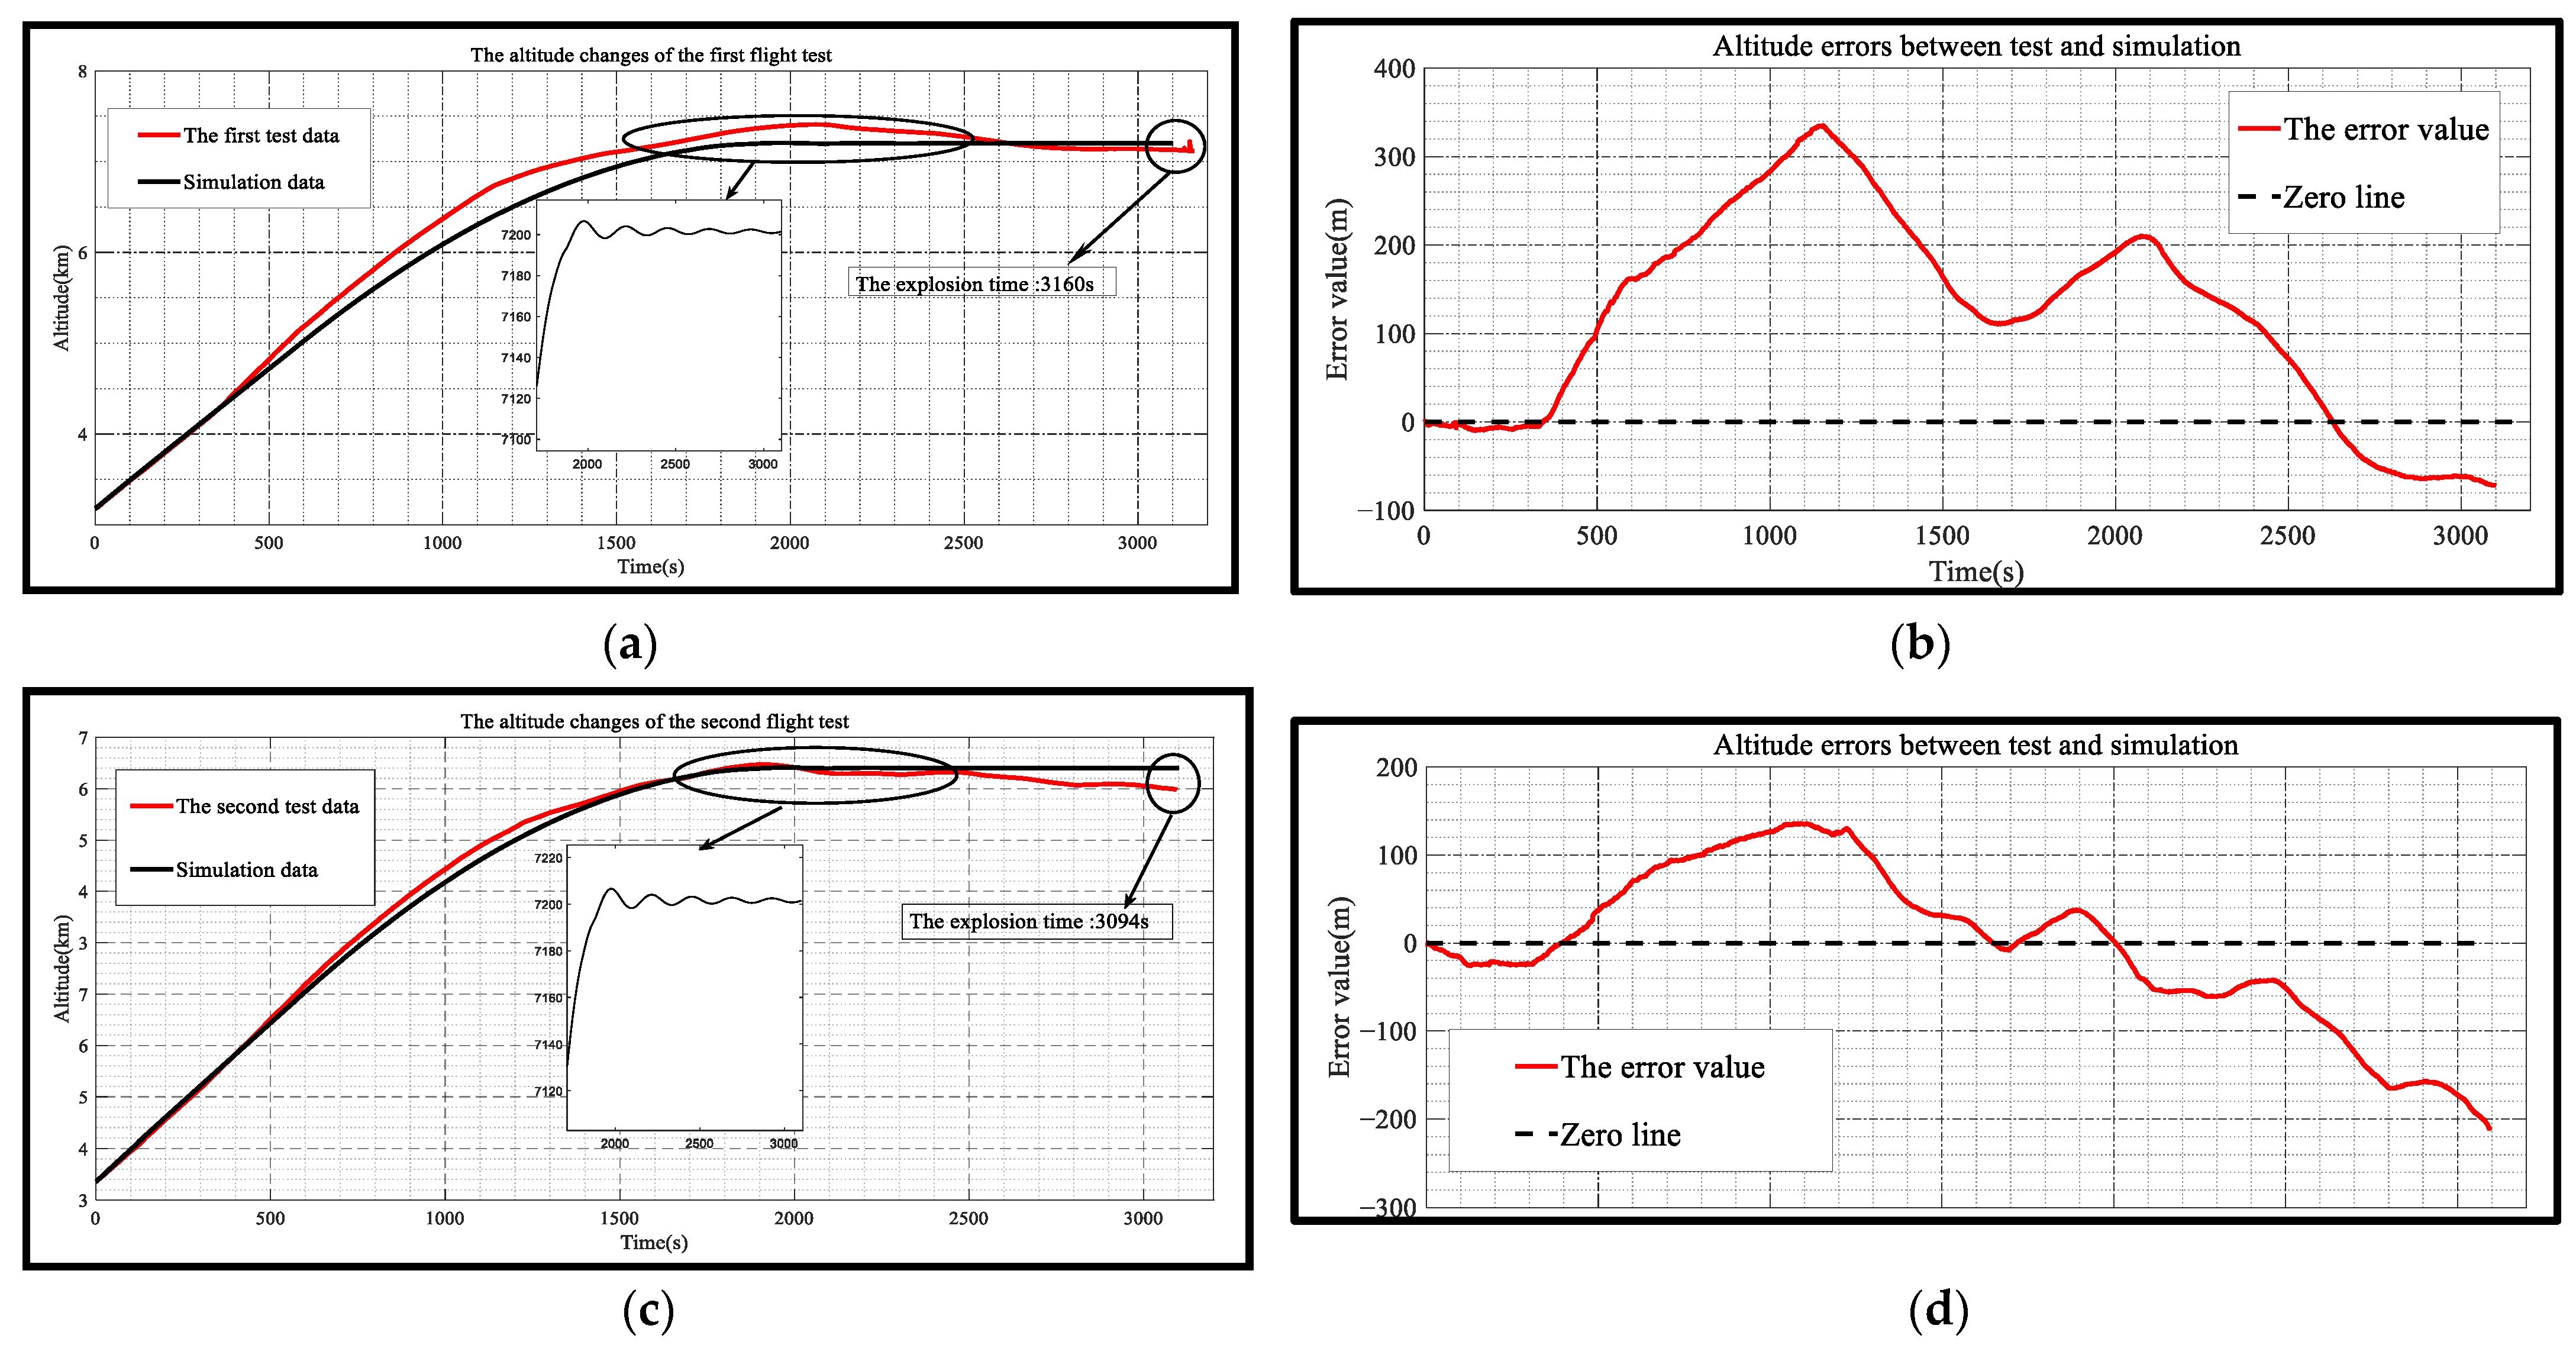
- (1) Altitude simulation results
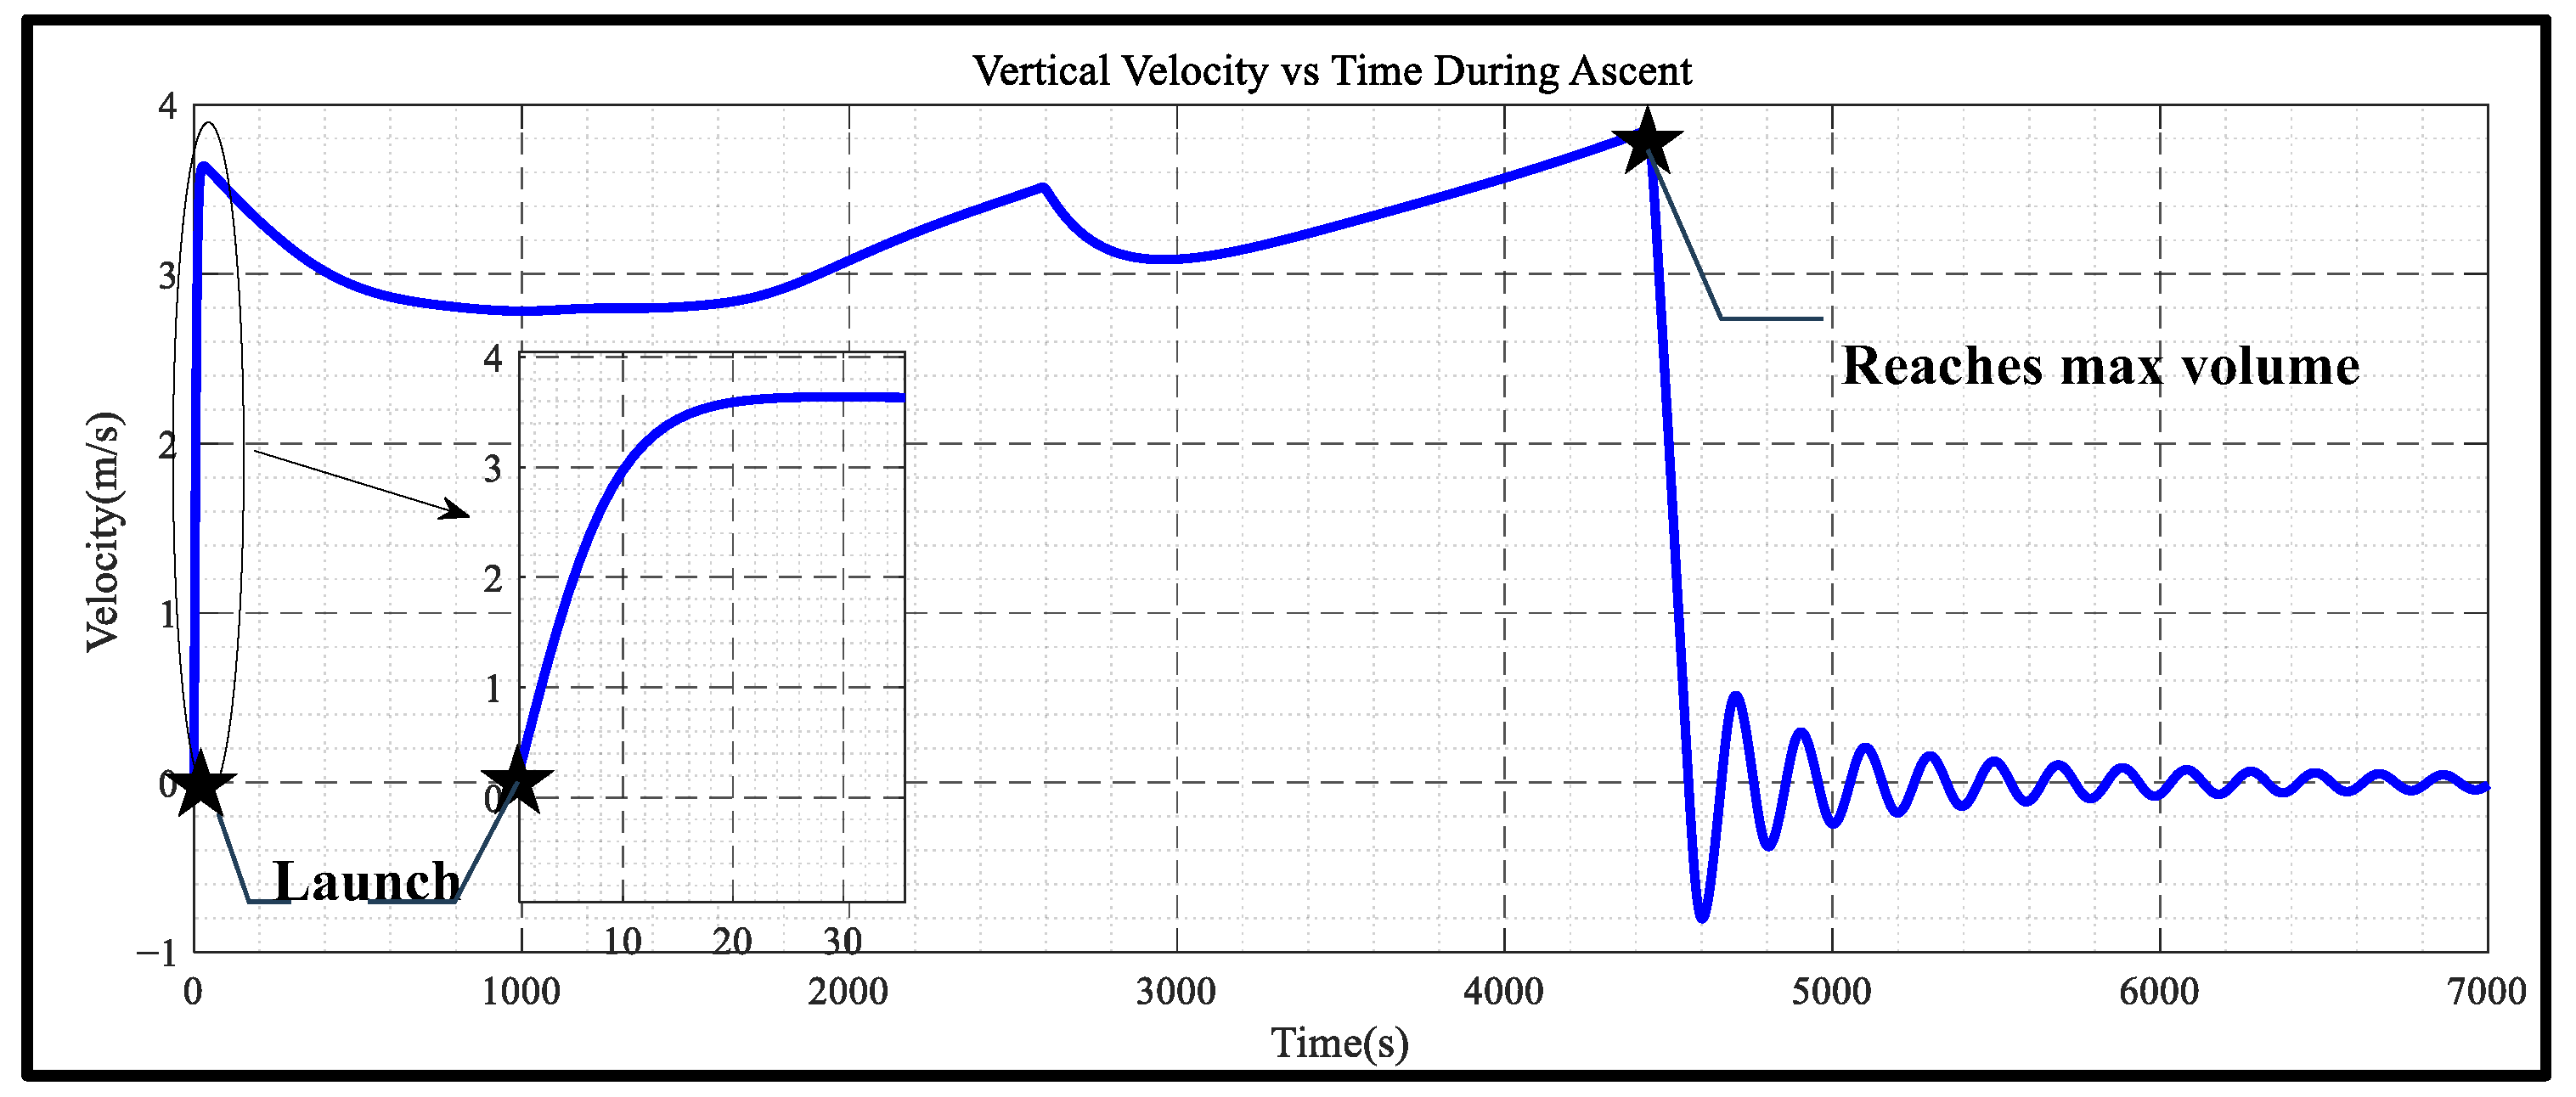
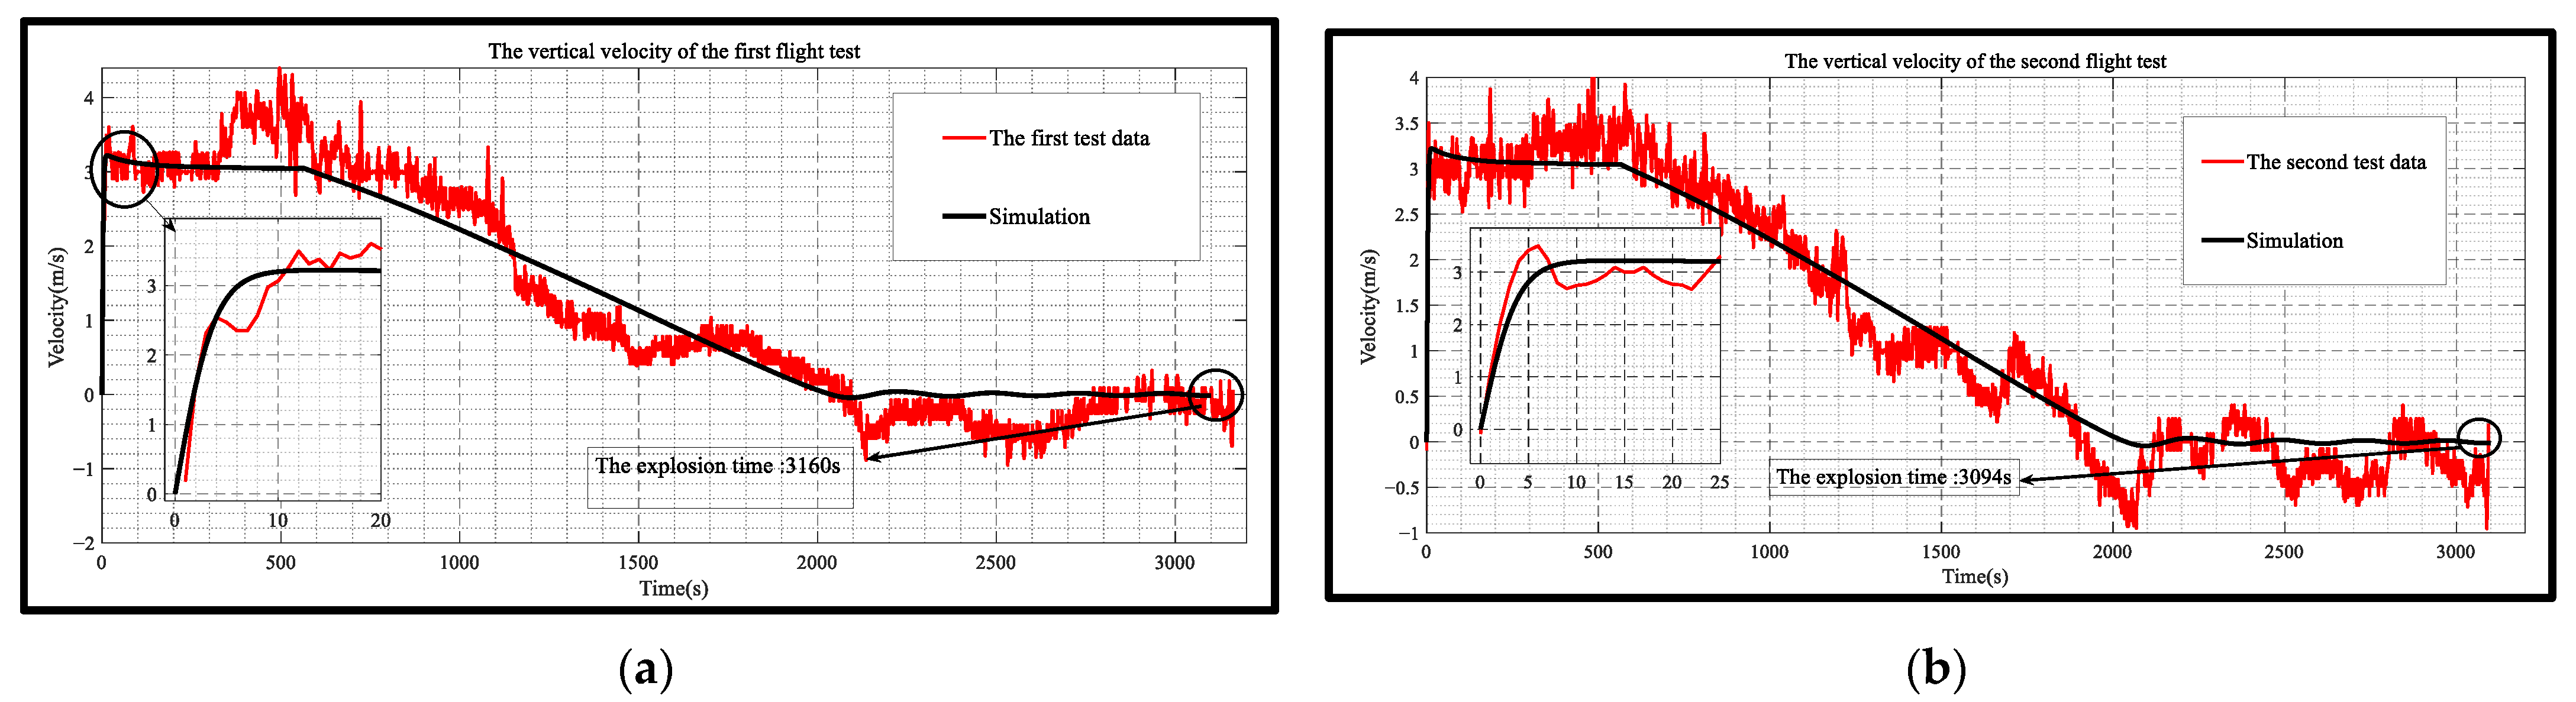
- (2) Vertical velocity simulation results
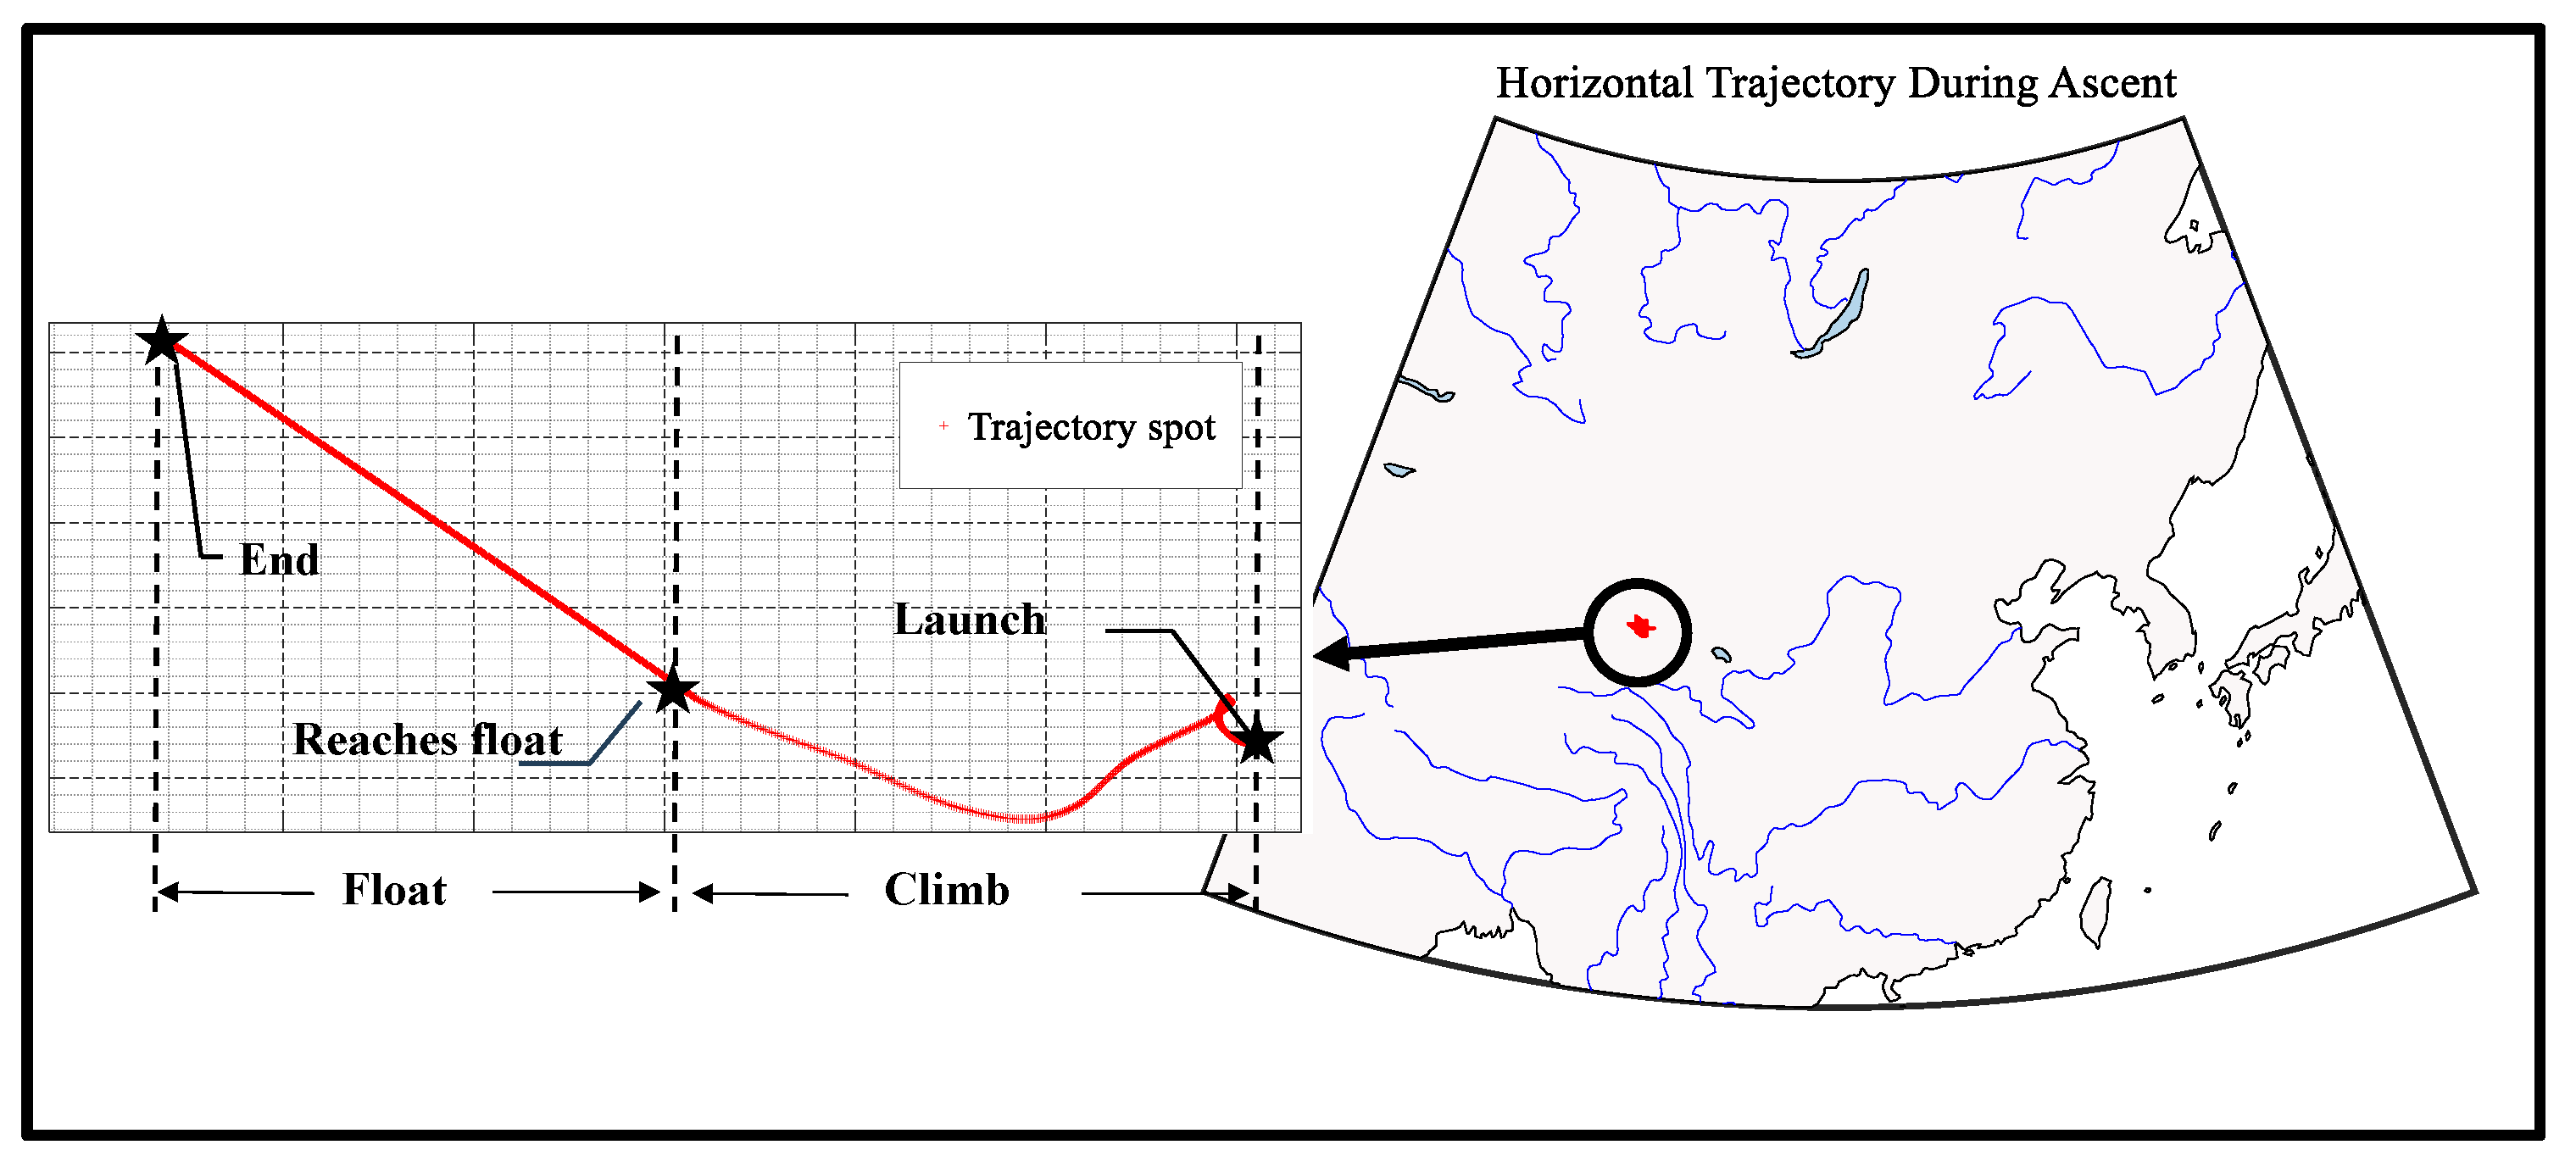
- (3) Trajectory prediction
3.5.2. Thermal Simulation
- (1) Temperature
- (2) Pressure
3.6. Target Height and Mixture Ratio Analysis
4. Flight Tests
4.1. System Composition
4.2. Balloon Parameters
4.3. Wind Field Environment
4.4. Flight Test
- (1) Altitude
- (2) Vertical velocity
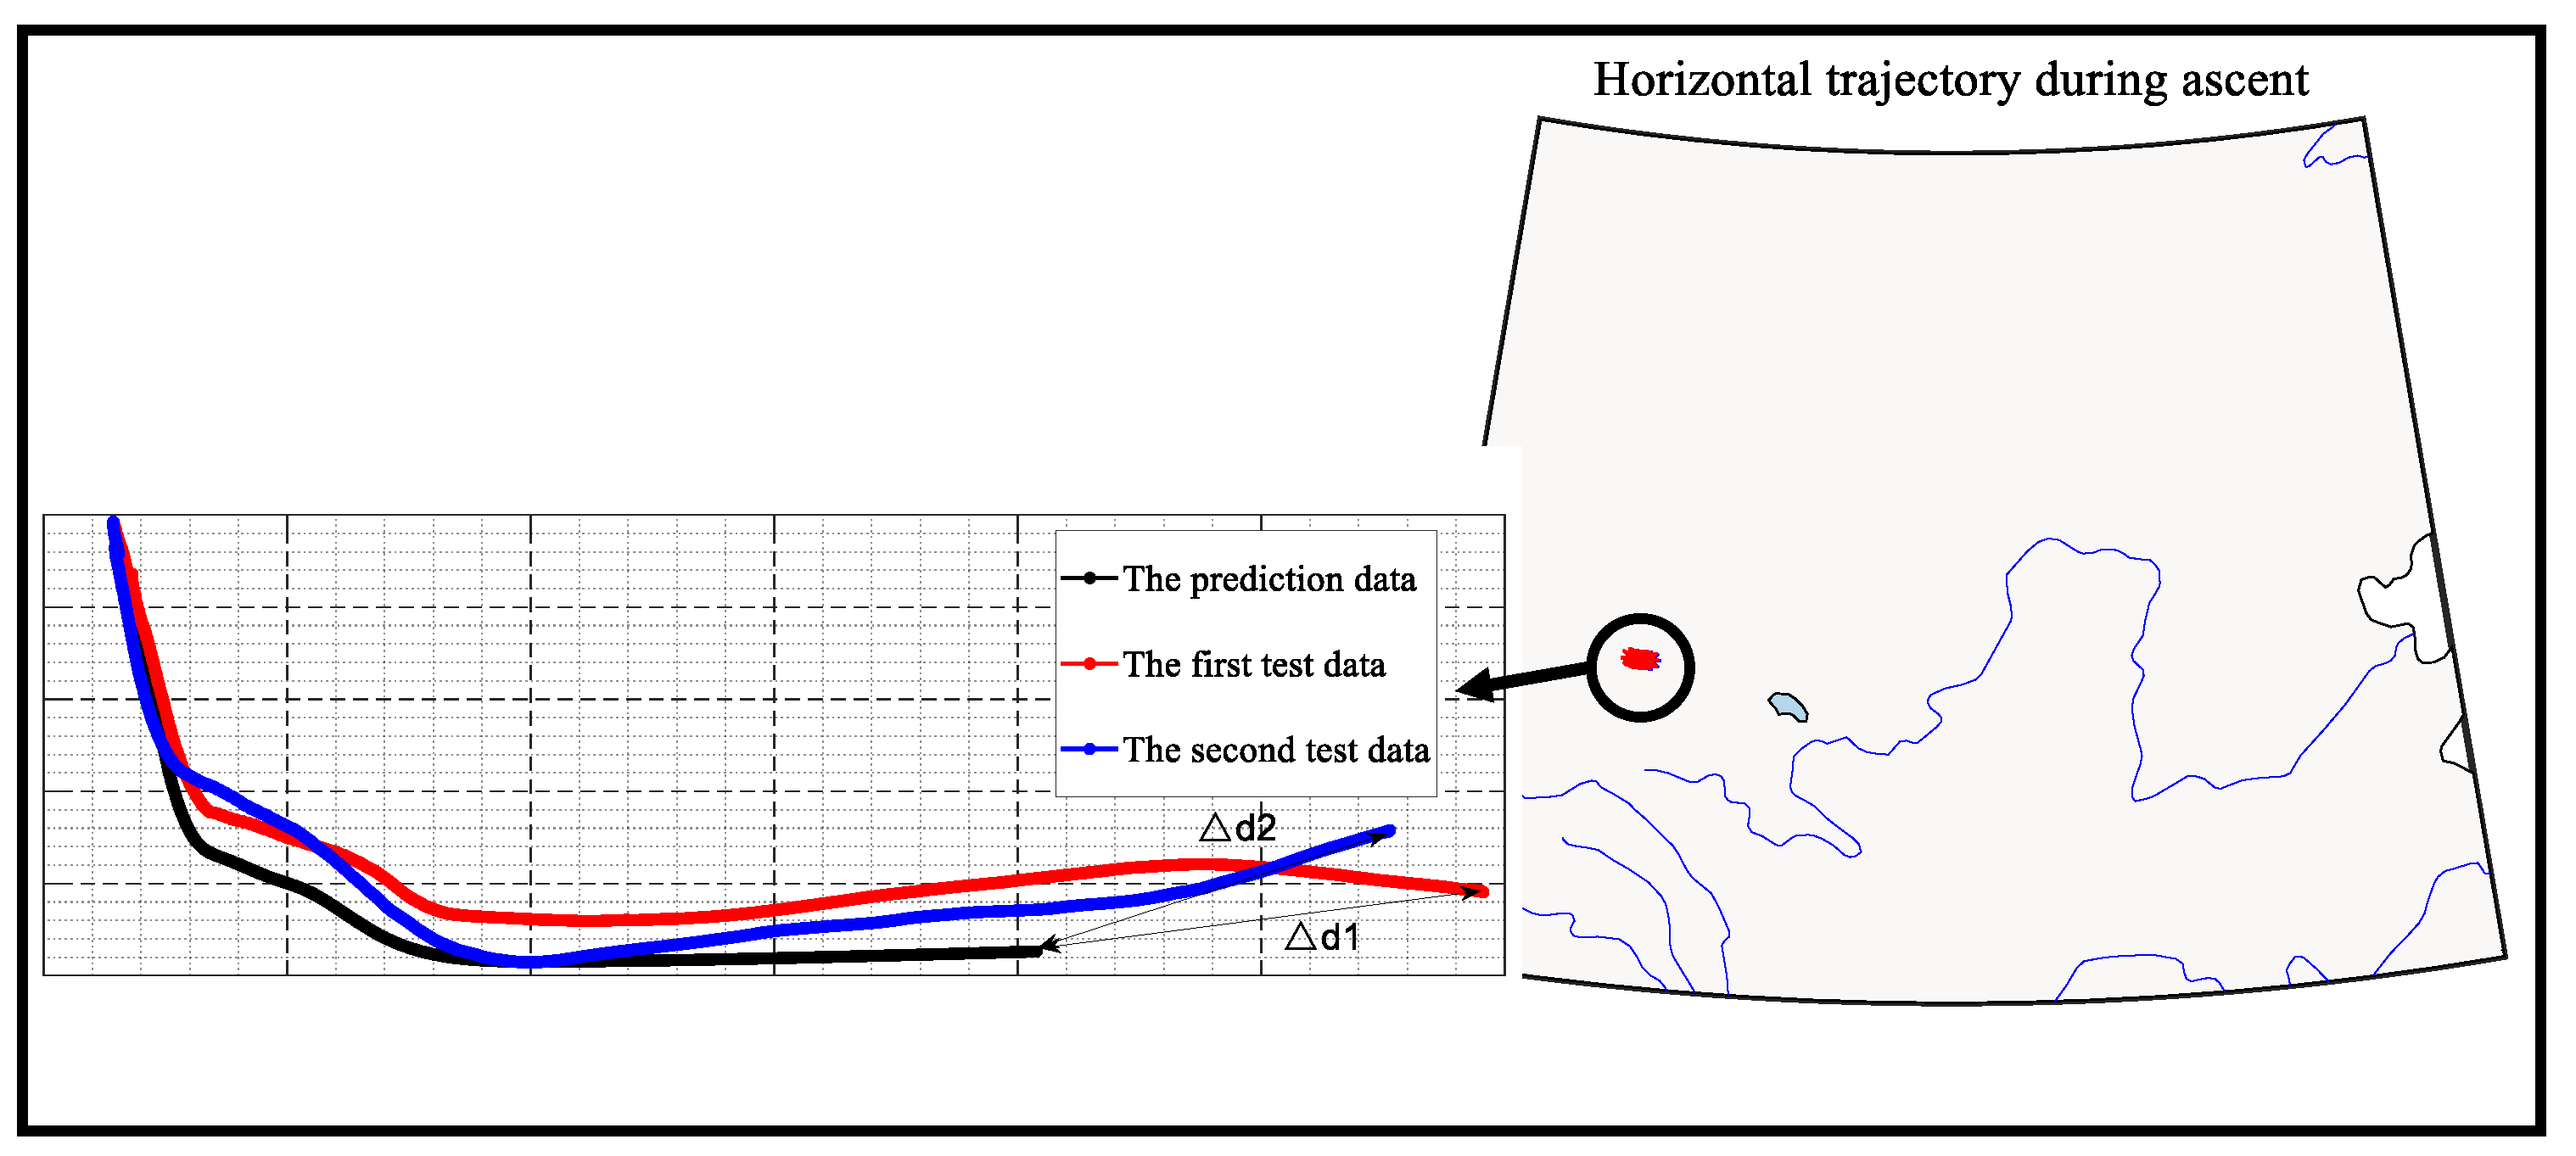
- (3) Trajectory
5. Conclusions
- (1)
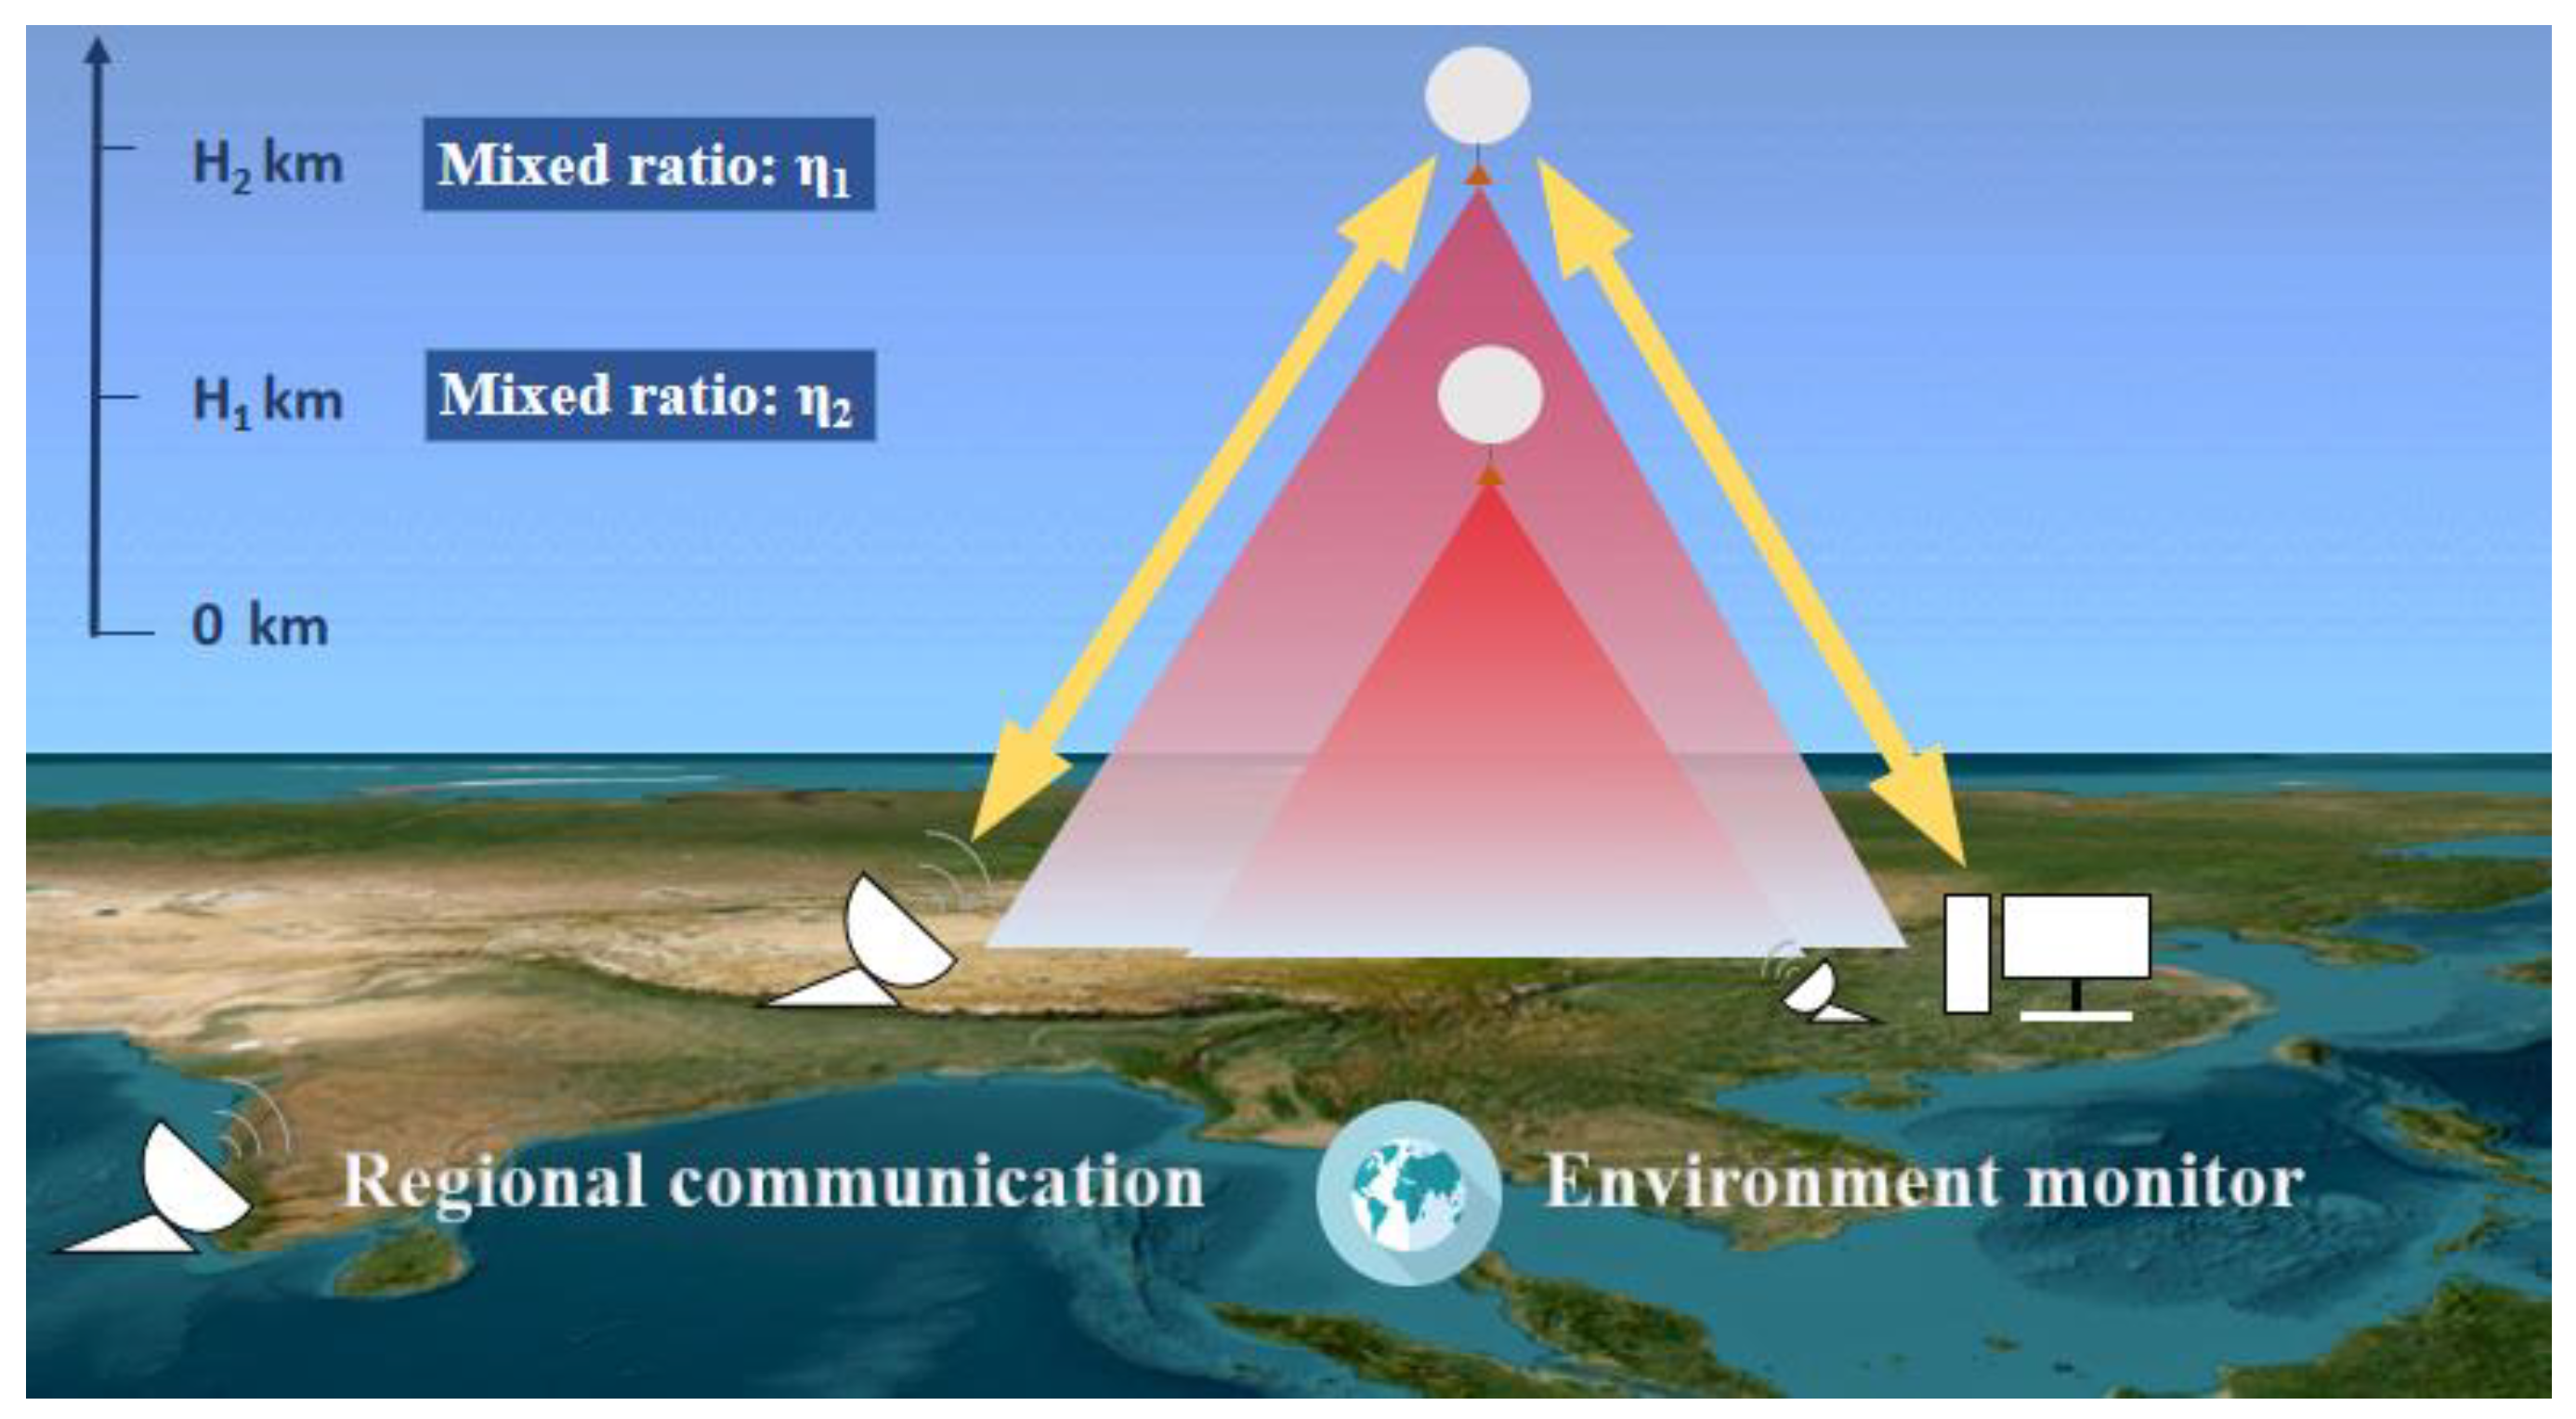
- This paper provides a gas-mixing method for designated ceiling height technology of scientific balloons. The new method allows a single balloon system to be used for tests at multiple heights, which reduces the engineering cost. In addition, the mixing method can be extended to other types of aerostats.
- (2)
- The theoretical model of mixed-gas balloons is established, including the inflation model and the thermal-dynamic coupled model, which bridges the research gap of mixed-gas balloons.
- (3)
- We propose an accurate simulation method. Furthermore, the simulation was consistent with the flight tests in terms of speed, altitude, and trajectory. Additionally, the altitude error remained below 350 m, and the horizontal distance error at the endpoint was less than 2.5 km. These errors are allowed in balloon engineering to verify the accuracy of the simulation method.
Author Contributions
Funding
Data Availability Statement
Acknowledgments
Conflicts of Interest
Nomenclature
| Albedo factor | The heat emission of the buoyant gas (W) | ||
| Effective surface area (m2) | The thermal interchange of the film (W) | ||
| Top projection area (m2) | Solar radiation on the balloon gas (W) | ||
| The cross-sectional area of the exhaust valve (m2) | The direct solar radiation (W) | ||
| Mass specific heat of the ingredients (J/(kg·K)) | The reflected solar radiation (W) | ||
| Volume specific heat of the ingredients (J/(kg·K)) | The effective balloon film reflectivity | ||
| Specific heat of the balloon gas (J/(kg·K)) | Component of the volume | ||
| Specific heat of the film (J/(kg·K)) | Specific heat constant | ||
| Exhaust parameter | Specific heat constant of air | ||
| Drag coefficient | Specific heat constant of gas | ||
| Additional mass coefficient | Vertical projection area (m2) | ||
| Cloud factor | Environment temperature (K) | ||
| Drag force (N) | Air temperature (K) | ||
| Balloon diameter (N) | Equivalent temperature of blackbody radiation (K) | ||
| Buoyancy (N) | Film temperature (K) | ||
| Acceleration of gravity | Balloon gas temperature (K) | ||
| Component of the mass | Velocity (m/s) | ||
| Binding coefficient | Relative velocity (m/s) | ||
| Effective external convection coefficient | Wind velocity (m/s) | ||
| Effective internal convection coefficient | Air volume (m3) | ||
| Heat transfer coefficient of external forced convection | Design volume of the balloon (m3) | ||
| Heat transfer coefficient of external free convection | Buoyant gas volume (m3) | ||
| Hour angle | Molecular fraction | ||
| Total solar intensity (W/m2) | The balloon film absorption factor for the sun radiation | ||
| Resultant solar intensity (W/m2) | Absorptivity of the IR radiation | ||
| Heat transfer coefficient | Atmospheric transmittance | ||
| Equivalent mass (kg) | Transmissivity of the IR radiation | ||
| Air mass (kg) | The sun elevation angle | ||
| Balloon mass (kg) | Effective solar absorption factor of the balloon gas | ||
| Balloon gas mass (kg) | The declination angle | ||
| Balloon structure mass (kg) | Exhaust trigger pressure difference (Pa) | ||
| Buoyant gas mass (kg) | Correction coefficient | ||
| Payload mass (kg) | Effective emissivity factor | ||
| System mass (kg) | Effective gas emissivity factor | ||
| Added mass (kg) | Interchange effective emissivity factor | ||
| Environment pressure (Pa) | Mixed mass ratio of air and buoyant gas | ||
| Diffuse planetary infrared flux (W/m2) | Density (kg/m3) | ||
| Direct solar flux (W/m2) | Stefan–Boltzmann Number (5.67 × 10⁻⁸ W/(m−2·K−4)) | ||
| External convection (W) | The balloon film transmission factor for the sun radiation | ||
| Internal convection (W) | Transmissivity of the IR radiation | ||
| The effective IR radiation absorbance of the balloon film (W) | Balloon surface area diffuse-radiant view factor | ||
| The effective IR radiation absorbance of the balloon gas (W) | Interaction coefficient | ||
| Balloon film emits heat radiation (W) | The location altitude |
References
- Zhang, Y.; Liu, D. Influences of Initial Launch Conditions on Flight Performance of High Altitude Balloon Ascending Process. Adv. Space Res. 2015, 56, 605–618. [Google Scholar] [CrossRef]
- Santos, J.S.; Garcia, D.; Cunha, M.L.; Góes, L.C.; Pant, R.S. Design and Flight Testing of an Autonomous Airship. In Proceedings of the 22nd AIAA Lighter-Than-Air Systems Technology Conference, Dallas, TX, USA, 22 June 2015; American Institute of Aeronautics and Astronautics: Reston, VA, USA, 2015. [Google Scholar]
- Smith, I.S. HiSentinel & Stratospheric Airship Design Sensitivity. KISS Workshop. 2013. Available online: https://kiss.caltech.edu/workshops/airships/presentations/smith.pdf (accessed on 19 April 2024).
- Rostami, M.; Kamoonpuri, J.; Pradhan, P.; Chung, J. Development and Evaluation of an Enhanced Virtual Reality Flight Simulation Tool for Airships. Aerospace 2023, 10, 457. [Google Scholar] [CrossRef]
- Ma, Y.; Huang, J.; Yi, M. A Novel Technique for Predicting the Thermal Behavior of Stratospheric Balloon. Int. J. Aerosp. Eng. 2018, 2018, 7806036. [Google Scholar] [CrossRef]
- Angell, J.K.; Hoecker, W.H.; Dickson, C.R. Comparison of the Vertical Motions of Paired Tetroon Flights. J. Appl. Meteorol. Climatol. 1977, 16, 774–779. [Google Scholar] [CrossRef]
- Gilchrist, A. 1st Garp Global Experiment. Meteorol. Mag. 1979, 108, 129–134. [Google Scholar]
- Durre, I.; Vose, R.S.; Wuertz, D.B. Overview of the Integrated Global Radiosonde Archive. J. Clim. 2006, 19, 53–68. [Google Scholar] [CrossRef]
- Durre, I.; Yin, X.; Vose, R.S.; Applequist, S.; Arnfield, J. Enhancing the Data Coverage in the Integrated Global Radiosonde Archive. J. Atmos. Ocean. Technol. 2018, 35, 1753–1770. [Google Scholar] [CrossRef]
- Anand, D.; Kumar, B.S.; Ojha, D. TIFR Zero-Pressure Balloon Programme Crosses a Milestone. Curr. Sci. 2021, 120, 1672. [Google Scholar] [CrossRef]
- Corcos, M.; Hertzog, A.; Plougonven, R.; Podglajen, A. Observation of Gravity Waves at the Tropical Tropopause Using Superpressure Balloons. JGR Atmos. 2021, 126, e2021JD035165. [Google Scholar] [CrossRef]
- Jones, W.V. Scientific Ballooning: Past, Present and Future. AIP Conf. Proc. 2013, 1516, 229–233. [Google Scholar]
- Gonzalo, J.; López, D.; Domínguez, D.; García, A.; Escapa, A. On the Capabilities and Limitations of High Altitude Pseudo-Satellites. Prog. Aerosp. Sci. 2018, 98, 37–56. [Google Scholar] [CrossRef]
- Dai, Q.; Fang, X.; Li, X.; Tian, L. Performance Simulation of High Altitude Scientific Balloons. Adv. Space Res. 2012, 49, 1045–1052. [Google Scholar] [CrossRef]
- Zhang, H.; Yang, Y.; Cai, R. Dynamics Simulation of Folding Wing UAVs Launched from a High-Altitude Balloon Platform. Proc. Inst. Mech. Eng. Part G J. Aerosp. Eng. 2023, 237, 3072–3091. [Google Scholar] [CrossRef]
- Wang, X.; Zeng, G.; Yan, X.; Chen, W.; Li, K.; Yang, Y. A Feasibility Verification Scheme with Flight Analysis for Balloon-Borne Launched Unmanned Aerial Vehicles. In Proceedings of the 2020 3rd International Conference on Unmanned Systems (ICUS), Harbin, China, 27 November 2020; IEEE: Piscataway, NJ, USA, 2020; pp. 966–971. [Google Scholar]
- Schuler, T.K.; Bowman, D.C.; Izraelevitz, J.S.; Sofge, D.; Thangavelautham, J. Long Duration Flights in Venus’ Atmosphere Using Passive Solar Hot Air Balloons. Acta Astronaut. 2022, 191, 160–168. [Google Scholar] [CrossRef]
- Cutts, J.; Aslam, S.; Atreya, S.; Baines, K.; Beauchamp, P.; Bellan, J.; Bowman, D.C.; Bugga, K.; Bullock, M.; Byrne, P.K.; et al. Scientific Exploration of Venus with Aerial Platforms. Bull. AAS 2021, 53, 1–8. [Google Scholar] [CrossRef]
- Rossi, F.; Saboia, M.; Krishnamoorthy, S.; Hook, J.V. Proximal Exploration of Venus Volcanism with Teams of Autonomous Buoyancy-Controlled Balloons. Acta Astronaut. 2023, 208, 389–406. [Google Scholar] [CrossRef]
- Garg, K.; Kuhn, T. Balloon Design for Mars, Venus, and Titan Atmospheres. Appl. Sci. 2020, 10, 3204. [Google Scholar] [CrossRef]
- Wei, J.; Ma, R.; Hou, X.; Zhen, D.; Tan, H. Analysis of the Thermodynamical Property of Super-Pressure Balloons. Acta Mech. 2019, 230, 1355–1366. [Google Scholar] [CrossRef]
- Saito, Y.; Akita, D.; Fuke, H.; Izutsu, N. Properties of Tandem Balloons Connected by Extendable Suspension Wires. Adv. Space Res. 2010, 45, 482–489. [Google Scholar] [CrossRef]
- Saleh, S.; He, W. New Design Simulation for a High-Altitude Dual-Balloon System to Extend Lifetime and Improve Floating Performance. Chin. J. Aeronaut. 2018, 31, 1109–1118. [Google Scholar] [CrossRef]
- Cathey, H.M.; Tuttle, J.W.; Fairbrother, D.A.; Said, M.A. Qualification of the NASA Super Pressure Balloon. In Proceedings of the AIAA Balloon Systems Conference, Dallas, TX, USA, 22 June 2015; American Institute of Aeronautics and Astronautics: Reston, VA, USA, 2015. [Google Scholar]
- Cathey, H.M. The NAS+A Super Pressure Balloon—A Path to Flight. Adv. Space Res. 2009, 44, 23–38. [Google Scholar] [CrossRef]
- Dubourg, V.; Louvel, S.; Venel, S.; Vacher, F.; Thoumieux, F.; Deschamps, A. An Update of the CNES Stratospheric Balloon Activities. In Proceedings of the Aerospace Europe Conference 2023—10th EUCASS—9th CEAS, Lausanne, Switzerland, 9 July 2023. [Google Scholar] [CrossRef]
- McKinney, T.; Perlaky, N.; Crawford, A.; Brown, B.; Newchurch, M.J. Methodology, Deployment, and Performance of Pico Balloons in Antarctica. J. Atmos. Ocean. Technol. 2023, 40, 1277–1290. [Google Scholar] [CrossRef]
- McKinney, T.; Perlaky, N.; Danielson, E.; Mohammed, A.; Lee, J.; O’Bryan, B.; Stoll, C.; Hochmuth, C.; Gallien, T.; Kerr, S.; et al. Around the World They Go: Circumnavigating Balloon Satellites! Bull. Am. Meteorol. Soc. 2023, 104, E192–E207. [Google Scholar] [CrossRef]
- McKinney, T.; Perlaky, N.; Newchurch, M.; Brown, B. Insights on Polar Day Antarctica Radio Propagation Using Amateur Radio Beacons on Circumnavigating Balloons. Atmosphere 2023, 14, 1118. [Google Scholar] [CrossRef]
- Wilke, C. Diffusional properties of multicomponent gases. Chem. Eng. Prog. 1950, 46, 95–104. [Google Scholar]
- Tong, J. Viscosity and thermal conductivity of gas mixtures and liquid mixtures. Chem. Eng. 1977, 6, 66–84. [Google Scholar]
- Woo, K.W.; Yeo, S.I. Dalton’s Law vs., Amagat’s Law for the Mixture of Real Gases. SNU J. Educ. Res. 1995, 5, 127–134. [Google Scholar]
- Farley, R. Balloon Ascent: 3-D Simulation Tool for the Ascent and Float of High-Altitude Balloons. In Proceedings of the AIAA 5th ATIO and16th Lighter-Than-Air Sys Tech. and Balloon Systems Conferences, Arlington, VA, USA, 26 September 2005; American Institute of Aeronautics and Astronautics: Reston, VA, USA, 2015. [Google Scholar]
- Saleh, S.; He, W. Ascending Performance Analysis for High Altitude Zero Pressure Balloon. Adv. Space Res. 2017, 59, 2158–2172. [Google Scholar] [CrossRef]
- Du, H.; Li, J.; Zhu, W.; Qu, Z.; Zhang, L.; Lv, M. Flight Performance Simulation and Station-Keeping Endurance Analysis for Stratospheric Super-Pressure Balloon in Real Wind Field. Aerosp. Sci. Technol. 2019, 86, 1–10. [Google Scholar] [CrossRef]
- Jiang, Y.; Lv, M.; Li, J. Station-Keeping Control Design of Double Balloon System Based on Horizontal Region Constraints. Aerosp. Sci. Technol. 2020, 100, 105792. [Google Scholar] [CrossRef]
- Du, H.; Lv, M.; Zhang, L.; Zhu, W.; Wu, Y.; Li, J. Energy Management Strategy Design and Station-Keeping Strategy Optimization for High Altitude Balloon with Altitude Control System. Aerosp. Sci. Technol. 2019, 93, 105342. [Google Scholar] [CrossRef]
- Liu, Y.; Xu, Z.; Du, H.; Lv, M. Increased Utilization of Real Wind Fields to Improve Station-Keeping Performance of Stratospheric Balloon. Aerosp. Sci. Technol. 2022, 122, 107399. [Google Scholar] [CrossRef]
- Liao, J.; Yang, Z.; Li, J.; Luo, S. Shape and Envelope Tension Prediction of Natural Shaped High Altitude Balloons. Aerosp. Sci. Technol. 2021, 117, 106963. [Google Scholar] [CrossRef]
- Jiang, Y.; Lv, M.; Chen, X.; Wu, Y. An Optimization Approach for Improving the Solar Array Output Power of Stratospheric Aerostat. Aerosp. Sci. Technol. 2021, 118, 106916. [Google Scholar] [CrossRef]
- Zhang, J.; Yang, X.; Deng, X.; Lin, H. Trajectory Control Method of Stratospheric Airships Based on Model Predictive Control in Wind Field. Proc. Inst. Mech. Eng. Part G J. Aerosp. Eng. 2019, 233, 418–425. [Google Scholar] [CrossRef]
- Carlson, L.A.; Horn, W.J. New Thermal and Trajectory Model for High-Altitude Balloons. J. Aircr. 1983, 20, 500–507. [Google Scholar] [CrossRef]
- Zhang, L.; Li, J.; Jiang, Y.; Du, H.; Zhu, W.; Lv, M. Stratospheric Airship Endurance Strategy Analysis Based on Energy Optimization. Aerosp. Sci. Technol. 2020, 100, 105794. [Google Scholar] [CrossRef]
- Li, X.; Fang, X.; Dai, Q. Research on Thermal Characteristics of Photovoltaic Array of Stratospheric Airship. J. Aircr. 2011, 48, 1380–1386. [Google Scholar] [CrossRef]
- Li, J.; Lv, M.; Sun, K.; Zhu, W. Thermal Insulation Performance of Lightweight Substrate for Solar Array on Stratospheric Airships. Appl. Therm. Eng. 2016, 107, 1158–1165. [Google Scholar] [CrossRef]
- Du, H.; Lv, M.; Li, J.; Zhu, W.; Zhang, L.; Wu, Y. Station-Keeping Performance Analysis for High Altitude Balloon with Altitude Control System. Aerosp. Sci. Technol. 2019, 92, 644–652. [Google Scholar] [CrossRef]
- Jiang, Y.; Lv, M.; Zhu, W.; Du, H.; Zhang, L.; Li, J. A Method of 3-D Region Controlling for Scientific Balloon Long-Endurance Flight in the Real Wind. Aerosp. Sci. Technol. 2020, 97, 105618. [Google Scholar] [CrossRef]
- Abe, T.; Imamura, T.; Izutsu, N.; Yajima, N. Scientific Ballooning; Springer: New York, NY, USA, 2009; ISBN 978-0-387-09725-1. [Google Scholar]
- Yang, X.; Zhang, W.; Hou, Z. Improved Thermal and Vertical Trajectory Model for Performance Prediction of Stratospheric Balloons. J. Aerosp. Eng. 2015, 28, 04014075. [Google Scholar] [CrossRef]
- Huafei, D.; YiFei, W.; Mingyun, L. Ascent Performance Analysis for High Altitude Super Pressure Balloon in Real Wind Field. In Proceedings of the 2019 IEEE 10th International Conference on Mechanical and Aerospace Engineering (ICMAE), Brussels, Belgium, 22–25 July 2019; IEEE: Piscataway, NJ, USA, 2019; pp. 102–107. [Google Scholar]


| Parameter | Value |
|---|---|
| Design volume (m3) | 524.0 |
| Design diameter (m) | 10.0 |
| The mass of the film (kg) | 28.28 |
| The mass of the payload (kg) | 10.00 |
| 0.027 | 0.890 | 0.470 | 0.470 |
| Parameter | Value |
|---|---|
| Target altitude (m) | 17,450.0 |
| The mass of the buoyant gas (kg) | 6.81 |
| The mass of the air (kg) | 23.84 |
| The mix ratio | 3.50 |
| Parameter | Value |
|---|---|
| Target altitude (m) | 7200 |
| Mixture | Air and Helium |
| The mass of the buoyant gas (kg) | 0.31 |
| The mass of the air (kg) | 1.51 |
| The mix ratio | 4.87 |
| The mass of the gondola (kg) | 0.60 |
| The mass of the film (kg) | 0.88 |
| The mass of the system (kg) | 3.30 |
| Design volume (m3) | 5.00 |
| The cross-sectional area of the exhaust (m2) | 0.0078 |
| Super Pressure value (Pa) | 20 |
| 0.025 | 0.89 | 0.53 | 0.42 |
Disclaimer/Publisher’s Note: The statements, opinions and data contained in all publications are solely those of the individual author(s) and contributor(s) and not of MDPI and/or the editor(s). MDPI and/or the editor(s) disclaim responsibility for any injury to people or property resulting from any ideas, methods, instructions or products referred to in the content. |
© 2024 by the authors. Licensee MDPI, Basel, Switzerland. This article is an open access article distributed under the terms and conditions of the Creative Commons Attribution (CC BY) license (https://creativecommons.org/licenses/by/4.0/).
Share and Cite
Cao, S.; Yang, Y.; Zhang, H.; Zhao, R.; Zhu, R.; Zhang, D.; Song, L. Ascending Performance of Scientific Balloons with Buoyant Gas–Air Mixture Inflation for Designated Ceiling Height. Aerospace 2024, 11, 340. https://doi.org/10.3390/aerospace11050340
Cao S, Yang Y, Zhang H, Zhao R, Zhu R, Zhang D, Song L. Ascending Performance of Scientific Balloons with Buoyant Gas–Air Mixture Inflation for Designated Ceiling Height. Aerospace. 2024; 11(5):340. https://doi.org/10.3390/aerospace11050340
Chicago/Turabian StyleCao, Shenghong, Yanchu Yang, Hangyue Zhang, Rong Zhao, Rongchen Zhu, Donghui Zhang, and Lin Song. 2024. "Ascending Performance of Scientific Balloons with Buoyant Gas–Air Mixture Inflation for Designated Ceiling Height" Aerospace 11, no. 5: 340. https://doi.org/10.3390/aerospace11050340