Numerical Simulation of Heat Transfer and Chemistry in the Wake behind a Hypersonic Slender Body at Angle of Attack


1
High Performance Computing Research Center, Department of Aeronautics, USAF Academy, El Paso County, CO 80840, USA
2
Department of Aeronautics, USAF Academy, El Paso County, CO 80840, USA
3
Air Force Institute of Technology, AFIT 2950 Hobson Way, WPAFB, Greene County, OH 45433, USA
*
Author to whom correspondence should be addressed.
Aerospace 2018, 5(1), 30; https://doi.org/10.3390/aerospace5010030
Submission received: 13 December 2017
/
Revised: 22 February 2018
/
Accepted: 24 February 2018
/
Published: 11 March 2018
(This article belongs to the Special Issue Computational Aerodynamic Modeling of Aerospace Vehicles)
Abstract
:The effect of thermal and chemical boundary conditions on the structure and chemical composition of the wake behind a 3D Mach 7 sphere-cone at an angle of attack of 5 degrees and an altitude of roughly 30,000 m is explored. A special emphasis is placed on determining the number density of chemical species which might lead to detection via the electromagnetic spectrum. The use of non-ablating cold-wall, adiabatic, and radiative equilibrium wall boundary conditions are used to simulate extremes in potential thermal protection system designs. Non-ablating, as well as an ablating boundary condition using the “steady-state ablation” assumption to compute a surface energy balance on the wall are used in order to determine the impacts of ablation on wake composition. On-body thermal boundary conditions downstream of an ablating nose are found to significantly affect wake temperature and composition, while the role of catalysis is found to change the composition only marginally except at very high temperatures on the cone’s surface for the flow regime considered. Ablation is found to drive the extensive production of detectable species otherwise unrelated to ablation, whereas if ablation is not present at all, air-species which would otherwise produce detectable spectra are minimal. Studies of afterbody cooling techniques, as well as shape, are recommended for further analysis.
1. Introduction
1.1. Introduction and Theory
As hypersonic vehicles grow in number and capability, a keen interest is growing in the observability and detection of these vehicles by states seeking to defend against threats made possible by rapid advances in hypersonic technology. Gradual evolutions in the maneuverability of reentry vehicles and the development of scramjet powered vehicles are now yielding unprecedented range and speed of strike for hypersonic weapons while potentially enabling evasion of detection [1]. Figure 1 shows the trajectory of a traditional ballistic missile and also that of a suppressed “boost-glide” trajectory, wherein the flight vehicle separates from its boost stage and burns back towards the earth before turning into a glide at significantly lower altitude than a traditional original ballistic trajectory. This study will focus on a single point within the glide trajectory.
Owing to their unconventional trajectory, hypersonic weapons may decrease the odds of detection, and so methods of detection are of increasing interest to nations hoping to defend against such threats. Since many forms of detection rely upon active and passive use of the electromagnetic spectrum, the emissions of hypersonic vehicles from across the EM spectrum are of interest. Analysis of the emissions from a given system across the entire spectrum being quite a far reaching task, this paper will focus on assessment of the thermal and chemical environment, which can then be extrapolated for a particular case of interest in order to determine the emissions characteristics.
Hypersonic flow differs from regular supersonic flow primarily in that temperatures regularly reach sufficient levels to change the chemical nature of the gas. As shock layer and stagnation temperatures reach upwards of 800 K, vibrational modes are excited in the air molecules, leading to a change in the specific heats as a function of temperature [2]. As the temperature increases to 2000 K, the vibrations become sufficiently violent as to lead to the dissociation of the molecular O2, and by 4000 K most of the oxygen has been dissociated into atomic oxygen [2]. The dissociated oxygen is free to chemically react with the other species, resulting in formation of various combinations of nitrogen and oxygen, to be discussed later in this section. As temperatures increase, ionization begins to occur in significant quantities, pumping free electrons into the flow and eventually forming a plasma. As temperature continues to increase, the shock and boundary layers can begin to radiate energy into the body and surrounding flowfield, cooling the shock and boundary layers but heating the body. Between these and other nonlinearities in the shift of flow properties in air at high temperatures, actual gas temperature is dramatically different than that which predictions for an ideal gas would yield [2].
The flow in the vicinity of leading edges, or the nose in the case of a cone, tends to be in chemical nonequilibrium downstream of the subsonic stagnation region [2]. Nonequilibrium occurs when the relaxation time for a given chemical reaction is on the same order as the local speed of the flow [2]. However, as molecules collide, relax and recombine in irreversible processes, they form species different from those in the original freestream composition of the air and indeed different from those species formed by a gas in purely chemical equilibrium [2]. As the hot gases generated in the stagnation region then travel downstream through the boundary layer, they tend towards an equilibrium state [2]. Because of high entropy introduced by the severe gradients and chemical reactions around the nose, the downstream boundary layer is thickened considerably as compared to a non-reacting flow. Finally, in many circumstances, the proximity of the shock to the body near the leading edges causes the viscous boundary layer to interact with the shock layer, further complicating the physics and chemistry of the flow [2].
The current effort is focused on a 3.5 m long, 7 degree half-angle cone traveling at Mach 7 at 30 km altitude (yielding a Reynolds number of 4.1 M), with an angle of attack of 5 degrees, summarized in Table 1.
The goals of this investigation are:
- Determine a bounding series of predictions into which the subject vehicle’s wake compositions should fall
- Determine the role of body chemistry on wake composition
- Determine role of body’s thermal history in the wake
- Explore the role of chemical reactions in wake composition
At Mach 7, temperatures behind the shock are not sufficiently high as to merit concern for strong ionization or radiation of the flowfield [2,3]. Temperatures for a Mach 7 vehicle at 30 km can be estimated to be just over 2000 K behind the shock for a chemically reacting flow [2]. Indeed the temperatures at the Mach number and altitude of interest only surpass the 2000 K threshold for oxygen dissociation near the nose for most thermal boundary conditions, as “in general, the surface of a hypervelocity entry vehicle is much cooler than the flow temperature directly behind the shock” [4]. Additionally, substantial nonequilibrium effects tend to persist along the body on the order of unity in millimeters for the more extreme case of a wedge at 6638 m/s, or roughly three times the speed in this study at similar altitude conditions [2]. Thus, for a slender vehicle where much of the body is far from the shock, the majority of flow around the vehicle will be in chemical equilibrium at the present flight conditions, with the composition of the flow remaining roughly constant until the end of the body is reached [2]. Because this study is interested in the chemical composition of the wake, which is significantly influenced by the chemical reactions occurring at the nose, accurate assessment of the chemistry at the nose and subsequent relaxation must be performed.
A number of chemistry models are available to the numerical investigator of hypersonic flows. Figure 2 demonstrates the various chemistry models that are most commonly used for a given flight regime. Depending upon the flight altitude, velocity and thermal protection system (TPS), a broad array of potential combinations of atomic and molecular species may be present in the flow. For flight speeds ranging up to around 5 km/s, a 5-species model consisting only of O, O2, N, N2, and NO is generally sufficient to accurately capture the effects of chemistry within a flow [3]. Above these speeds, a higher number of species must be used in order to capture the effects of ion formation via the formation of NO+ and the associated free electrons, and still more species must be considered at even higher speeds. Figure 2 also shows the limits of the ranges for chemical and thermal equilibrium as well as non-equilibrium conditions. It is clear that this study falls squarely within the chemical equilibrium, 5-species flight regime. However, as shall be discussed later, the 7-species model must be used in order to adequately capture the effects in the wake.
Of particular significance to the present effort are the electron density and that of nitric oxide (NO). Elevated electron densities are detectable via microwave reflection from the wake, while NO eventually recombines into the formation of NO2, which itself produces optically detectable spectral emissions [5]. Additionally, the nitrosonium ion NO+ forms by the collision of N and O molecules, releasing an electron to form NO+ and thereby introducing electrons into a flow incapable of producing ionization by virtue of temperature alone [5]. NO+ can also be formed by the collision of NO with either N2 or O2 [3]. The free electrons may then be observed via microwave beam reflection by a casual observer and so NO+ is also tracked in order to determine the degree to which electrons are produced by this reaction [5]. Carbon dioxide, which is formed by a carbon ablator, is also investigated. High temperature CO2 is known to produce emissions in the infrared spectrum [6]. The cyanogen molecule, CN, is also produced from an ablating carbon surface in air, and is a strong emitter at high temperatures. Finally, the density of molecular carbon in the wake is also investigated, as ablated carbon molecules in the flowfield may emit as black-bodies which remain at elevated temperatures far into the wake, thus providing still further fodder for detection.
A further consideration is how chemical species are resolved at the wall. The catalysis model, which determines the gradient of chemical compositions at the wall, can significantly influence the chemical composition in the boundary layer, the heat transfer to the body and ultimately the wake [4]. Species which have dissociated or chemically reacted through the shock and outer portions of the boundary layer tend to relax towards their equilibrium values as they approach the wall through the boundary layer as they collide with other atoms or molecules to redistribute their elevated energy states [2,4]. However, in the case of a nonequilibrium flow at the surface wherein not all species have fully relaxed before hitting the wall, when the molecules collide with the generally cooler wall they are able to impart some of their energy into the wall and are thereby catalyzed to relax substantially [7]. This chemical reaction on the wall can also significantly heat the body, and strongly depends upon the composition and behavior of the TPS [7]. For example, Gnoffo et al., 2010 states that “metallic surfaces are generally considered to be strongly catalytic but the potential formation of an oxide coating introduces uncertainty in the proper formulation of this boundary condition” [7]. Furthermore, according to Barnhardt et al. 2009. “It has been conjectured that surface catalysis may be enhanced by the presence of larger concentration gradients” [8]. Thus the setting of any given catalysis model for the wall is assuming behaviors not just for the body’s response to the flow, but for the flow itself, presenting a challenging conundrum in understanding the chemical composition of the boundary layer for an unspecified object.
For the purposes of bounding the problem, Gnoffo et al., 2010 used a super-catalytic and also a non-catalytic wall condition [7] in order to predict conditions on the FIRE II capsule. The super-catalytic condition sets species values at the wall equal to freestream values, while the non-catalytic condition sets species gradients equal to zero at the wall. Another species boundary condition is the fully-catalytic wall, which assumes that all dissociated or ionized species catalyze to molecular species. A final general catalysis model is the equilibrium-catalytic model, which assumes that all species are catalyzed to equilibrium values for the temperature and pressure at the wall, and specifies a mass-fraction gradient for each species equal to zero at the wall [9]. In some CFD codes, material responses have been characterized in such a way as to provide material-specific catalysis models for some common ablators, adding to the arsenal of available material response options [9].
Figure 3, which highlights RMS of density gradients from a simulation in the present effort, closely matches in its features the structures reported by theoretical, CFD and DSMC computational efforts found in the literature [1,10,11,12,13]. Sharpness or bluntness of the body merely adjusts the length scales and strength of each structure in terms of chemical and gas property gradients [12,13].
Figure 3 shows several key features of a hypersonic wake, which were thoroughly explored in the 1960’s [10] and the extents and variations of which have since been greatly studied [13,14,15]. First are the boundary layer streamlines which are pulled in towards the vacuum of the passing body and compressed by their meeting at the neck stagnation point, at which location the wake temperature is the greatest and tends to closely mirror the temperatures reached on the body at the nose [1,16]. The size of this region is quite sensitive to the freestream number density, growing in length with decreased density as the molecules gain more freedom to move [12]. It is additionally sensitive to wall temperatures, and so may vary substantially in size based on thermal boundary conditions, and sensitive also to angle of attack and Reynolds number [13,14,15]. A recompression shockwave is formed by the converging boundary flows, leaving a central core of expanding flow filled with the products of the boundary layer. Flow outside the recompression shock is characterized by an expanding region as the flow turns over the shoulder, which is in turn surrounded by a free shear layer as the remainder of the boundary layer mixes with the expanding flow below and the near-freestream conditions above it.
The effects of angle of attack on the flow both over the body and the wake are significant [14,17]. The flowfield becomes asymmetric, with the windward side shock sitting quite close to the body, while the leeward side shock is drawn away from the body according to the angle of attack. Combined with a vortical cross-flow formed by the strong acceleration of the fluid around the nose from the windward side to the leeward side, the windward side and leeward side of the flow differ dramatically both in terms of chemical composition and boundary layer properties. Additionally, the boundary layer on the leeward side is much thicker than the windward side [17]. These very different layers then pour into the vacuum behind the vehicle, causing an asymmetric wake to form, in which the hotter gases from the windward side produce a higher concentration of chemically active species on the windward side of the wake and the stronger recombination shock located there [16]. Overall, the effect of non-zero angle of attack on the properties of the flowfield around and behind a cone is well-documented by authors from the 1960’s to present [14,17], but little data has been published, numerically or experimentally, to explore the composition of the wake of a slender vehicle under the present flight conditions. This study will endeavor to examine the thermochemical properties of the flow as driven by these various features.
2. Methods
The Langley Aerothermodynamic Upwind Relaxation Algorithm (LAURA) v5.5-74986 was used for all simulations. Reviews of the numerics and physics models are provided, amongst other places, in [1,7,18,19] and will not be covered in detail here. LAURA is a multiblock, structured solver which has both a point-implicit and a line-implicit solution method available. For the purposes of this study the point-implicit method was utilized on all wake computations due to the three-dimensional, cross-block nature of the wake flow [8,14].
2.1. Grid Generation and Alignment
An unaligned 3D grid of 24 blocks 33 × 33 × 72 in dimension arrayed in a butterfly topology around a 25th nose block of 32 × 32 × 72 was developed using Pointwise, with the x-direction oriented along the body’s centerline, y-direction facing the symmetry, and z completing the right-handed coordinate system pointing across the body’s diameter. The grid modeled half the body, an axisymmetric case being impossible because of angle of attack effects, and a 2D case likewise not being able to capture the important 3D phenomenon associated with a cone at angle of attack. A butterfly topology for a structured mesh sets the block boundaries such that a singularity at the stagnation region on the nose and along the wake core in the rear is avoided, which has been shown to produce non-physical results in some regions [1]. The topology is shown in Figure 4. The 25 block grid was then coarsened to 8 × 8 × 16 and the flowfield initialized to Mach 7 at 5 degrees angle of attack with laminar flow with a line-implicit relaxation method. After 1000 iterations, the turbulence model, to be discussed in detail later, was switched on. The very coarse grid was run until an Norm of was achieved. Norm is given as:
Equation (1) shows that the Norm is a measure of global convergence of the continuity, momentum and energy equations, summing the residuals at each point from all equations and scaling by the local density.
LAURA’s adaptive mesh refinement routine, align_shock was run every 5000 iterations. align_shock shifted cells in the body-normal k-direction such that tight clustering was achieved in the shock and boundary layers, with a variable growth rate at the wall which was set to achieve a non-dimensional distance no greater than 1 at the wall and retain of cells in the boundary layer, with tight clustering around the shock. Grid resolution studies conducted in the past with the LAURA code have been performed across many conditions, ultimately resulting in some general guidelines for the appropriate wall-normal grid spacing for flows with nonequilibrium regions. Of particular interest in the literature is the concept of Cell Reynolds Number, which is given by the equation:
Here, is a local speed of sound to account for thermal velocity, and is the height of the first cell off the wall. Values of on the order of unity are able to reliably simulate non-equilibrium chemical reactions and heat transfer to the wall [18,19,20,21,22]. This ultimately places the height of the cells on the wall significantly lower than the height required to adequately capture turbulent flow structures with most Reynolds Averaged Navier-Stokes (RANS) solvers, which mandate a value of less than one [23]. is given by Equation (3):
In Equation (3), is the friction velocity, is viscosity and is the density. Growth rates were close to the wall, and ranged up to in the inviscid region between the boundary layer and the shock. The end result was a maximum near the rear of the vehicle, with a minimum of at the nose as seen in Figure 5a. The did change with the various boundary conditions utilized in this study, but remained on the same order for all studies. was 0.3 at the nose and reaching a maximum of 10 near the rear of the vehicle, well within established bounds for accurate surface heading prediction [18,20]. Clustering near the shock was set by Equation (4). In Equation (4), was set to 5 to ensure high resolution around the shock, and was set to 0.8 to hold the shock at of the wall-normal distance from the wall, the results of which can be seen in Figure 5b.
The coarse grid was then refined to its original resolution using LAURA’s prolongate routine, which refines the mesh back to the original mesh dimensions, but leaves in place the body-normal refinements made in the coarse grid. Finally, the solution was run to an Norm of , with surface temperature and heat flux monitored to confirm a steady solution. During this computation, body-normal refinements were again run every 5000 iterations initially and then every 10,000 as sensitivity in the Norm diminished, with the temperature and heat flux eventually showing no change with further refinement. The resulting grid is seen in Figure 5 and Figure 6.
The flow-aligned grid was then modified using Pointwise with an additional 70 blocks in the wake, each of dimensions 32 × 32 × 72. Body-normal spacing on the rear surface of the cone leading into the wake was set to 0.001 m, with a growth rate of . This value was selected as a “safe value” based on findings in Barnhardt et al., 2009 and 2012, which found for a much higher speed flow that a spacing of 0.0025 m off the base wall was sufficient to capture wake structures as accurately as possible with the Spalart-Allmaras (SA) turbulence model used in a DES formulation [8,14]. Given the heavy computational demands required to obtain a converged mesh of the body for a given spacing in the cross-body and flow-wise directions, and the subsequently time-consuming and expensive process of developing and running the wake mesh to match the flow-aligned grid, a grid-resolution study of the wake was deemed not to be feasible. However, given the discussion above, some confidence may be nevertheless be placed in the grid resolution required for the flow phenomenon at hand. The full 95-block grid is pictured in Figure 7. Figure 7 also has inlays showing increasing zoom towards the rear of the vehicle in order to show resolution at the corner.
2.2. Numerics and Models
A LAURA flow solution was resolved using the two-temperature model for both 7-species and 13-species cases which were each tracked according to its own set of conservation equations in the chemically reacting flows. The 7-species model was used for the non-ablating cases, and consists of the molecular nitrogen and oxygen, their respective atomic counterparts, NO, NO+ and electron density. The 13-species model used the same species along with elements from a pure carbon ablator, allowing for the formation of CN in addition to the most common molecular carbon combinations. Each set of species is reviewed in Table 2.
Mach 7 is sufficiently low in the spectrum of hypersonic flows that many of the chemical kinetics that affect heat transfer to the body in higher speed flows are relatively insignificant to the heating of the subject body. As such a 5-species solution is traditionally used in this flow regime. In particular, at Mach 7, ionization does not occur at rates high enough to significantly affect the flow structure or heat transfer [2]. However, a small degree of ionization is present even at Mach 7 owing to the formation of nitrosonium, which does form at the present flight conditions, and so the 7-species model was required for the non-ablating cases, and the 13-species model for the ablating cases. LAURA computes variable Prandtl and Schmidt numbers, computing conductivities and diffusivities directly from collision cross-sections [9].
In addition to the chemical composition of the wake flowfield, this study endeavors to determine some reasonable bounds within which the significant variation of possible TPS materials can affect the subject species concentrations. As the body encounters the extreme energies of a hypersonic flow, the TPS can be designed to respond in a number of possible ways. Furthermore, different portions of the TPS and body structure can be produced with different thermal management systems, thus producing further variation in surface thermal conditions. The following is a brief discussion of some of the design options available and their associated models in the present effort.
The TPS may act as a “hot structure”, wherein the structure absorbs enormous quantities of heat, eventually leading in the extreme case to a condition of zero heat transfer to the body at the surface. Such a case yields a state similar to the adiabatic thermal boundary condition. Although a system design which yielded an adiabatic wall condition would certainly be destroyed by the resultant temperatures in the hypersonic environment, this condition provides a helpful upper bound to the temperatures and therefore chemical compositions that might be encountered in the wake.
The opposite of the adiabatic condition is the cold-wall condition, wherein some active cooling mechanism in the flight vehicle keeps the wall cooled to a specified temperature, or when the flight time is relatively short. For example, the HIFIRE-1 flight vehicle was shown to maintain a cold-wall condition even towards the end of its trajectory [24]. This condition is also commonly used to simulate wind-tunnel experiments wherein the body is not exposed to the flow for sufficient timescales as to heat up significantly. Two extremes are examined herein; that in which the entire body is kept at a constant temperature of 500 K, and also the case where the nose is allowed to heat significantly and also ablate, but the rest of the body is kept to the temperature of 500 K. While the former case is unlikely, it provides a lower bound within which the chemical composition of the wake might be estimated.
A third alternative is also explored, wherein the wall is treated as adiabatic except for the degree to which the wall is able to radiate away heat imparted by the flow; the so-called ‘radiative equilibrium’ condition. The flow of radiation away from the wall is not coupled with the flow solver in this study, although the wall is allowed to benefit from the radiative cooling. Previous studies have shown that under many circumstances this condition can provide a reasonable approximation for surface temperature as compared to flight data [7]. The radiative equilibrium condition states that heat transfer into the wall is equal to:
This boundary condition effectively states that the wall will reject all heat from the flow except that which it is able to radiate away. Taken together, these thermal boundary conditions were selected to give a high, low, and reasonable mid-spectrum estimation of thermal conditions on the surface of the flight vehicle. Ultimately, the surface conditions on the flight vehicle determine the temperature and chemical composition of the wake, and so determining these bounds in turn establishes reasonable bounds for the thermal environment within the wake.
LAURA uses two relaxation factors, which are respectively multiplied against the viscous and inviscid Jacobian computations in the point-implicit matrix with each iteration. These factors help to stabilize the code, and may be set to quite high values in order to ease the code through tough transients [18,19] without affecting the solution, so long as they are ultimately returned to a value on the order of 1 and 3, respectively [1]. In this study, the factors were both set initially to 40 for initialization of the case. The inviscid and viscous relaxation factors were gradually lowered to 3 and 1.5, respectively as the solution converged. Setting the relaxation factors to their final values did significantly impact the solution as compared to a converged solution arrived at with the factors set to 10 and 6, respectively. A steady simulation was selected based on previous findings that indicated variational frequencies for flow properties at the specified conditions are sufficiently high as to allow a time-averaged solution to produce the observable wake phenomenon of interest [1]. A Courant-Friedrichs-Lewy number (CFL) of 5 was initially selected and was allowed to grow as high as 50 as convergence was reached on the fine grid.
The Spalart-Allmaras one-equation turbulence model with the Catris compressibility correction was selected to model all turbulence. Barnhardt et al. (2009) found that “RANS greatly overpredicts heating near the base center and the distribution does not correlate well to the experiment. Detached Eddy Simulation (DES) captures the essential distribution within measurement uncertainty” as compared to the NASA Reentry-F test flight in 1968, which studied a reentering 5-degree half-angle cone [8,14]. Because DES was able to predict the base temperature within acceptable error as compared with flight test data, these results suggest that the error lay in the RANS modeling of the wake structures. Thus, given the large degrees of uncertainty in the RANS models’ predictions for the recirculation zone [14], the unavailability of DES in LAURA, and the parametric nature of this study, the choice of SA-Catris as the turbulence model was driven by a desire for stability and simplicity. Furthermore, the SA model was shown in Barnhardt et al., 2009 to produce reasonable estimations of heat flux on the surface of a cone at much higher speeds [14]. Transition was not modeled in this study, with the entire domain initialized as turbulent in keeping with the original study by Kania et al., 2015 [1], and for additional reasons discussed next. This likely produced slightly higher surface temperatures over the front portions of the vehicle as compared to the potentially laminar flow which some studies have shown is likely to exist there [14,25]. For comparison, two laminar cases were also run for a non-ablating case, the results of which are discussed later.
With the assumption of turbulent flow throughout the flowfield comes the assumption of a turbulent wake. Many studies have focused on laminar flow at either much lower freestream Reynolds numbers, zero angle of attack, blunt bodies with or without sharp corners on the rear surfaces such as those encountered on a traditional cone, or been in two dimensions [13,14,15,26,27]. Thorough reviews of the many wake studies to date can be found in the works just cited, which together support the presence of laminar near-wakes for many flow conditions, but indicate that turbulence may be also be present in a broad variety of flows. These studies together conclude that: transition to turbulence in a near-wake is poorly understood [15], transition in the near-wake is highly sensitive to angle of attack, geometry, freestream Mach number and Reynolds number [14,27], and very little current experimental data exists to validate numerical predictions of near-wake flows for the cases of interest to this study [14,26]. All told, the authors could find no basis upon which to conclusively determine whether the flow could be adequately captured by a laminar simulation or must necessarily be turbulent, in which case the wake flow could be studied only qualitatively regardless of the accuracy of any preceding assumptions owing to the poor reliability of RANS simulation for base flows [14]. Based on the findings that boundary layer transition is highly dependent upon Mach number, angle of attack, and Reynolds number [14,17,24], the observation that the boundary layer on the leeward side is almost certainly separated quite early on [24,28] and the emphasis of this study on the poorly characterized near-wake as opposed to the body, a turbulent scheme was selected for the entirety of the geometry for most cases. However, for completeness, a laminar simulation was also run on the non-ablating and ablating radiative equilibrium cases with no catalysis.
In light of the above discussion on handling of turbulence in this study, and the potential impacts upon surface temperature of a fully turbulent flow, some further analysis of the validity of the results is warranted. Referring again to Figure 2, we see that this study should necessarily bound on the lower edge of chemically reacting flow. Furthermore, the Counter-Rocket, Artillery and Mortar (RAM-C) flight test, which featured a considerably blunted cone which traversed a Mach number and altitude quite close to that of the present study, showed the significant presence of free electrons owing to mechanisms discussed previously for the present effort under those flight conditions [5,29]. In the present study, the peak temperature for the ablating cases was 2411 K on the surface, a temperature only just sufficient to produce non-equilibrium effects at the stagnation point which would subsequently produce potentially observable phenomenon in the wake. It can thus be concluded that, if the above handling of turbulence overpredicted temperature, it was not to such great extent as to push the results beyond the realm of reasonable limitations. Furthermore, the non-ablating cases run in this study provide a lower bound in the case of a substantially weaker set of chemical reactions.
The present study is concerned with trying to bound the ranges within which anticipated chemistry of an unknown incoming hypersonic object might be found. Thus no assumption is made respecting the nature of the TPS except that it be made purely of a carbon ablator subject to the steady-state ablation assumption, which “specifies that the pyrolysis ablation rate is proportional to the char ablation rate and the in-depth conduction is proportional to the enthalpy at the surface” [9]. The steady-state ablation model solves the surface energy balance by according to the following equation:
In Equation (6), is the heat radiated into the surface from the flowfield (assumed to be zero in this study), is heat radiated away from the wall with as the Stefan-Boltzmann constant and the emissivity of the surface, and is the heat transfer caused by the massflow yielded pyrolysis and charring , and is the enthalpy at the wall. is the heat convective heat transfer at the wall, which is assumed proportional to the enthalpy at the wall. The steady-state ablation assumption then relates the ablation massflows as:
In Equation (7), and are the virgin and charred material densities, respectively. The char material density is assumed to be kg/, which is that of the heritage AVCOAT material, and the virgin density is also that of the virgin AVCOAT, kg/. These are the default values in the LAURA code, which were selected in keeping with the recommended best practices for an unspecified ablative procedure in the LAURA manual [9]. The parametric nature of this study is again emphasized here; the subject geometry, TPS, and flight conditions do not lend themselves well to reproducing a specific flight test and are not intended to attempt to do so. However, the role of ablation in the production of observable species at the subject conditions is explored, and so the above set of simple and reliably stable representations of the TPS were selected with that aim in mind. A full treatment of the ablation in LAURA is given in the literature [7,30].
These assumptions were applied to the first four blocks, extending to m along the nose for cases where radiative-equilibrium or a cold-wall was assumed for non-ablating sections downstream of the nose, and the first seven blocks extending to m for those cases assuming an adiabatic body downstream of the nose. The temperature downstream of the ablating portions substantially impacts the conditions within the ablating zones. The subsonic flow within the boundary layer allows heating or cooling from the non-ablating portions of the flow to propagate upstream to the ablating portions of the flow via molecular diffusion, changing ablation rates and chemical composition of the boundary layer in both ablating and non-ablating zones. Thus the behavior of the TPS downstream of the ablating nose becomes even more significant in accurate prediction of the composition of the wake.
From the above discussion of the ablation assumptions utilized in this effort, several key implications upon the results thus produced can be drawn:
- Note that conduction into the wall is treated by the ablation model available in LAURA as proportional to the enthalpy at the surface. Depending on the actual properties of the TPS and thermal history of the vehicle, the actual surface temperature, and thus chemistry both along the body and in the wake may vary significantly.
- Addition of further elements such as Hydrogen, Silicon and Nitrogen, and also changes in the response of the TPS material to high temperatures would certainly impact the chemistry and heating conditions on the wall, driving changes to both the wake temperature and wake chemistry. However, the effect on wake properties of any particular additional species, nonetheless combination thereof, would be quite difficult to qualitatively ascertain without performing additional simulations owing to the complexity and quantity of endothermic and exothermic reactions which would arise at differing levels depending upon temperature, pressure and quantity of the added species. Thus, although this study aims to produce qualitative discussion of the variation of detectable species with changes in the TPS under the given flight conditions, effects caused by the addition of further chemical species beyond carbon are entirely unexplored herein.
- Use of different materials is unlikely to produce a hotter wall than the adiabatic case, or a cooler wall than the cold-wall case. The extent to which these temperatures bound the chemical reactions in the wake is explored in the results and discussion.
2.3. The Cases
The cases studied in this investigation are reviewed in Table 3. The radiative equilibrium case has been shown to produce results with reasonable agreement to experiment [1,7,19], and so is the most extensively explored because of its potential to most closely match an actual system. However, the adiabatic and cold-wall cases are also explored in order to assess the degree to which the structure and composition of the wake vary with thermal conditions on the body. Ablating and non-ablating cases for each condition are run in order to ascertain the extent to which ablation impacts thermochemistry in the wake. Finally, catalysis is varied for each condition in order to understand the role of surface catalysis in wake properties. All cases are performed for the same 3.5 m long, 7 degree sphere-cone with a 0.25 m sphere radius at 30,000 m altitude and Mach 7.
2.4. Detection
A final note regarding the detection of the species studied herein is warranted before proceeding to discussion of the results of the simulations described above. Detection of radiative emissions is a complex task which depends upon a multitude of case-specific factors such as viewer optical path, emission absorption by the intermediate medium in the particular spectra of interest, and background radiation as viewed by the observer, amongst many others [5,6]. Furthermore, the intensity of emissions from a given species depends upon the temperature and density of that species as integrated across a particular viewing angle, with the prior considerations then applied [5,6]. For these reasons, discussion of actual radiative emissions and the detectability of them is entirely foregone in the present effort. However, for several points of reference are here discussed.
The Earth emits essentially as a blackbody as seen from space at a temperature of 255 K [31], producing a substantial background radiance against which an object must stand out. This radiance has a peak energy occurring at a wavelength of 500/ at w/-ster [31], where CO2 has been shown for a Mach 6 sphere at 24.4 km to produce an intensity nearly an order of magnitude greater than the background level at 2400/ [6]. Thus CO2 can play a significant role in detection. CN emits strongly around 390/, which is much closer to the peak energy spectrum emitted by the Earth, but may nevertheless emit sufficiently strongly as to be easily detected. For example, at 8000 K, CN emits at ()w/-ster at this wavelength, thus overpowering the background noise by several orders of magnitude. Also for reference, NO emits at this same order of magnitude at the given temperature, making it likewise a strong potential candidate for detection, depending on optical depth, receiver sensitivity and nominal wavelength, and many other factors. These numbers are provided more to motivate the results to follow than to provide helpful bounds within the results of this study might reasonably vary; given the number of potential complicating factors, such bounds are beyond the scope of this effort.
3. Results
3.1. Validation of Results
Quantification of error is notoriously difficult for hypersonic simulations owing to a general lack of comparable experimental data and also to the complexity of the phenomenon of interest. Although a massive collection of data is available for near-surface hypersonic phenomena, particularly in application to blunt-body or spherical geometries at zero angle of attack, little emphasis has been placed upon flow features away from the body, in particular the wake. The problem of validation is further complicated by the tendency for studies to be performed at zero angle of attack. Since flow structures, and thus viscous and thermochemical phenomenon vary substantially with small changes in flight condition [32]. Furthermore, data for chemistry within the wake is particularly scarce, given that most wake studies identified in the literature have focused on afterbody heating and pressure distributions as opposed to the thermochemistry away from the body.
In light of the absence of applicable validation data for chemistry within the wake, which is the focus of this study, a first-glance sanity check of the flow around the body using some experimental results found in the literature for the flow around the body is now explored. Some theoretical prediction methods are also available to give a first-order approximation for a check of the results. The difficulty of matching flight velocities and densities in ground-based test systems, and measuring the wake at all in an actual flight vehicle, makes it difficult to find relevant data against which temperature-driven phenomenon and chemical kinetics may be checked. As a result, the most common data available is for pressure and Mach distributions in various forms. The flowfield solutions are thus checked against such data, but no attempt is made to validate the chemical species except to observe trends within the bounds of the parametric analysis.
The first mechanism of validation will be a comparison of stagnation region chemical makeup against theory and experiment. Huber (1963) extensively cataloged the properties of air behind a normal shockwave at various altitudes and velocities with accuracies estimated to be within 0.2% for a given set of input properties [33]. Huber predicts a post-shock temperature of 2200 K for a Mach number of 7.18 and altitude of 100,000 feet, with the stagnation temperature estimated—with a high degree of uncertainty—to be 2439 K. The temperature behind the shock is found to be 2390 K with a stagnation temperature of 2410 K. Given the 10% higher ambient pressure in the present study, the use of a sea-level gas composition in the Huber study, the close agreement of the present study with the predicted stagnation temperature, and the general uncertainty surrounding the chemical rates used herein, this agreement is found to be sufficient.
Since the bulk of chemical reactions occur in the stagnation region, the chemical makeup of the flow outside a region immediately off the wall should remain roughly constant along the body for the [2]. Hence if the bulk flow behaviors are demonstrated to be accurate, those portions of the flow whose chemistry is determined entirely by stagnation region phenomenon should remain as accurate as the stagnation region calculations allow, with the species merely being transported by convective phenomenon and mixed by any turbulent phenomenon prior to reaching the wake. Also, surface pressures downstream of the stagnation region do not change significantly with temperature or catalysis, which is also consistent with theory [2], lending further weight to the importance of demonstrating accurate bulk flow behavior. Finally, as shall be demonstrated later, the chemical effects of catalysis trapped captured within the boundary layer (or beneath it, on the leeward side) and largely limited to the base and core regions of the wake.
The accuracy of the pressure distribution downstream of the stagnation region is a helpful test against which the volumetric flow properties may be assessed. Classical Newtonian flow prediction for a cone of half-angle at zero angle of attack gives a rapid first estimate. Newtonian flow predicts a roughly constant coefficient of pressure across a hypersonic body, and does not consider the stagnation pressure or its downstream propagation. A full derivation of the pressure coefficient approximation is provided in Anderson’s text, “Hypersonics” [2], and it ultimately yields:
Figure 8a shows the coefficient of pressure for the subject cone, which is at an angle of attack. As expected, the coefficients of pressure for the top and bottom surfaces are higher and lower, respectively, than the Newtonian flow prediction, but fall within good agreement of the theory. Thus the plots in Figure 8 are for the non-ablating radiative equilibrium case only. Figure 9 shows the 3D pressure distribution along the body.
Until relatively recently, thermochemistry in hypersonic wakes has not enjoyed a great deal of examination and indeed no experimental studies were identified which focused on chemical species within the wake near the relevant Mach number Reynolds number. Several studies of flow structures in laminar wakes behind blunt bodies were performed in the 1960’s and backed by experimental data, and an excellent review of such literature until 1966 is provided by P.S. Lykoudis of the RAND Corporation [10]. Those studies were unfortunately limited by the diagnostic capabilities and also the detection technology of the time, which did not allow for substantial examination of the wake species or their utilization for tracking purposes. However, the studies gathered and summarized by Lykoudis did determine with confidence the behavior of the wake structure. Efforts at the time, and also the majority of available efforts since then have focused on the wakes behind blunt bodies in an effort to ascertain the environment encountered by interplanetary probes and manned spacecraft entering planetary atmospheres. Fewer studies have focused on the wakes behind sharp vehicles, and an accompanying void of published experimental data also exists for sharp flight vehicles, particularly at an angle of attack [13]. However, several recent studies do provide some basis for comparison of results from the present effort with an eye towards reproduction of general trends.
Examining data from the HIFiRE-1 test results [24], which flew a half-angle cone with a 0.025 m spherical nosetip, at 481 s into its trajectory, the angle of attack was roughly , with a freestream unit Reynolds number of roughly per meter and an altitude in the vicinity of 30 km. These estimations are rough, as the uncertainty on any freestream value was approximately [24]. Although the significantly higher angle of attack at this time would increase the windward surface pressure and temperature and decrease those of the leeward regions, this data provides a helpful glimpse into actual surface conditions around the cone in the flight regime of interest.
Figure 10 shows the pressure at four points along the surface of the HIFiRE-1 cone. The cone was determined to be rotating beneath flow-fixed features such that the transducers stationed radially around the vehicle were able to each obtain a read on the windward and leeward sides, yielding the oscillatory behavior seen above. From Kimmel, 2014: “Surface pressure traces from four different stations located at body-fixed coordinates (0.7013 m, ), (0.7013 m, ), (0.9263 m, ), and (1.0513 m, ) are shown in Figure 10. These coordinates correspond to the transducers PLBW10, PLBW14, PLBW4, and PLBW5” [24]. Given the significant differences in pressure readings from each transducer, the actual pressures can only be estimated, but range on the leeward side between 1 kPa and 3 kPa, reaching between 9 and 12 kPa on the windward side. Recalling that the angle of attack is close to 8 degrees higher than the present study, pressures on the two sides can be assumed to be significantly closer to one another and between the bounds seen above. Referring back to Figure 8b, the surface pressures fall squarely within such a range, between 1.5 kPa and 4.5 kPa.
A final note on HIFiRE-1 regarding its surface temperature is warranted here. HIFiRE-1 had thermocouples along its length and distributed radially in order to help locate the boundary layer transition front. The vehicle was designed to be non-ablating, and followed a ballistic trajectory. As a result, the total flight time was around 10 min, leading to essentially a cold-wall condition over the cone surface. Thus the surface thermocouples detected a temperature at the wall of 430 K at the end of the cone at 482 s. Thus the wall conditions for the cold-wall case here could be expected to produce similar results as the HIFiRE-1 flight [24]. Other flight vehicles with longer range and a lifting body intended for hypersonic glide would spend substantially more time in an environment of extreme heating, and would thereby be better represented by the hotter wall boundary conditions.
Several other experimental studies were identified that were conducted under varying circumstances which taken together provide some insight into the accuracy of the flowfields presented here. The first is the study conducted by Lin et al., 2006, “Hypersonic Reentry Vehicle Wake Flow Fields at Angle of Attack” [16]. Lin et al., 2006 compiled much data regarding the base pressure from multiple wind tunnels and methods of experimentation with Mach numbers ranging between 6 and 10, with Reynolds numbers ranging from 0.5 million to 4 million per foot. The experiments were conducted on cones with base ratios ranging from 0 (sharp) to , with a 7 to 10 degree half-angle. Conic surface pressure, or the pressure on the surface of the cone at zero angle of attack, was used to non-dimensionalize the data, forming the pressure ratio . Ultimately, the experiments ranged in base pressure ratios from 0.03–0.1 depending on the method and conditions used. The cone of interest to this study has a bluntness ratio of at a per meter Reynolds number of 2,900,000 or 883,920 per foot, and so it again falls nicely between the experiments’ ranges. In this study, the conic pressure at zero angle of attack was estimated from Newtonian flow theory as:
Here, as estimated previously, and = 41,200 and Pa are the freestream dynamic and static pressures, respectively. Examining Figure 11, the base pressure for this study ranges roughly from 0.03 to 0.05 depending on the surface conditions. This data matches very well with the tunnel data summarized in Lin et al., 2006, lending confidence to the present study’s analysis of the near-wake region.
Furthermore, Lin et al., 2006 plots the centerline Mach number from a number of wind-tunnel experiments, as well their own CFD for a Mach 6, half-angle cone against a non-dimensional . The trends from experiment and CFD in that study are very closely matched. Using several representative locations for example [16], Figure 12 shows excellent agreement between the present CFD and experiment. Although some variation from the experimental data is expected due to Mach and geometric differences, one of the key findings of Lin et al. was that variations in the profile seen in Figure 11 are slow with Mach and geometry changes.
3.2. Flowfield Structure
Confident that the bulk qualitative behaviors of the flow have been accurately produced according to several methods of analysis, we can now examine the flow structure more closely. Figure 13 shows the total density gradients throughout the flowfield, calculated as the RMS of density gradient in each direction:
The structure of the flow is strongly influenced by angle of attack, producing vastly different results on the windward and leeward rays. The windward side boundary layer remains attached along the length of the body, despite a powerful cross-flow as hot, pressurized flow from the windward side is pulled into the vacuum of the leeward side. Although its effect on the flow is most dramatic near the front of the body, the cross-flow continues along the length of the body, leading to complex 3-dimensional features in the wake base. Additionally, this cross-flow has been shown to cause significant boundary layer instability, further exacerbating the problem of identifying the location of transition to turbulence [24]. The curvature seen in the windward shock is also caused by this cross-flow, although the grid alignment routine pulled the outer boundary of the domain closer to the shock than the surrounding flow in that area, exaggerating via optical illusion the actual curvature of the shock. The flow over the leeward body can be divided into five distinct regions moving in from the outside:
- Freestream
- Shock layer
- Inviscid zone
- Separated Boundary Layer
- Viscous Mixing Zone
Each of the latter three contribute significantly to the structure and composition of the wake, and their composition and behavior depend greatly on the surface conditions encountered. In the stagnation zone, a thin boundary layer forms immediately as the flow works its way around the spherical nose of the cone, separating as it goes due to the angle of attack. Powerful gradients in temperature and pressure through the boundary layer drive rapid thermochemical changes, which then interact with the viscous mixing region beneath the separated boundary layer. This mixing region draws species from the surface catalysis and is a primary source of observable species in the wake.
The boundary layer and mixing zone draw from generally different pools of chemical species, the former drawing greatly from the stagnation region while the latter is fed by catalysis along the length of the body. Downstream of the nose, because of mixing caused by shear forces between the layers, the species from the outer layer are able to diffuse to the surface, and vice-versa. Above these two layers, the inviscid region does not experience substantial gradients except at its boundary with the shock layer. This layer does not contain substantial quantities of chemically reactive products, as most of the products generated either by chemistry near the surface have been caught up in the viscous interaction close to the nose and remain close to the body. The oblique shock is not sufficiently strong in this study to produce significant chemical reactions. However, some species do diffuse out of the lower two layers. In particular, carbon-species ablated near the nose, which are chemically quite stable, slowly diffuse out of the separated boundary layer.
As the layers travel downstream along the body, each experiences relaxation and recombination of its species at rates unique to each zone. When the end of the body is reached, several distinct phenomenon can be observed as the zones are forced to meet by the wake structures. Showing x-oriented density gradients , and pairing it with a chart of streamlines, Figure 14 shows that much of the mixing zone beneath the boundary layer is pulled directly into the recirculation zone, heating up through a shock bounding the subsonic recirculation zone and expanding supersonic zone just outside of it. The rest of the viscous zone is pulled along by the boundary layer, expanding in all directions and mixing in the complex three-dimensional flow between the neck and the viscous mixing layer. The viscous mixing layer itself is turned upwards first by the expansion fan at the corner, and still further by the recompression shocks formed at the neck. Importantly, the 3D cross-flow swirling flow from bottom to top adds to the complexity of the base flow, bringing from out of plane the same phenomenon described above with the addition of a strong vortex.
The complex interactions of these various layers in the wake, combined with the chemical reactions which took place in each layer as flow traveled along the body, create the conditions for still more complex chemistry. Even for flows which were considered to be in chemical equilibrium along the body, the wake is frequently not in chemical equilibrium but is rather chemically frozen [5], making accurate characterization of the chemistry along the body, which forms the boundary condition for the chemically reacting wake, even more critical.
The chemical composition of the wake is seen to vary dramatically depending on body temperature, which is a function of and strongly affects the two innermost layers. Since the nose of a slender vehicle is frequently of a different internal structural material and TPS than the body (see HIFiRE [24] or the RAM-C experiments [29] for examples), the various thermal boundary conditions discussed previously come into play as we try to predict the chemical behaviors exhibited by the flow. Figure 15 shows the powerful role that surface temperature plays within the wake. Figure 15a shows the surface and wake temperatures with each thermal boundary condition at the non-catalytic setting. Each condition has two lines, one representing the top surface and one representing the bottom. At no point in any simulation is the top surface the hotter, so the top line consistently represents the bottom surface, and the bottom line represents the top surface.
Clearly, the boundary conditions downstream of the ablating nose play a significant role in conditions in the wake. Interestingly, however, each ablating case was run with the same surface energy balance on the nose; the temperature profile for the ablating portion of the body is identical over the first 0.45 m for the ablating cases. After m the various surface temperature conditions being applied downstream of that section. The surface temperature at the stagnation region reached 2050 K for all ablating cases. However, as Figure 15b shows, the response of the body downstream of the nose ultimately determined the temperature within the wake independent of conditions at the nose. Figure 15a shows the surface thermal boundary conditions which led to the observed wake temperatures.
3.3. Cone Flow Chemical Composition
3.3.1. Stagnation Region
Although the wake temperature was found to be primarily a function of conditions downstream of the nose, the species generated in the stagnation region, especially ablating species, are found to play a very strong role in determining wake species. The next series of figures shows the chemical composition of the flow based on surface temperature in the form of either a number density, N of each species or a number density divided by a normalized local density according to the following equation:
Here, S is a given species, the “*” denoting a normalized number density. This normalization shows production or depletion of a given species independent of flow density, an increase in which would otherwise show an increase in number density regardless of whether a species was being chemically produced or not. However, for an observer attempting to detect the flight vehicle as it passes by, actual number density is more helpful. Thus for discussion of wake species directly related to detection—carbon dioxide, nitrosonium, nitric oxide and free electrons—number densities are used, , but for discussion of species production or depletion along the body, number density is normalized by the local flow density. Figure 16 compares the trends for number density vs. normalized number density for nitric oxide in the stagnation streamline; although the number density of NO increases nearly an order of magnitude across the shock in (a), when normalized by density the actual production of NO, which one would not expect to observe in significant levels until higher temperatures, is seen to be negligible through the shock.
Again referring to Figure 16, the first species of interest is nitric oxide NO, because of its chemiluminescent properties in the far wake as it recombines with an atomic oxygen molecule into an electrically excited NO2, which in turn emits a photon to relax [5]. Of note, NO exists in trace levels in the atmosphere owing to pollution and, to a lesser extent, its production by lightning. The higher the density of NO, the more chemiluminescence that will be observed in the far wake [5]. NO is formed by the reaction N2+ONO+N. Since oxygen is the first species to dissociate, nitric oxide can occur in significant quantities under conditions in which it neither recombines into NO2 nor reacts with free oxygen atoms in the reaction NO+OO2+N [5]. Thus the levels of NO may remain high if atomic oxygen is being consumed at high rates via some other reaction (from, say, reactions with ablative materials). Here, neither the cold nor the non-ablating radiative equilibrium case at first appear to produce significant levels of NO. However, examining the production of N in Figure 17, we find that at the temperature of interest the rate of NO breakdown into O2 and N outpaces that of production of NO [5], and so no sign of NO appears until closer to the nose, whereas levels of N increase substantially.
It is emphasized here that atomic nitrogen is not being produced via dissociation, given that the temperature is far too low for that reaction. Rather, the mild dissociation of oxygen produces a chain of chemical reactions which ultimately results in the production of atomic nitrogen, while leaving molecular oxygen unchanged. Low level production of atomic nitrogen at Mach 7 is supported by Bussing et al., 1989 [34].
In the ablating cases, the presence of nitric oxide increases by 3 and 4 orders of magnitude, respectively. The reason for this is that the ablating cases introduce carbon species to the mixture, which consume large quantities of O2 and O, thereby preventing the reaction NO+OO2+N. The higher rates of NO then lead to increased levels of NO+ due to the collision NO+M + + M, where M can be either O2 or N2. The increased production of nitrosonium due to increased NO levels is seen in Figure 18a for the ablating cases. The turbulent case introduces more carbon species into the fluid because of its higher mixing rate, which in turn consumes more atomic oxygen. Figure 19 shows the plummeting levels of oxygen species close to the surface where carbon species including C, CN and CO2 appear at substantial levels. C2 and C3 are not present at significant levels, but at higher temperatures can be present in substantial quantities. Although the turbulent case produces more pure carbon species, the laminar case produces higher levels of CO2 owing to its higher levels of atomic oxygen through the reaction O+O+CCO2.
3.3.2. Characterization of the Wake
With observable species in the stagnation region identified and their origins understood, the significance of thermal boundary conditions downstream of the ablating nose can now be investigated. Although only the cold-wall case is represented for the non-ablating possibilities, a radiative-equilibrium, non-ablating case was also solved. All comments applying to the cold-wall case similarly apply to the radiative equilibrium case, with insignificantly small deviations in observed species values. Figure 20 shows kinetic and vibrational temperatures of the flowfield for the ablating radiative equilibrium case. While the values shift significantly between the various surface boundary conditions, the overall structure is generally consistent across cases. The largest structural change is a small shift in neck location depending on the temperature at the back of the body, and also a substantially different density distribution within the core. A plot of density through the wake core is provided in Figure 21 for reference.
Another interesting perspective on the thermal environment of the recirculation zone and the formation of the neck is provided by examining the gradients of temperature in that zone. Figure 22 examines the temperature gradient with respect to x for the adiabatic non-catalytic abalting case, . This data is presented in greyscale in order to clearly show zones of cooling (black) vs. heating (white).
As the flow expands around the corner, it cools down, but the area of cooling is visibly separated by the shock which contains the subsonic recirculation zone, which heats the flow again. Within the recirculation zone, the flow continues to cool as it continues expanding around the corner. However, as the flow is compressed towards the center with its rearward motion, it heats up again. The recompression shocks from this meeting of top and bottom flows are clearly visible, although the bottom recompression shock is significantly weakened and moved upwards by the bottom expansion fan. The dark spot of cooling moving from the top cone corner into the neck is formed by a powerful swirl that encompasses the recirculation zone pulling the cooling, expanding flow from the cooler edge of the cone in the third dimension into the neck. Although not shown here, substantial heating in the y and z directions is visible in that area.
With the above discussion of conditions which feed the wake in mind, this section will examine wake species. Figure 23 shows the distribution of cyanogen and electron number density for the turbulent ablating radiative equilibrium case. For all cases, whether ablating or not, the distribution of any observable species is nearly identical. Although some ablative materials such as CO2 and CO, surround the core in a broad halo, having diffused from the edges of the stagnation zone and separated boundary layer, the temperatures outside the core and viscous mixing zone are sufficiently cool as to merit these products’ contribution to radiation insignificant.
The wake is seen to be non-symmetric because of the angle of attack. Thus species are concentrated more highly above the core centerline than below it, and indeed the upper recompression shock forces much of the flow from the viscous mixing zone to remain above the wake core, and seen by the divergence of the mixing and boundary layers’ streamlines in Figure 14 downstream of the neck. Note also that the number density of electrons is identical to that of the nitrosonium density since nitrosonium is the only source of free elctrons. Thus, the two shall be considered synonymous for much of the rest of this investigation.
Species will now be discussed in terms of a cross-sectional slice seen in Figure 24, which is placed just upstream of the neck region. Because of the varying thermochemical conditions which feed the recirculation zone, the location of the neck shifts slightly with each case, allowing a consistent analysis to be performed across the cases. The placement of this slice allows a clear observation of the various wake structures as produced by the flow structures over the body. Figure 24b shows the temperatures in the cross-sectional wake.
The locations highlighted in Figure 24 are created as the flow rounds the corner behind the cone. These locations are:
- (a)
- Lower oblique shock
- (b)
- Base zone bounding lower shock
- (c)
- Base zone bounding upper shock
- (d)
- Upper Expansion zone
- (e)
- Expanding mixing and boundary layers
In the following figures, these features are evident in many of the plots, in particular the laminar ablating case. The dependence of the observable species upon conditions at the nose shall now be investigated using the same density-normalized notation as was used in the stagnation region. Figure 25 shows the distribution of NO and NO+ in the wake cross section. The NO levels at the nose were of the order / in the stagnation region for the turbulent cases. In the wake, they remain close to that order for the hotter-walled cases, at /. However, for the ablating cold-wall case, the order has dropped to /. For the non-ablating cold-wall case, where very little NO was created in the first place, no NO remains above free-stream levels. Importantly, none was created in the recirculation zone, which remained at the relatively low temperature of 1100 K due to the cold wall. Also, the level of NO increases dramatically for the warmer-walled cases just above the upper bounding shock, point A in Figure 25a, indicating that the bulk of NO in the wake is dumped in from the separated boundary layer and viscous mixing zone. In light of these observations, it is concluded that NO produced at the nose is the primary source of that species, but its level is dramatically effected by the degree of ablation and wall temperature downstream of the nose.
Nitrosonium, following similar trends but with a depletion from / in the stagnation region to the order of / in the wake. The cold-wall ablating case fared better here, reaching the order of unity but still remaining quite low. Carbon dioxide and cyanogen, pictured in Figure 26, follow very similar trends. CO2 levels peak at / as in the stagnation region, and CN peak at / for all cases, a good deal lower than the / levels reached in the stagnation region.
With the sources of observable species accounted for, discussion shall hereafter focuses less on the chemistry and more on the products of the chemistry; the non-normalized number densities of those chemical species which lead to the possibility of detection. Figure 27 and Figure 28 show the non-normalized number densities of the observable species in the wake cross-sectional slice. With the normalization removed, most species show a decrease in number density. CO2 is seen to reach / in the wake, while CN reaches /. Levels of NO actually drop below freestream values in the recirculation zone, but otherwise reach one order of magnitude higher than freestream levels. NO+ reaches 5 orders of magnitude higher than the freestream values. The non-ablating cold-wall case failed to produce any detectable species, emphasizing the critical role that the ablative species play in production of an electromagnetically active wake. Given the substantially lower levels of air-species NO and NO+ in the cold-walled case than its warmer-walled counterparts, it is concluded that, carbon-based species from ablation aside, cooler walls—regardless of nose conditions—produce significantly less visible wakes.
Given the results discussed above, the non-ablating cases are not explored further. The laminar case is also explored no further, because downstream of the neck, to the extent that laminar flow may exist at the present angle of attack over the body of the vehicle, it is the opinion of the authors that flow downstream of the neck is certainly turbulent. As a result, the laminar case produces non-physical results downstream of the neck which, regardless of relaxation settings, CFL or other numerical settings the authors could not remove. Given the highly supersonic nature of the wake flow downstream and outside the neck, the downstream instabilities are not anticipated to have influenced the upstream results significantly.
Visible species in the wake core will now be investigated. Figure 29 repeats Figure 15 for convenience, including now the number density of CO2 in the wake core, revealing several interesting features. First is that, as the wake rapidly cools beyond the neck, CO2 and other species from the impinging boundary layer and mixing region pour into the core, increasing the number densities of a every species significantly. All species increase the number density by a factor of 4 owing to the recovery to freestream densities from vacuum of the base. Despite this increase, given the very cool temperatures downstream of the neck, it is unlikely that the carbon-based species will be radiating at levels above the ambient noise. Furthermore, the species then begin to dissipate as they mix with the outer layers of the wake and the freestream beyond.
A second observation is that the recirculation zone produces a very hot environment rivaling the nose stagnation temperature for the adiabatic case but is otherwise significantly cooler than the recompression zone. Number densities of the species of interest climb for all cases as they approach the throat, and diminish from there. This may seem counterintuitive; if the recirculation zone is quite hot and is furthermore fed by the boundary layer products, one may intuit that it should in fact have a higher chemical composition. In fact, the chemical concentrations of the chemically reactive species are quite high in the recirculation zone as seen previously, but because the density is so low in that zone, the neck and wake actually contain higher number densities.
3.4. Catalysis
The cases discussed thus far have been uniformly non-catalytic. However, catalysis can also produce substantial differences in heat transfer to the body and the resultant chemistry around the body and in the wake [4]. As flow temperatures increase, the influence of surface catalysis also increases. The reason for this is that with higher temperatures, increased levels of atomic species are recombined on the surface, and the increased energy required to hold the atomic state, released by the catalysis, is dispatched into the wall with the result of higher heat transfer at the wall [4]. The preceding discussion is not repeated in full to include the effects of catalysis, but the results are shown at the wake cross section in Figure 30 for the ablating radiative equilibrium case. Catalysis was set to “Fully Catalytic”, meaning that all atomic species are catalyzed into molecular species, making the ratio of specific heats of each species, on the surface where is the ratio of specific heats of each species. This is in contrast to the setting by the non-catalytic condition of .
Figure 30, Figure 31 and Figure 32 reveal that, although the wake temperature is not necessarily strongly affected by the catalysis, the chemistry is substantially shifted by its presence. Catalysis results in a roughly two-thirds reduction in observable species across the board, with the exception of CN. The reason for this reduction is the lower levels of atomic species which are generally responsible for production of observable species. In the catalytic condition, these species become more scarce near the surface, which is the only zone where they were generally to be found, as seen in Figure 32b.
3.5. Reduction in Ablative Surfaces
The final area of analysis is the effect of increasing or decreasing the amount of ablating material in the flowfield. While from the above discussion it may seem reasonable to conclude that less ablation might lead to a smaller degree of observable species, the following demonstrates that the relationship between ablating products and visible products in the wake is non-linear. Figure 33 shows the comparative sizes of the regions of ablation. The cases discussed previously were run with the “Big” ablation scenario, wherein a portion of length 0.45 m was allowed to ablate, although the blowing rates show that the amount of ablation downstream of immediate nosetip was only that of the stagnation zone. However, despite the small rate, the extra length added an order of magnitude more CO2 into the flow, as seen in Figure 34b. Figure 34 is taken at the wake cross-sectional slice and also shows the temperature distribution through the wake, which is unaffected by the temperatures at the nose. The decrease in CO2 allowed more atomic oxygen produced in the stagnation zone to persist, producing counterintuitive results depending on wall temperature downstream of the ablating portion.
Figure 35 shows the NO and electron number densities. NO is seen to increase by a factor of two for the smaller radiative equilibrium case, whereas it decreases by two thirds for the adiabatic case. The reason for this becomes apparent in Figure 36, where the adiabatic case produces twice as much CN due to its very high temperatures, consuming the freed atomic nitrogen. In the radiative equilibrium case, the atomic nitrogen is instead consumed by the formation of N2 and NO, as is the freed atomic oxygen. Finally, referring again to Figure 35, electron density for NO jumps an order of magnitude for the smaller radiative equilibrium case as the extra NO collides with molecular oxygen and nitrogen to form nitrosonium. Electron density also jumps by a factor of five for the smaller adiabatic case by the collision of the freed atomic nitrogen and oxygen to form nitrosonium and its associated ions.
4. Conclusions and Recommendations
The purpose of this study was to understand the fundamental flow phenomenon which affect the structures and chemistry within the wake of a generic sphere-cone traveling at moderate angle of attack. A special emphasis was placed upon the chemistry which leads to possible avenues of detection through the electromagnetic spectrum. The carbon dioxide, nitric oxide, cyanogen and electron density were used to assess the overall visibility of a vehicle. Because of the parametric nature of this study, little information was assumed about the structural materials used or the thermal protection system implemented to protect the internal structure except that ablating material was made purely of carbon. Given the broad range of potential designs of hypersonic reentry systems, in addition to the possibility for a broad range of changes to the form factor which would keep the geometry close to that of the present shape while allowing some degree of maneuverability, those features of the vehicle which might significantly affect the structure and chemistry of the wake were examined. In particular, the effects of ablation, catalysis and heat transfer into the body were analyzed in order to provide some reasonable bounds within which such a system might be expected to operate. The impact on wake behavior of using a nose of a different material from the rear surfaces was also assessed.
Heat transfer to the body was modeled in the form of various boundary conditions. A cold-wall boundary condition was used to simulate a maximally efficient, actively-cooled wall. A wall which was able to radiate heat away, or otherwise absorb into the internal structures energy at a rate which was commensurate to that rate at which a carbon black body would emit the same energy, was also studied. Finally, a system which was able to absorb the enormous heat fluxes of hypersonic flight and survive while operating at extremely high temperatures was also studied. The effects of surface catalysis on each type of system were investigated. Key findings related to detectability:
- For the flight regime explored herein, temperature downstream of the ablating nose plays a dominant role in determining the levels of detectable species present in the wake.
- The production of NO and NO+ depends in very large part upon the presence of ablating species to catalyze production of the nitric species.
- Reducing surface temperature and catalysis behind an ablating nose reduces the carbon dioxide produced by as much as an order of magnitude. A very cold wall further reduces CO2 and all other emissions. The opposite is also true.
- Minimizing the size of the ablating portion of the nose is not helpful to reduction of detectable species if the body heats up as a result. However, having no ablation at all is enormously helpful in reduction of all detectable species.
- Neither catalysis, ablation, nor nose conditions had any affect on temperature on the cone base. The cone base flow temperature was found to be a strong function of main body surface temperature.
- Based on the above, a study of cooling methodologies on the rear portion of the main body surface for (a) minimization of communications interference due to free electrons, (b) radiative species and (c) for protection of the base is recommended.
The structures on the body which affect the wake were also investigated. Key findings here include:
- Flow structures formed at the nose and shoulder were found to survive and persist until the end of the body, leading directly to distinct structures and associated layers of species within the wake.
- Gradients caused by nose bluntness and acceleration around the shoulder were found to meaningfully affect the components of the wake, and so an analysis of wake composition changes based on nose geometry is recommended.
- The recompression shock formed by the neck causes the highest gradients within the wake, and its effects could be diminished by disruption of the boundary layer which feeds it. A study of afterbody shape factor is therefore recommended.
- The location of the neck was seen to shift only minutely with wake and body temperature.
- Neither temperature, ablation nor catalysis were found to significantly affect surface pressure distribution.
Author Contributions
Robert Greendyke conceived of this effort, having sponsored a Master’s Thesis topic on the material in the past (Kania 2015), which formed the basis for the effort. Greendyke asked Matthew Satchell to investigate further. Matthew performed all simulations used herein and was sole author of the paper. Matthew tasked Jeffery Layng with some early exploration whose results were not ultimately presented but were tremendously informative in ultimate identification of the scope of the effort. Jeffery was also tremendously helpful in identifying improvements to the paper.
Conflicts of Interest
The authors declare no conflict of interest.
References
- Kania, M.A. Analysis of Hypersonic Vehicle Wakes. Master’s Thesis, Air Force Institute of Technology, Greene County, OH, USA, 2015. [Google Scholar]
- Anderson, J.D. Hypersonic and High Temperature Gas Dynamics; AIAA Education Series; American Institute of Aeronautics and Astronautics: Reston, VA, USA, 2006. [Google Scholar]
- Gupta, R.N. A Review of Reaction Rates and Thermodynamic and Transport Properties for an 11-Species Air Model for Chemical and Thermal Nonequilibrium Calculations to 30,000 K; NASA Reference Publication 1232; NASA Langley Research Center: Langley, VA, USA, 1990.
- Gnoffo, P.A.; James, W.K.; Harris Hamilton, H., II; Olynicky, D.R.; Venkatapathyz, E. Computational Aerothermodynamic Design Issues for Hypersonic Vehicles; AIAA: Reston, VA, USA, 1999. [Google Scholar]
- Park, C. Nonequilibrium Hypersonic Aerothermodynamics; John Wiley & Sons: Hoboken, NJ, USA, 1990. [Google Scholar]
- Tropf, W.J.; Thoams, M.E.; Harris, T.J.; Lutz, S.A. Performance of Optical Sensors in Hypersonic Flight; Johns Hopkins APL Technical Digest V08; The Johns Hopkins University Applied Physics Laboratory: Laurel, Maryland, 1987. [Google Scholar]
- Gnoffo, P.A.; Johnston, C.O.; Thompson, R.A. Implementation of Radiation, Ablation, and Free Energy Minimization in Hypersonic Simulations. J. Spacecr. Rocket. 1971, 47, 251–257. [Google Scholar] [CrossRef]
- Barnhardt, M.D.; Candler, G.V. Modeling and Simulation of High-Speed Wake Flows. Ph.D. Thesis, University of Minnesota, Minneapolis, MN, USA, 2009. [Google Scholar]
- Mazaheri, A.; Gnoffo, P.A.; Johnston, C.O.; Kleb, B. LAURA Users Manual: 5.5-65135; NASA TM-2013-217800; NASA: Langley, VA, USA, 2017.
- Lykoudis, P.S. A review of hypersonic wake studies. AIAA J. 1966, 4, 577–590. [Google Scholar]
- Muramoto, K.K. Model for Predicting Hypersonic Laminar Near-Wake Flowfields. J. Spacecr. Rocket. 2015, 33, 305–307. [Google Scholar] [CrossRef]
- Zhong, J.; Ozawa, T.; Levin, D.A. Comparison of High-Altitude Hypersonic Wake Flows of Slender and Blunt Bodies. AIAA J. 2008, 46, 251–262. [Google Scholar] [CrossRef]
- Park, G.; Gai, S.L.; Neely, A.J. Base Flow of Circular Cylinder at Hypersonic Speeds. AIAA J. 2016, 54, 458–468. [Google Scholar] [CrossRef]
- Barnhardt, M.; Candler, J.V. Detached-Eddy Simulation of the Reentry-F Flight Experiment. J. Spacecr. Rocket. 2012, 49, 691–699. [Google Scholar] [CrossRef]
- Hinman, W.S.; Johansen, C.T. Reynolds and Mach Number Dependence of Hypersonic Blunt Body Laminar Near Wakes. AIAA J. 2017, 55, 500–508. [Google Scholar] [CrossRef]
- Lin, T.C.; Sproul, L.K.; Kim, M.; Olmos, M.; Feiz, H. Hypersonic Reentry Vehicle Wake Flow Fields at Angle of Attack. In Proceedings of the 44th AIAA Aerospace Sciences Meeting and Exhibit, Reno, NV, USA, 9–12 January 2006. [Google Scholar]
- Stainback, P.C. Effect of Unit Reynolds Number, Nose Bluntness, Angle of Attack and Roughness on Transition on a 5° Half-Angle Cone at Mach 8; NASA TN-D-4961; NASA Langley Research Center: Hampton, VA, USA, 1969.
- Gnoffo, P.A. An Upwind-Biased, Point-Implicit Relaxation Algorithm for Viscous, Compressible Perfect-Gas Flows; NASA TP 2953; NASA Langley Research Center: Langley, VA, USA, 2003.
- Gnoffo, P.A. Computational Aerothermodynamics in Aeroassist Applications. J. Spacecr. Rocket. 2003, 40, 305–312. [Google Scholar] [CrossRef]
- Gnoffo, P.A. CFD Validation Studies for Hypersonic Flow Prediction. In Proceedings of the 39th Aerospace Sciences Conference, Reno, NV, USA, 8–11 January 2001. [Google Scholar]
- Gnoffo, P.A.; White, J.A. Computational Aerothermodynamic Simulation Issues on Unstructured Grids. In Proceedings of the 37th AIAA Thermophysics Conference, Portland, OR, USA, 28 June–1 July 2004. [Google Scholar]
- Gnoffo, P.A. A Perspective on Computational Aerothermodynamics at NASA. In Proceedings of the Fluid Mechanics and Thermodynamics Conference, Gold Coast, Australia, 3–7 December 2007. [Google Scholar]
- Wilcox, D.C. Turbulence Modeling for CFD, 2nd ed.; DCW Industries: La Cañada Flintridge, CA, USA, 1994. [Google Scholar]
- Kimmel, R.L.; Adamczak, D.W. HIFiRE-1 Preliminary Aerothermodynamic Measurements. In Proceedings of the 41st AIAA Fluid Dynamics Conference and Exhibit, Honolulu, HI, USA, 27–30 June 2011. [Google Scholar]
- Schneider, S.P. Hypersonic Boundary-Layer Transition with Ablation and Blowing. J. Spacecr. Rocket. 2010, 47, 225–237. [Google Scholar] [CrossRef]
- Hruschka, R.; O’Byrne, S.; Kleine, H. Comparison of velocity and temperature measurements with simulations in a hypersonic wake flow. Exp. Fluids 2011, 51, 407–421. [Google Scholar] [CrossRef]
- Grasso, F.; Pettinelli, C. Analysis of laminar near-wake hypersonic flows. J. Spacecr. Rocket. 1995, 32, 970–980. [Google Scholar] [CrossRef]
- Balakumar, P.; Owens, L.R. Stability of Hypersonic Boundary Layers on a Cone at an Angle of Attack. In Proceedings of the 40th Fluid Dynamics Conference and Exhibit, Chicago, IL, USA, 28 June–1 July 2010. [Google Scholar]
- Jones, W.L., Jr.; Cross, A.E. Electrostatic-Probe Measurements of Plasma Parameters for Two Reentry Flight Experiments at 25,000 Feet Per Second; NASA TN D-6617; NASA Langley Research Center: Hampton, VA, USA, 1972.
- Johnston, C.O.; Gnoffo, P.A.; Mazaheri, A. Influence of Coupled Radiation and Ablation on the Aerothermodynamic Environment of Planetary Entry Vehicles. In Proceedings of the Radiation and Gas-Surface Interaction Phenomena in High Speed Re-Entry Meeting, Rhode-St-Genèse, Belgium, 6–8 May 2013. [Google Scholar]
- Harries, J.; Carli, B.; Rizzi, R.; Serio, C.; Mlynczak, M.; Palchetti, L.; Maestri, T.; Brindley, H.; Masiello, G. The Far Infrared Earth. Rev. Geophys. 2008, 46, RG4004. [Google Scholar] [CrossRef]
- Cummings, R.M.; Bertin, J.J. Critical Hypersonic Aerothermodynamic Phenomena. Annu. Rev. Fluid Mech. 2006, 38, 129–157. [Google Scholar]
- Huber, P.W. Hypersonic Shock-Heated Flow Parameters for Velocities to 46,000 Feet per Second and Altitudes to 323,000 Feet; NASA TR R-163; National Aeronautics and Space Administration: Washington, DC, USA, 1963.
- Bussing, T.R.A.; Eberhardt, S. Chemistry associated with hypersonic vehicles. J. Thermophys. Heat Transf. 1989, 3, 245–253. [Google Scholar] [CrossRef]
Figure 1.
A ballistic and a suppressed flight trajectory.
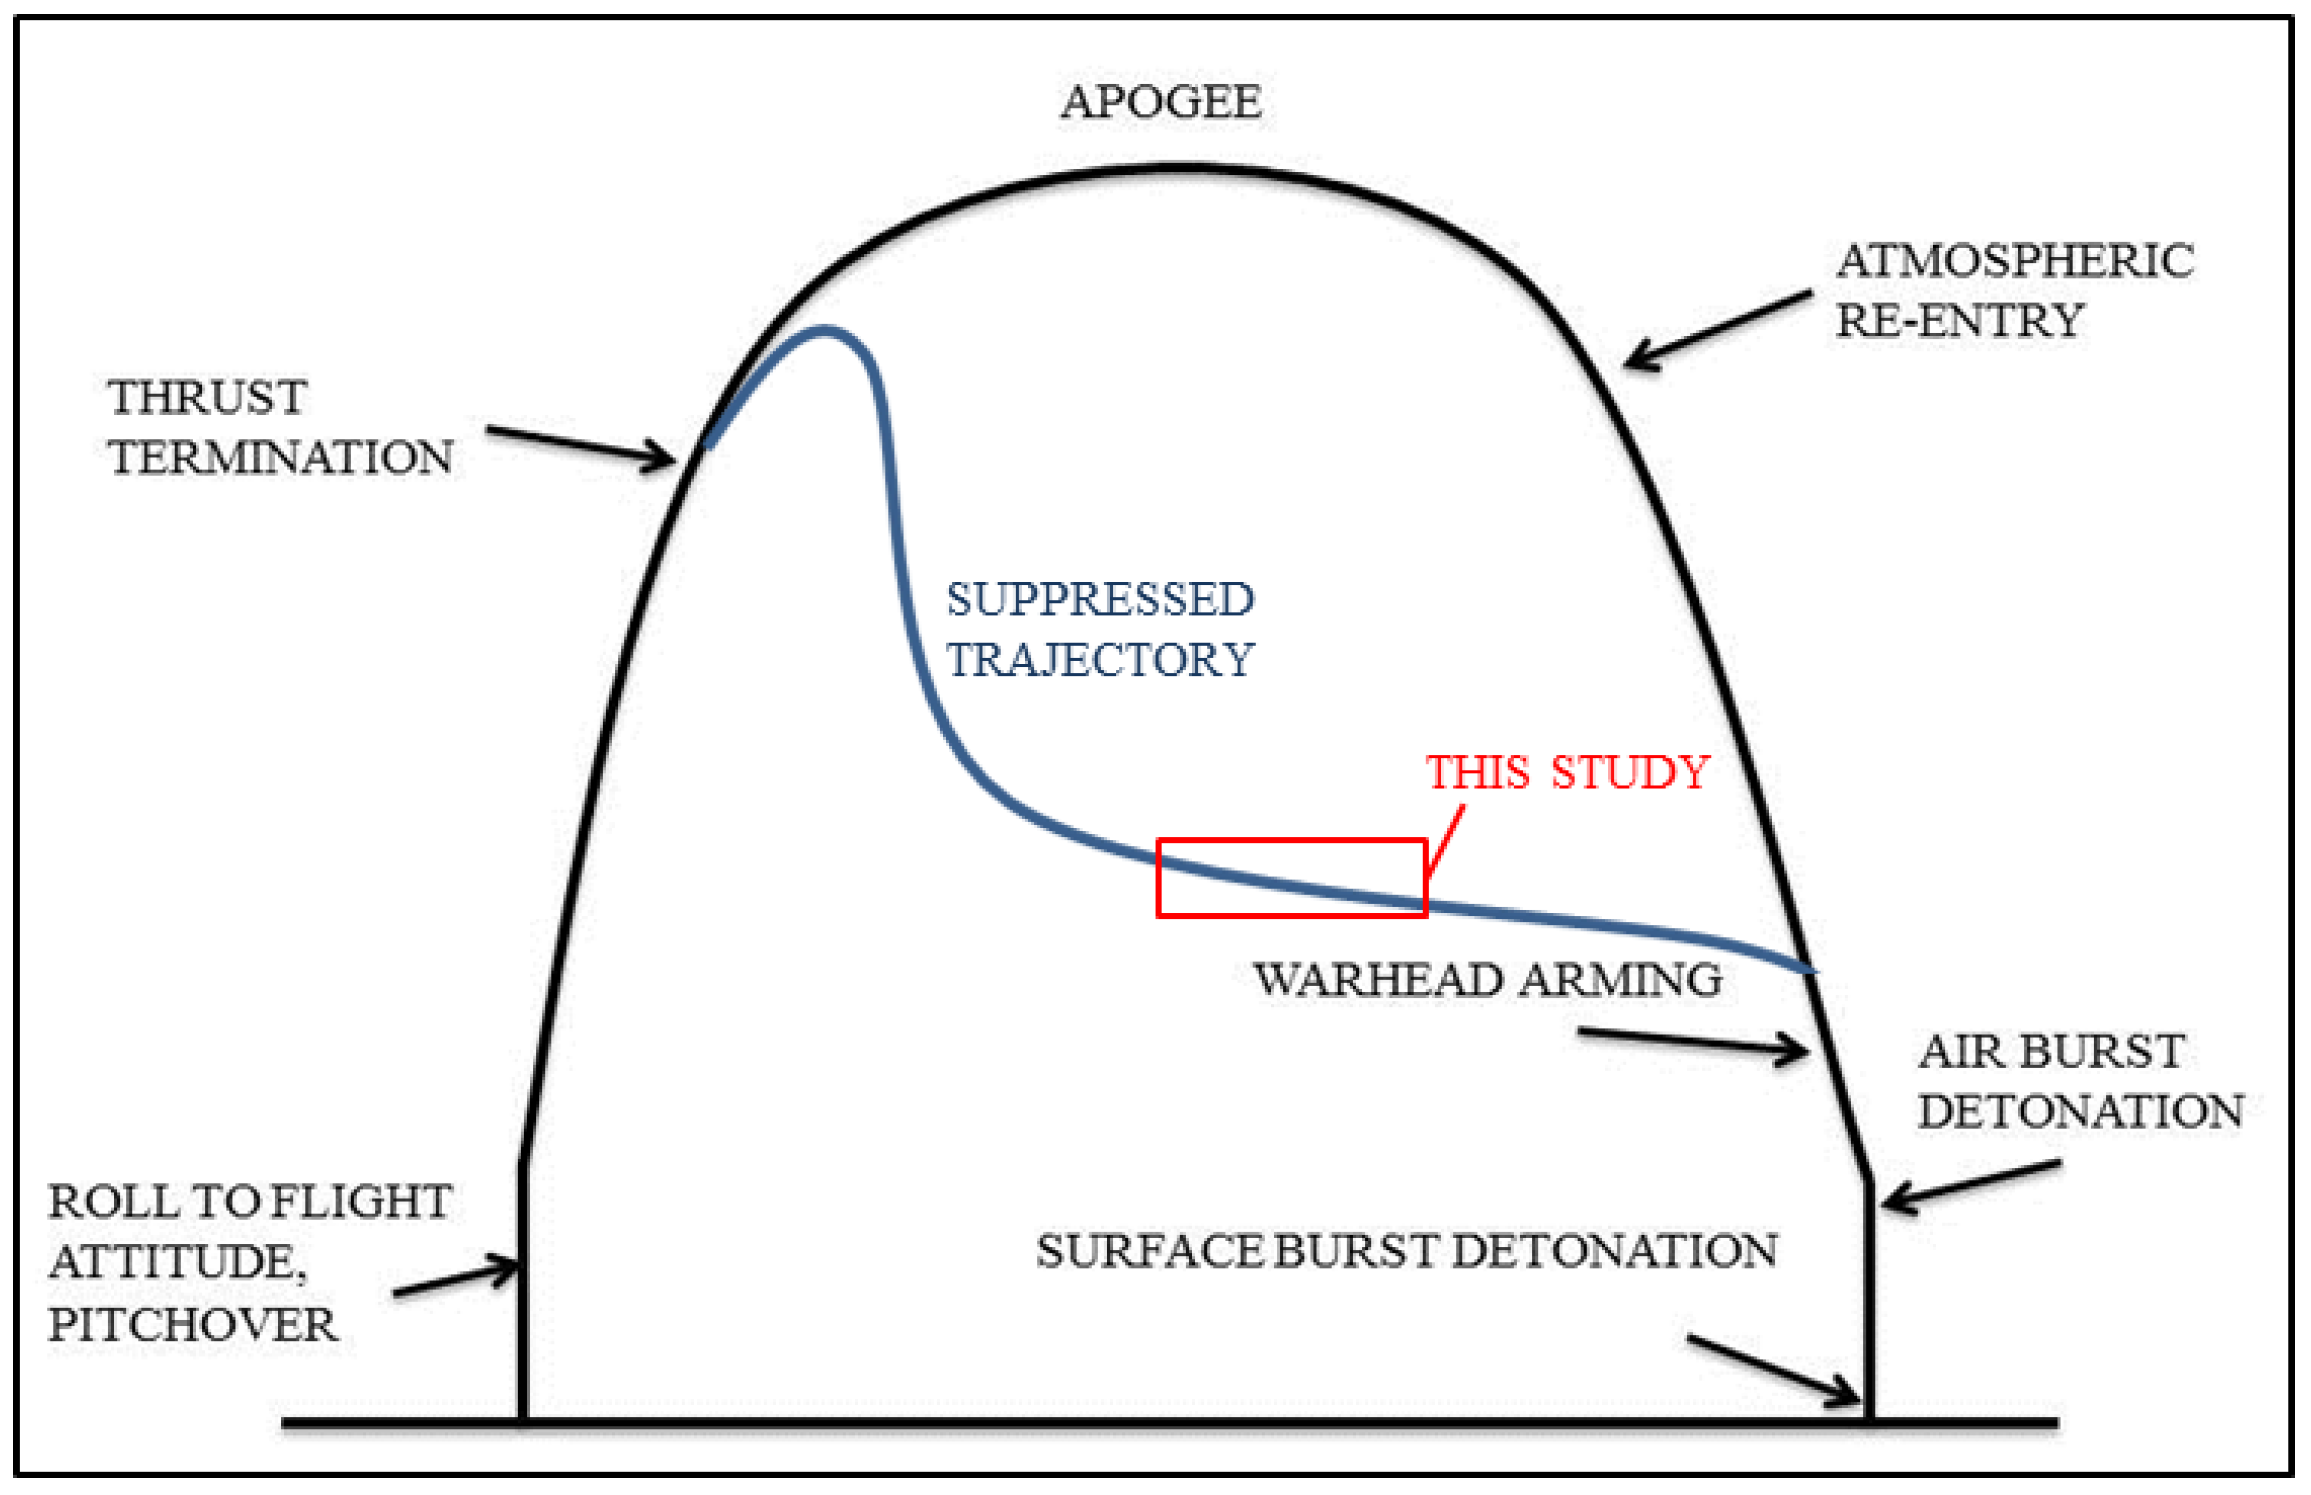
Figure 2.
Review of chemical makeup vs flight regime for a 30.5 cm radius sphere. Reproduced from NASA RP1232 [3].
Figure 2.
Review of chemical makeup vs flight regime for a 30.5 cm radius sphere. Reproduced from NASA RP1232 [3].

Figure 3.
Density gradients within a hypersonic wake (A) and Streamlines of a hypersonic wake (B).

Figure 4.
Butterfly topology on the nose of the vehicle.

Figure 5.
(a) Mesh at the stagnation region and (a) on the wall of the vehicle along the symmetry.
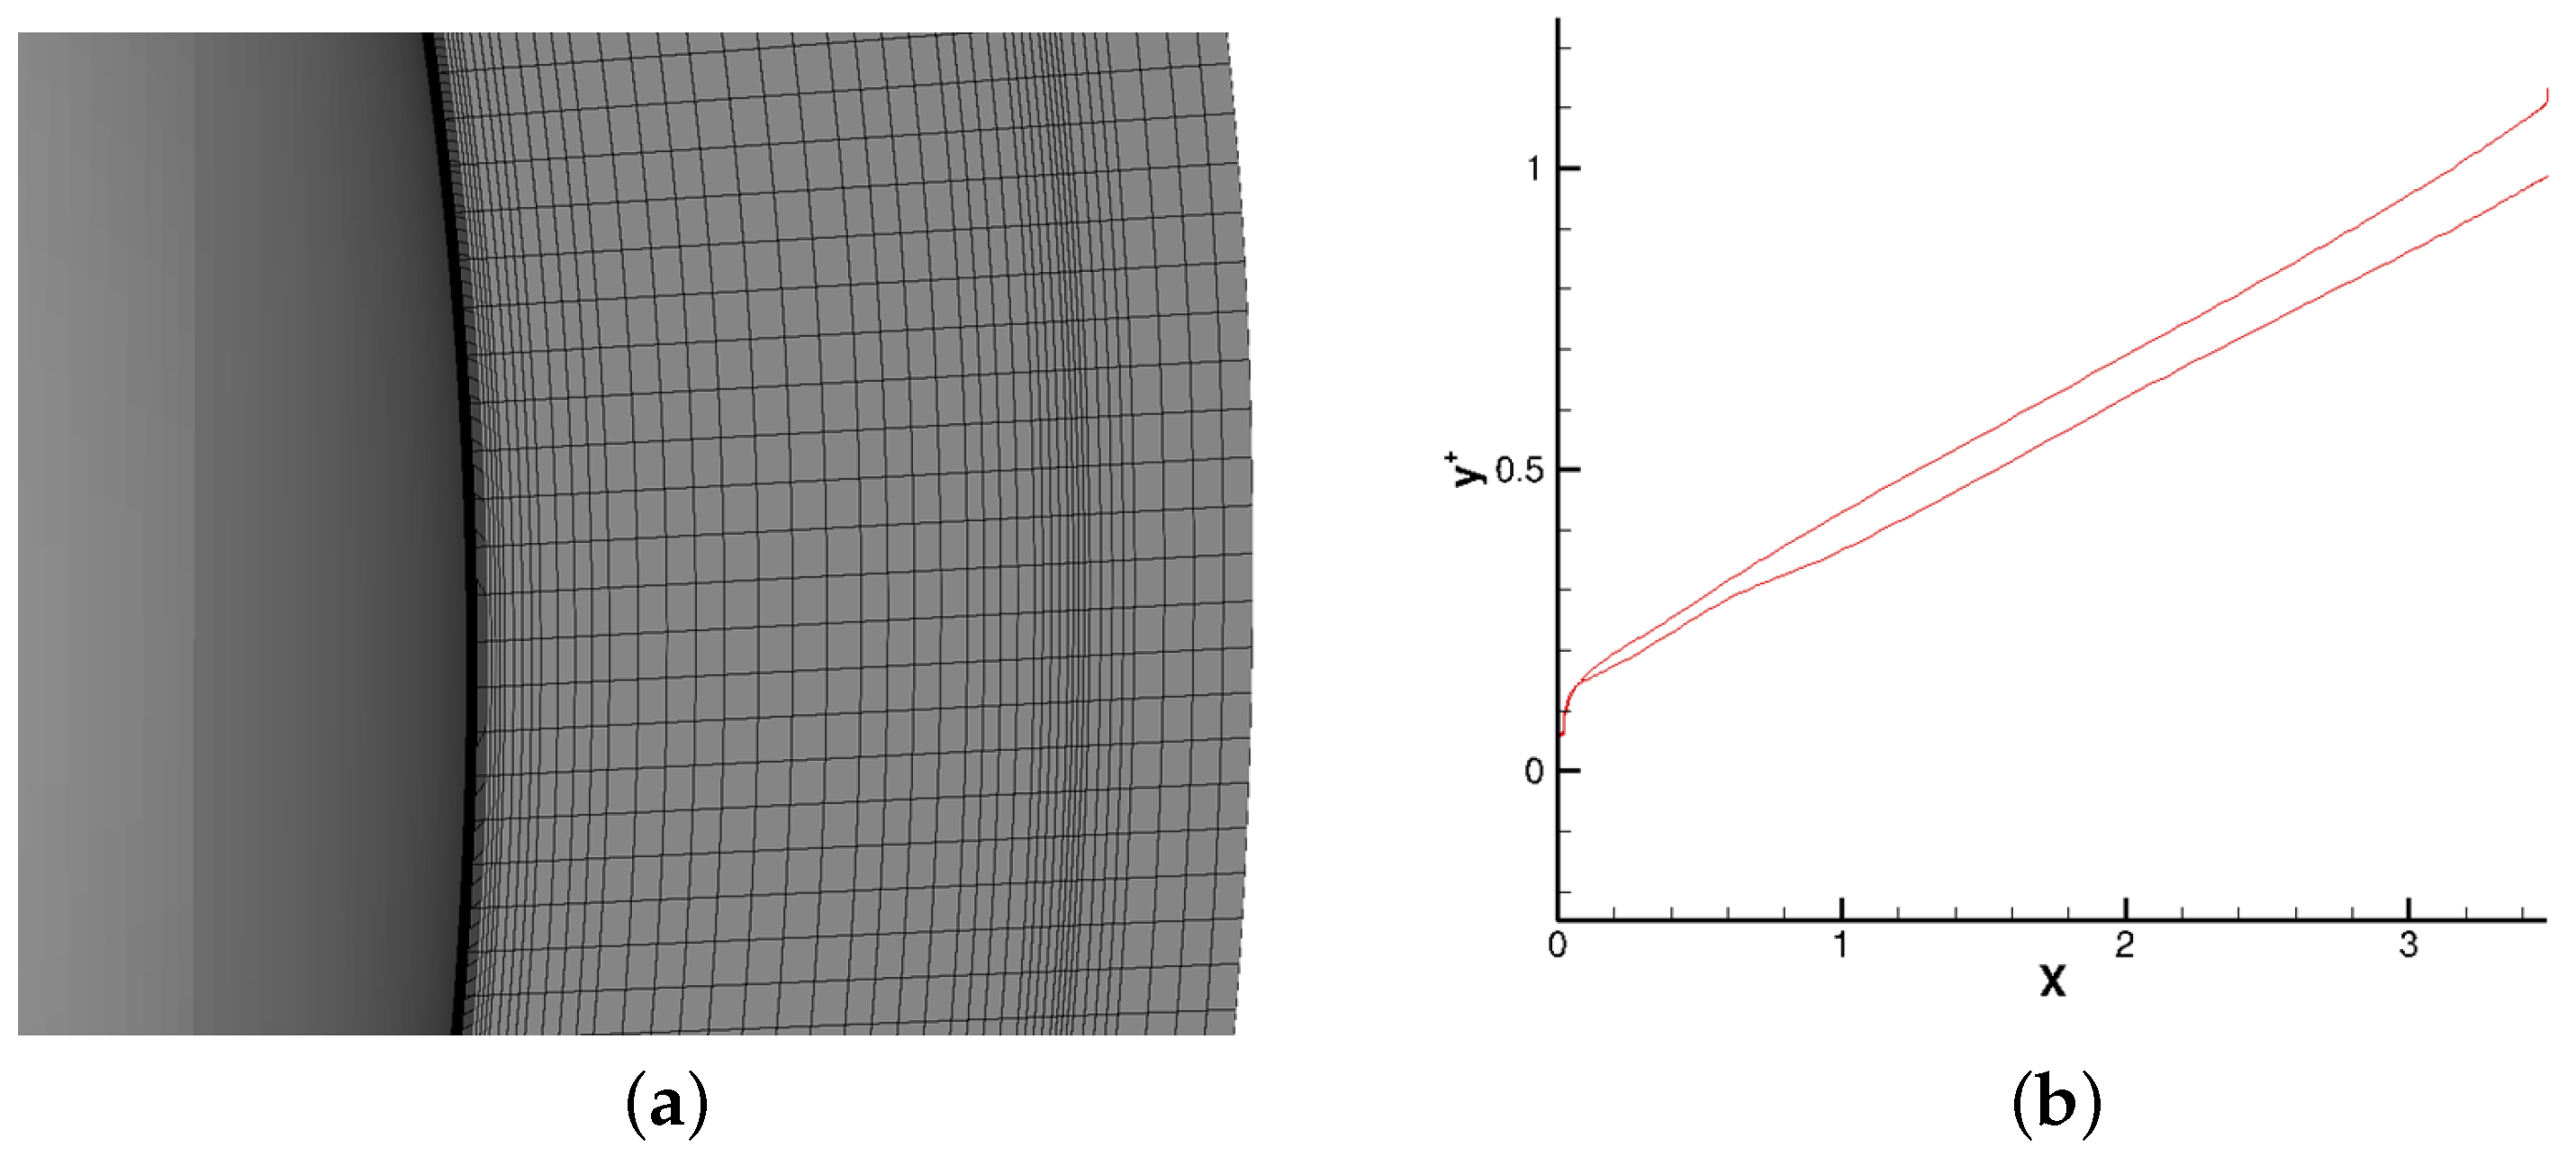
Figure 6.
Body flowfield mesh.

Figure 7.
Full Volume Grid along the symmetry.

Figure 8.
Coefficient of pressure (a) and Pressure (b) along the windward and leeward rays.

Figure 9.
Coefficient of pressure for the non-ablating radiative equilibrium case.
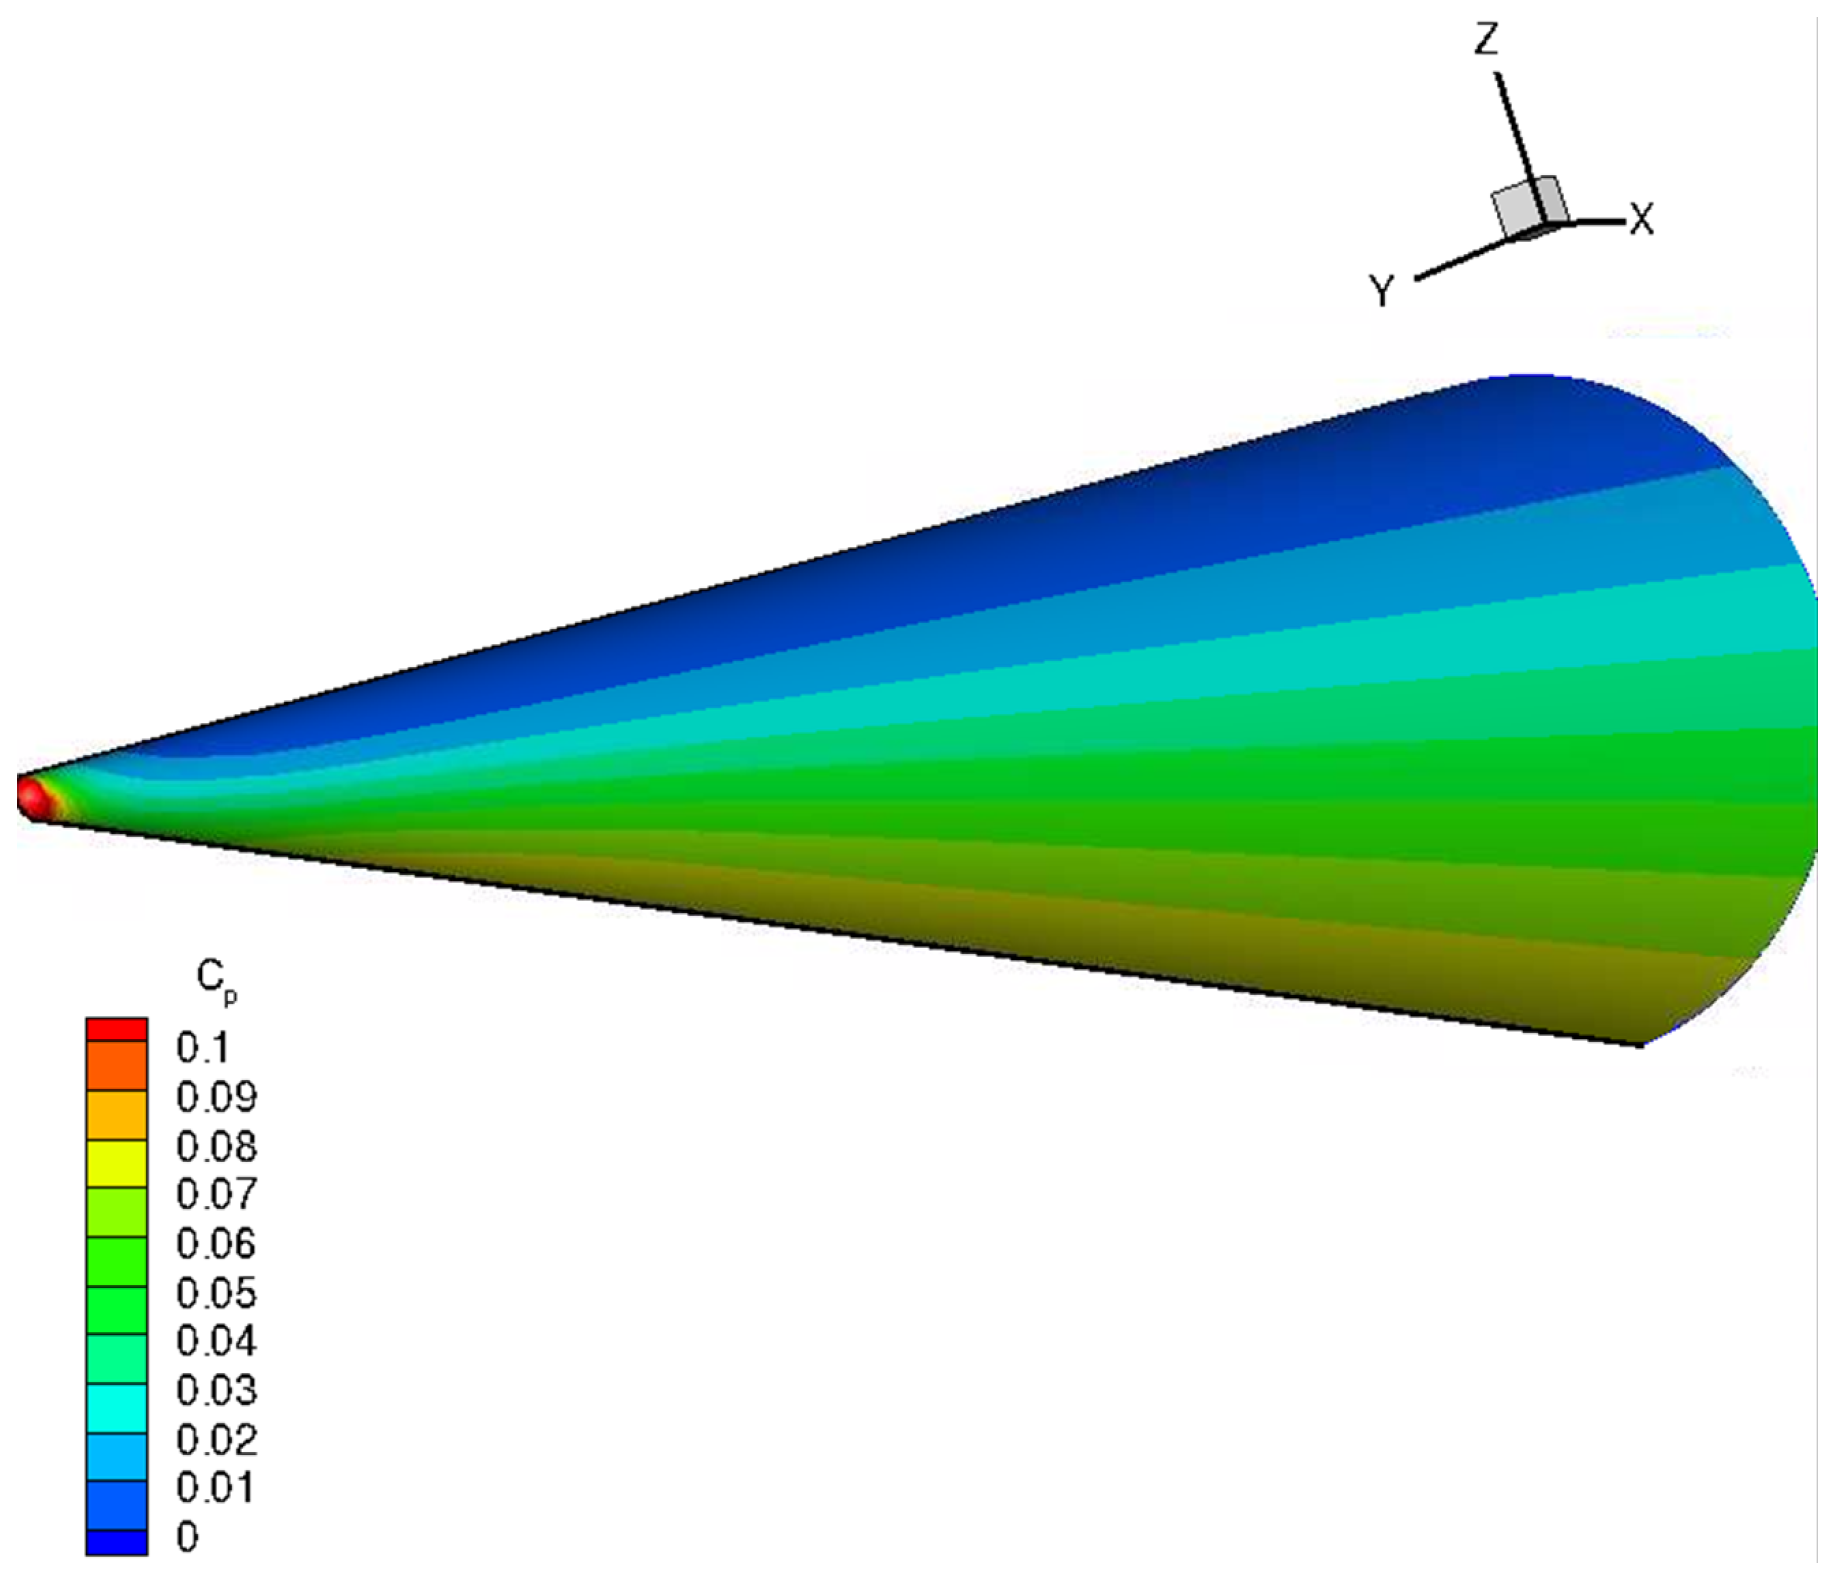
Figure 10.
Pressure readings along the HIFiRE surface, adapted from the HIFiRE-1 and HIFiRE-5 Test Results report in 2014 [24].
Figure 10.
Pressure readings along the HIFiRE surface, adapted from the HIFiRE-1 and HIFiRE-5 Test Results report in 2014 [24].
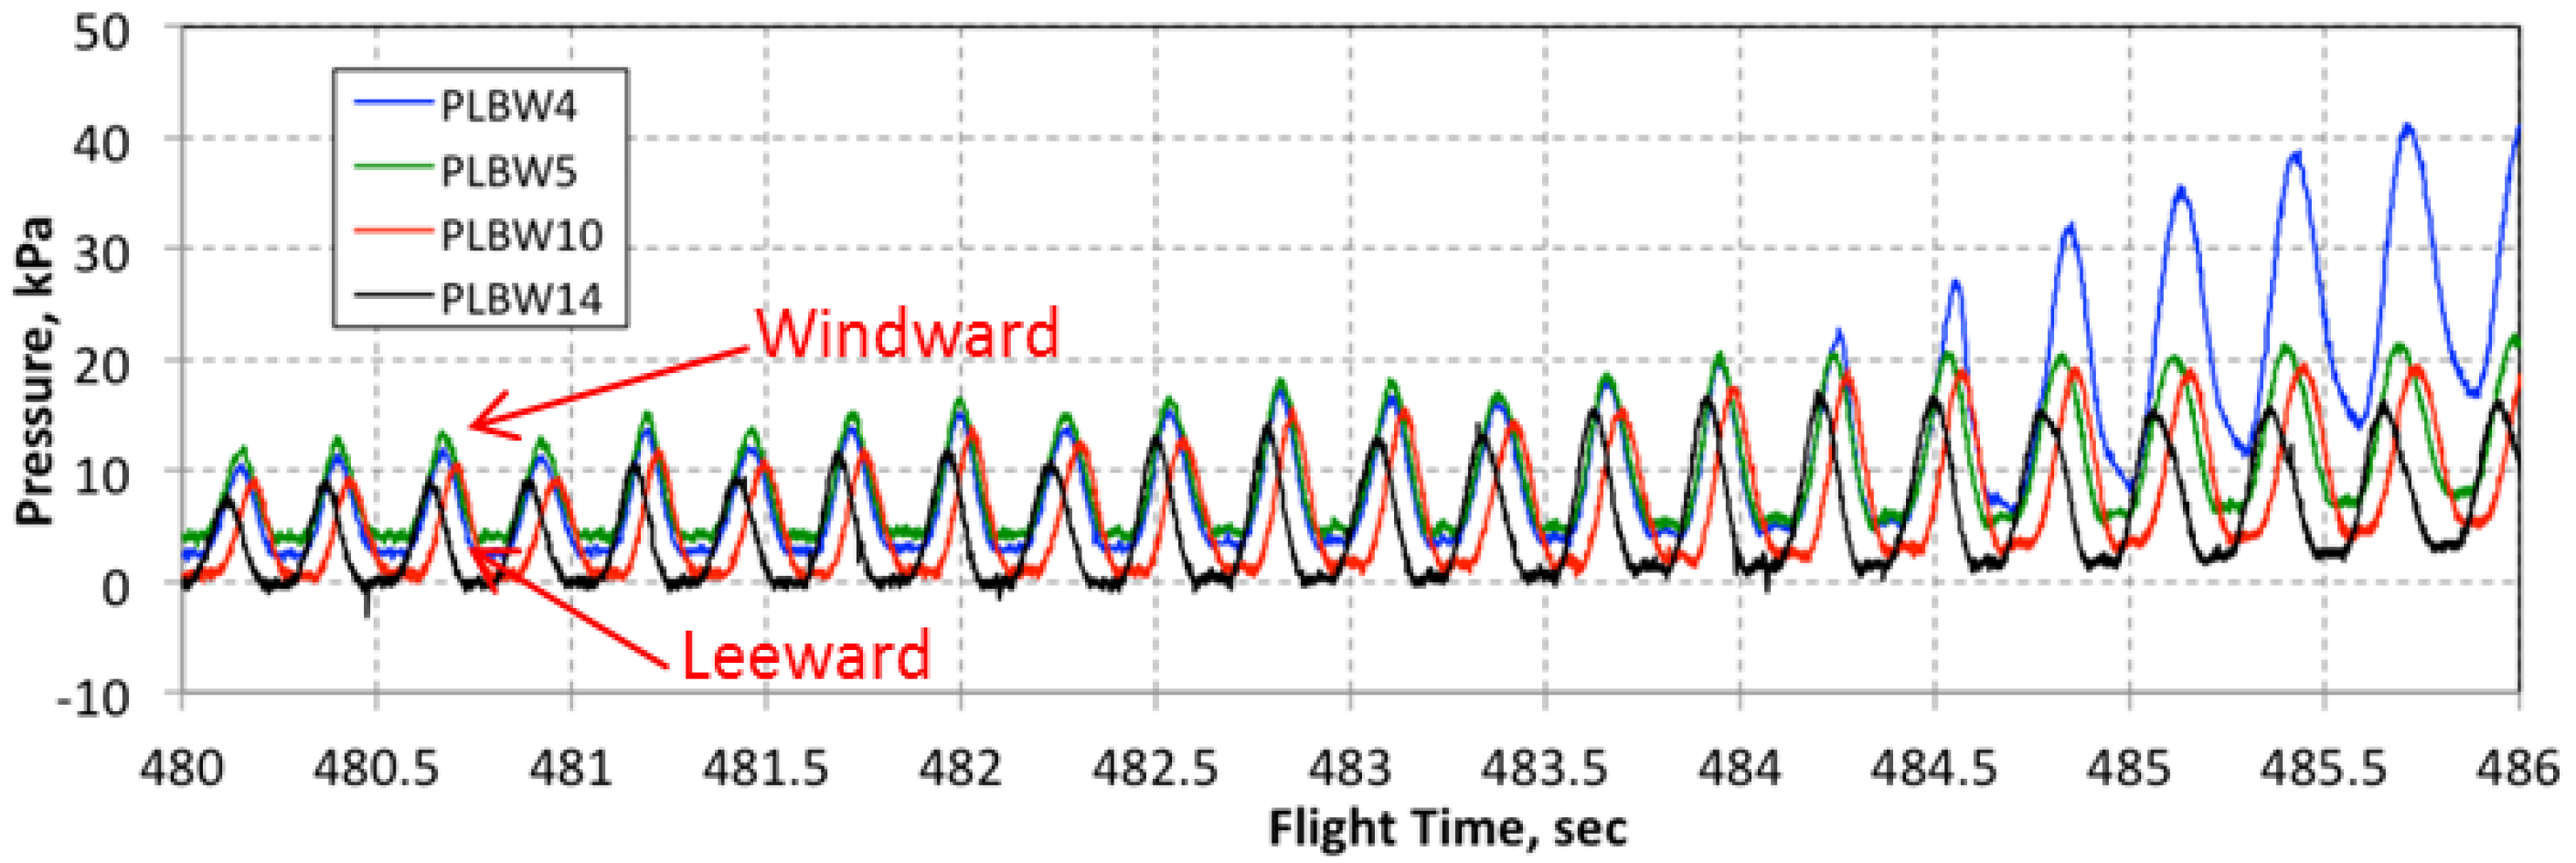
Figure 11.
Non-dimensional pressure ratio (a) along the wake centerline and (b) also those in the base region of the wake along the centerline. Normalized by .
Figure 11.
Non-dimensional pressure ratio (a) along the wake centerline and (b) also those in the base region of the wake along the centerline. Normalized by .

Figure 12.
Wake Centerline Mach number. Bars on experiment show range of experimental results [16].
Figure 12.
Wake Centerline Mach number. Bars on experiment show range of experimental results [16].

Figure 13.
Cone flow features at Mach 7, 30 km altitude, and 5 degrees angle of attack. (a) Density gradients along the cone; (b) Densities along the cone.
Figure 13.
Cone flow features at Mach 7, 30 km altitude, and 5 degrees angle of attack. (a) Density gradients along the cone; (b) Densities along the cone.
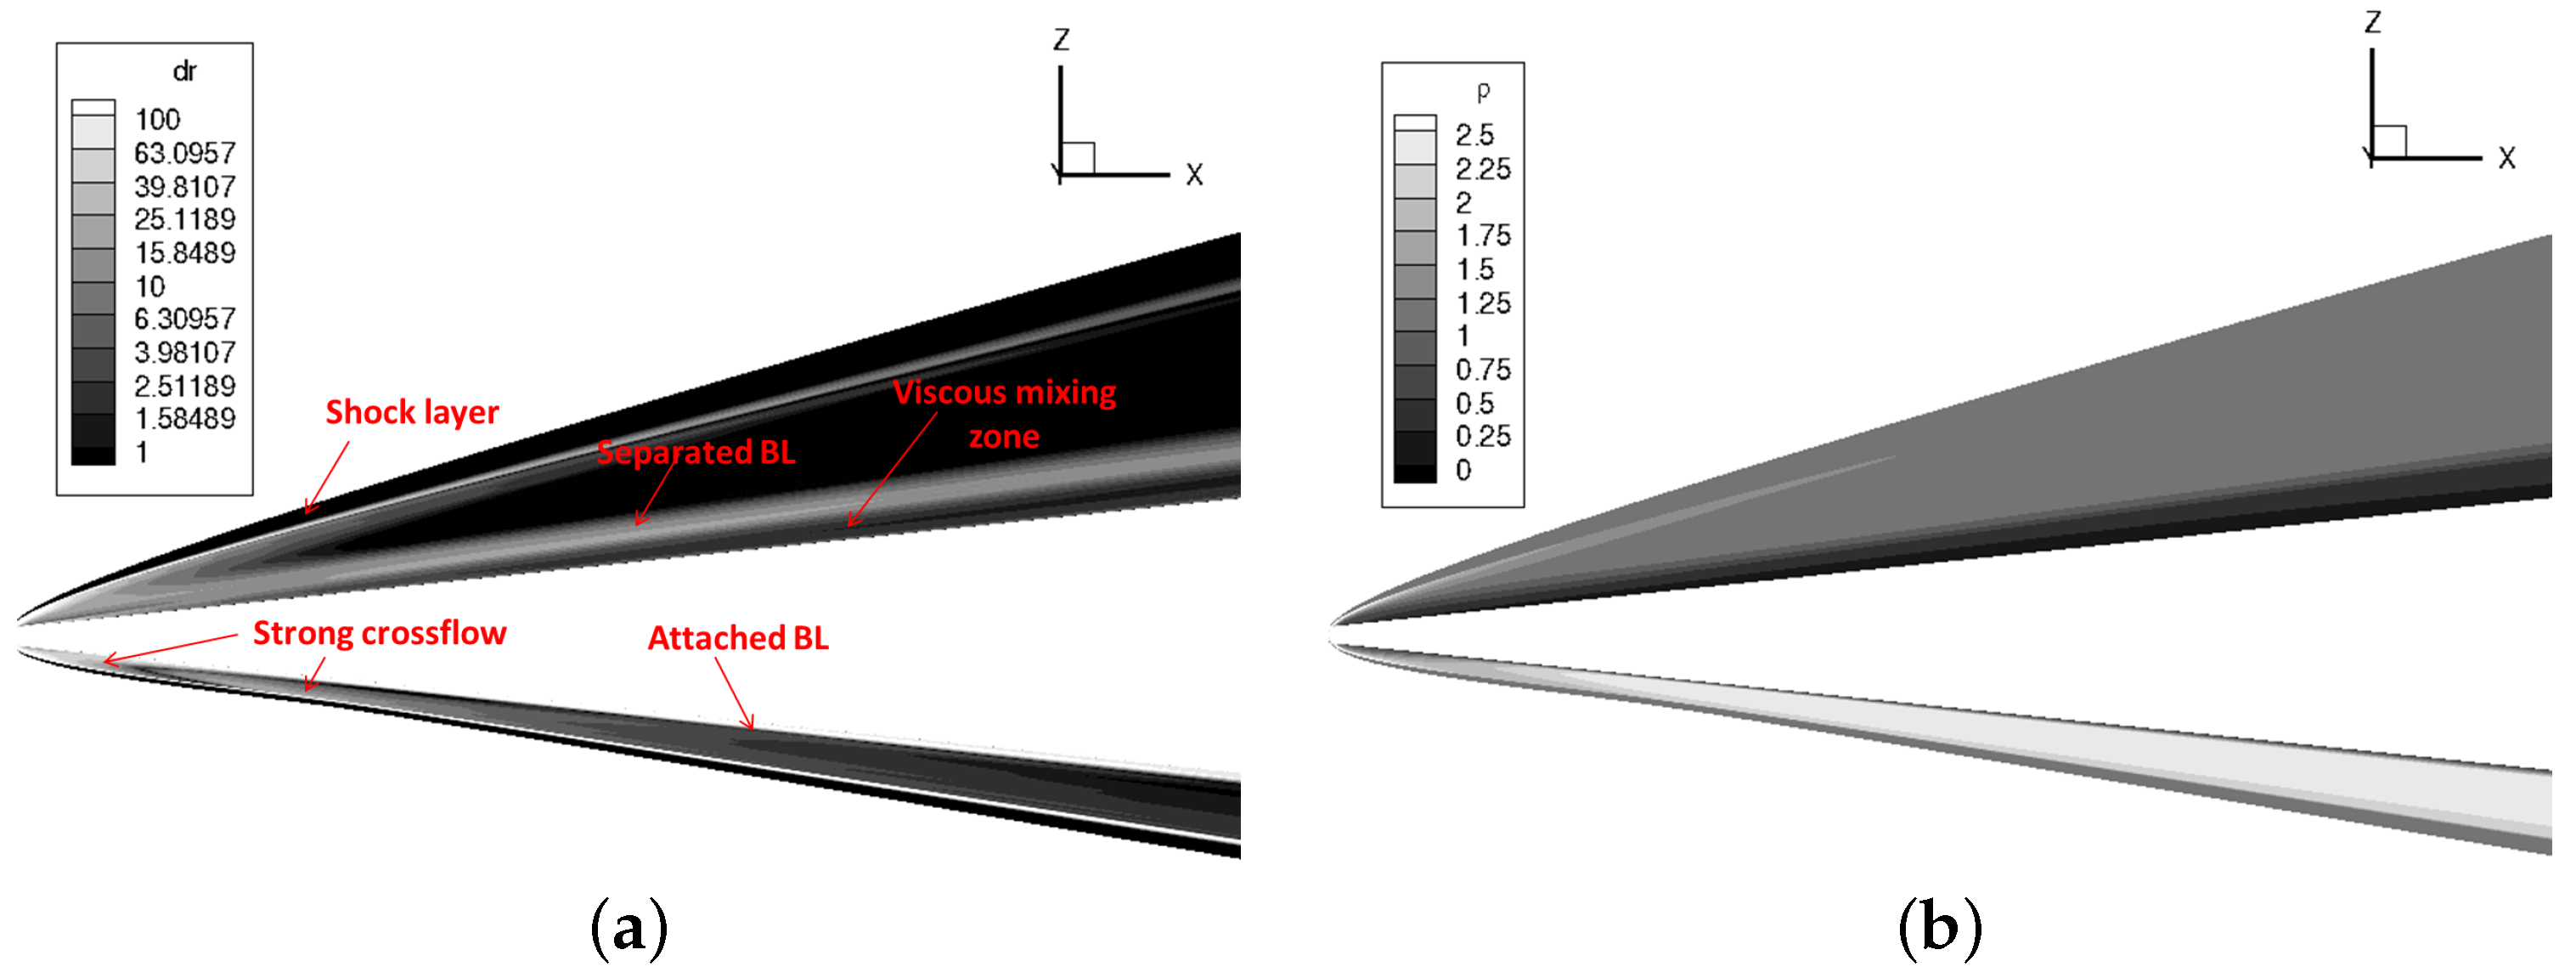
Figure 14.
(a) Plots of density gradients in the near-wake and (b) Streamlines to match it for the ablating adiabatic, non-catalytic case.
Figure 14.
(a) Plots of density gradients in the near-wake and (b) Streamlines to match it for the ablating adiabatic, non-catalytic case.

Figure 15.
(a) Temperatures along the top and bottom surfaces of the body for each thermal boundary condition (b) and along the wake centerline.
Figure 15.
(a) Temperatures along the top and bottom surfaces of the body for each thermal boundary condition (b) and along the wake centerline.
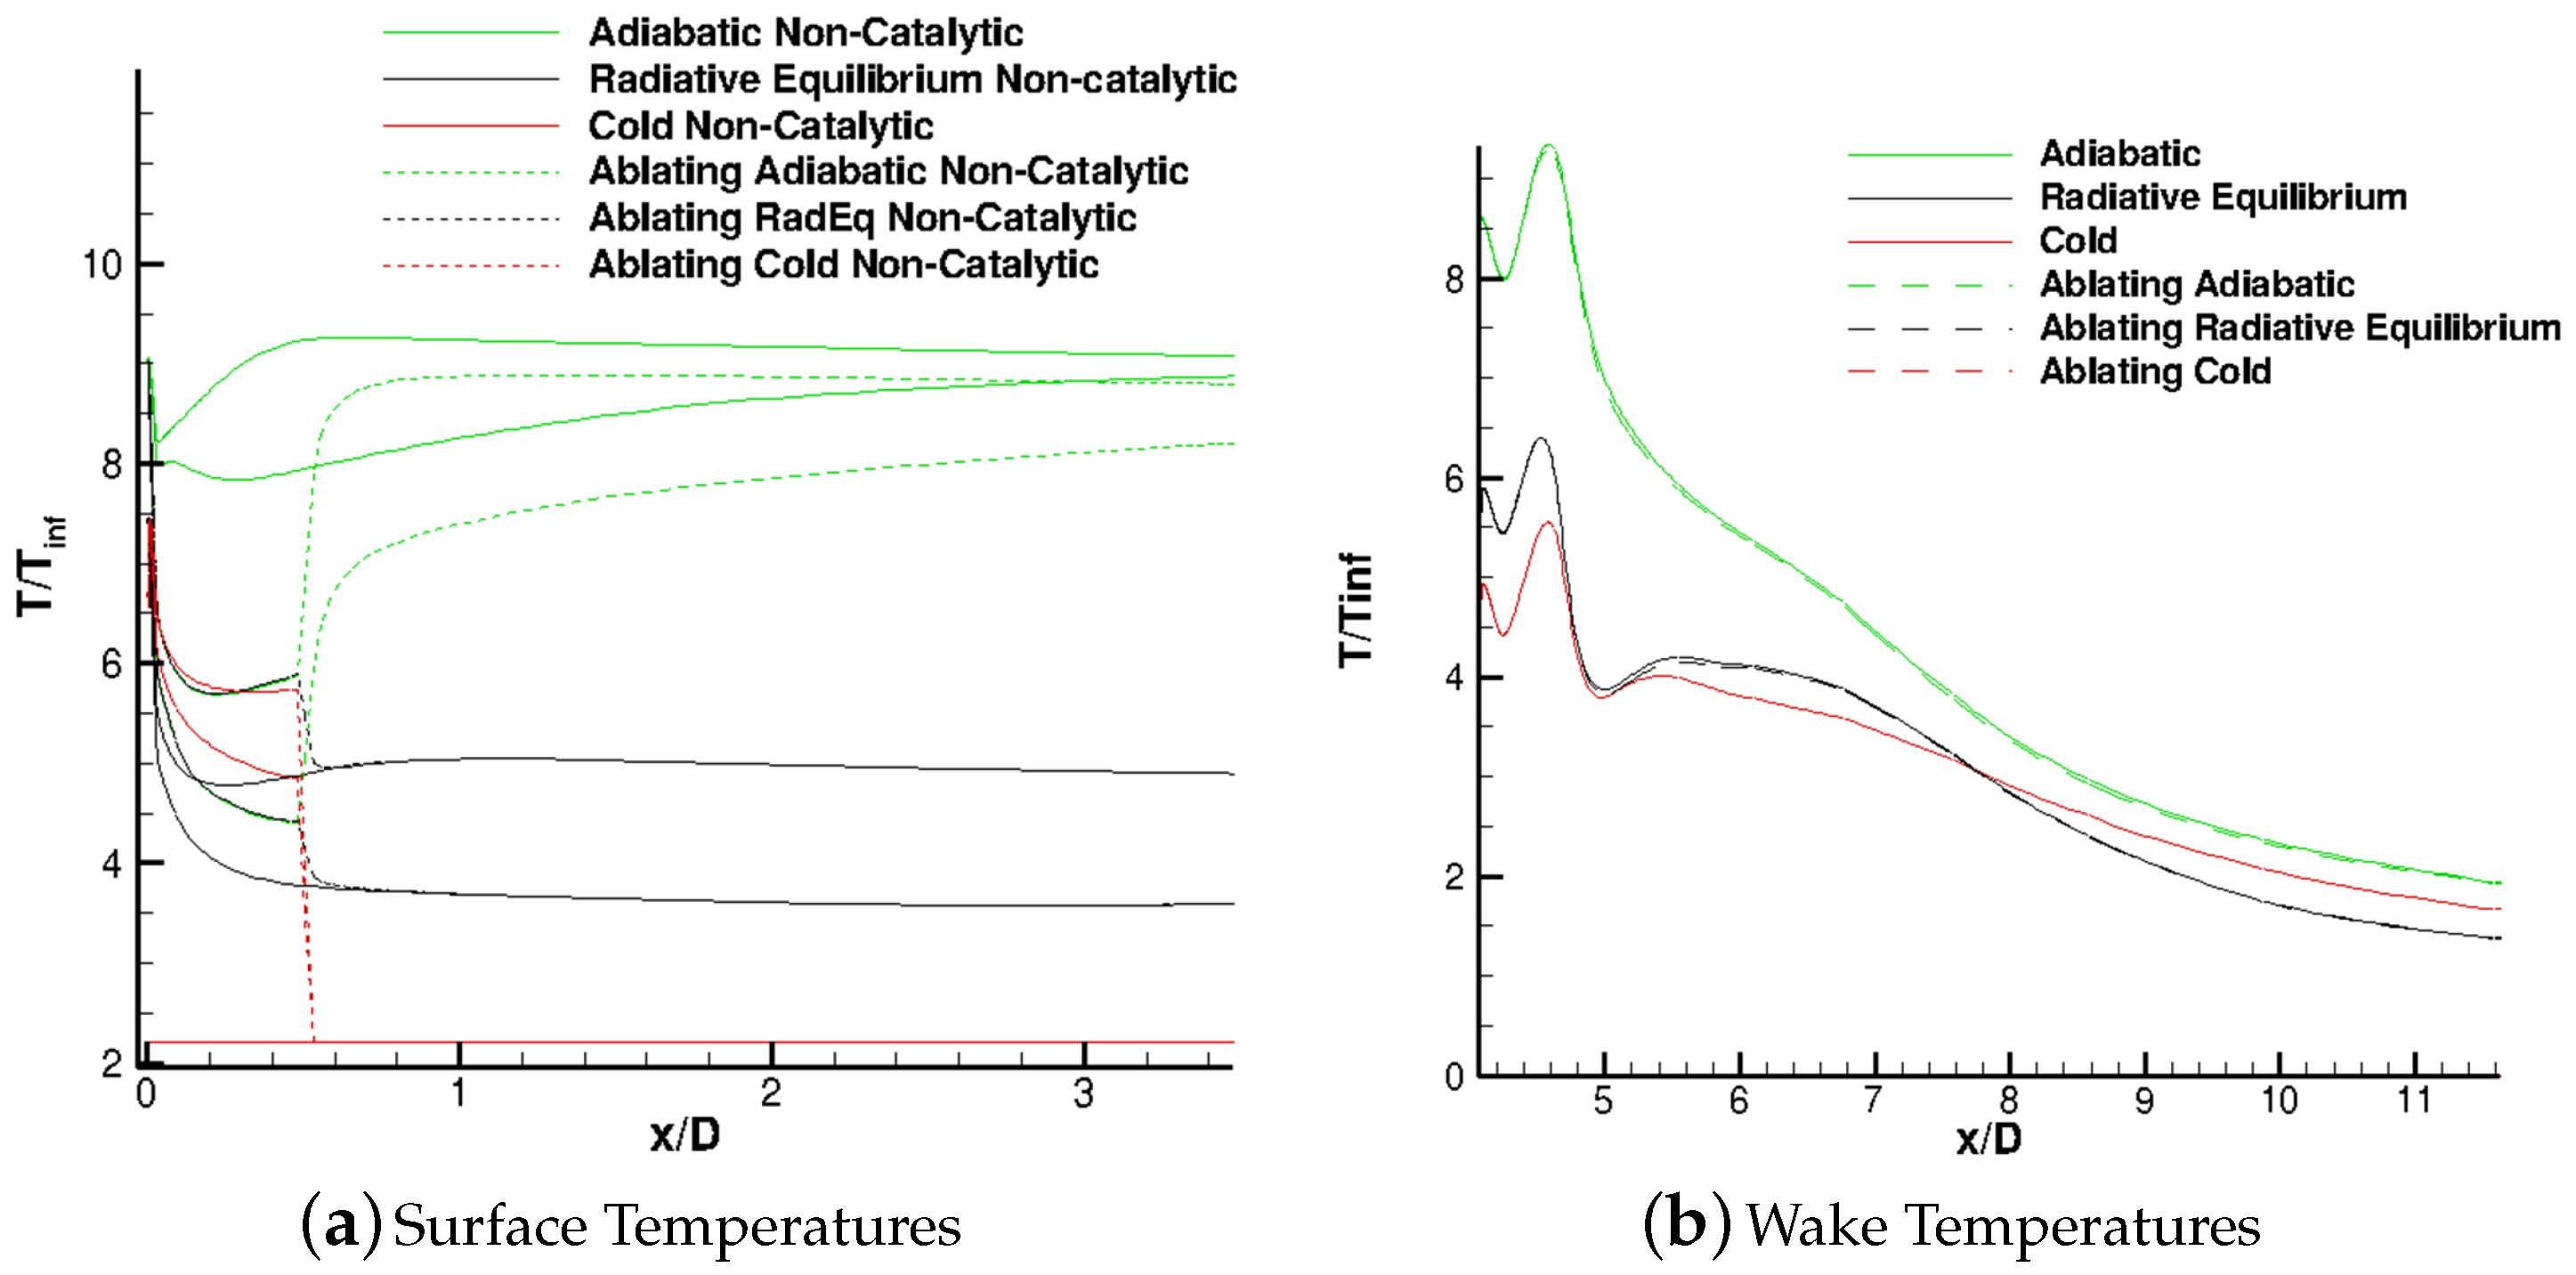
Figure 16.
(a) Nitric oxide NO number density and (b) Normalized number density of NO along the stagnation streamline.
Figure 16.
(a) Nitric oxide NO number density and (b) Normalized number density of NO along the stagnation streamline.
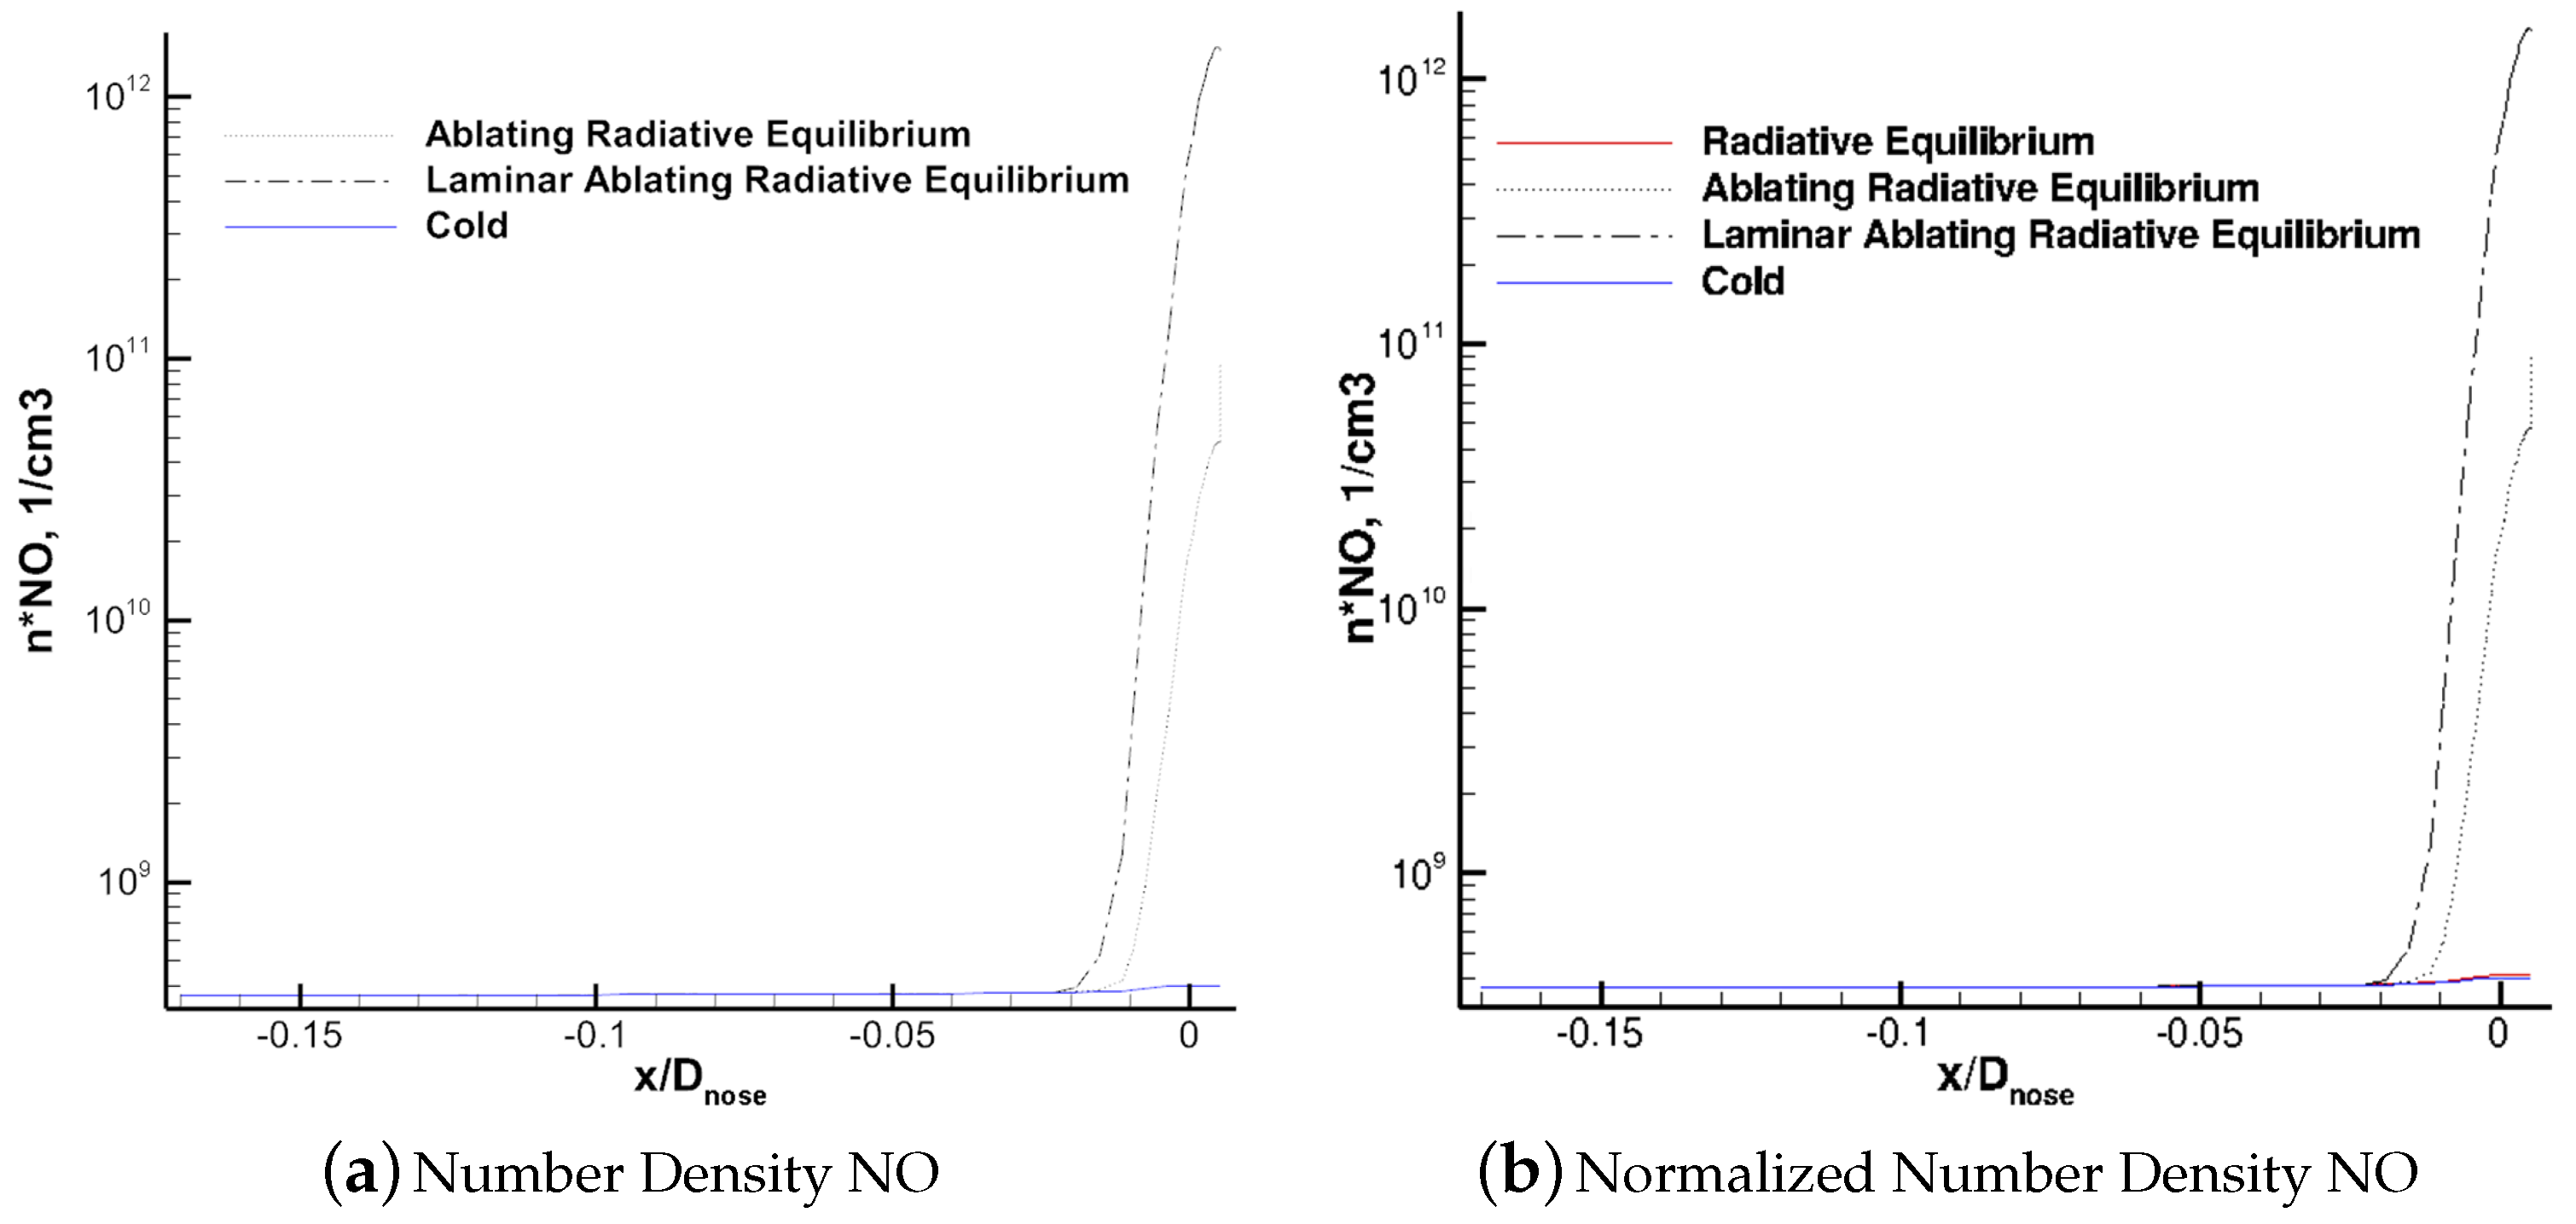
Figure 17.
Stagnation region atomic Nitrogen production due to NO+OO2+N.

Figure 18.
Normalized number densities of nitrosonium and carbon dioxide in the stagnation region. (a) Nitrosonium due to NO+M + + M; (b) Carbon Dioxide.
Figure 18.
Normalized number densities of nitrosonium and carbon dioxide in the stagnation region. (a) Nitrosonium due to NO+M + + M; (b) Carbon Dioxide.
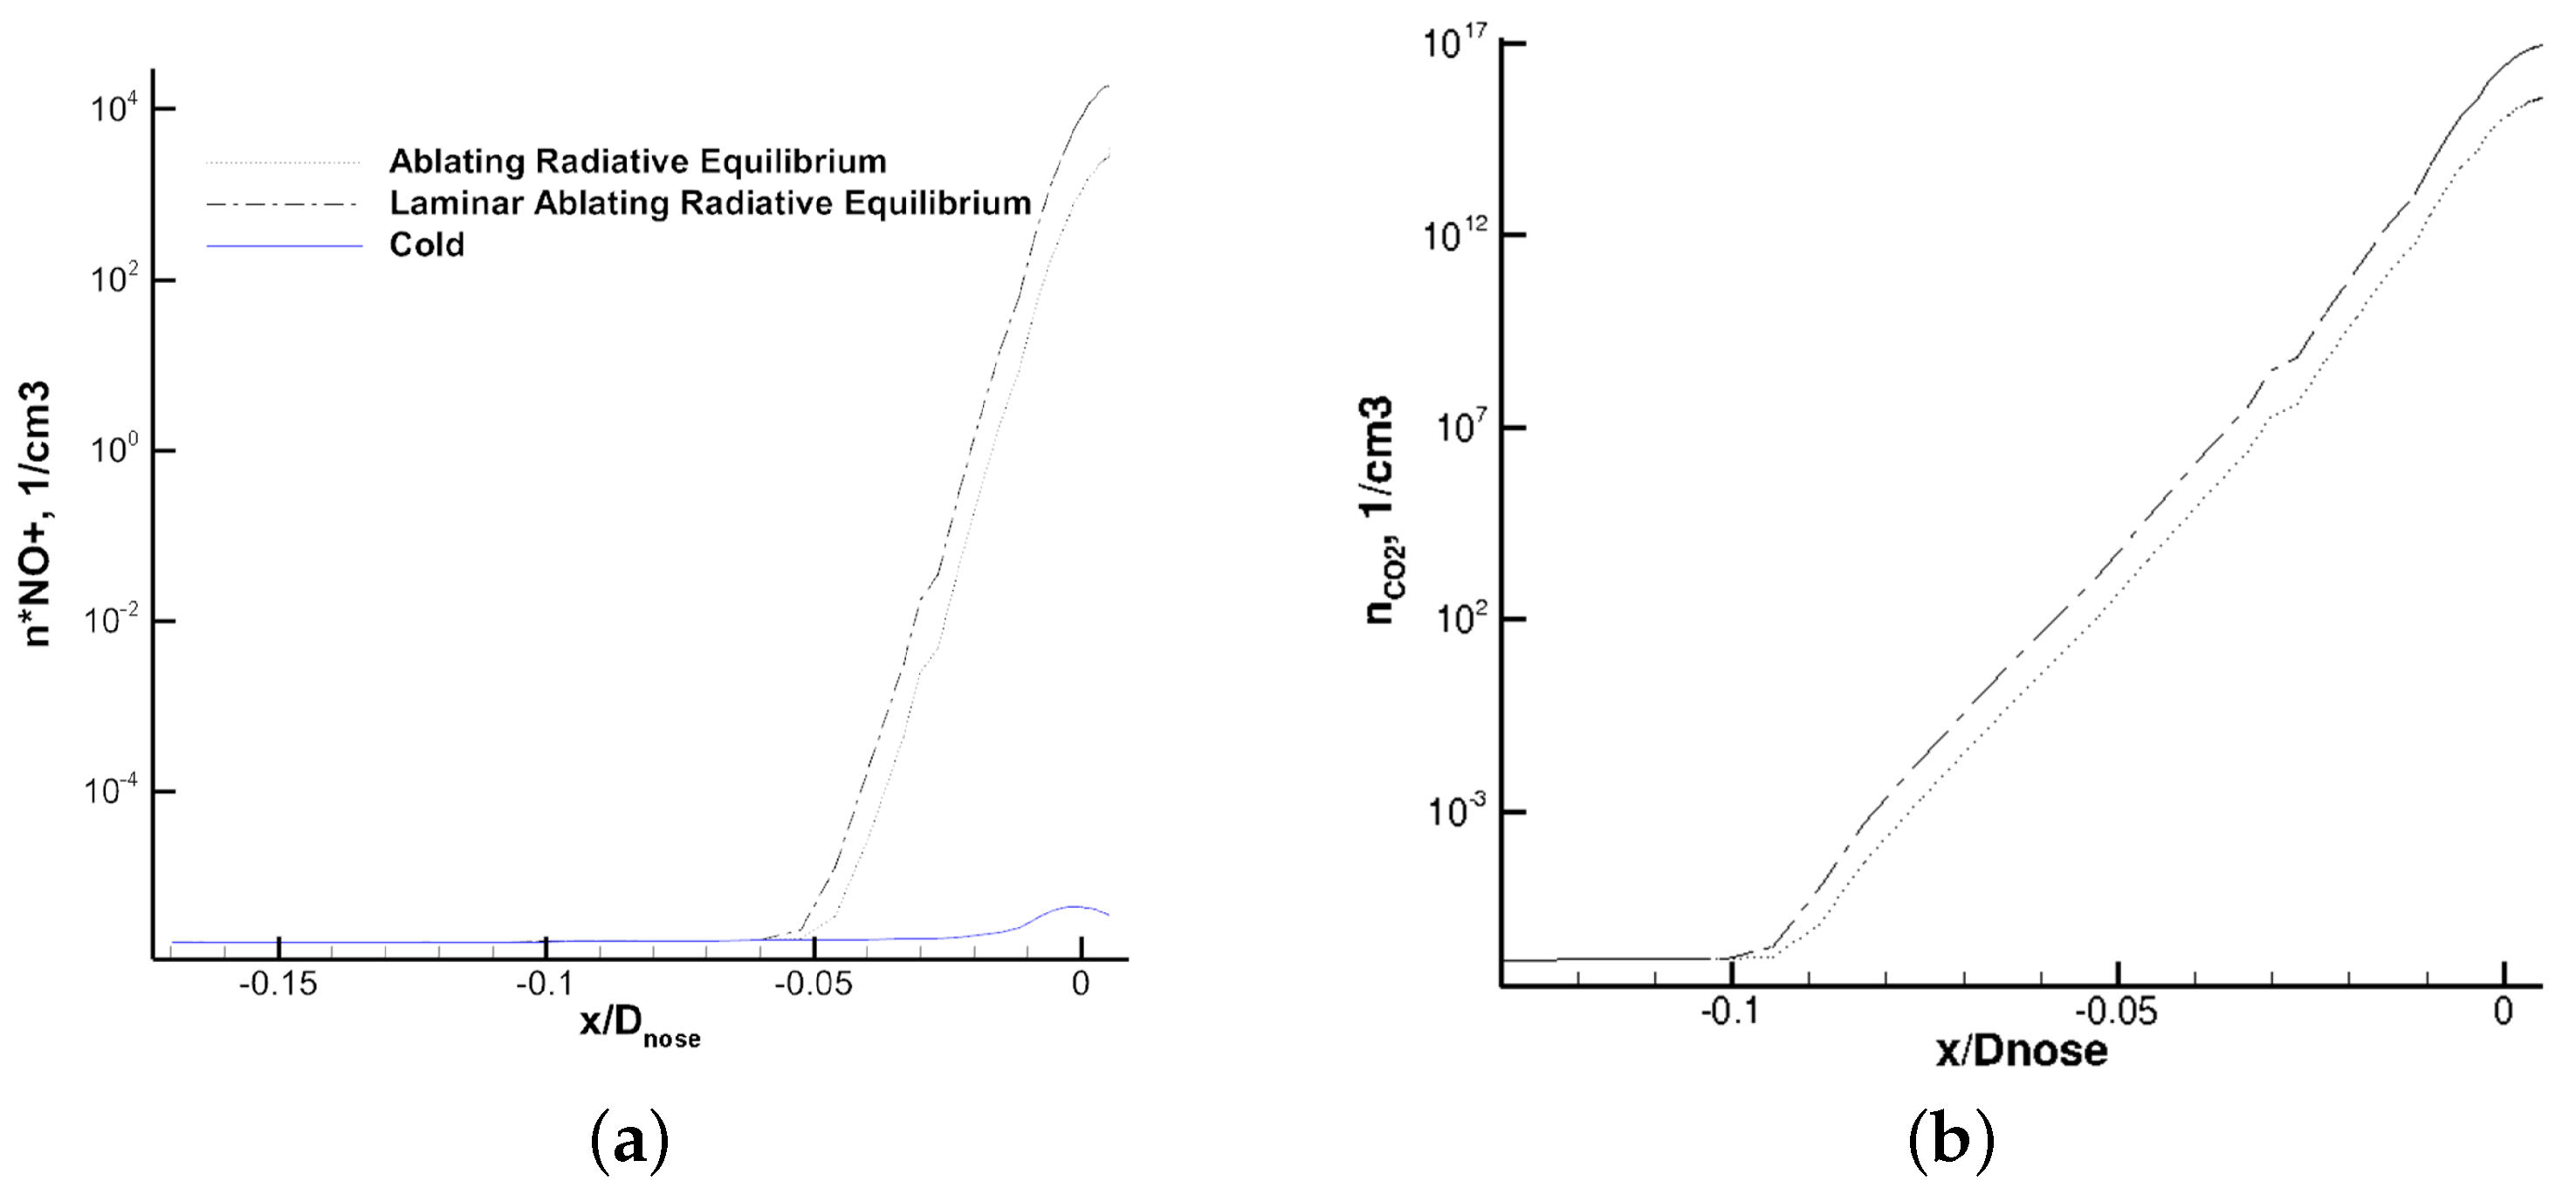
Figure 19.
Stagnation region oxygen species by normalized number density. (a) Normalized number Density O; (b) Normalized number Density O2.
Figure 19.
Stagnation region oxygen species by normalized number density. (a) Normalized number Density O; (b) Normalized number Density O2.

Figure 20.
Temperature profiles for the ablating radiative equilibrium case. Values shift significantly for other surface temperature cases, but the structure remains quite similar. (a) Kinetic Temperature; (b) Vibrational Temperature.
Figure 20.
Temperature profiles for the ablating radiative equilibrium case. Values shift significantly for other surface temperature cases, but the structure remains quite similar. (a) Kinetic Temperature; (b) Vibrational Temperature.

Figure 21.
Wake Centerline density for the ablating cases normalized by its freestream value.

Figure 22.
Gradients of temperature in the near-wake for the adiabatic non-catalytic ablating case.
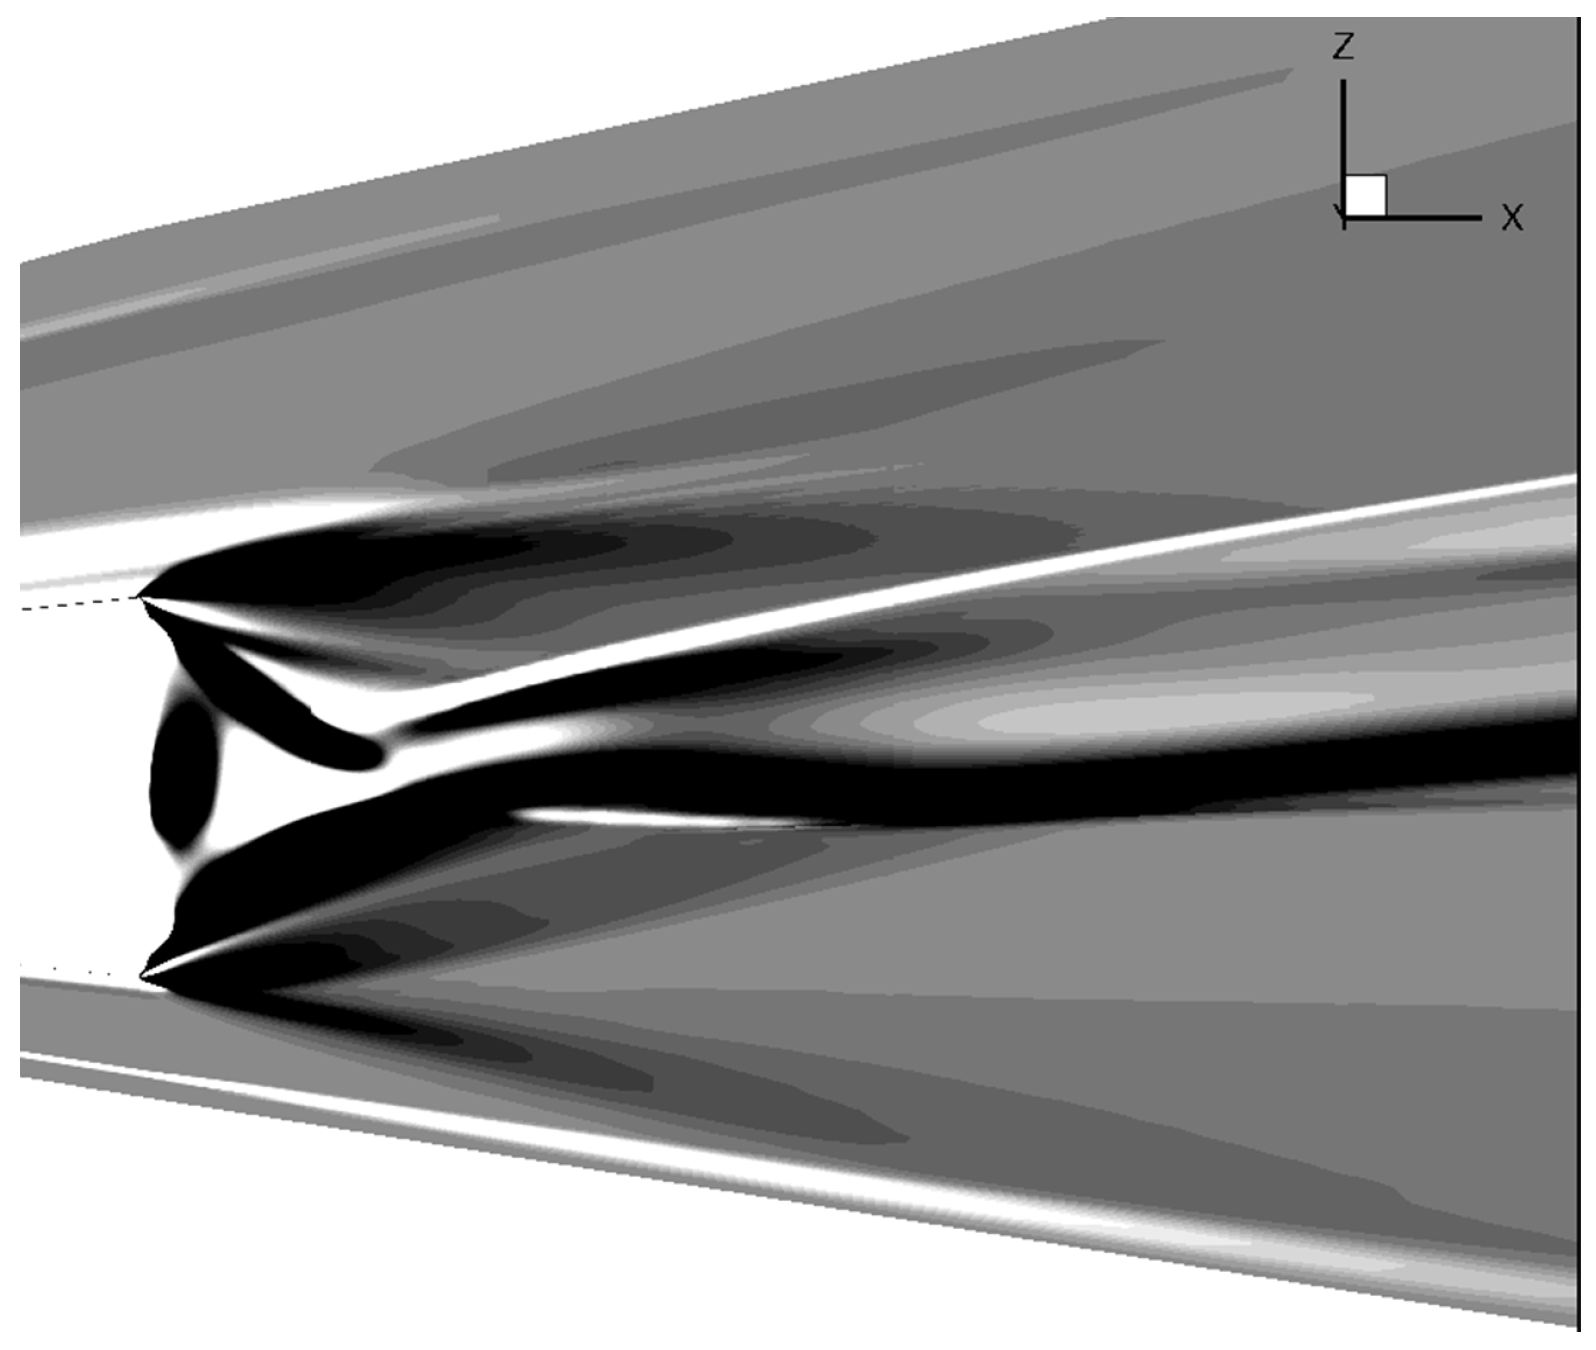
Figure 23.
CN (a) and (b) number densities in the turbulent ablating radiative equilibrium case.

Figure 24.
Location of and temperatures in the wake cross-section. (a) Adiabatic wall condition with wake cross-sectional slice; (b) Wake cross-sectional temperatures.
Figure 24.
Location of and temperatures in the wake cross-section. (a) Adiabatic wall condition with wake cross-sectional slice; (b) Wake cross-sectional temperatures.

Figure 25.
Normalized NO and NO+ distribution in the wake cross section normalized by non-dimensional local density. (a) Nitric Oxide; (b) Nitrosonium.
Figure 25.
Normalized NO and NO+ distribution in the wake cross section normalized by non-dimensional local density. (a) Nitric Oxide; (b) Nitrosonium.
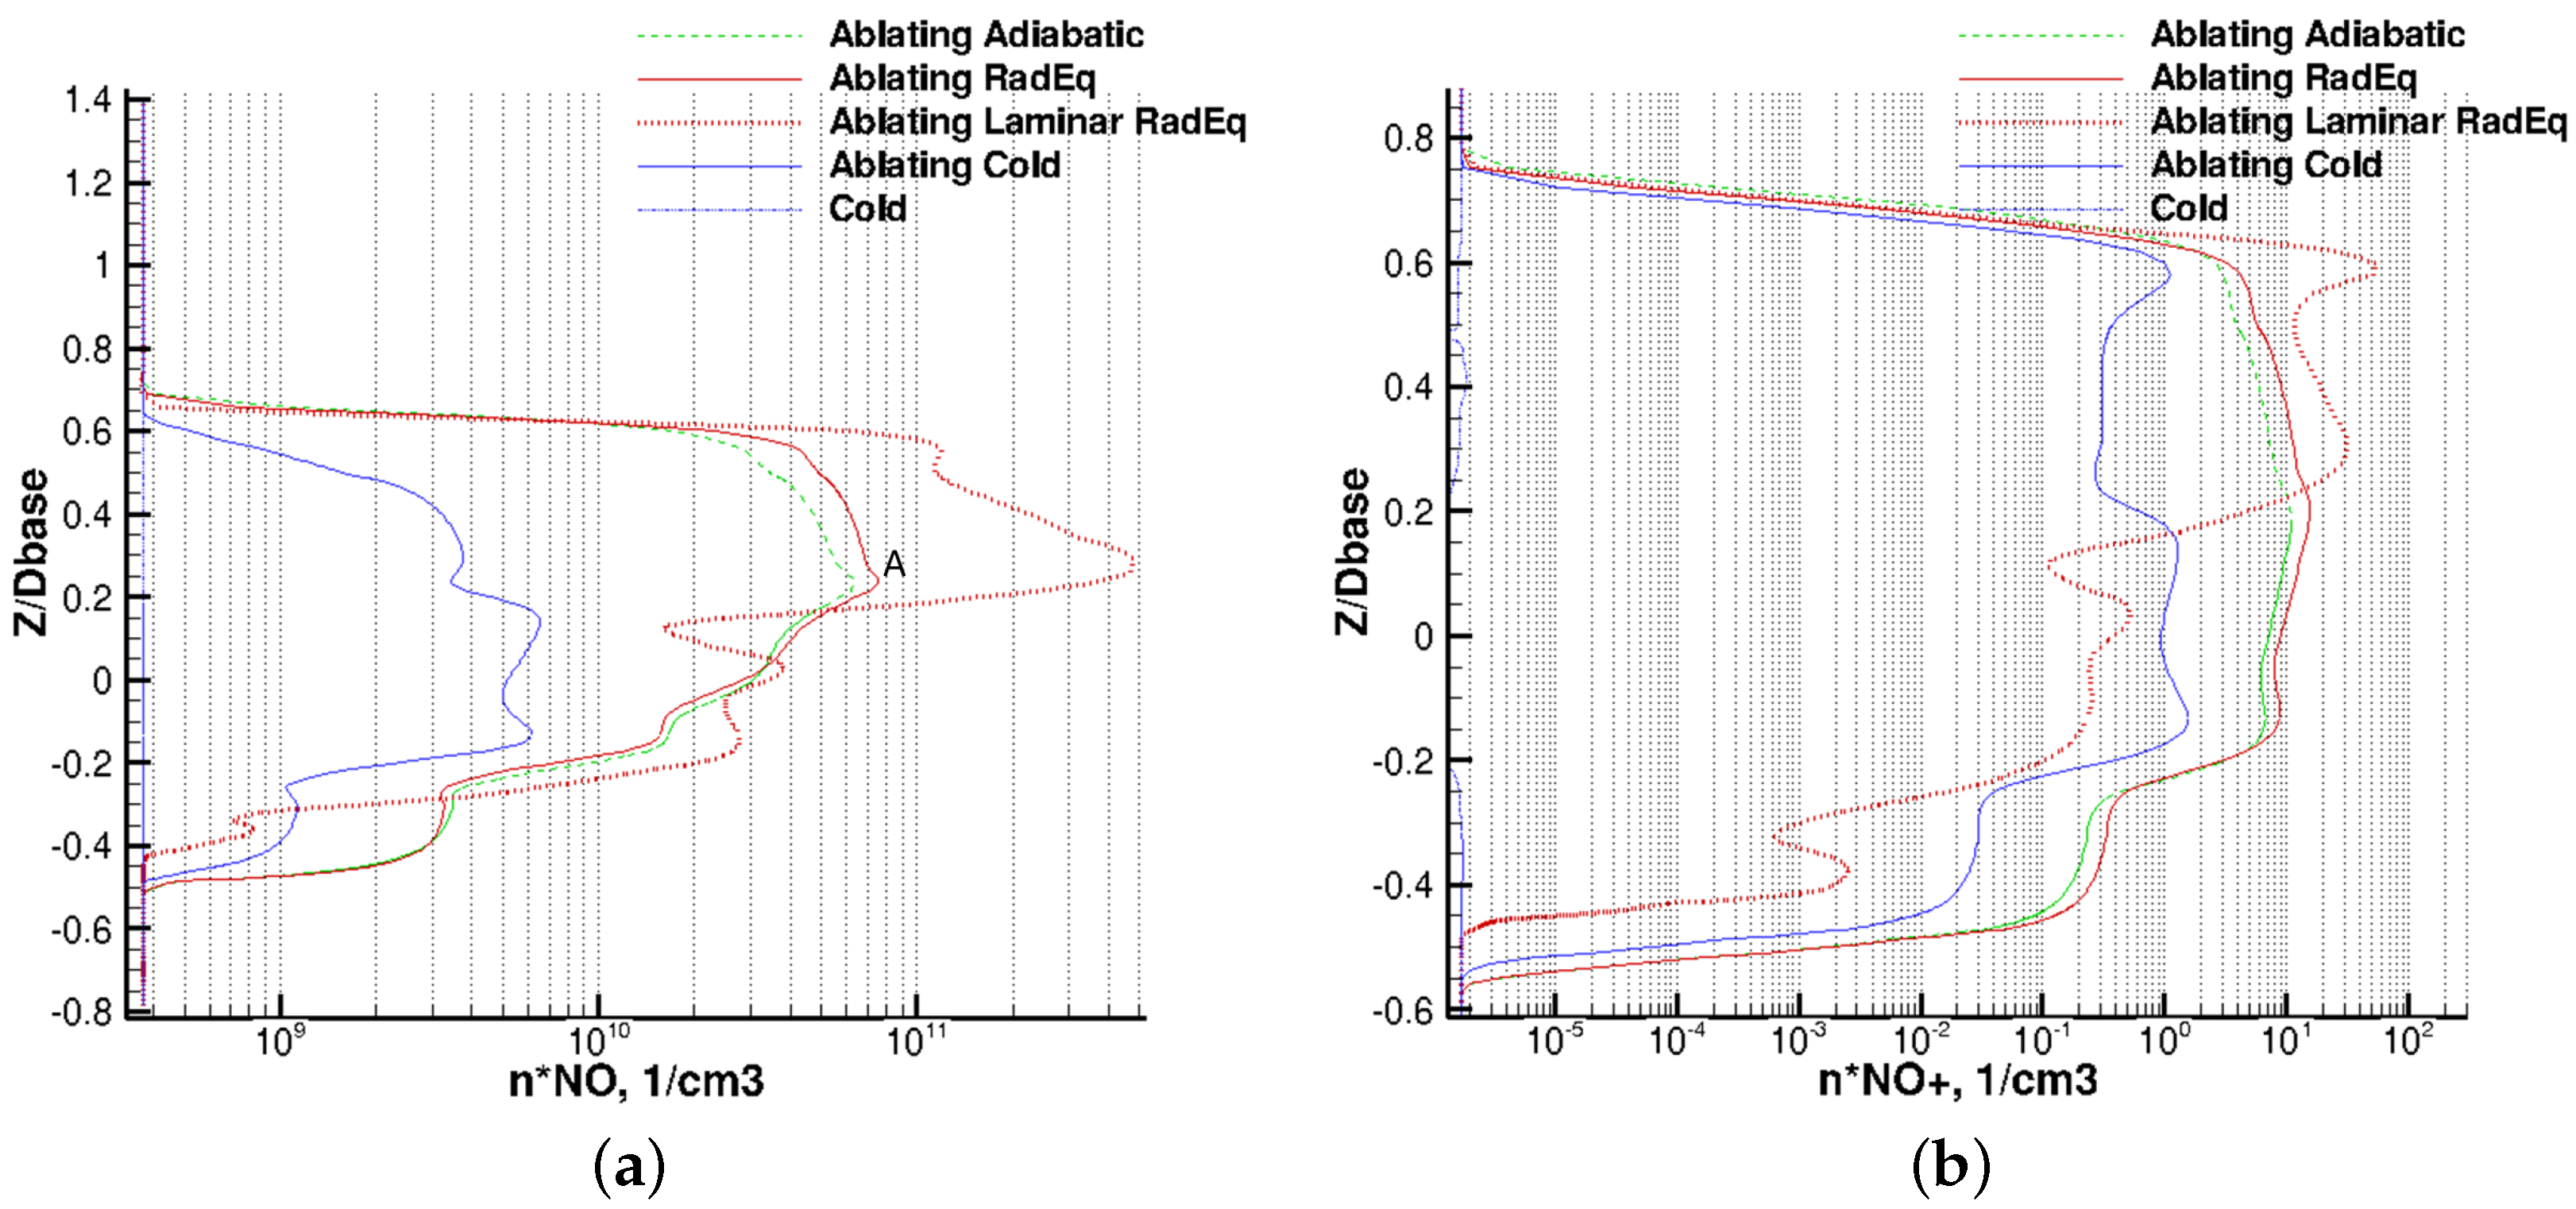
Figure 26.
Normalized CO2 and CN distribution in the wake cross section, normalized by non-dimensional local density. (a) Carbon Dioxide; (b) Cyanogen.
Figure 26.
Normalized CO2 and CN distribution in the wake cross section, normalized by non-dimensional local density. (a) Carbon Dioxide; (b) Cyanogen.
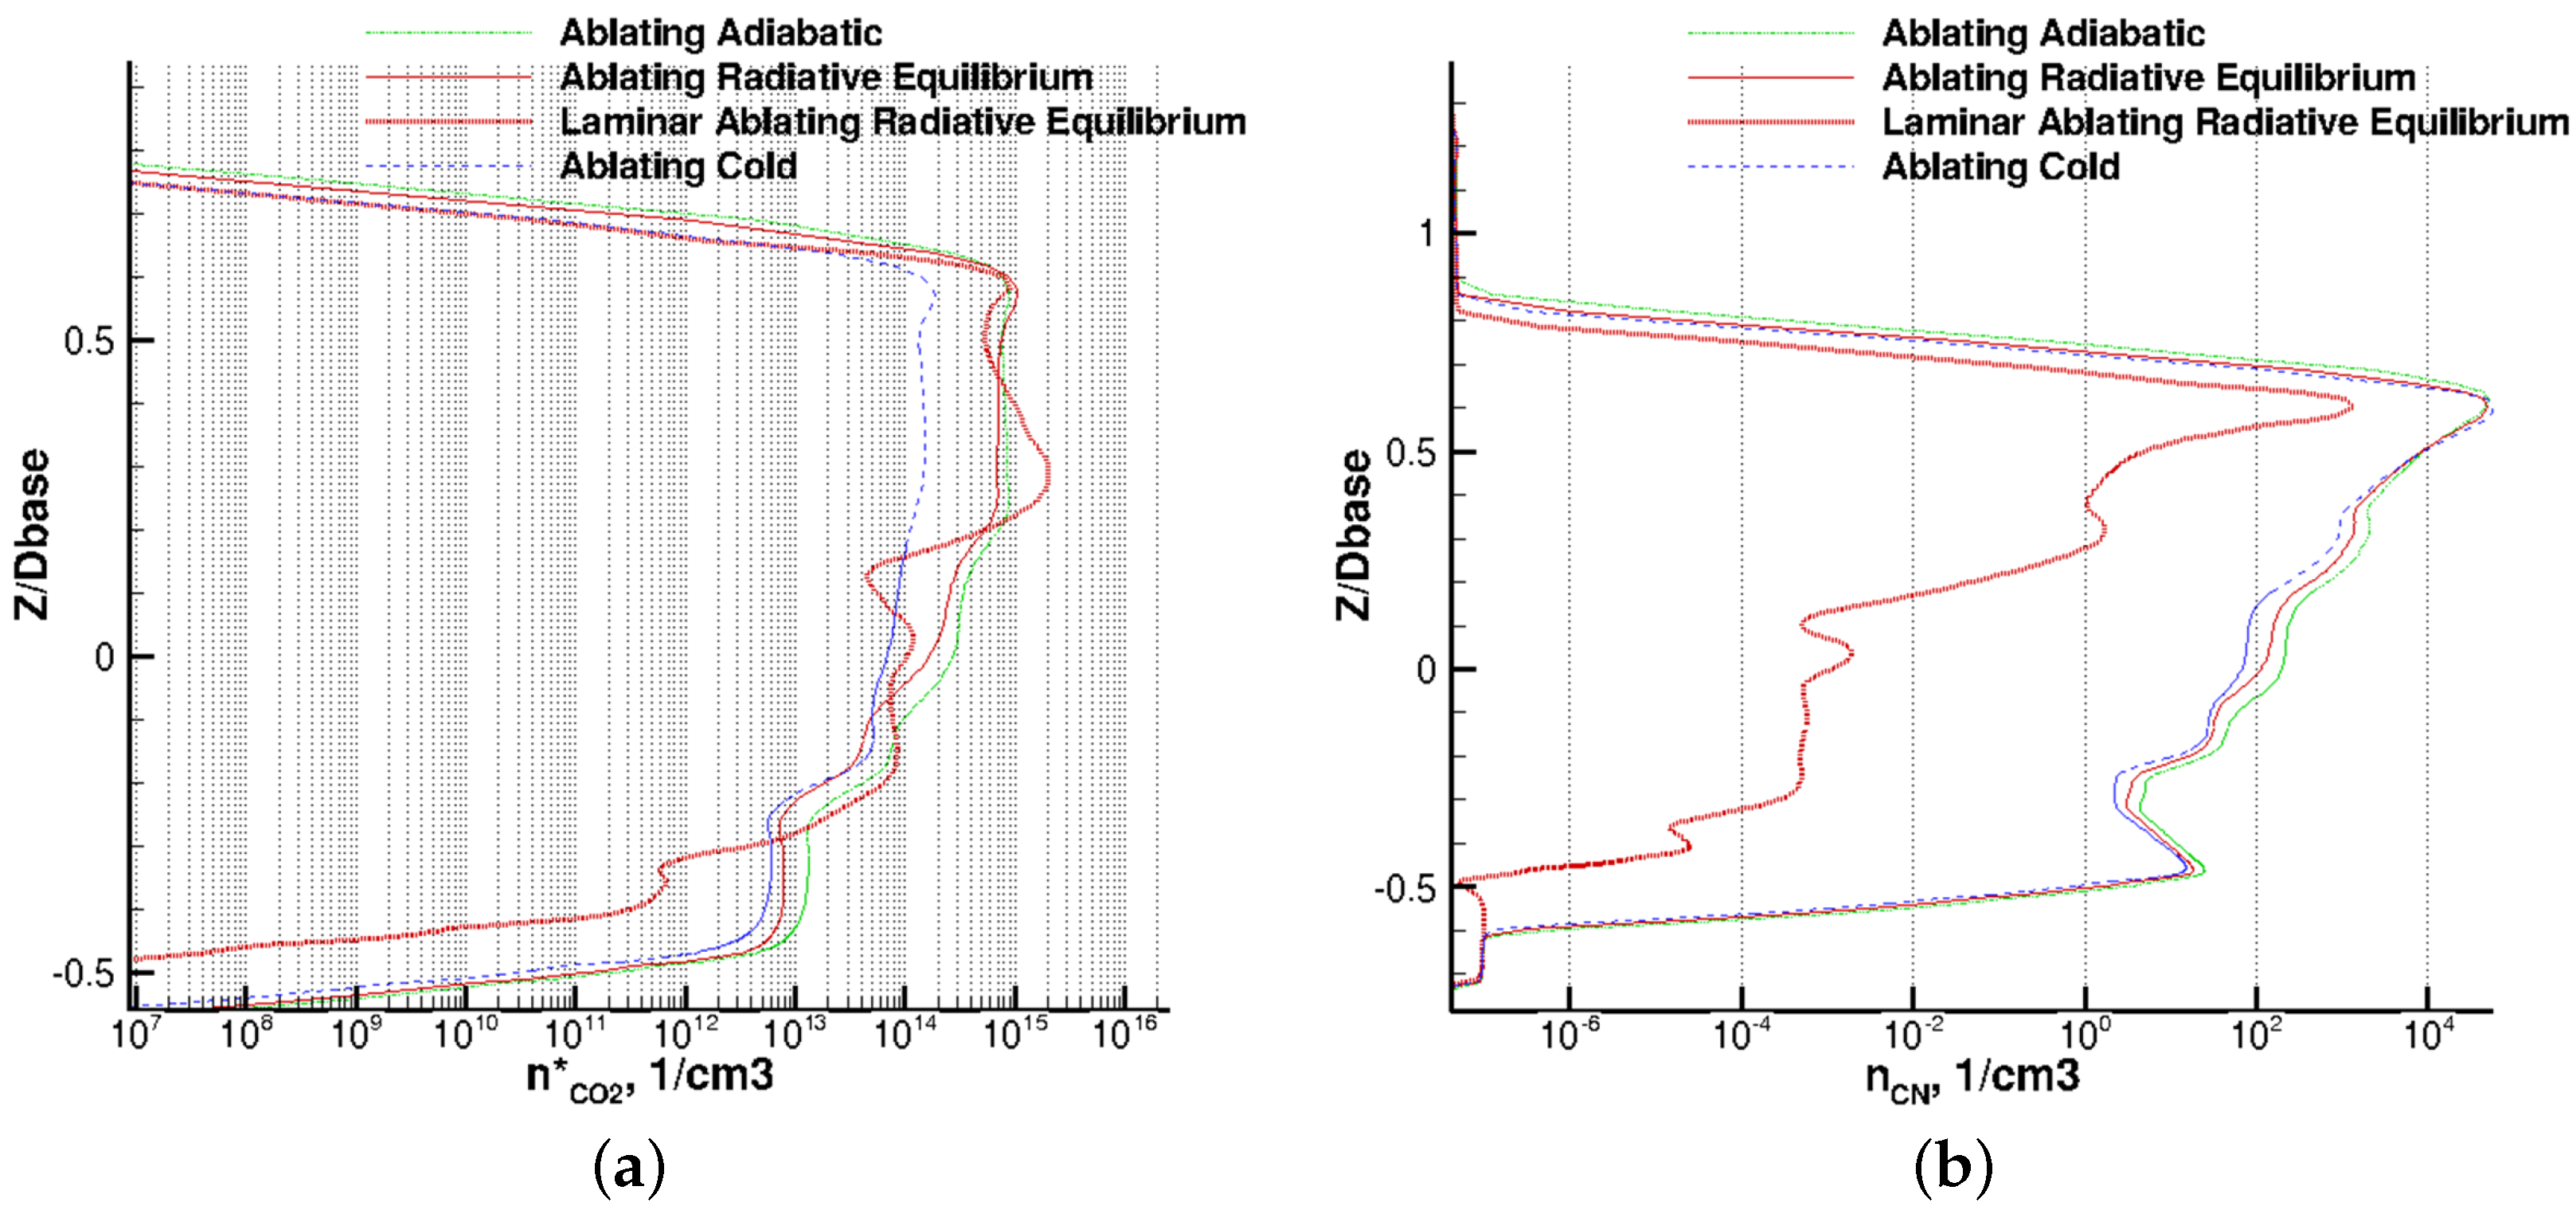
Figure 27.
NO and NO+ number density in the wake cross section. (a) N Nitric Oxide; (b) N Nitrosonium.
Figure 27.
NO and NO+ number density in the wake cross section. (a) N Nitric Oxide; (b) N Nitrosonium.
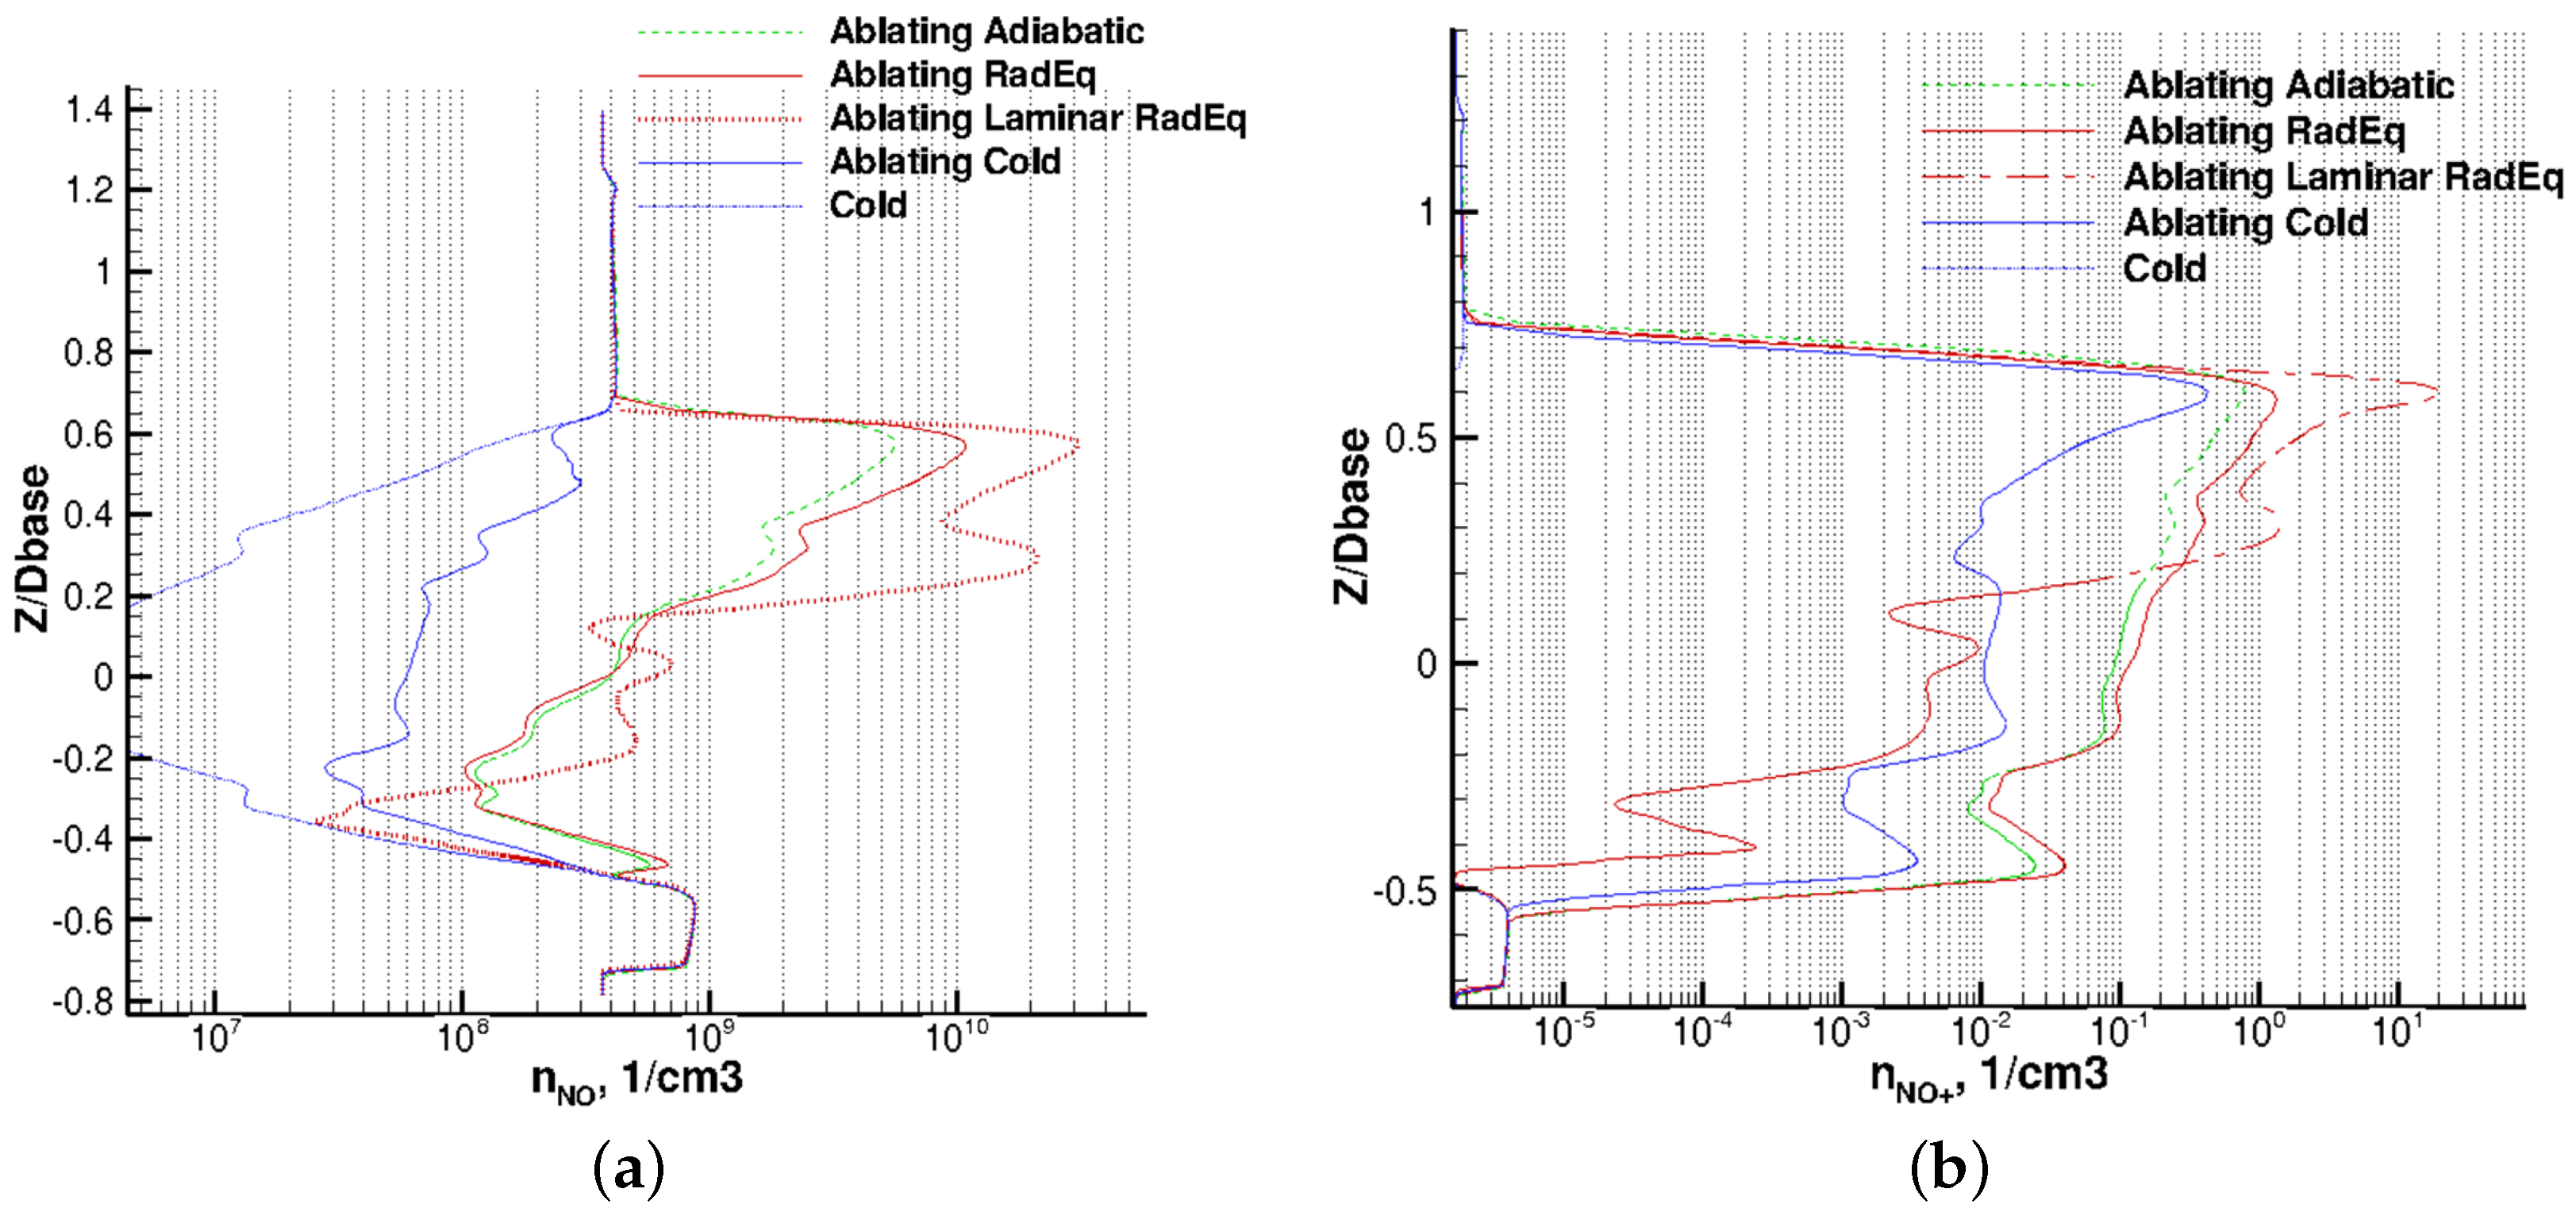
Figure 28.
CO2 and CN number density in the wake cross section. (a) N Carbon Dioxide; (b) N Cyanogen.
Figure 28.
CO2 and CN number density in the wake cross section. (a) N Carbon Dioxide; (b) N Cyanogen.

Figure 29.
(a) Temperature and (b) carbon dioxide number density in the wake core.

Figure 30.
Effects of catalysis on the radiative equilibrium ablating case. (a) Temperature; (b) Nitric Oxide.
Figure 30.
Effects of catalysis on the radiative equilibrium ablating case. (a) Temperature; (b) Nitric Oxide.

Figure 31.
Effects of catalysis on the radiative equilibrium ablating case, continued. (a) Nitrosonium; (b) Carbon Dioxide.
Figure 31.
Effects of catalysis on the radiative equilibrium ablating case, continued. (a) Nitrosonium; (b) Carbon Dioxide.
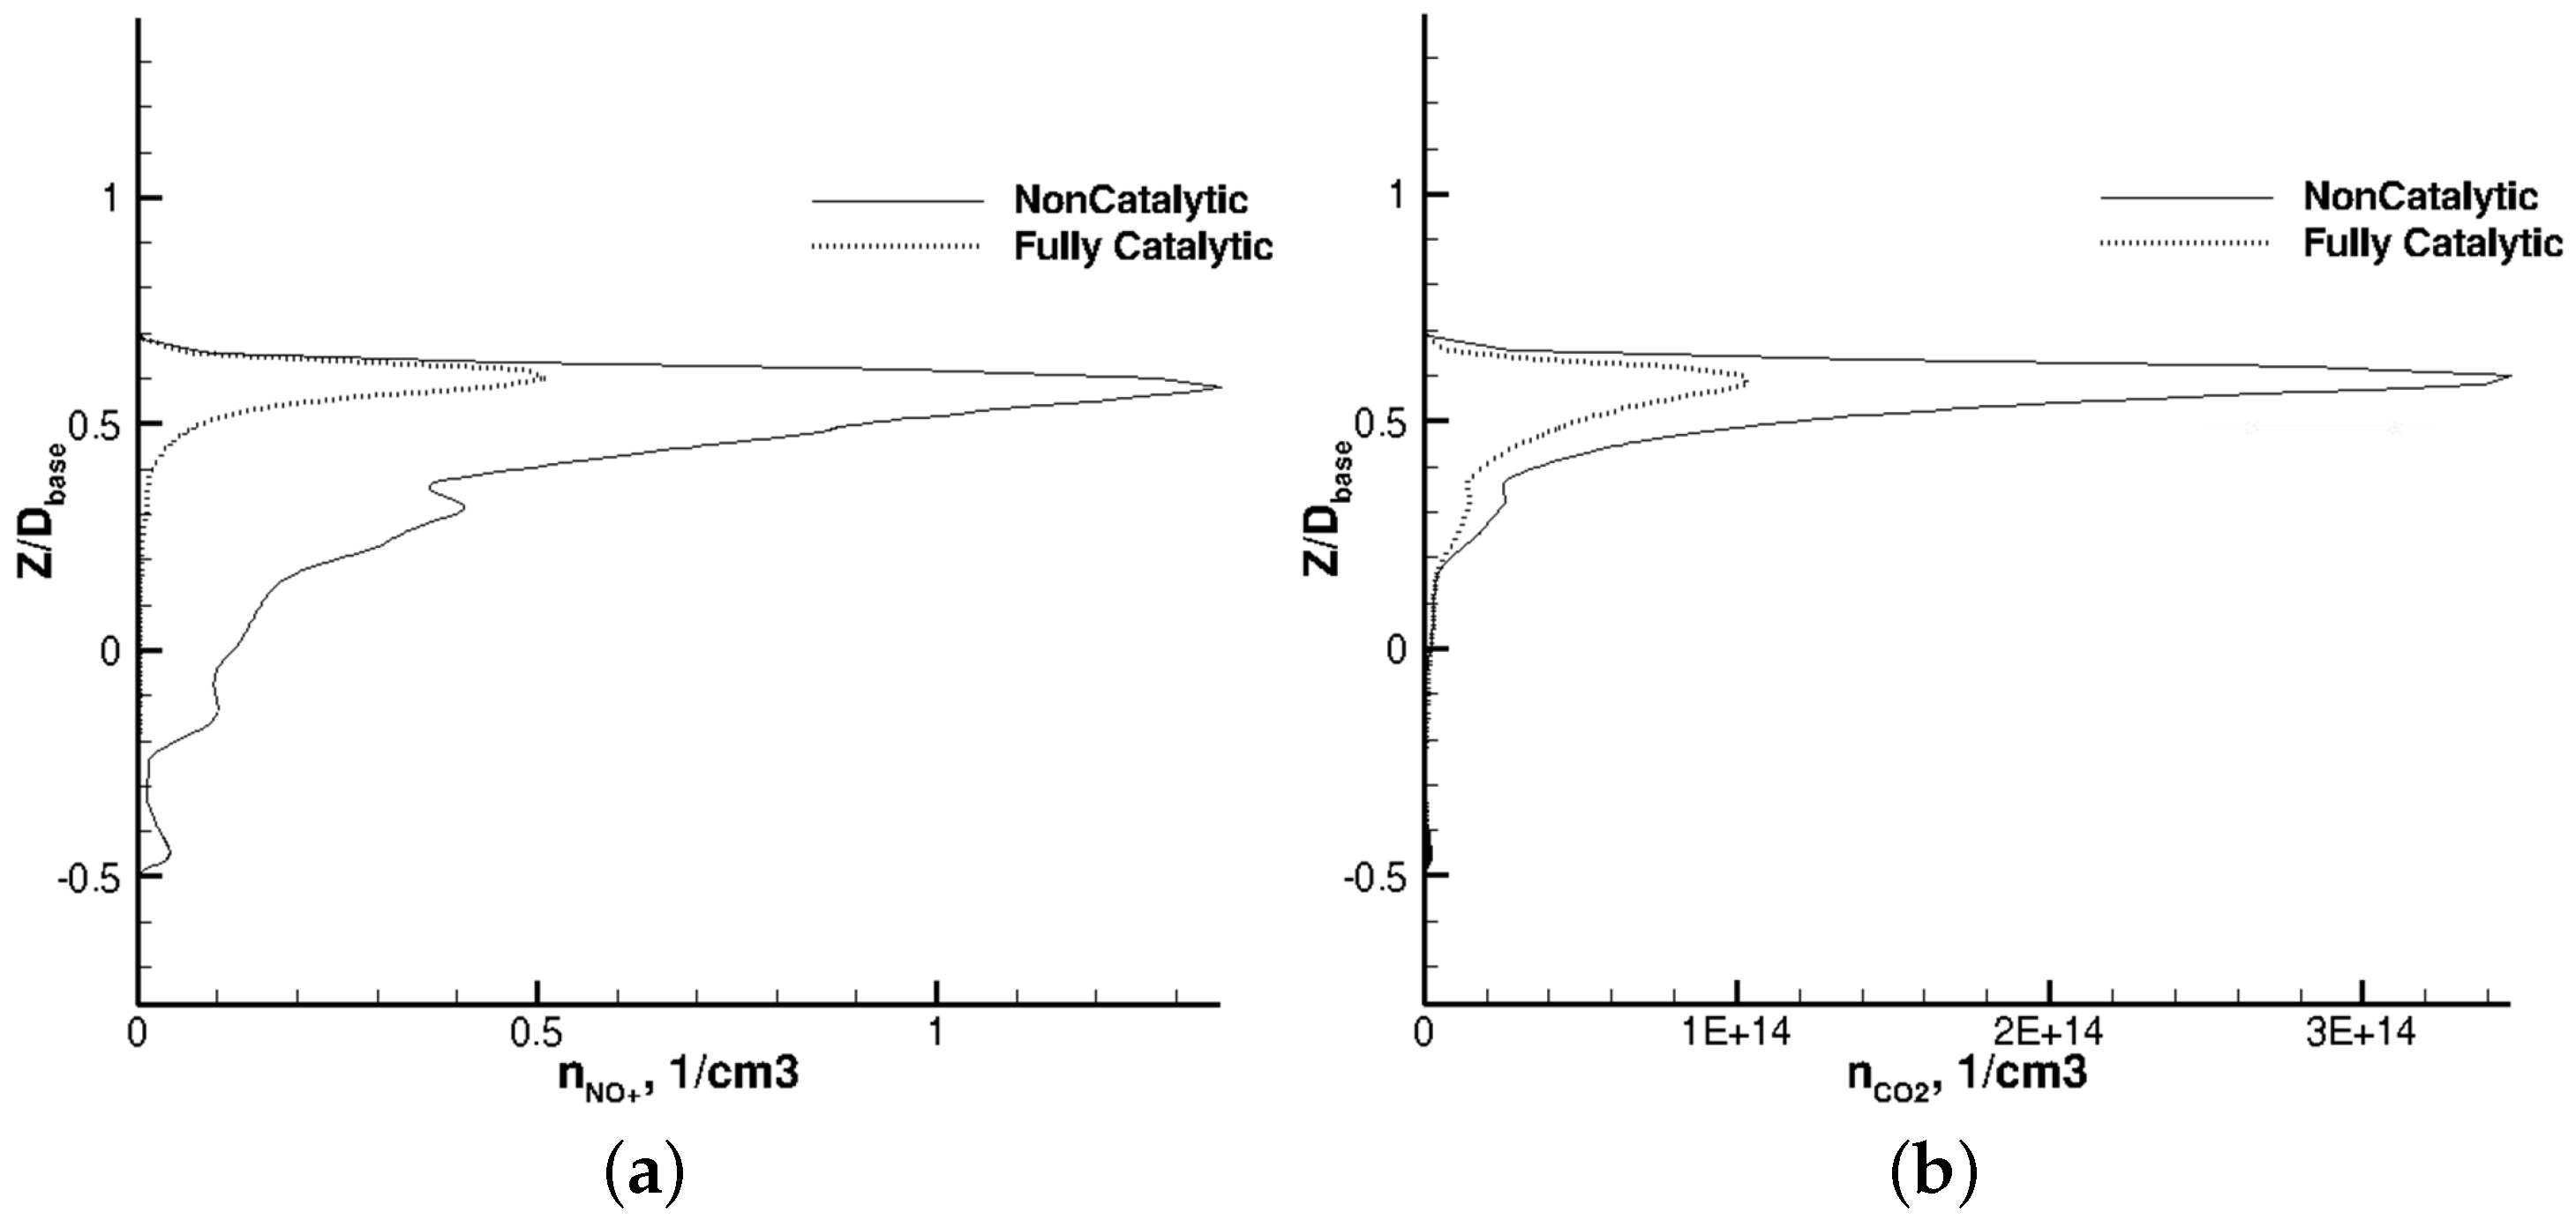
Figure 32.
Effects of catalysis on the radiative equilibrium ablating case, continued. (a) Cyanogen; (b) Atomic Nitrogen.
Figure 32.
Effects of catalysis on the radiative equilibrium ablating case, continued. (a) Cyanogen; (b) Atomic Nitrogen.
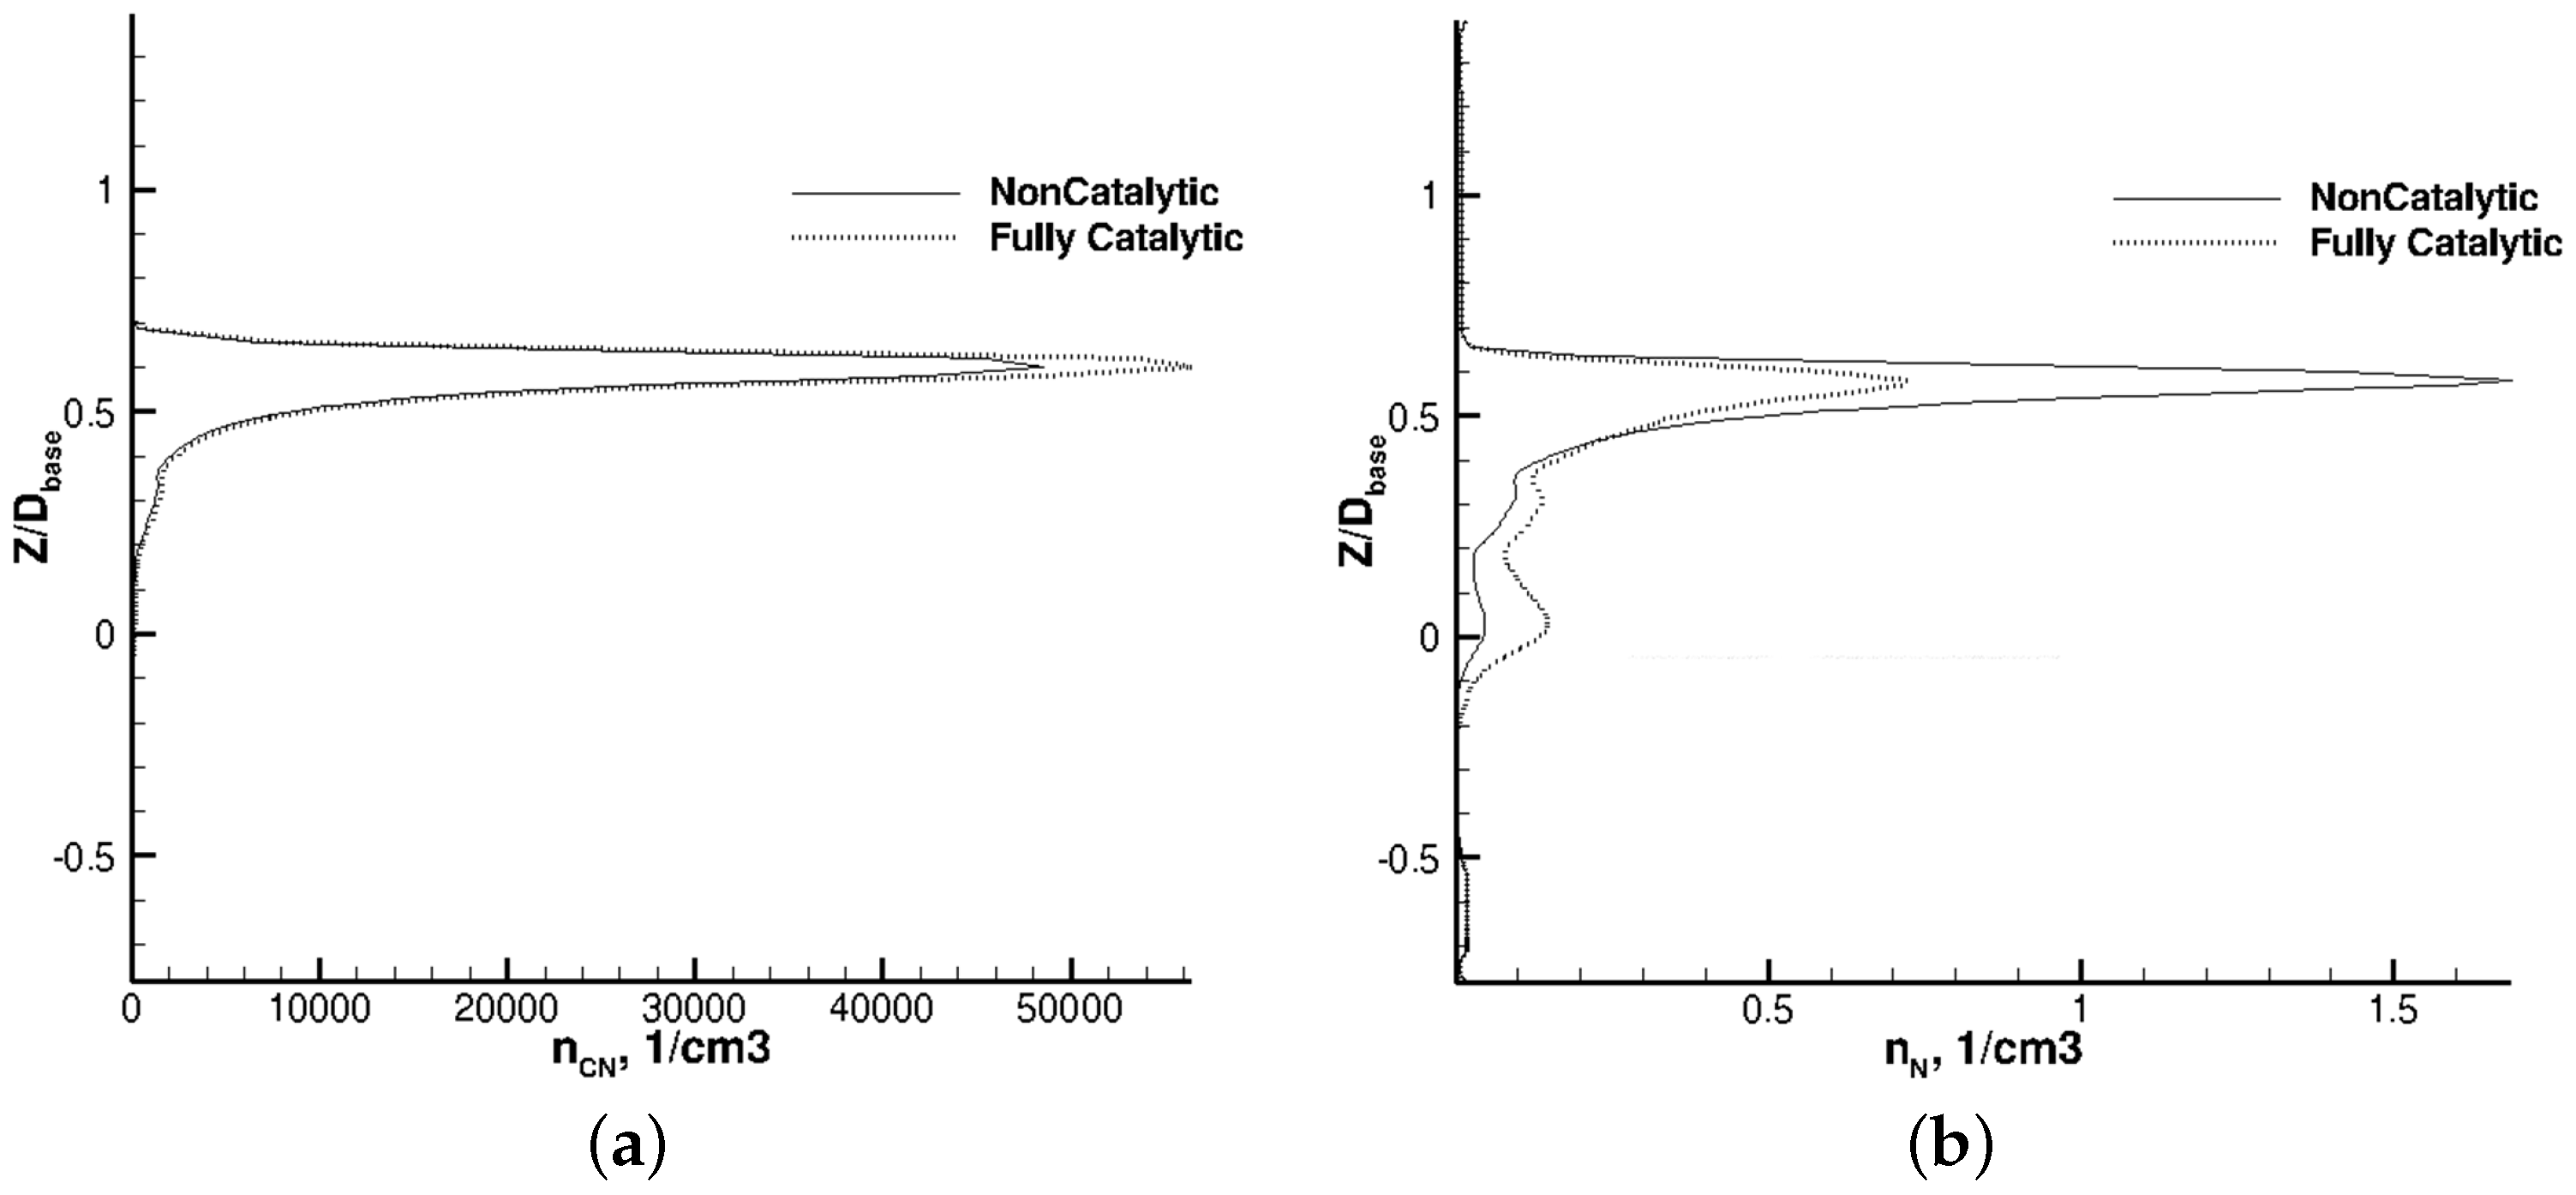
Figure 33.
Size of ablating portions of cone for the non-catalytic adiabatic case. (a) Zones of ablation; (b) Ablation Blowing Rates.
Figure 33.
Size of ablating portions of cone for the non-catalytic adiabatic case. (a) Zones of ablation; (b) Ablation Blowing Rates.

Figure 34.
Wake slice temperature and carbon dioxide distribution for the large and small ablating cases. (a) Normalized Temperature; (b) Number Density of CO2.
Figure 34.
Wake slice temperature and carbon dioxide distribution for the large and small ablating cases. (a) Normalized Temperature; (b) Number Density of CO2.

Figure 35.
Wake slice nitric oxide and electron distribution for the large and small ablating cases. (a) Number Density of NO; (b) Electron Number Density.
Figure 35.
Wake slice nitric oxide and electron distribution for the large and small ablating cases. (a) Number Density of NO; (b) Electron Number Density.
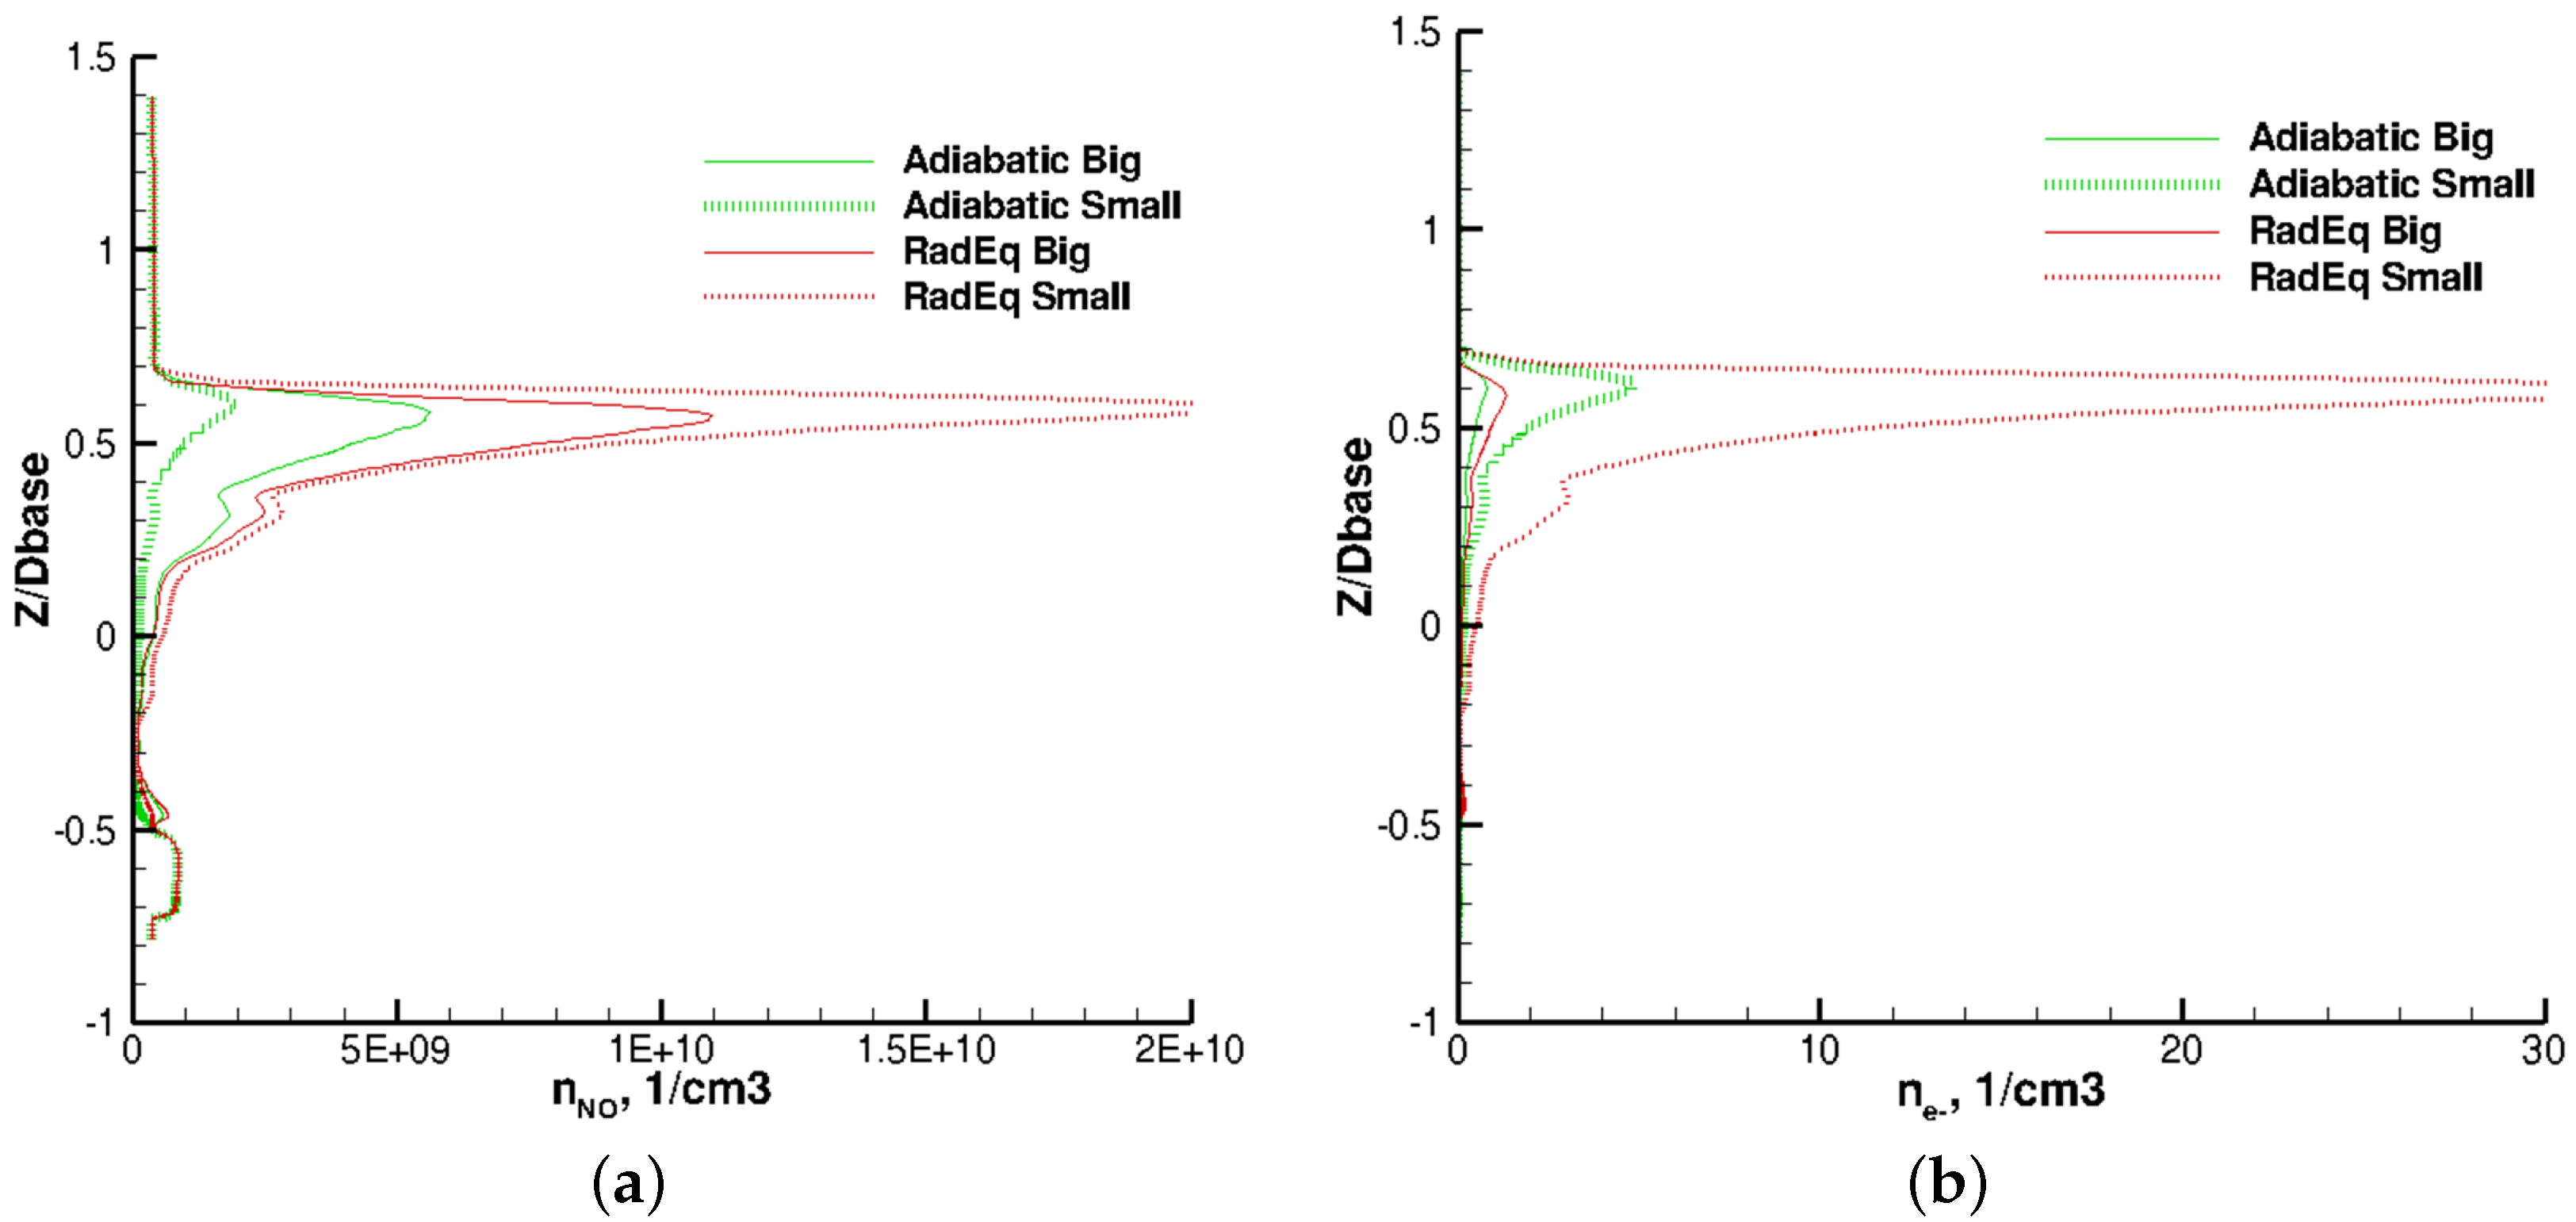
Figure 36.
Wake slice cyanogen and atomic nitrogen for the large and small ablating cases. (a) Number Density of CN; (b) Number Density of N.
Figure 36.
Wake slice cyanogen and atomic nitrogen for the large and small ablating cases. (a) Number Density of CN; (b) Number Density of N.
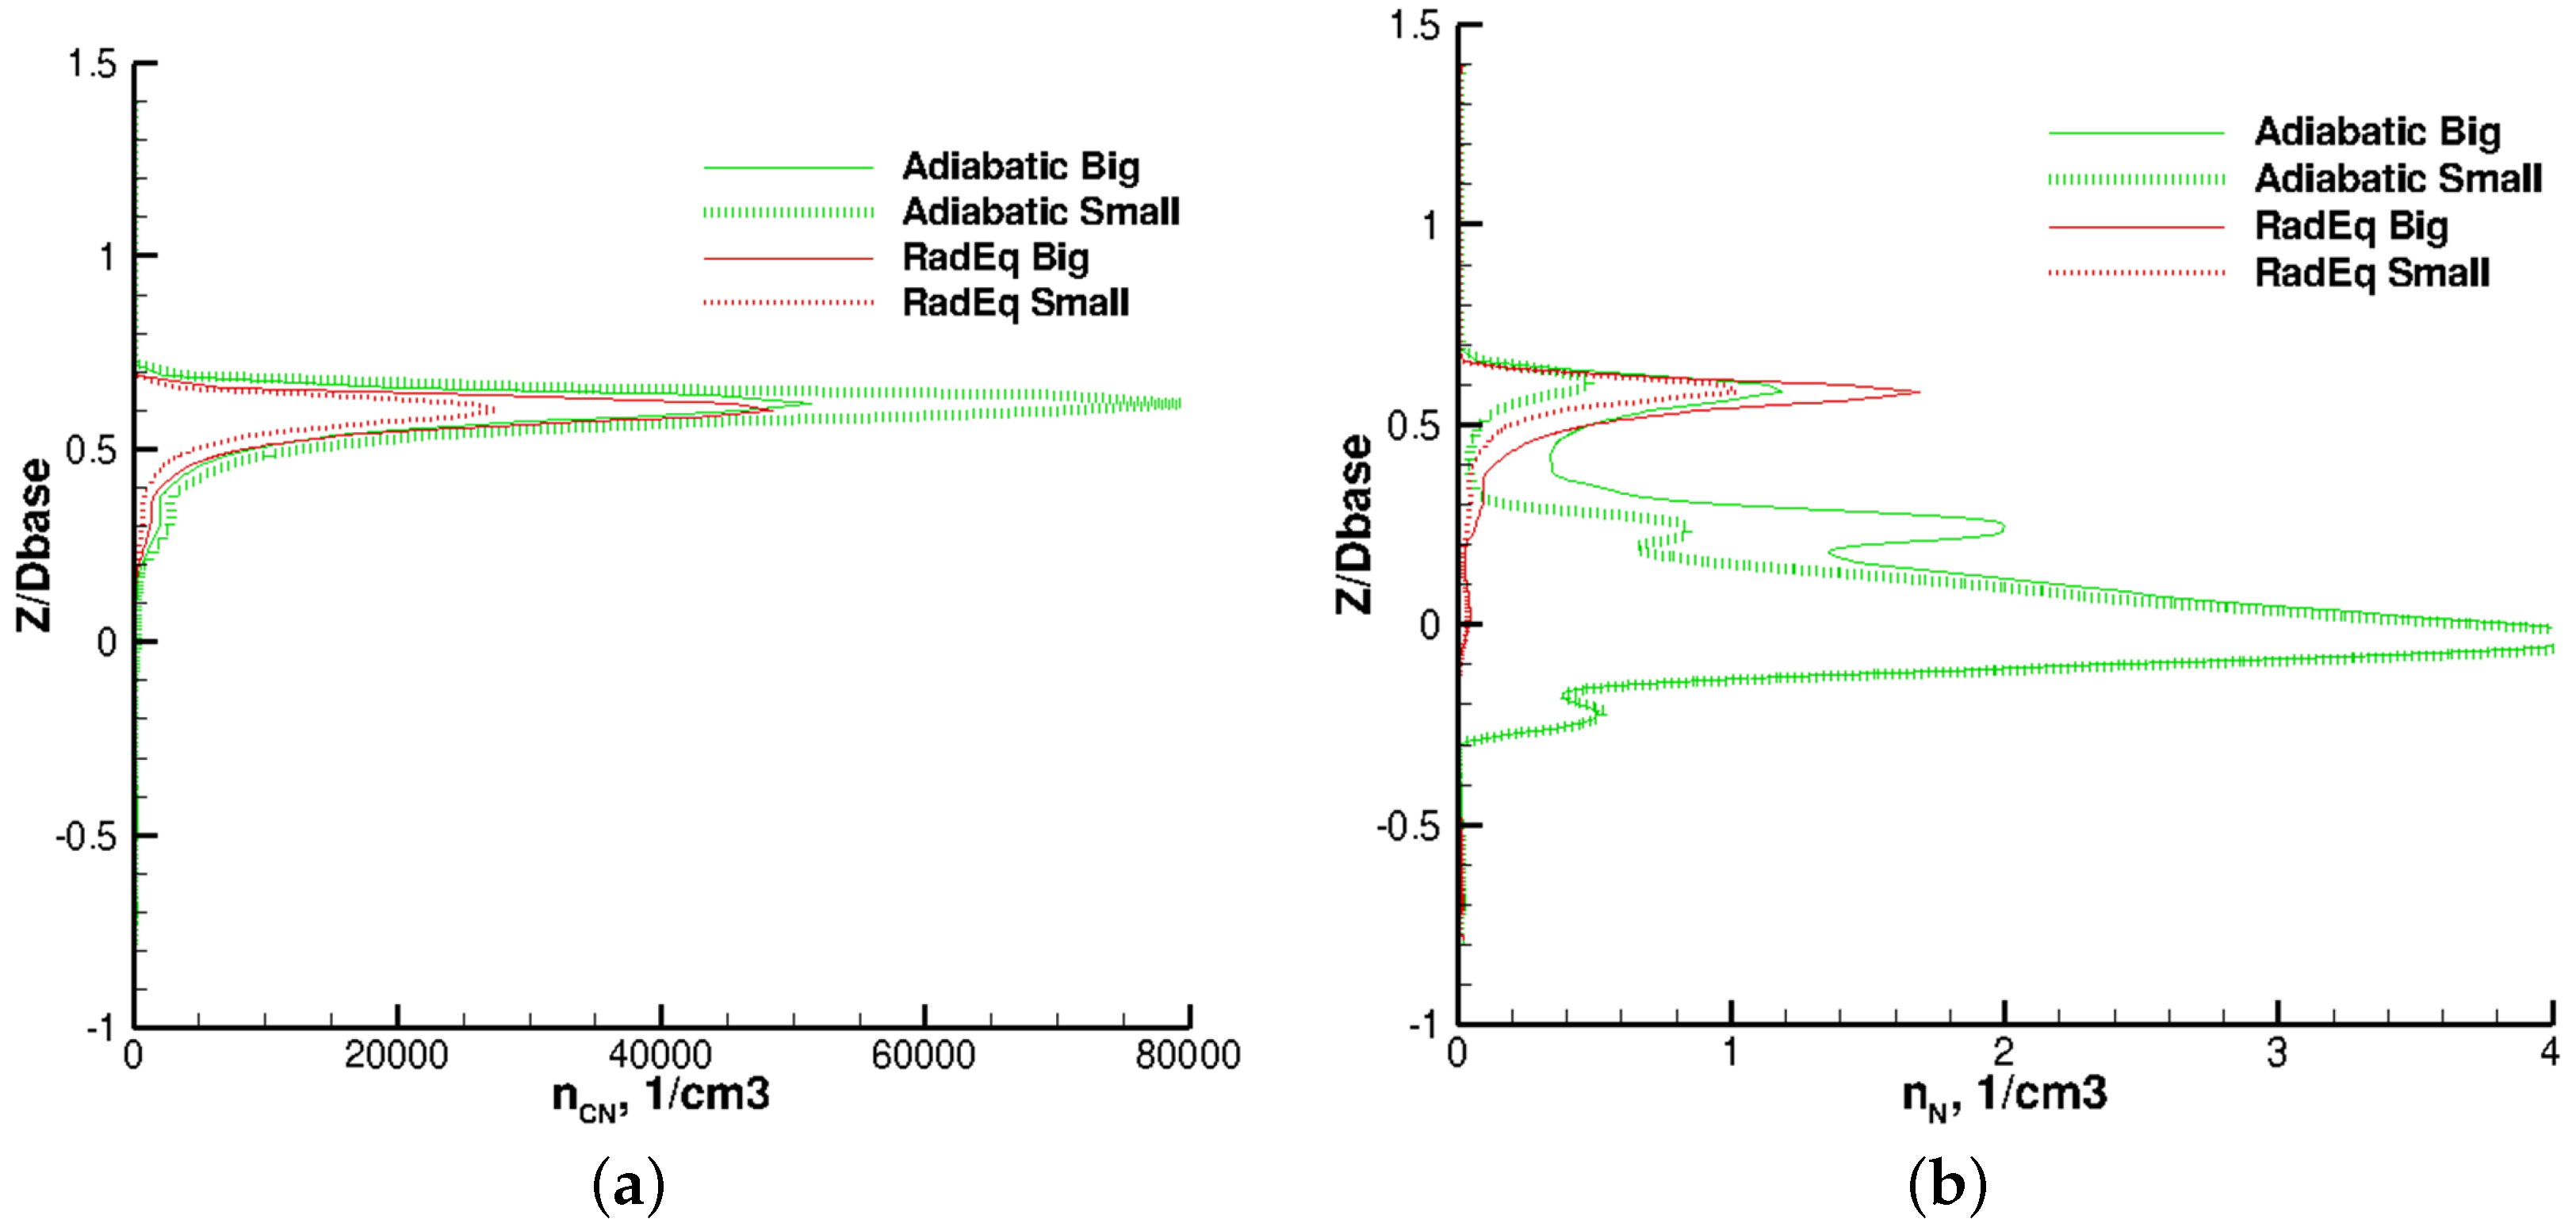

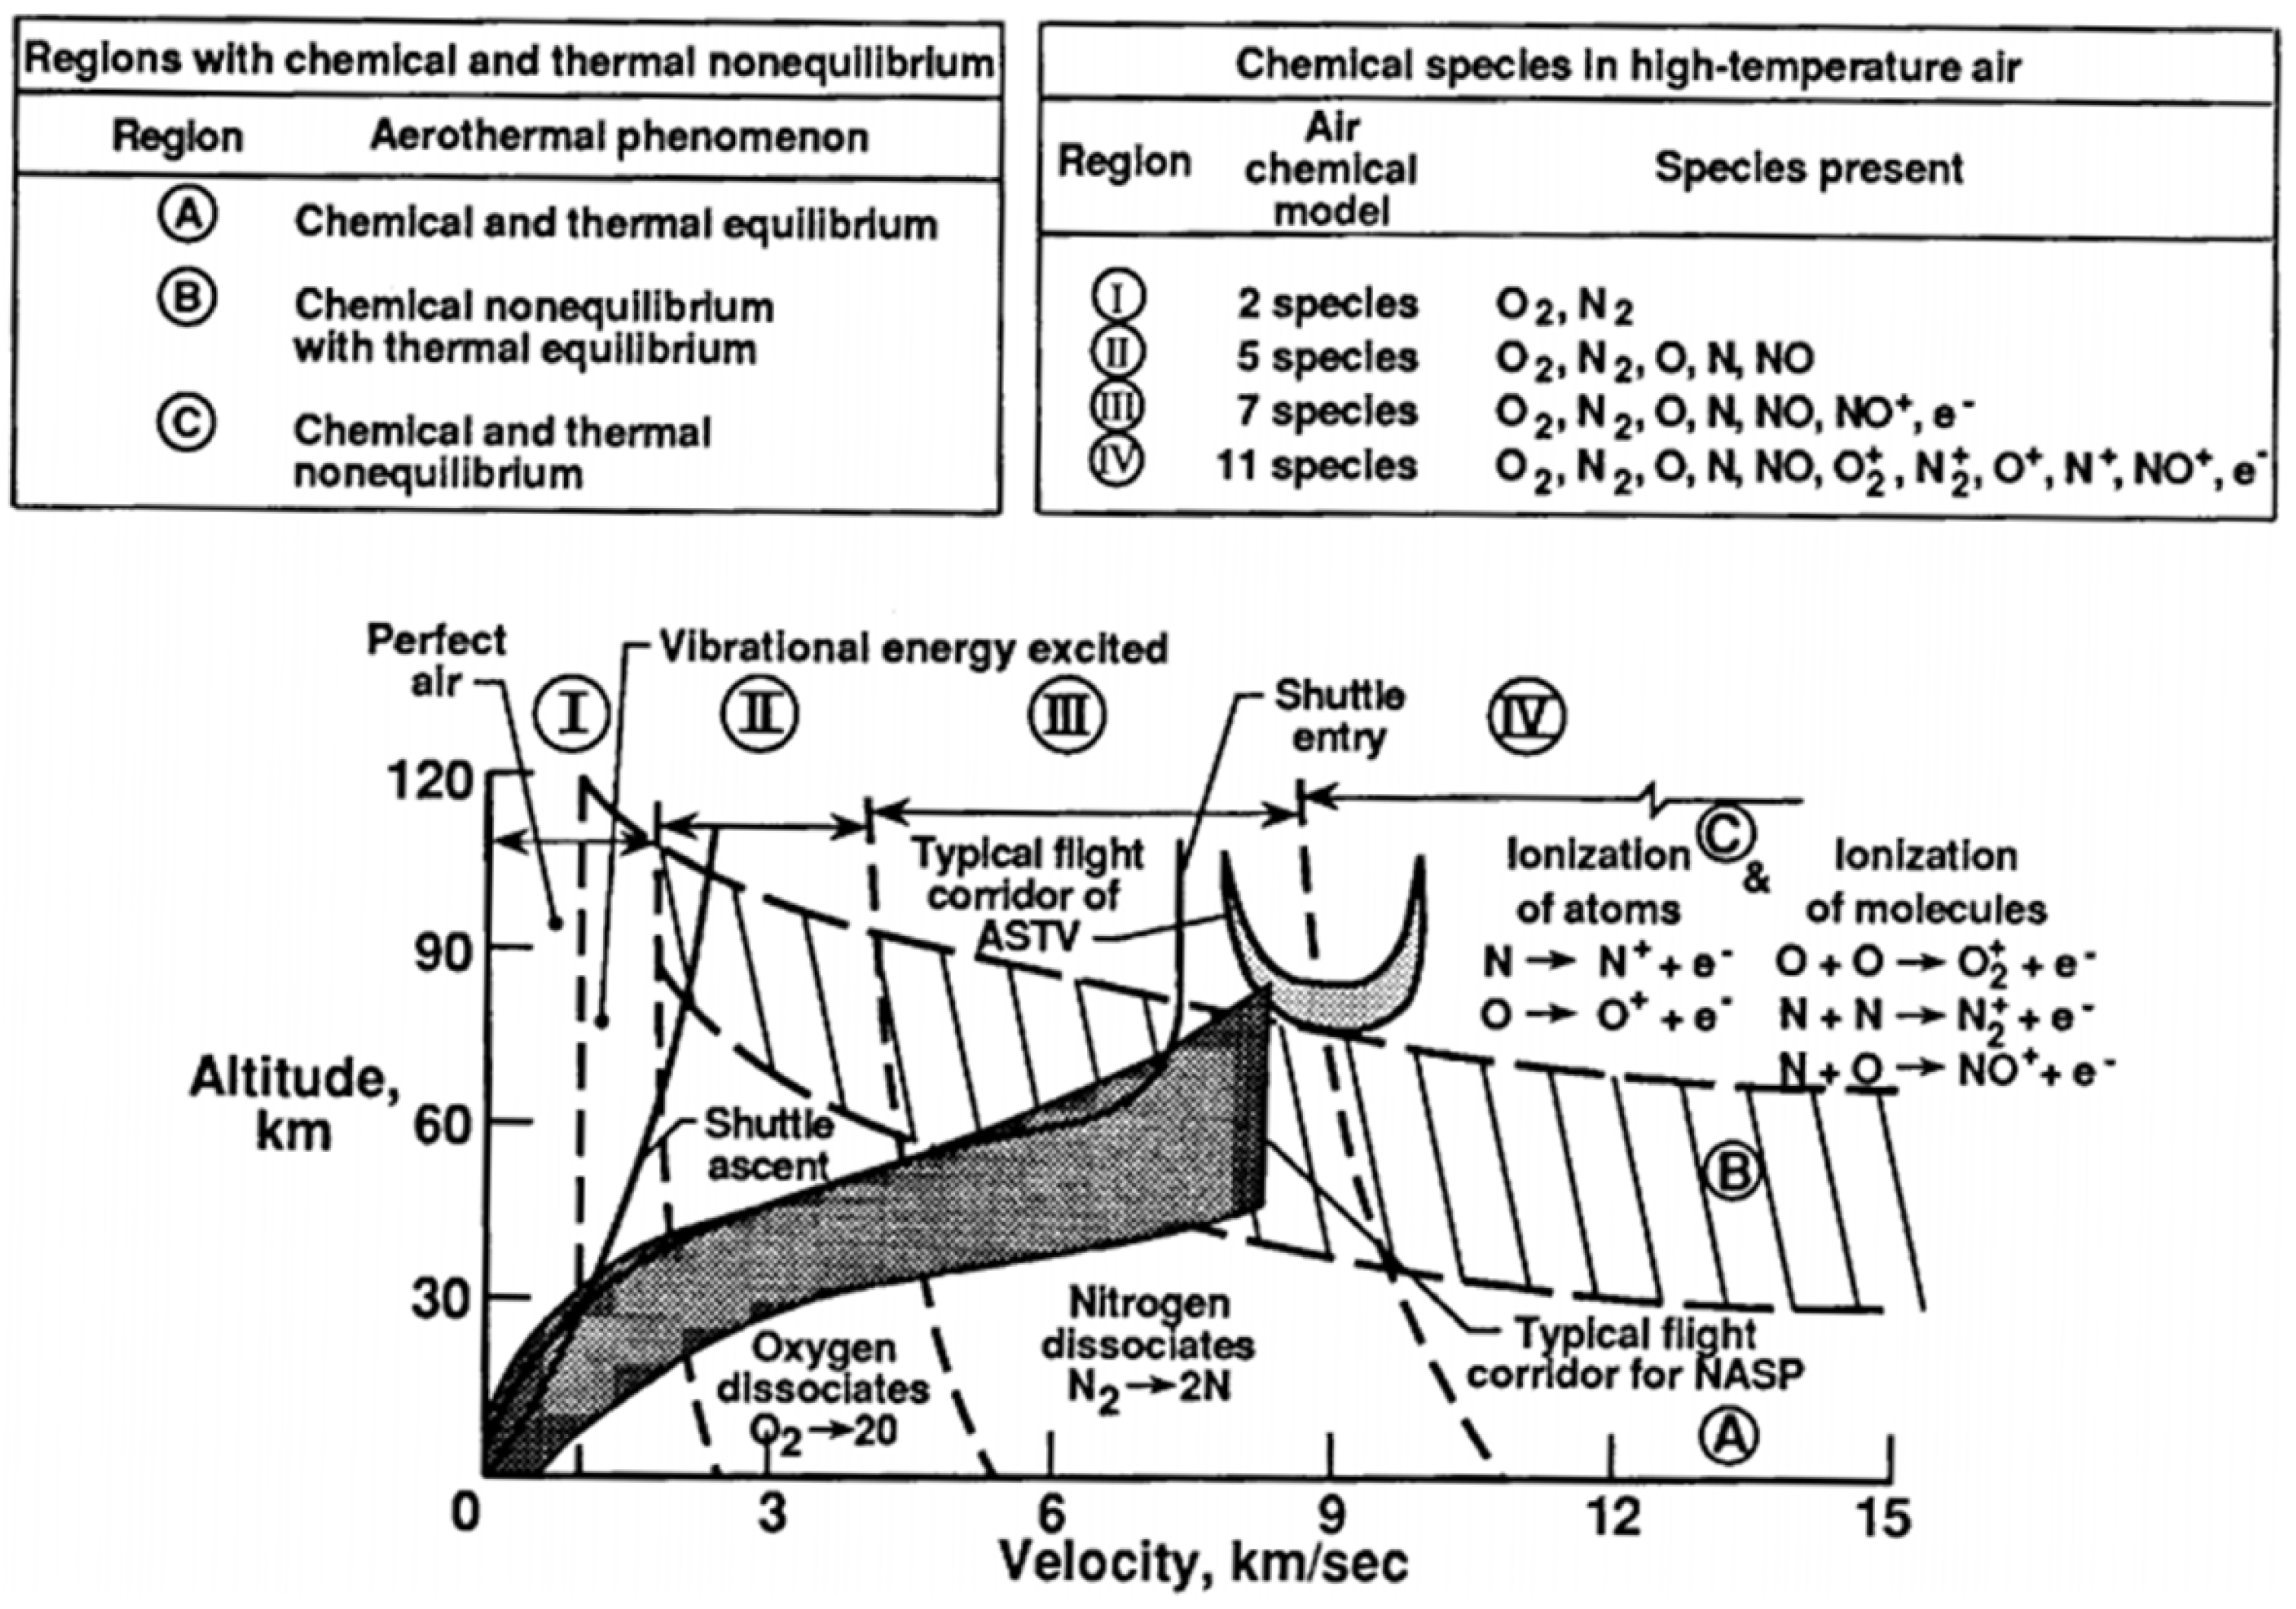
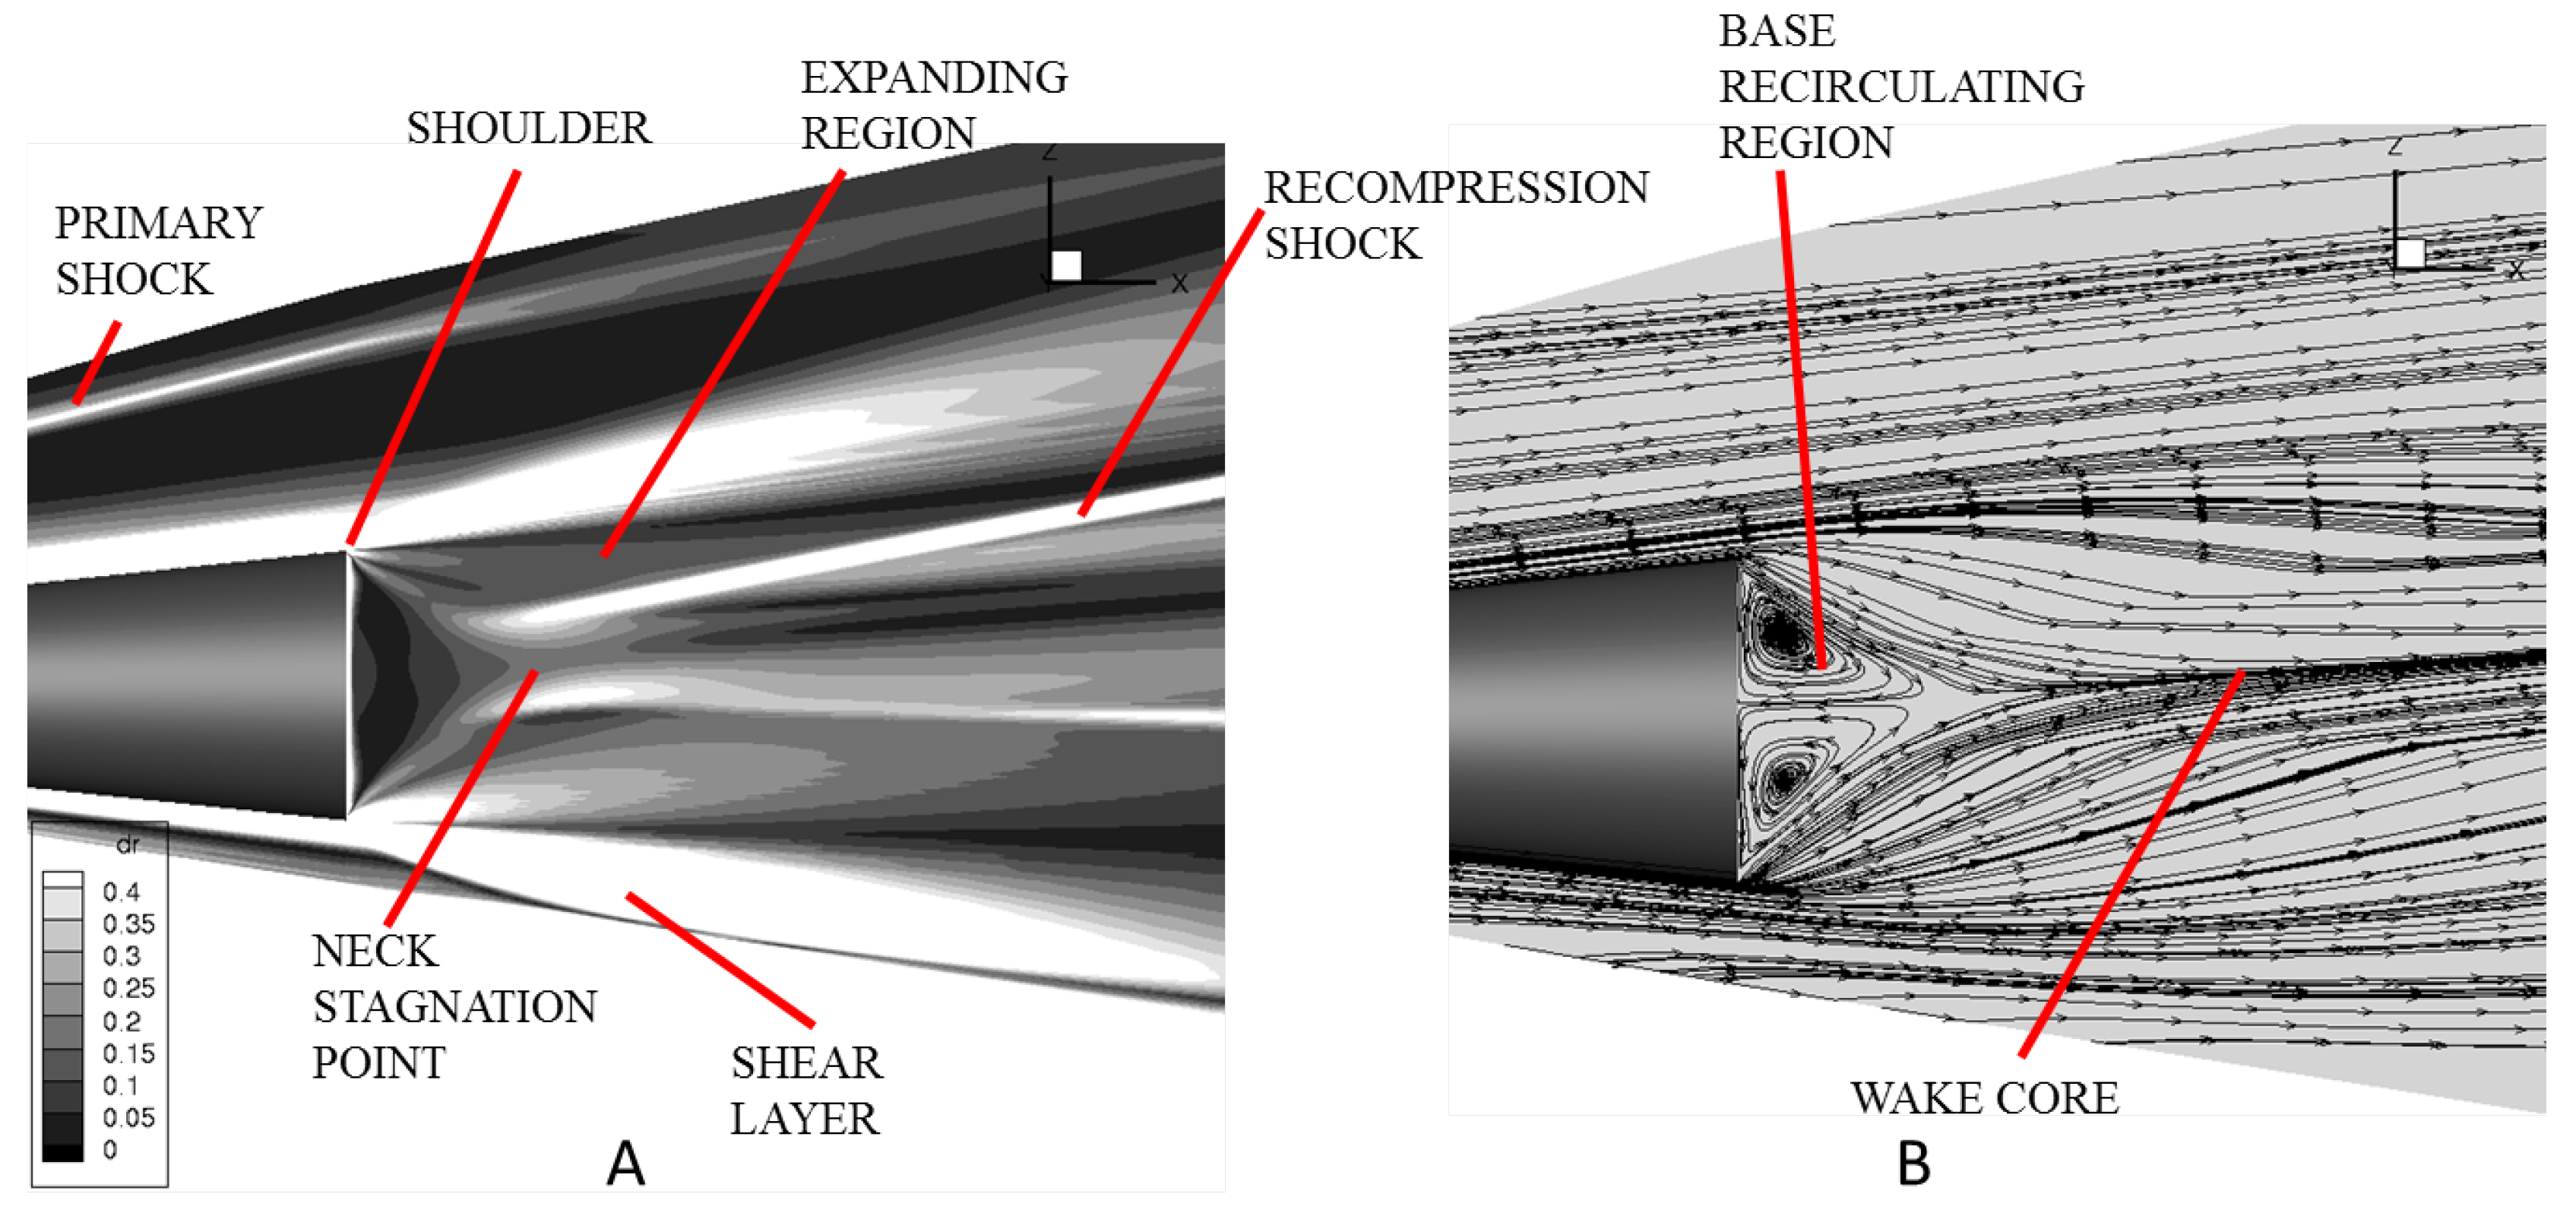
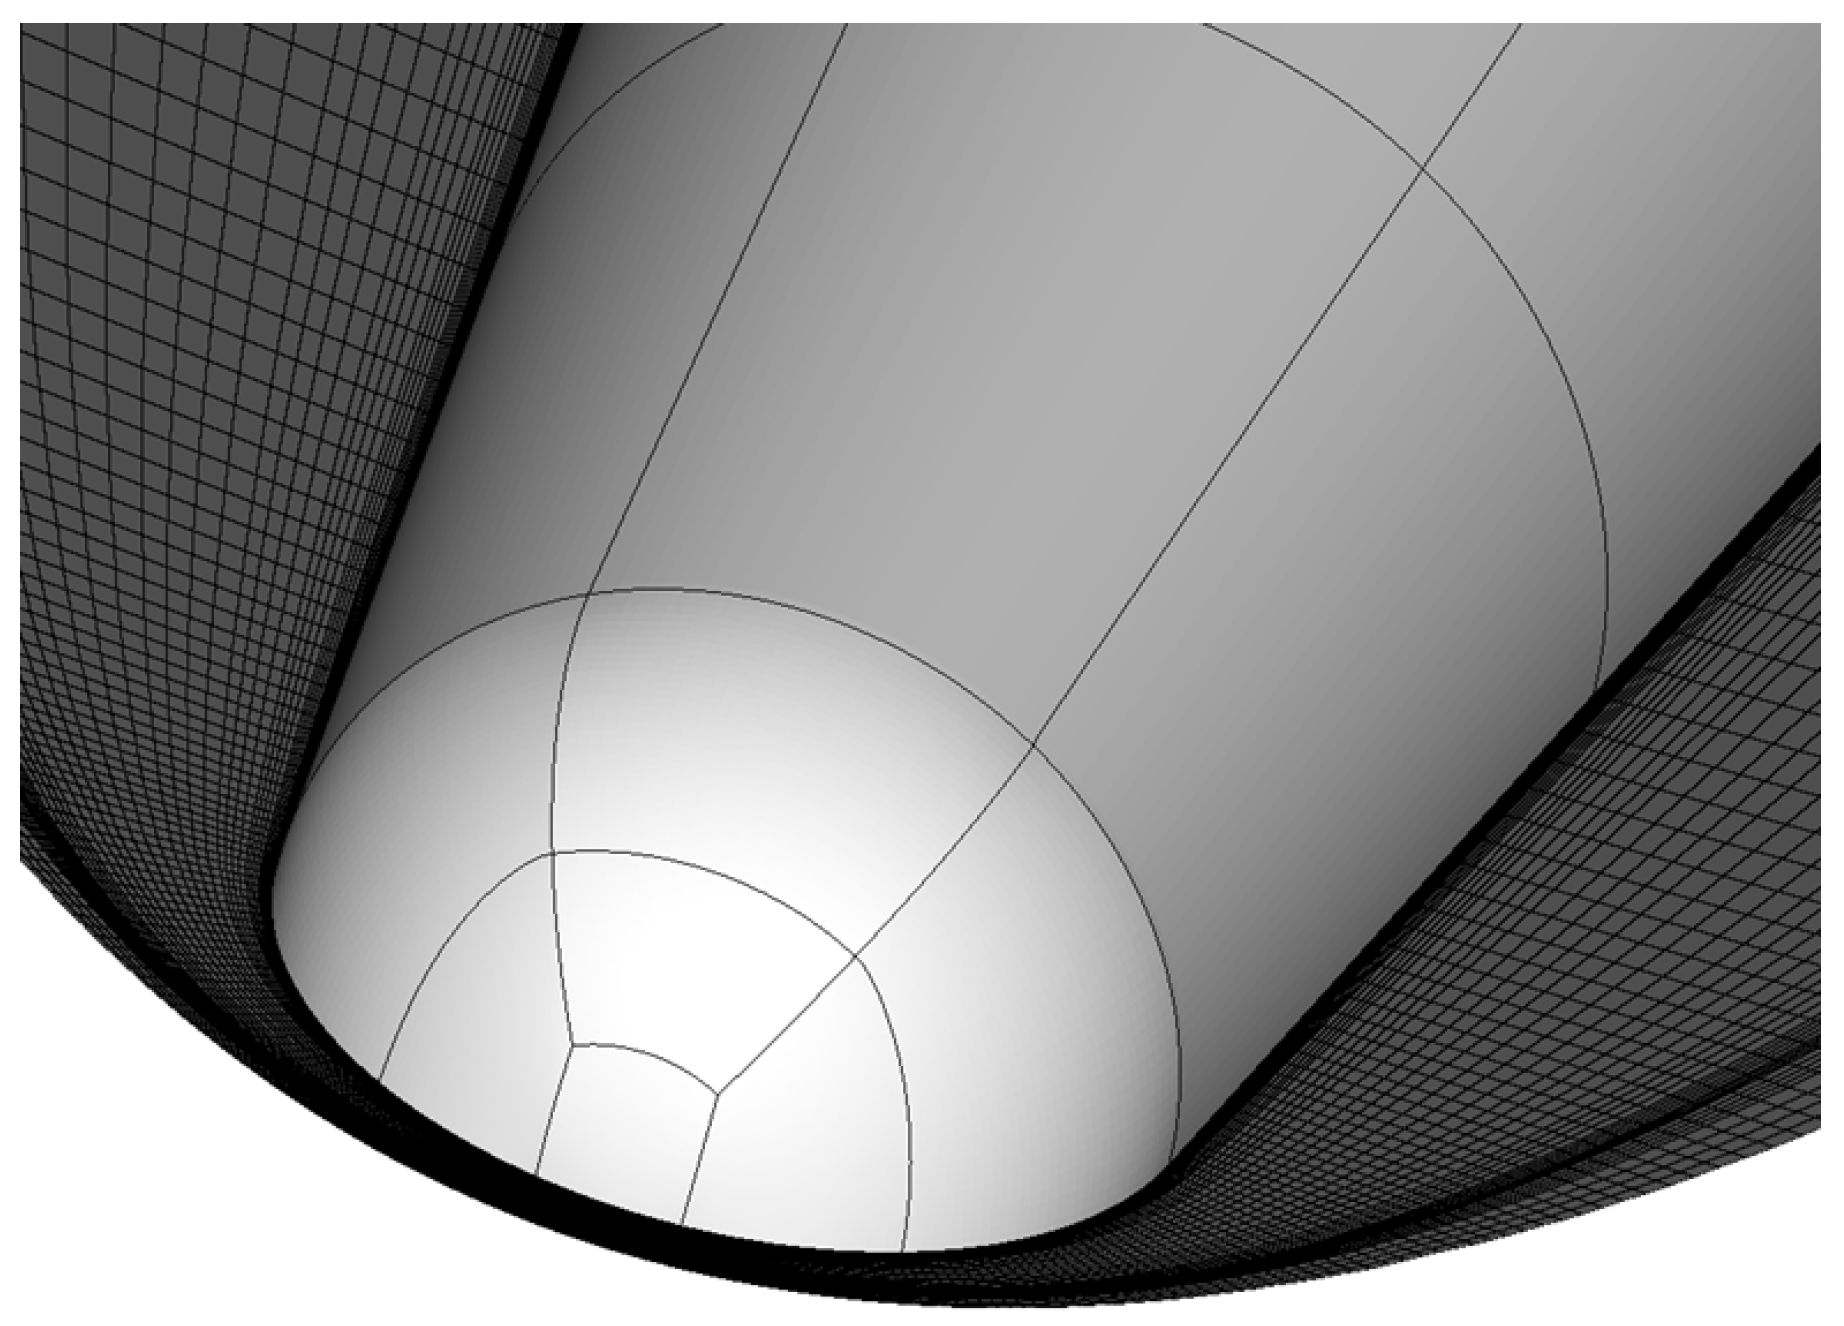
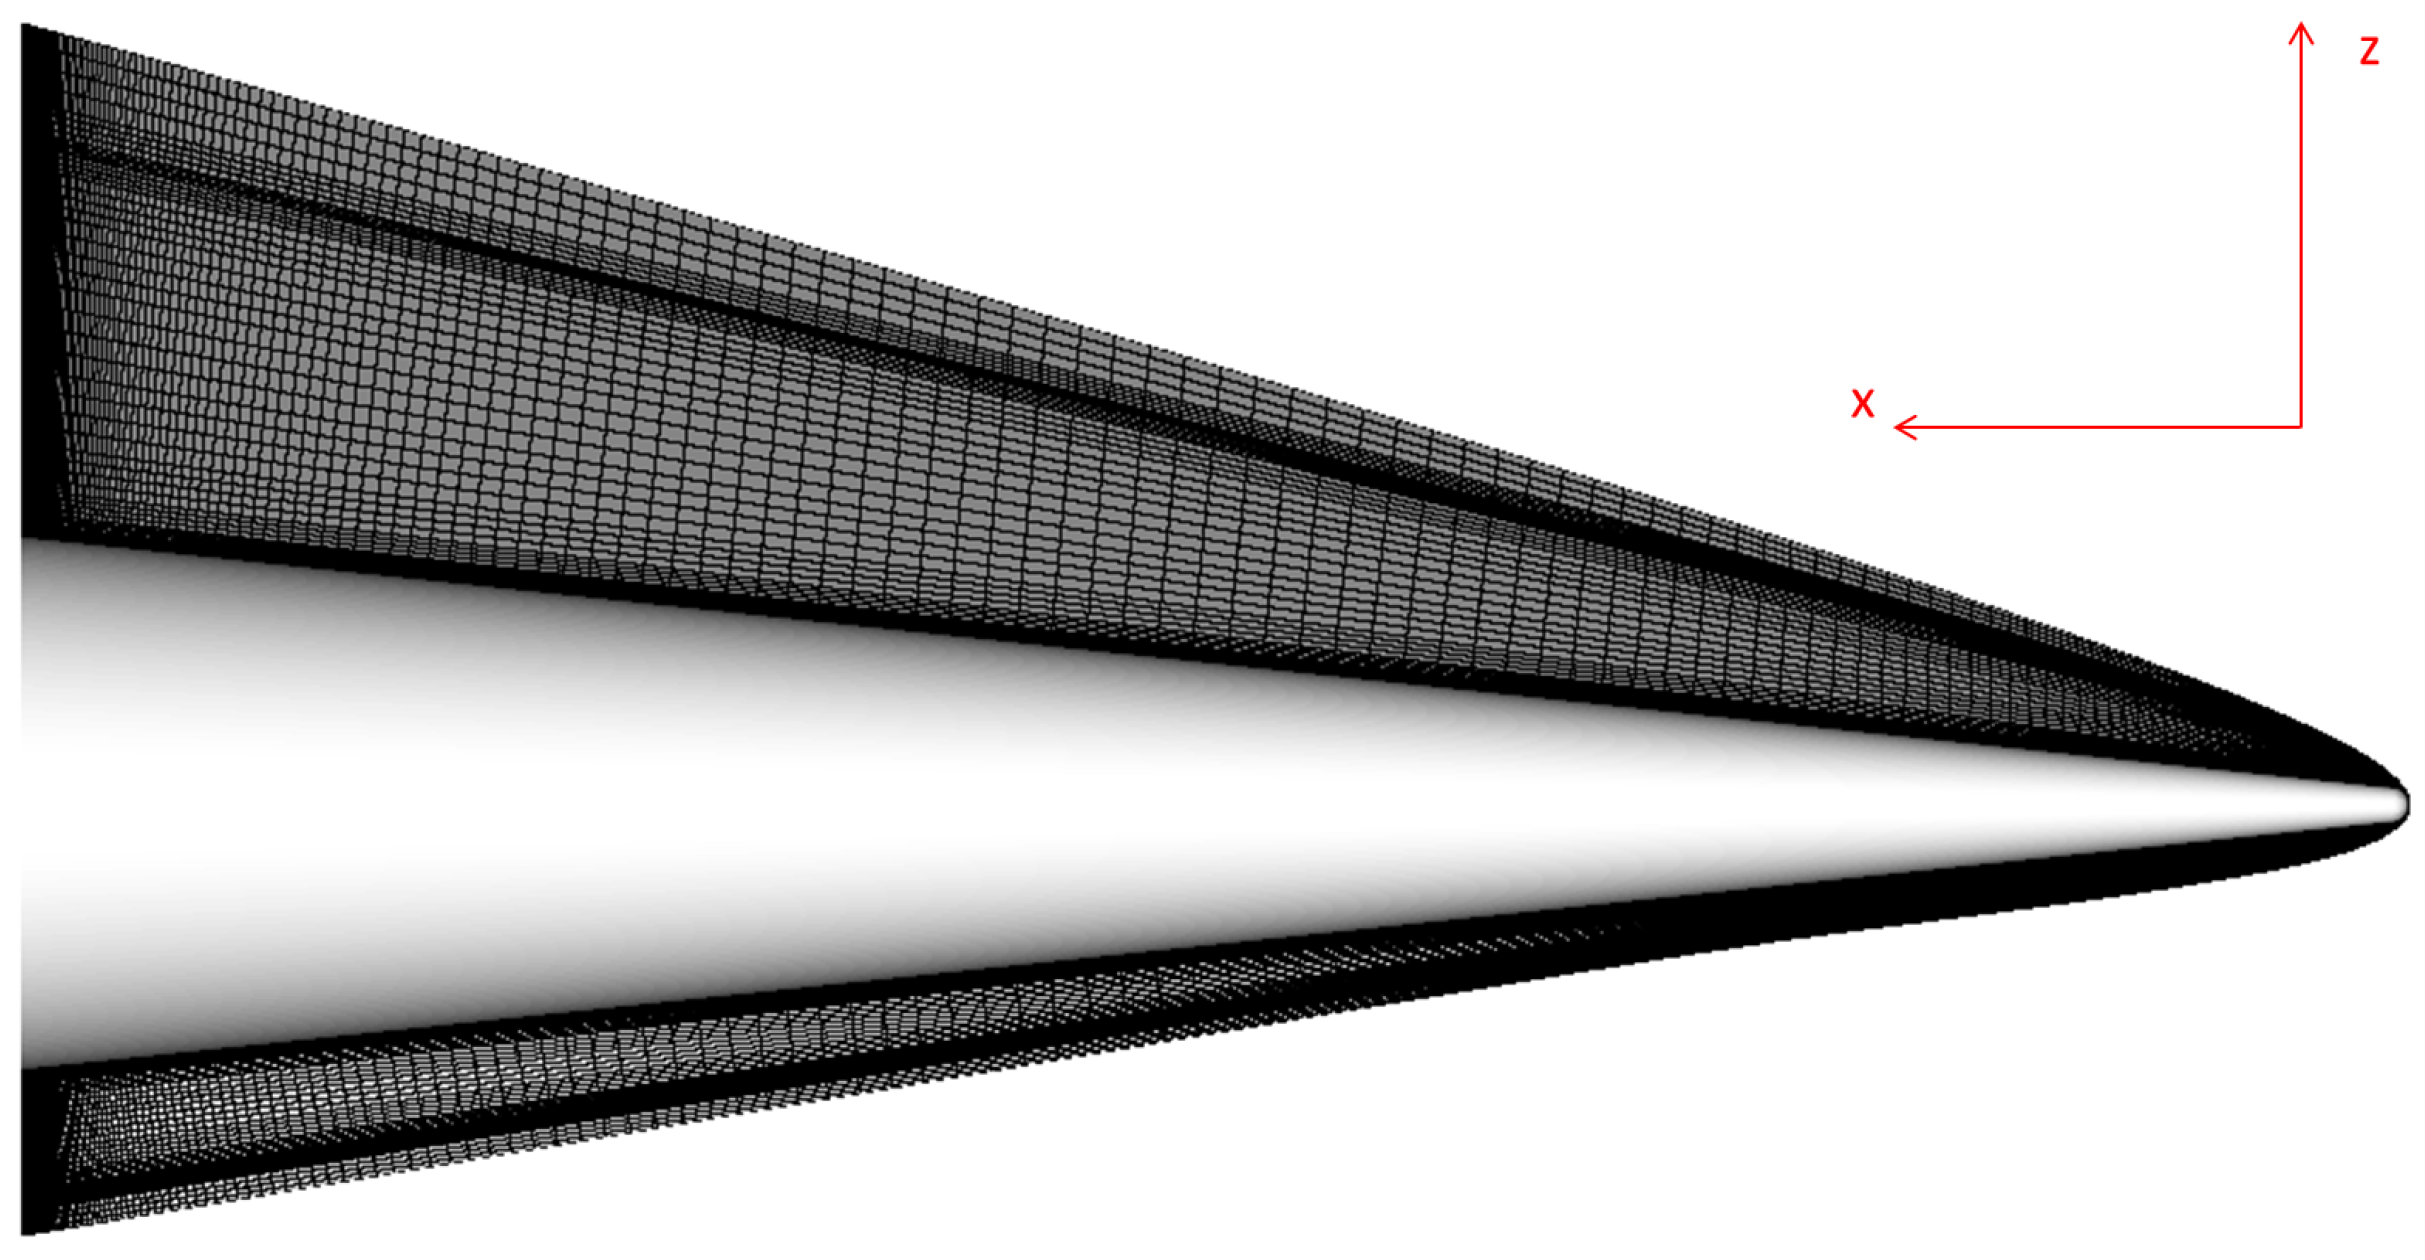
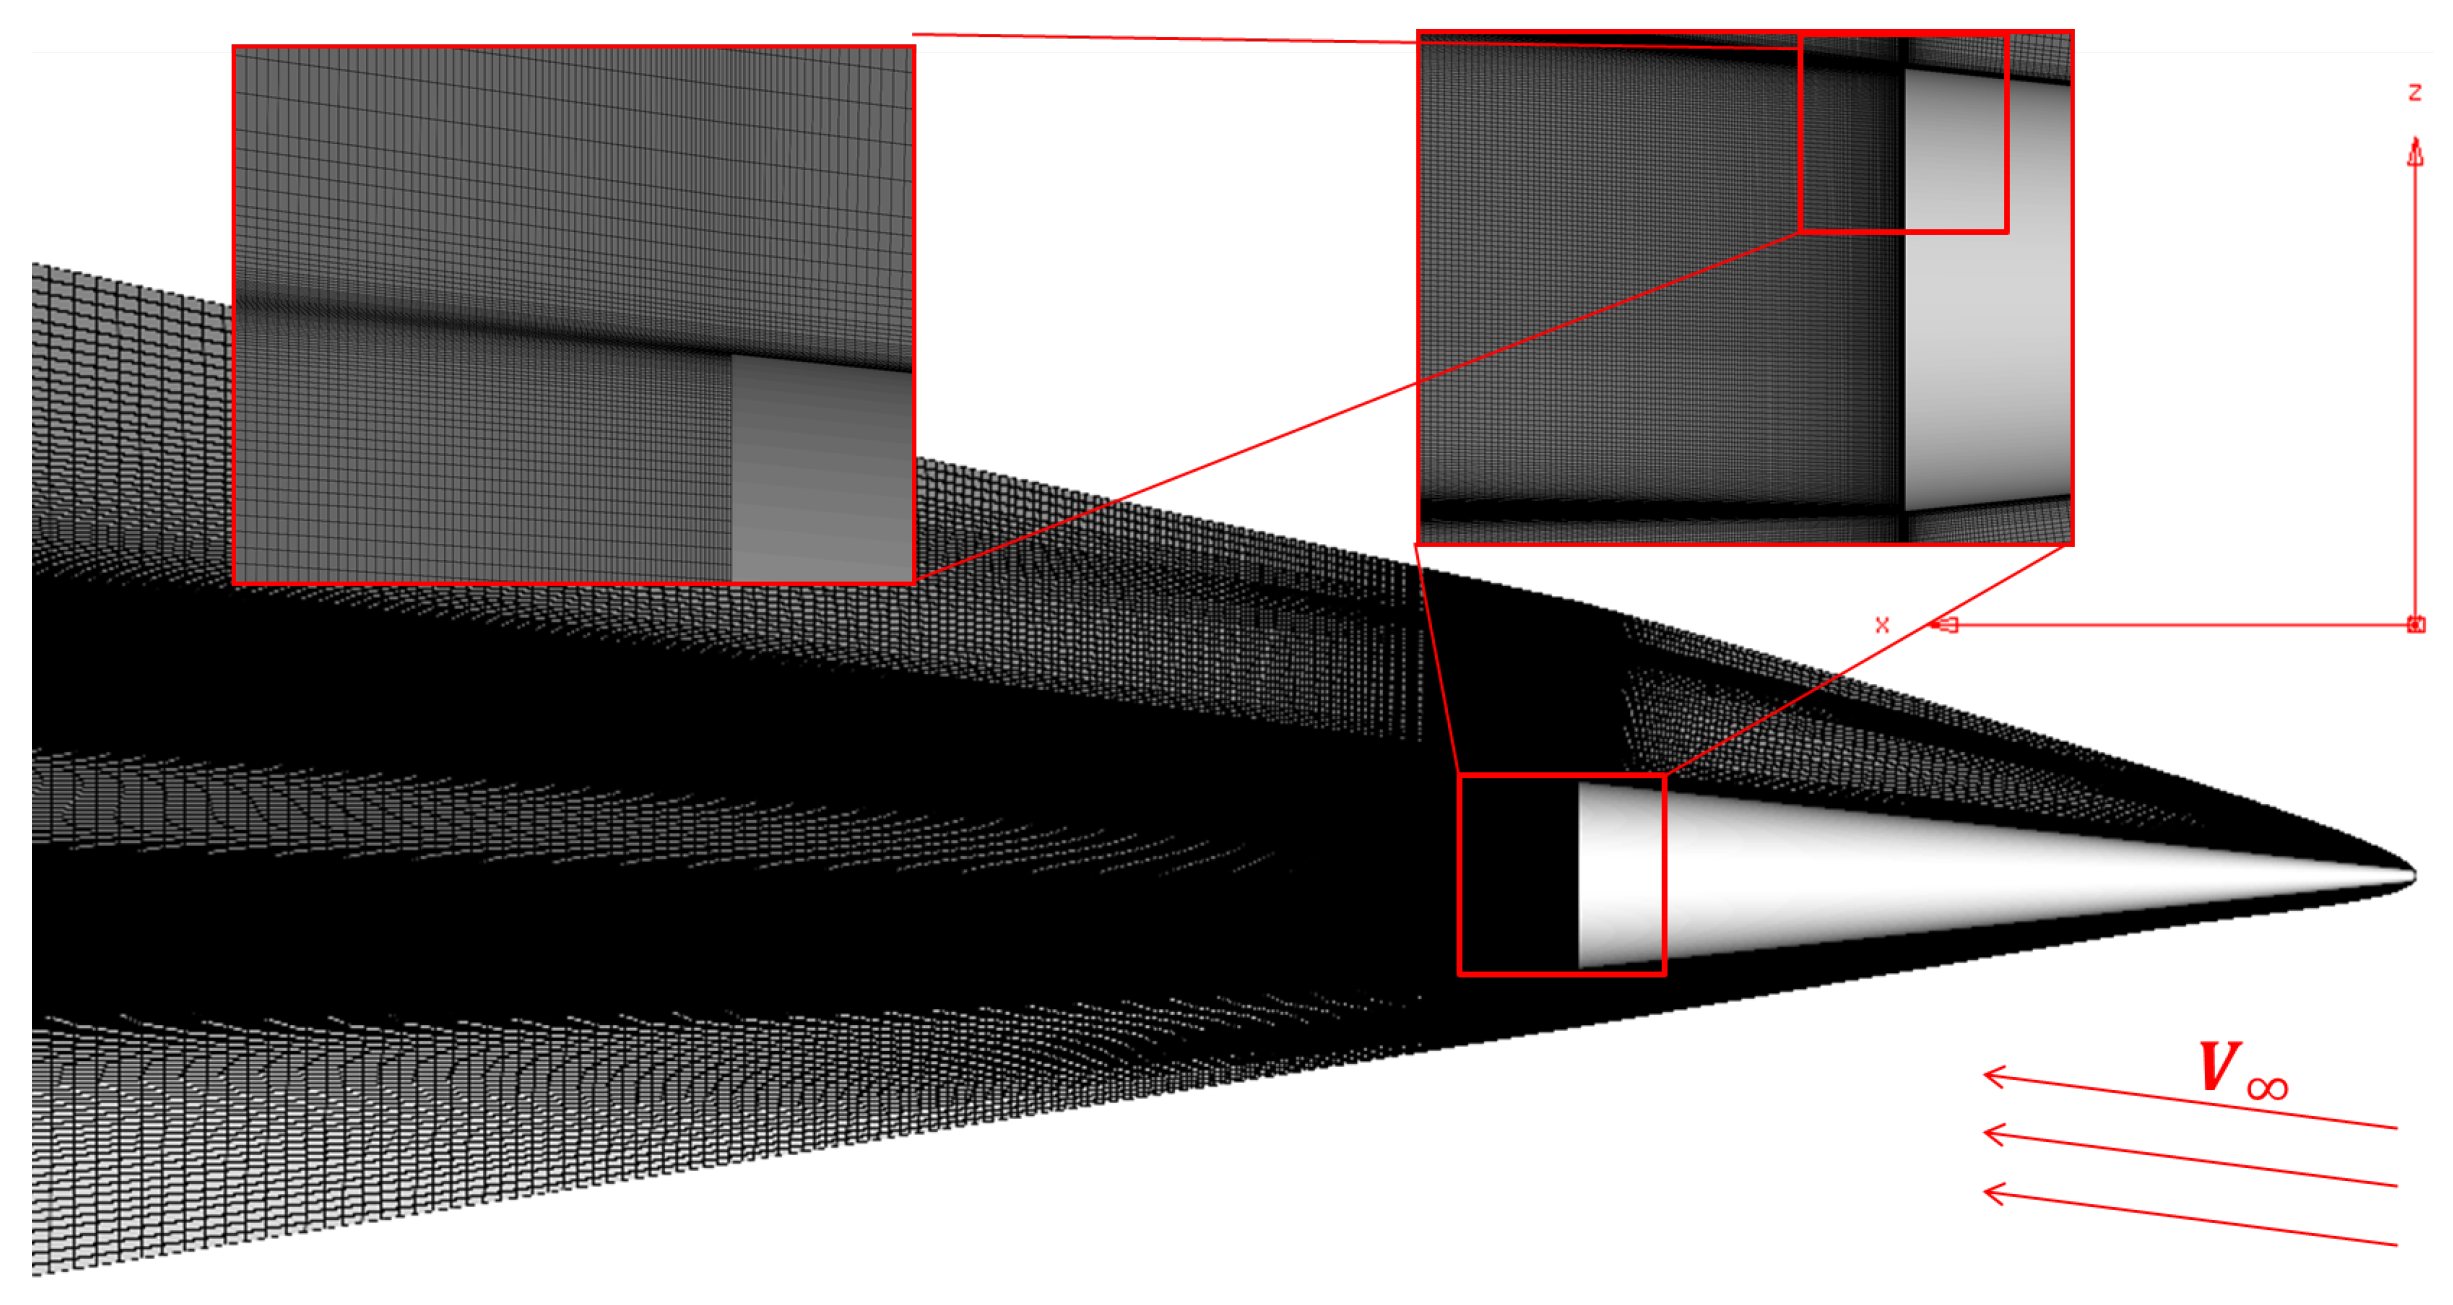
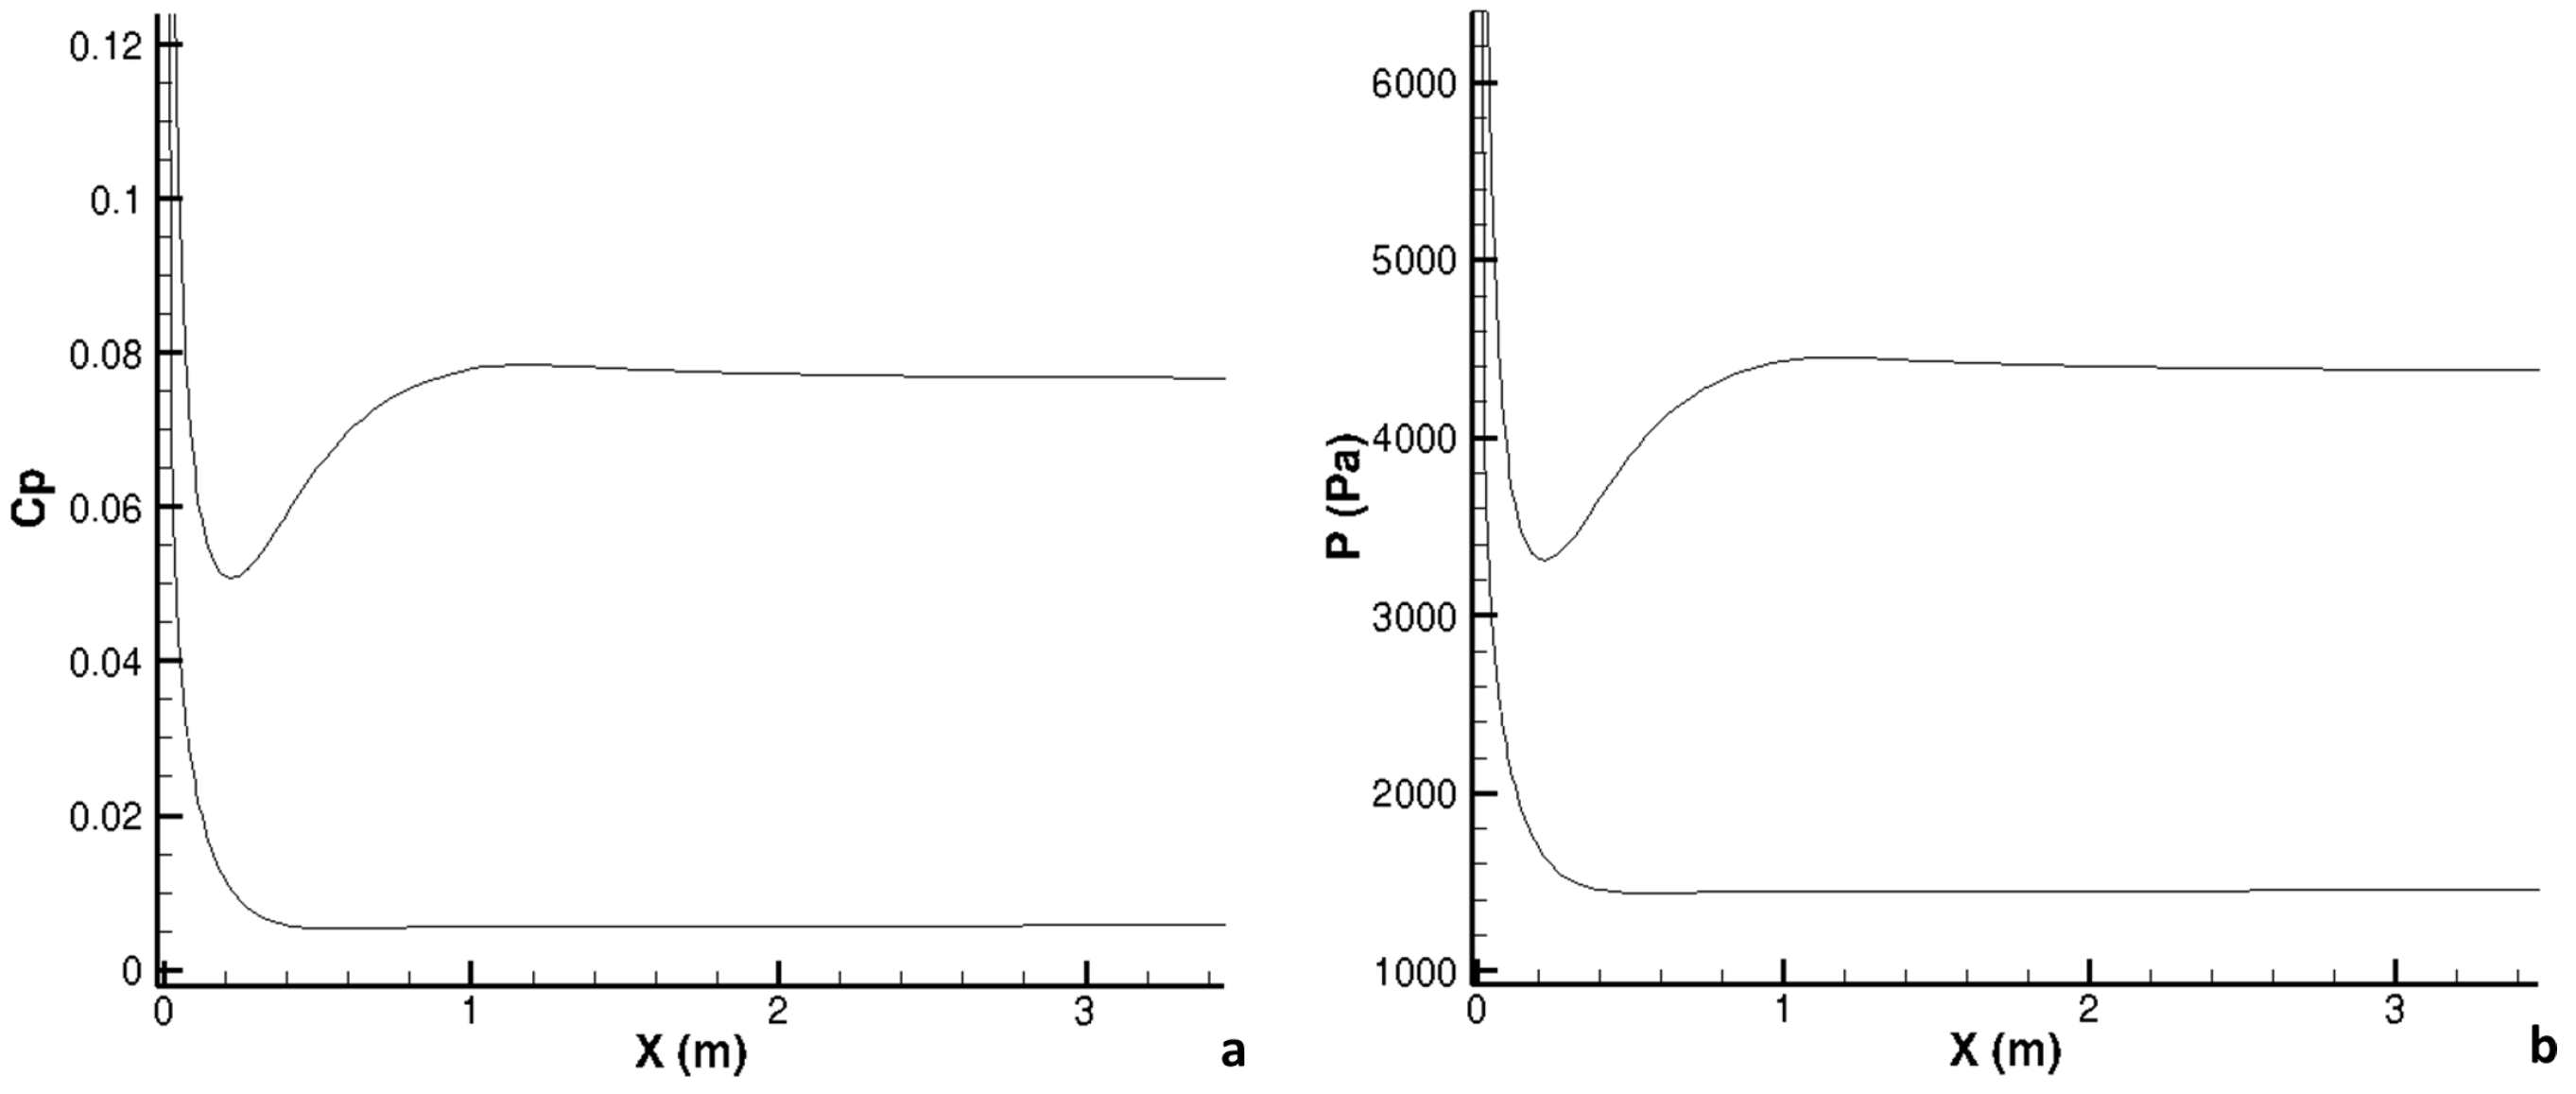
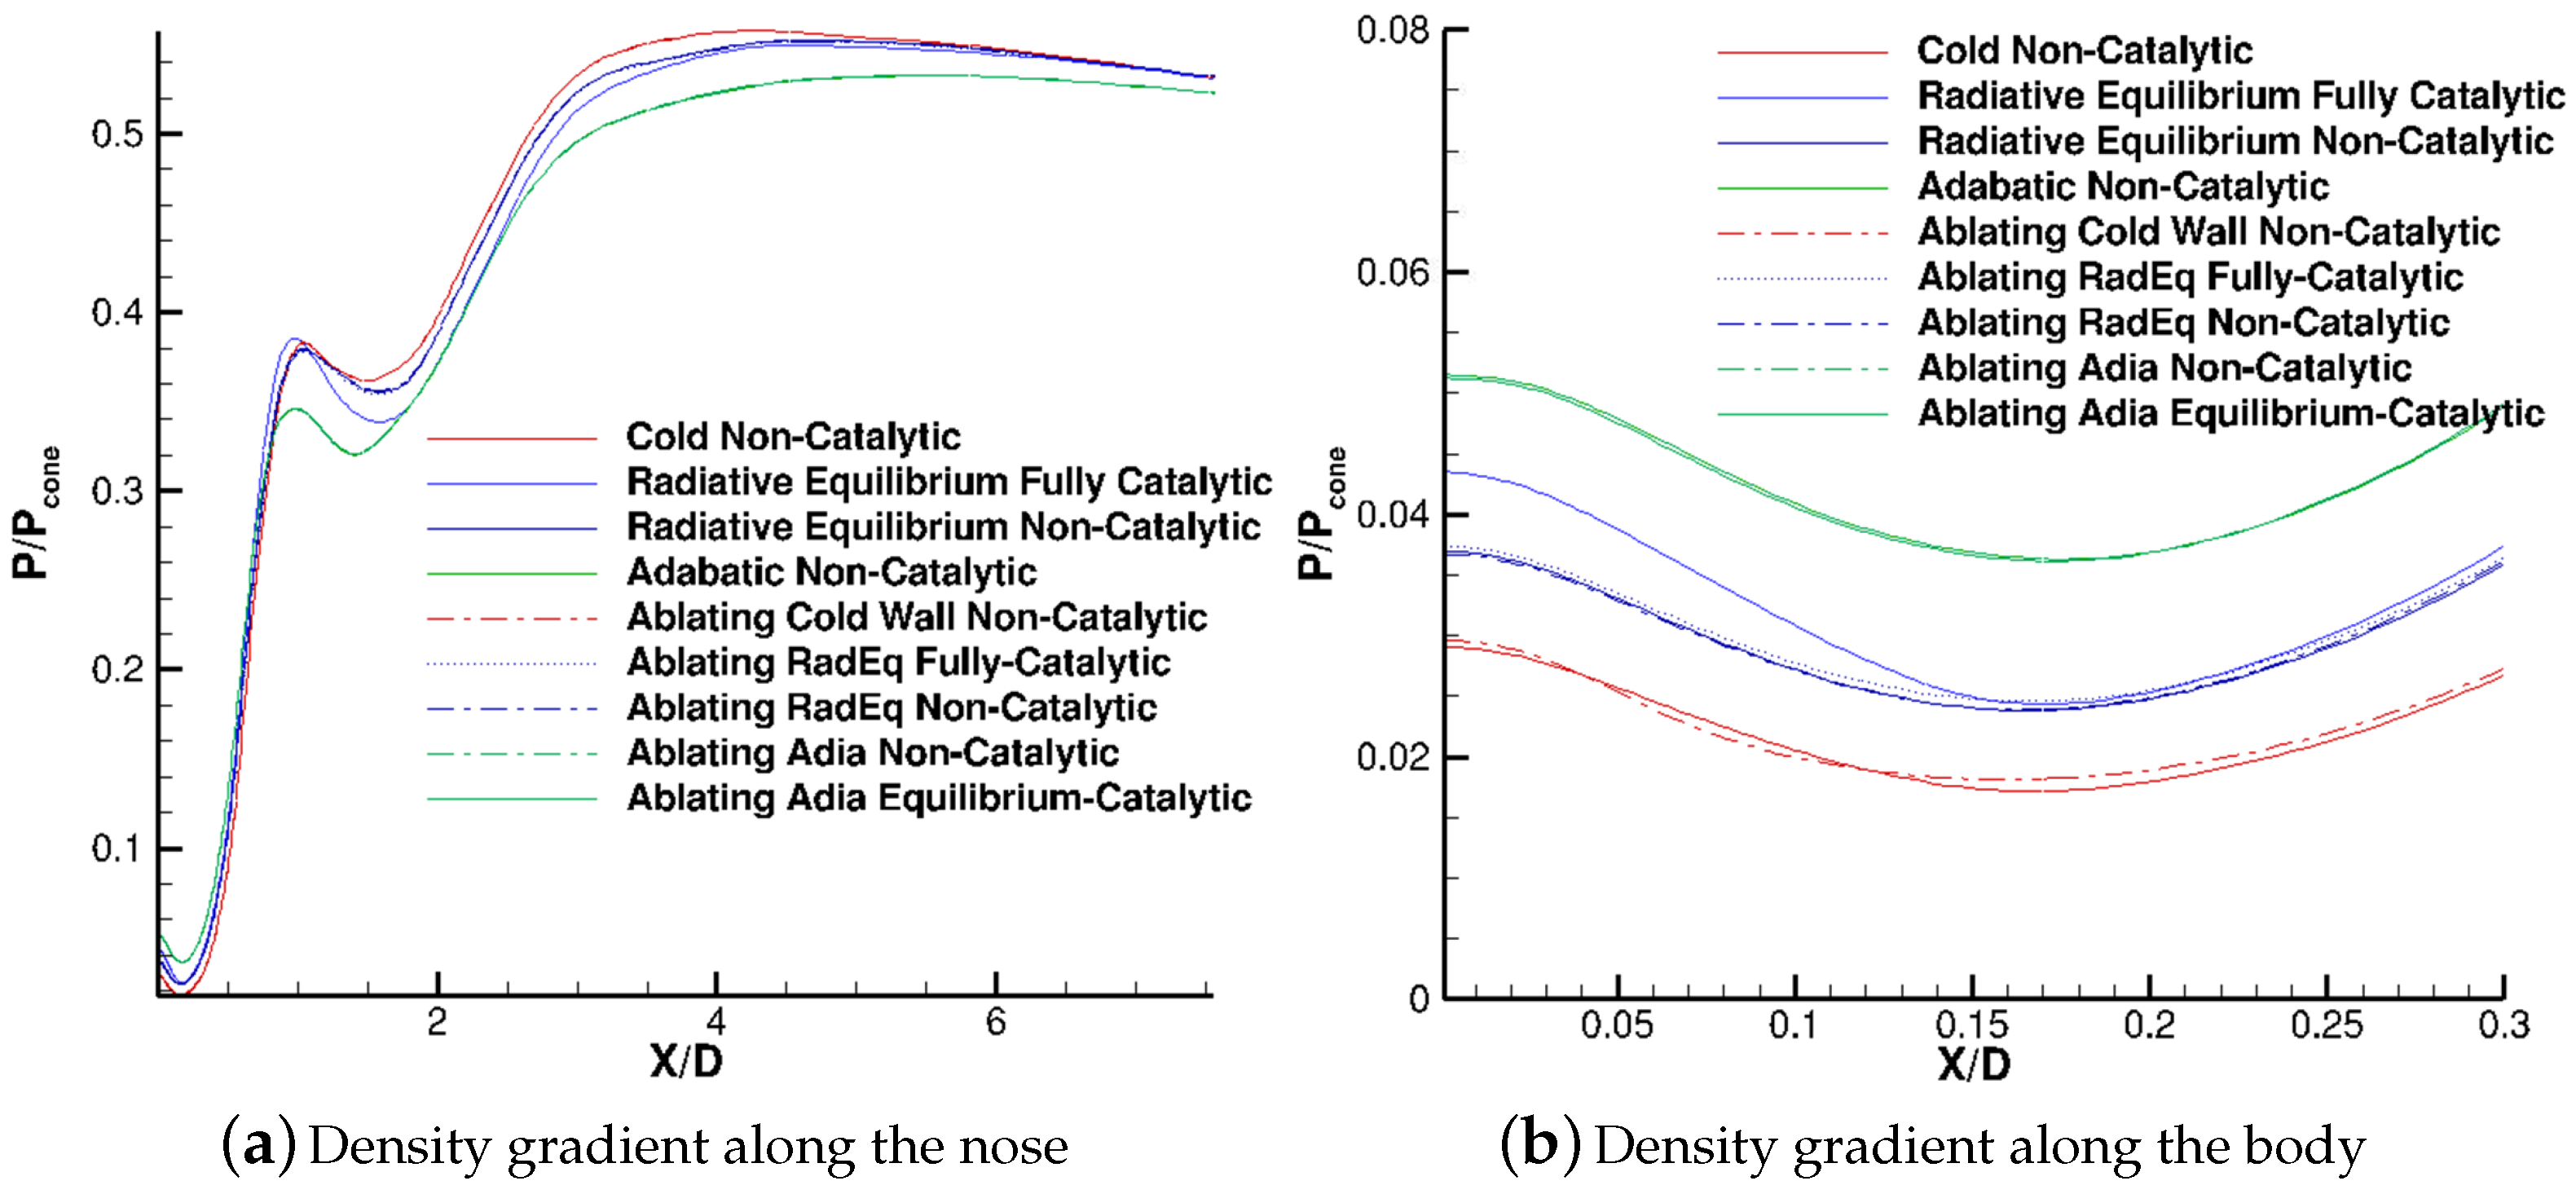
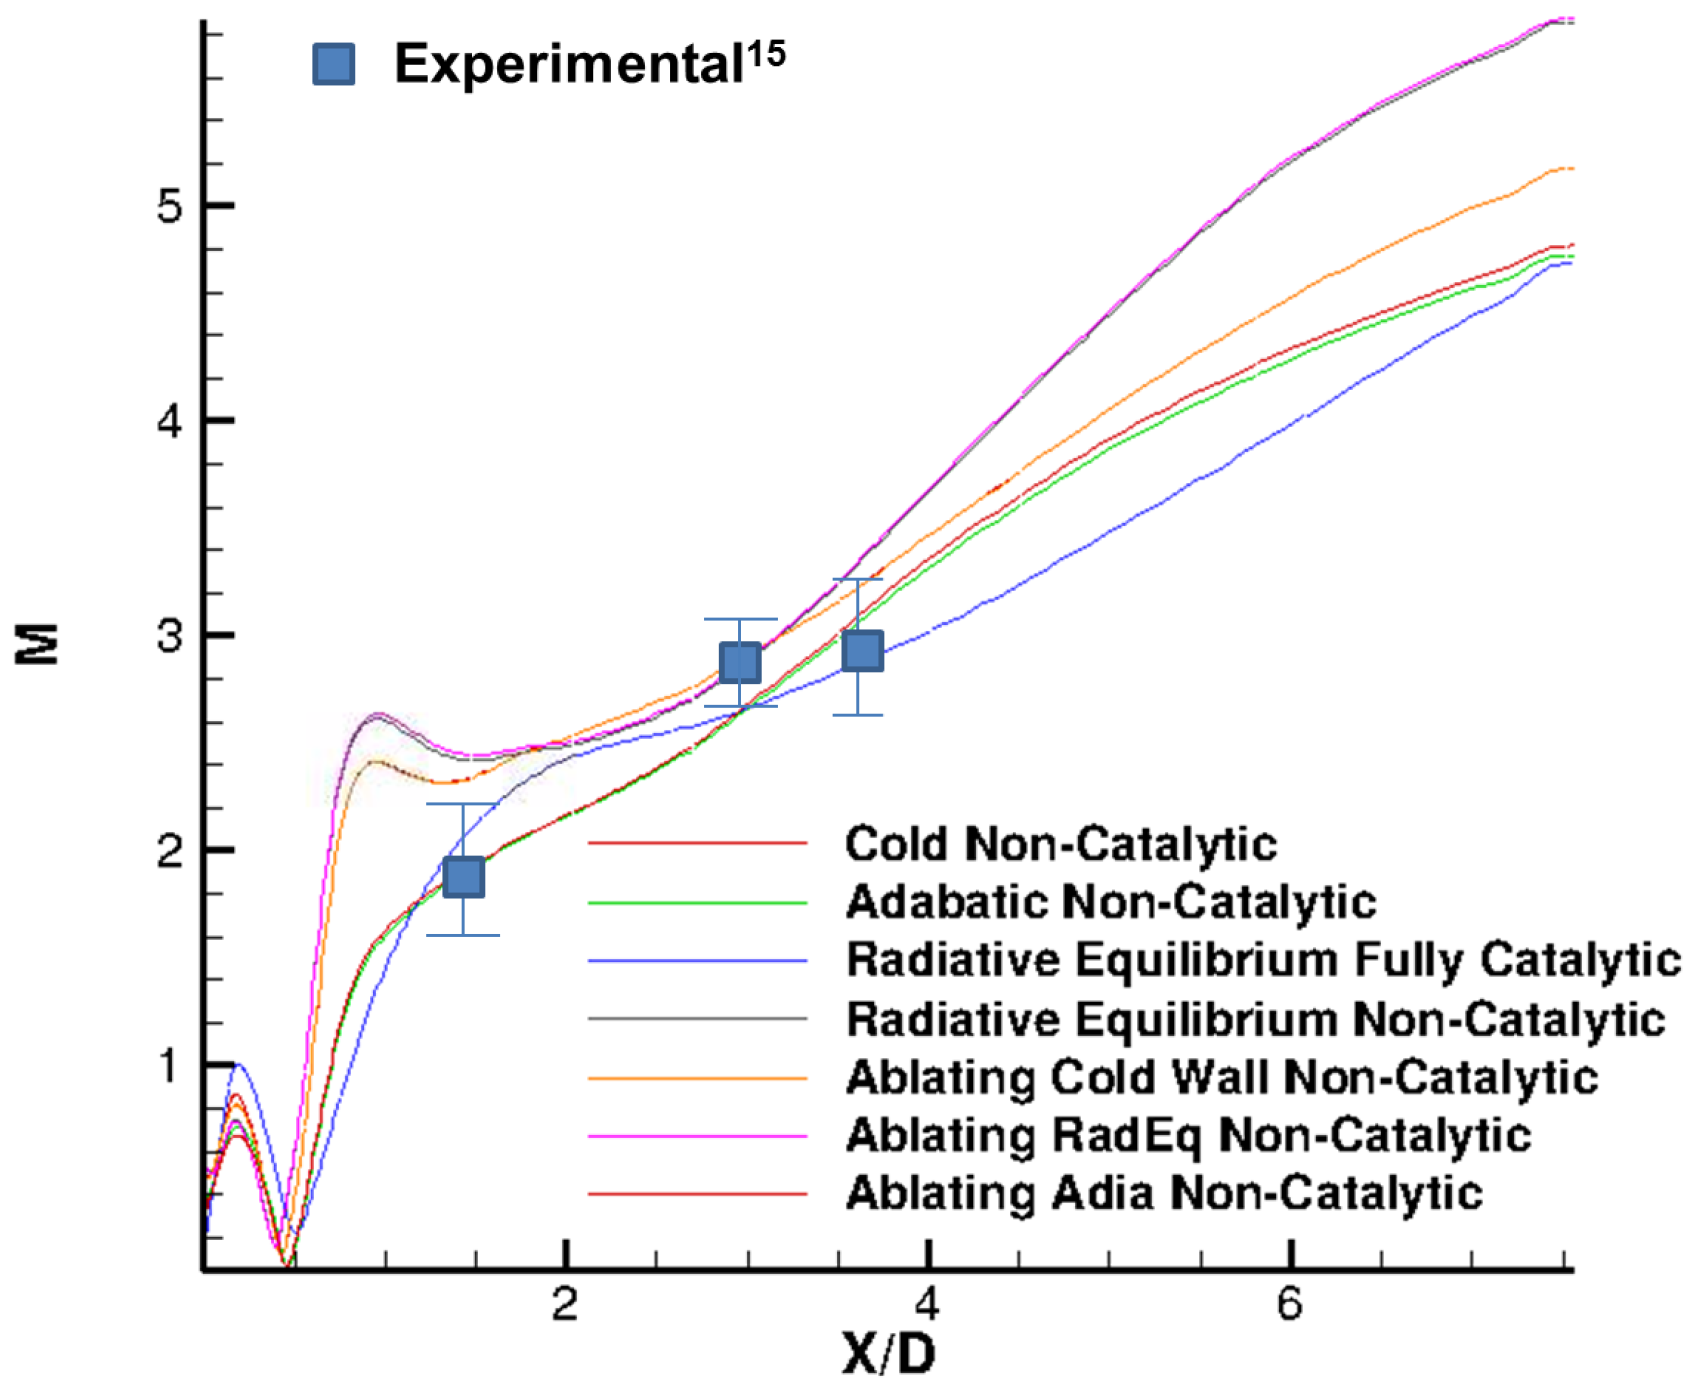
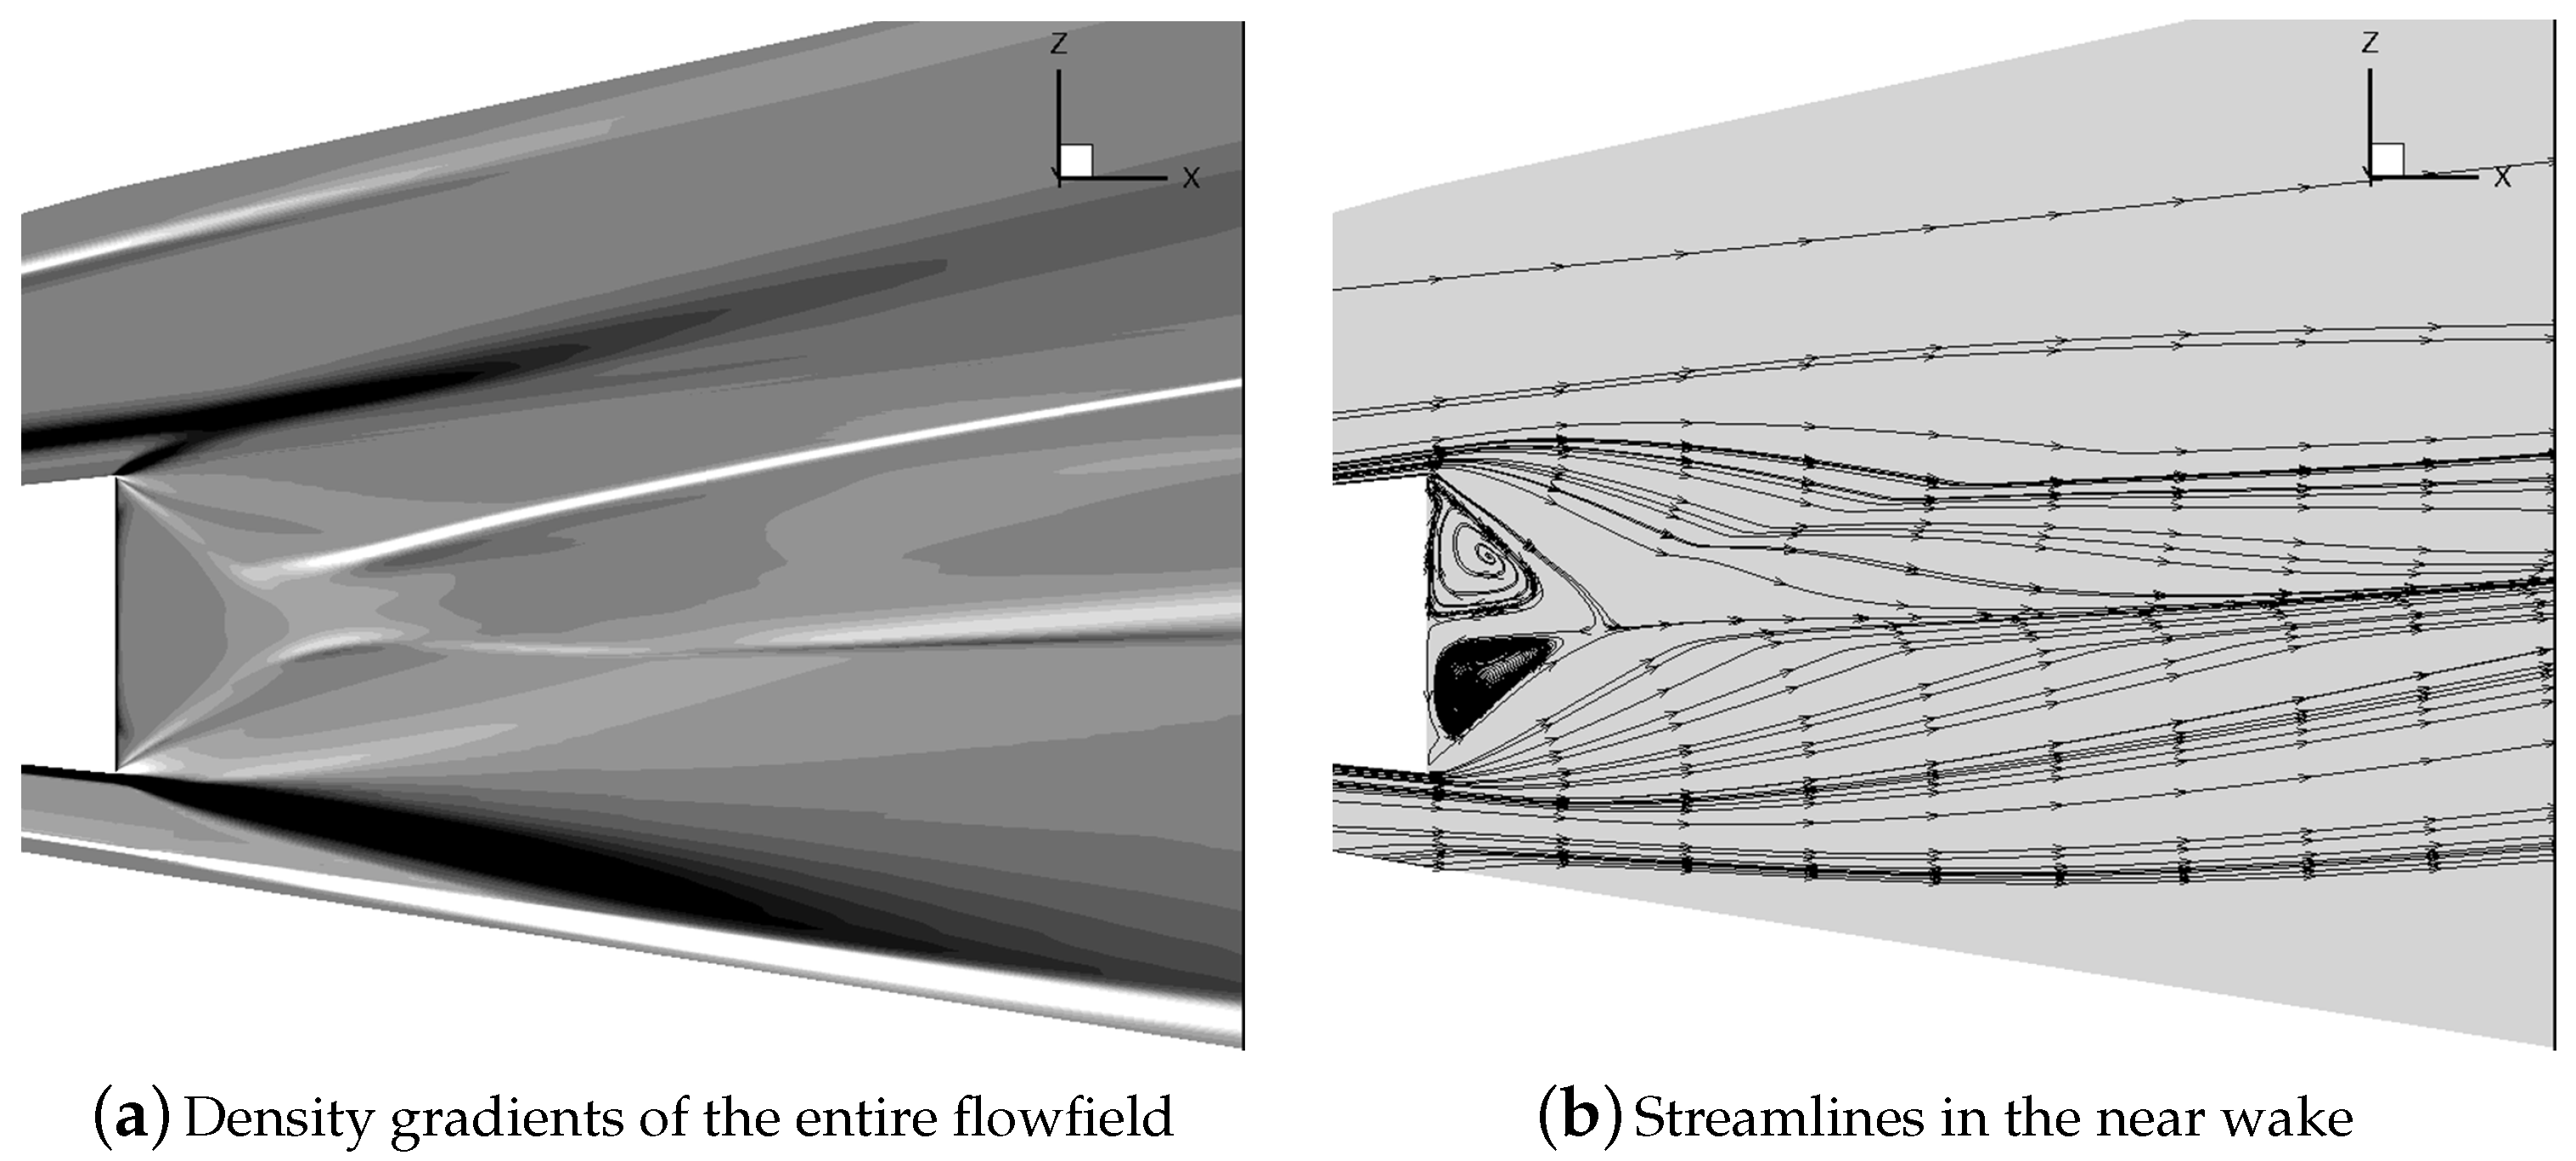
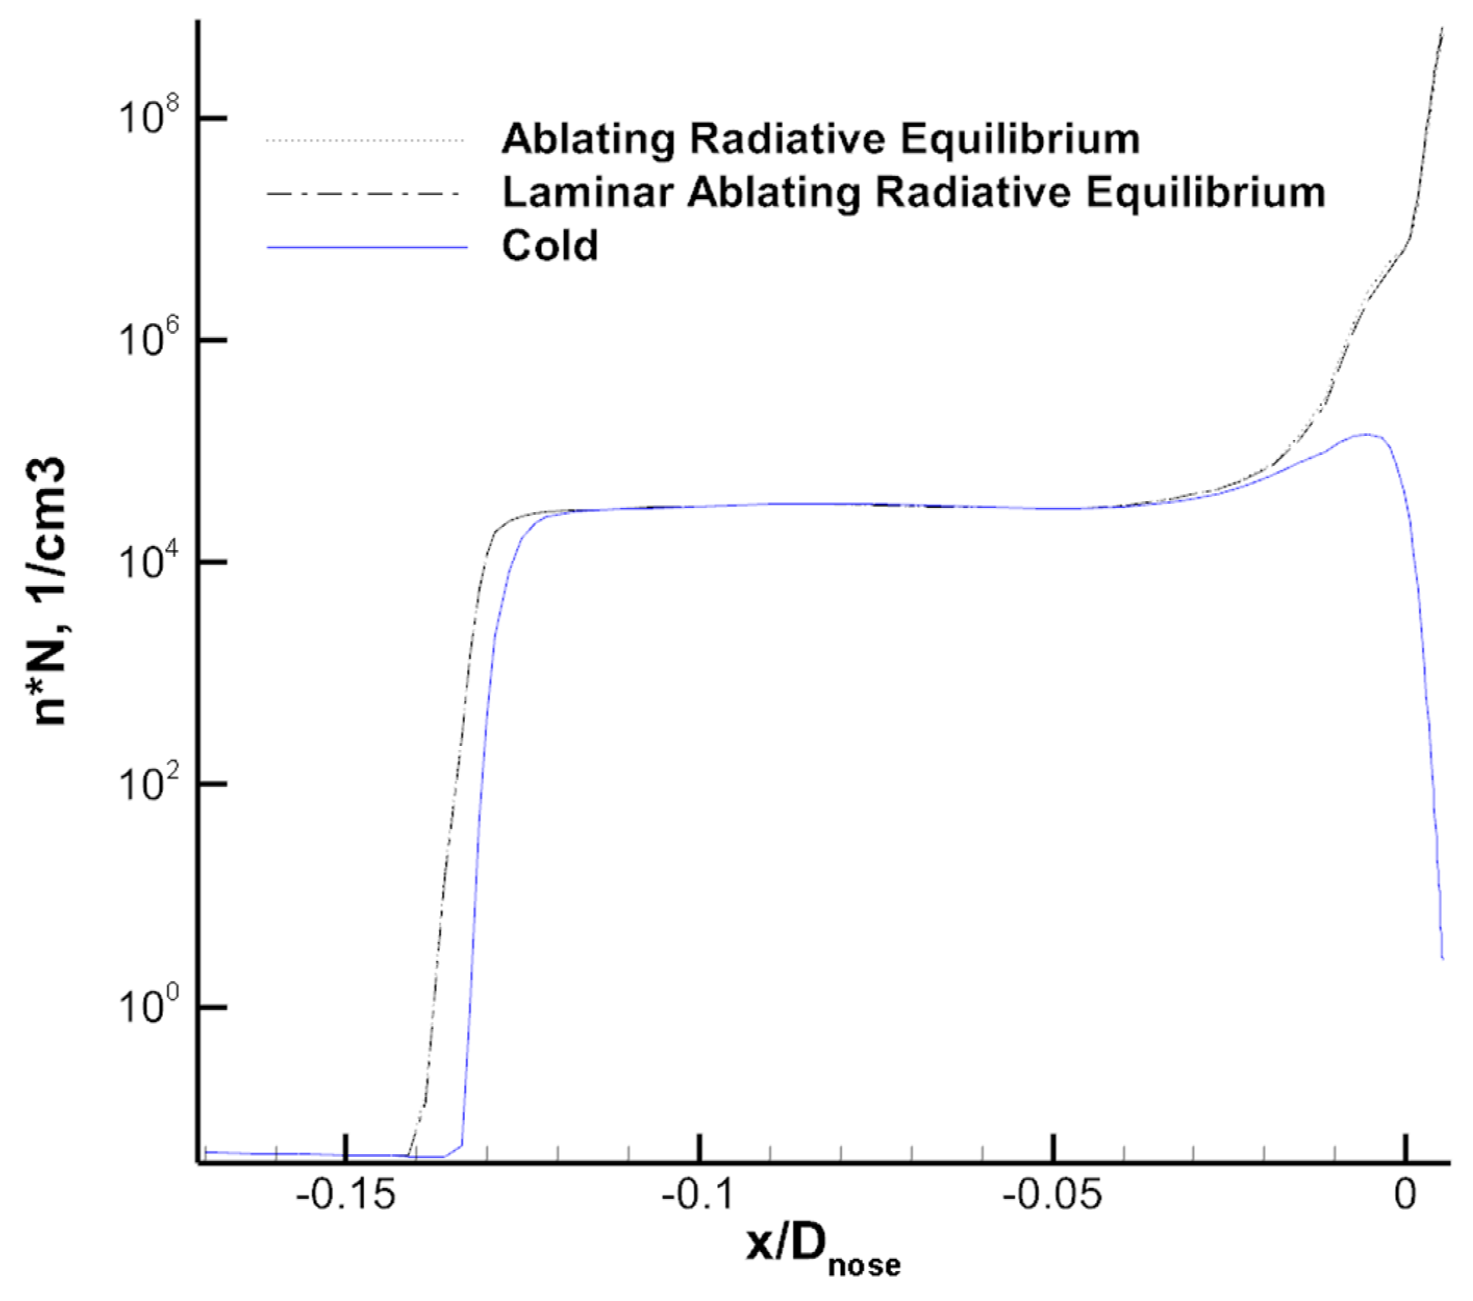
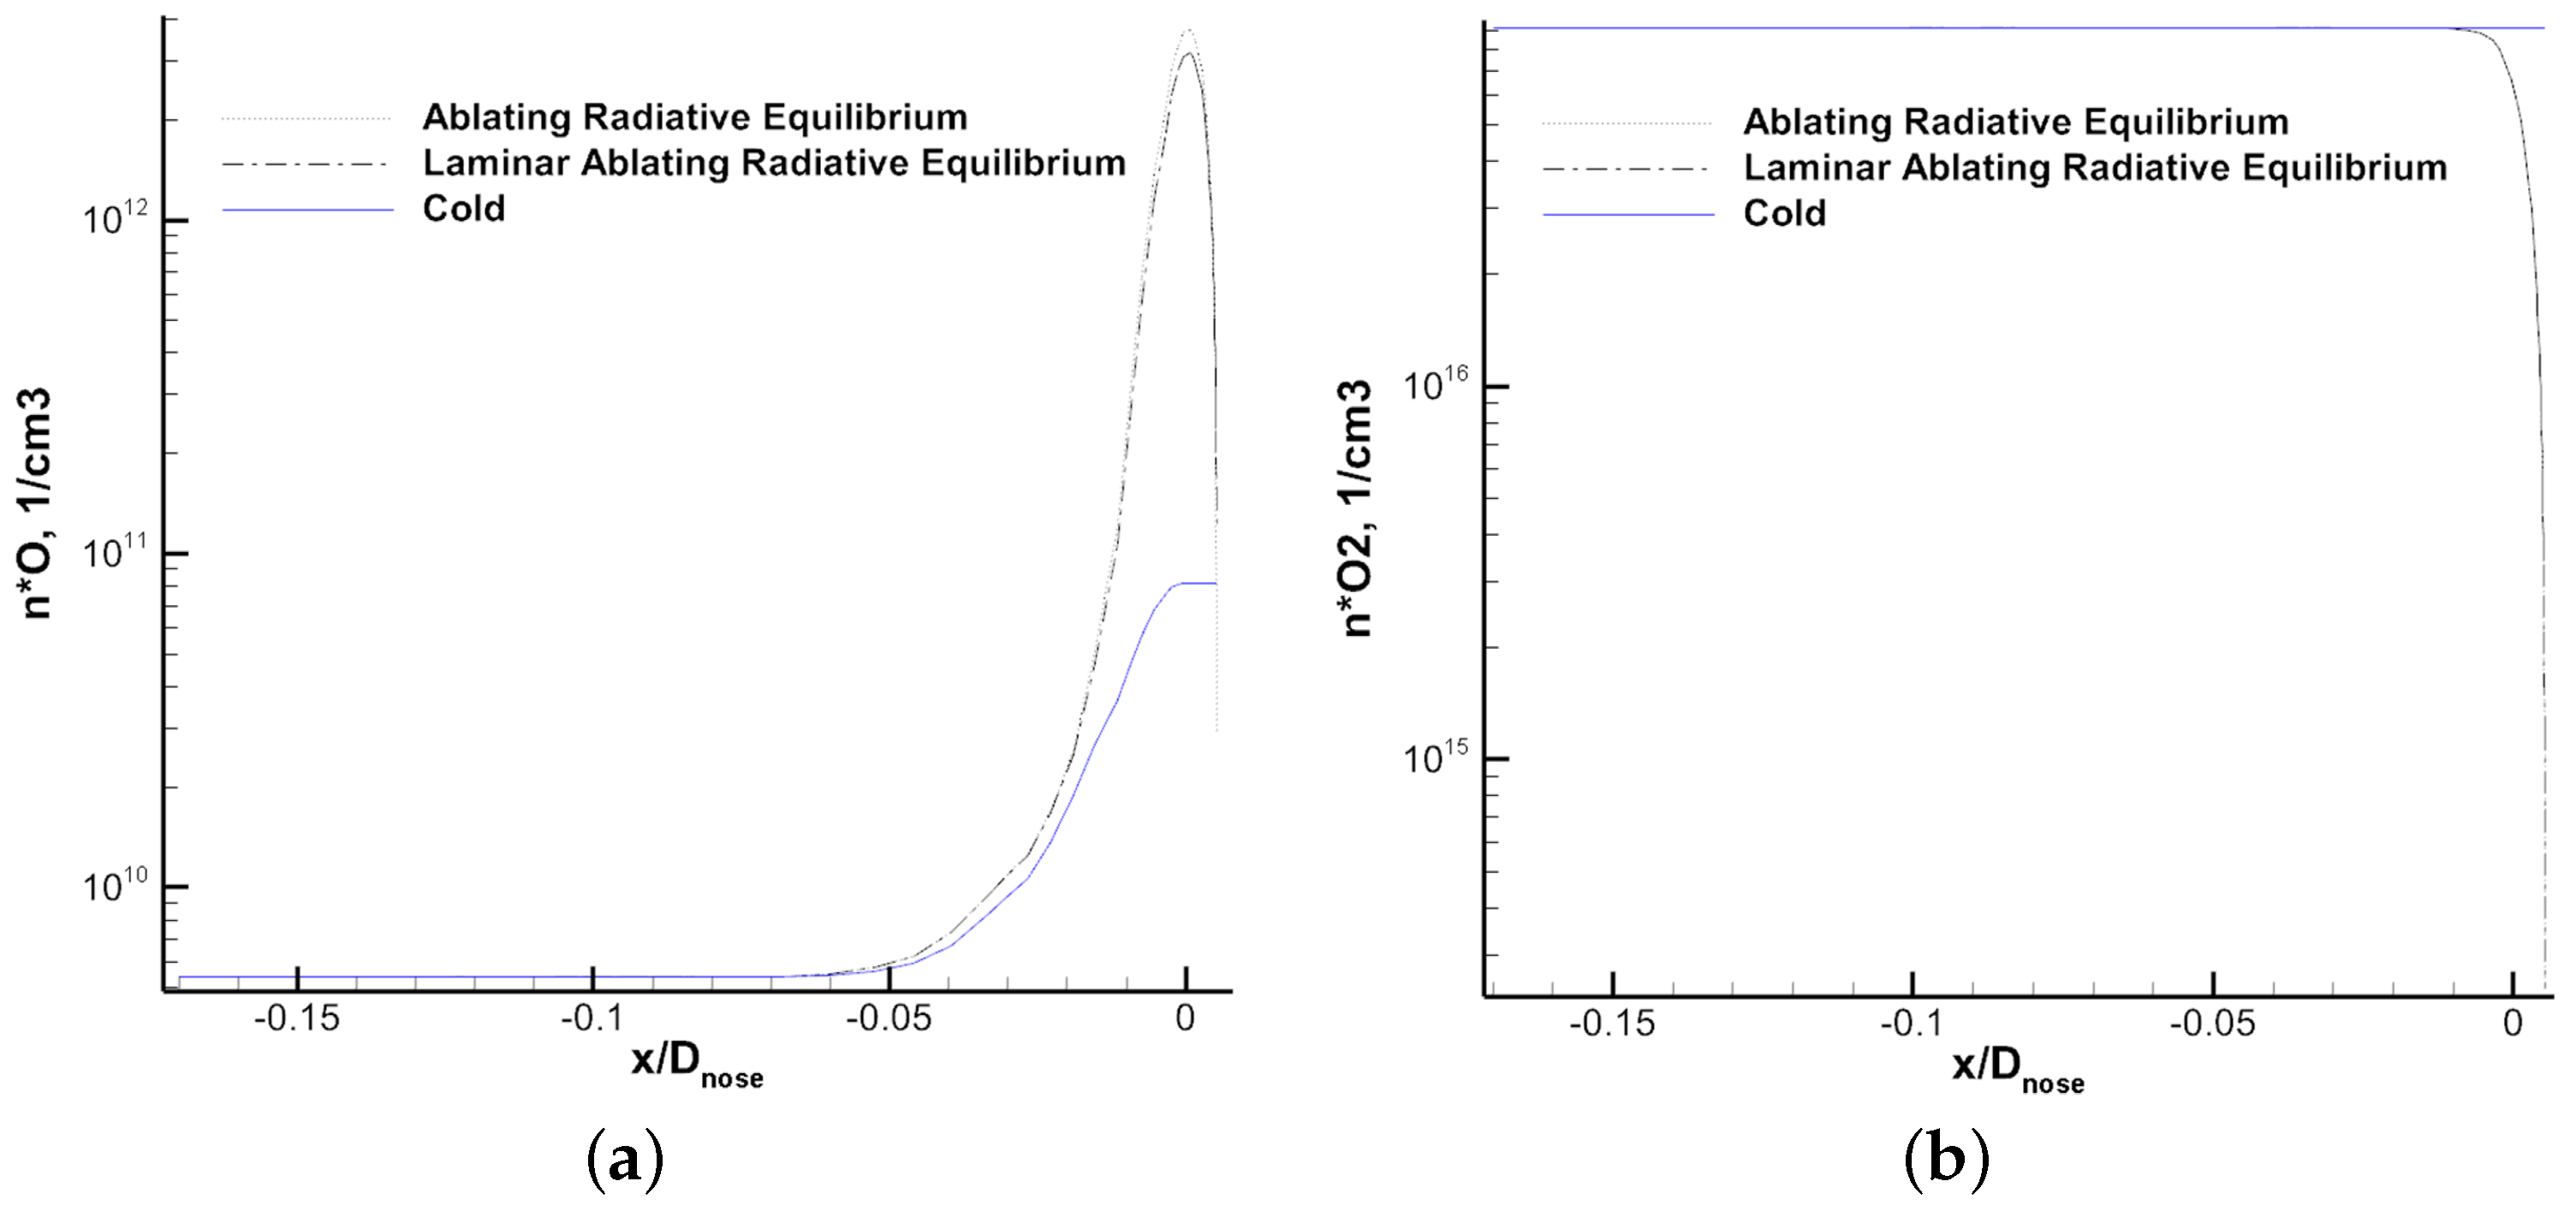
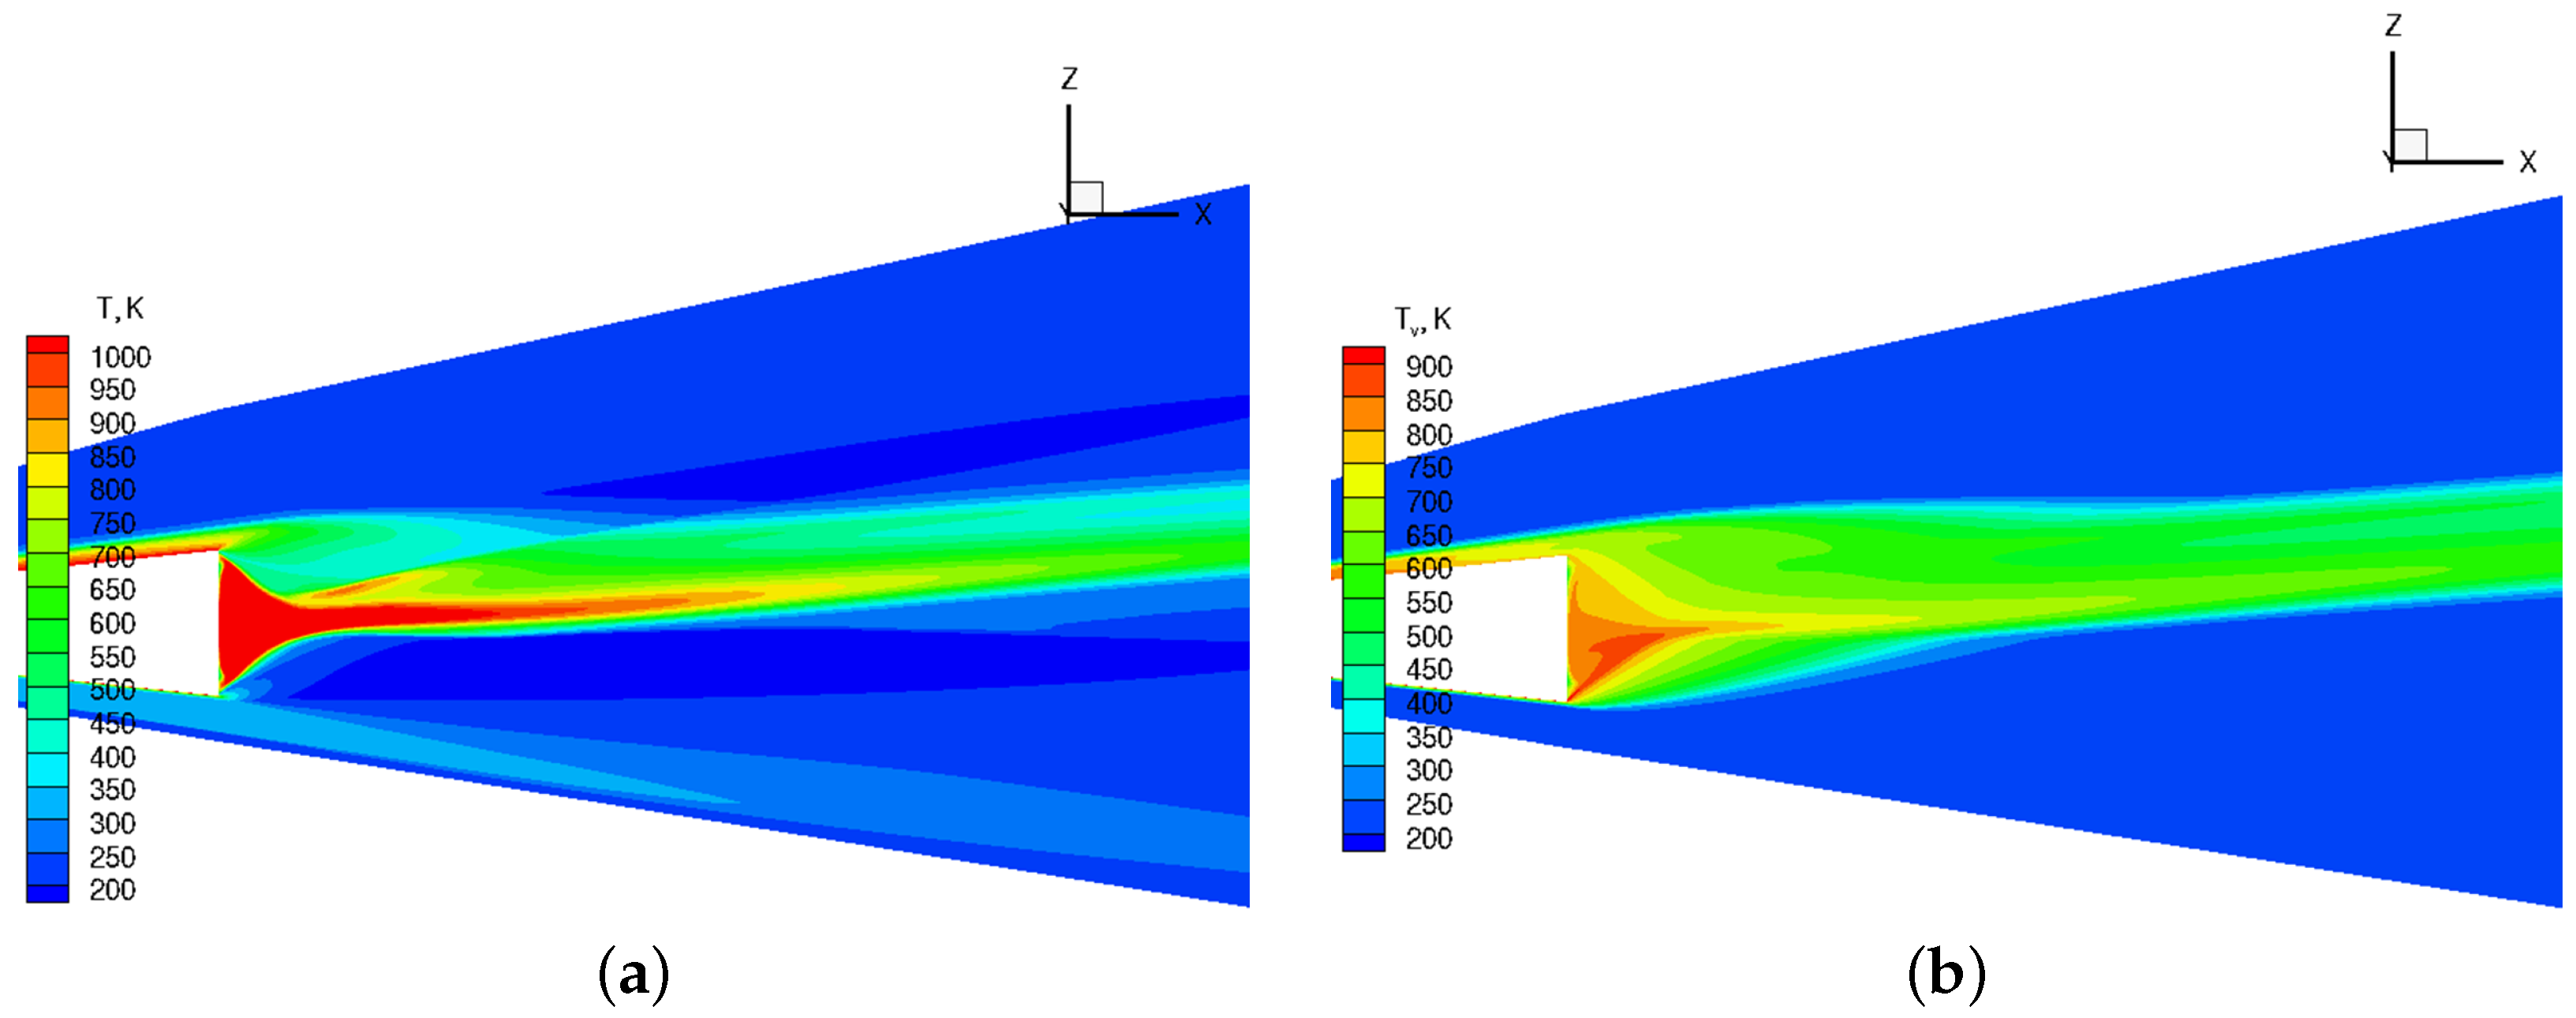
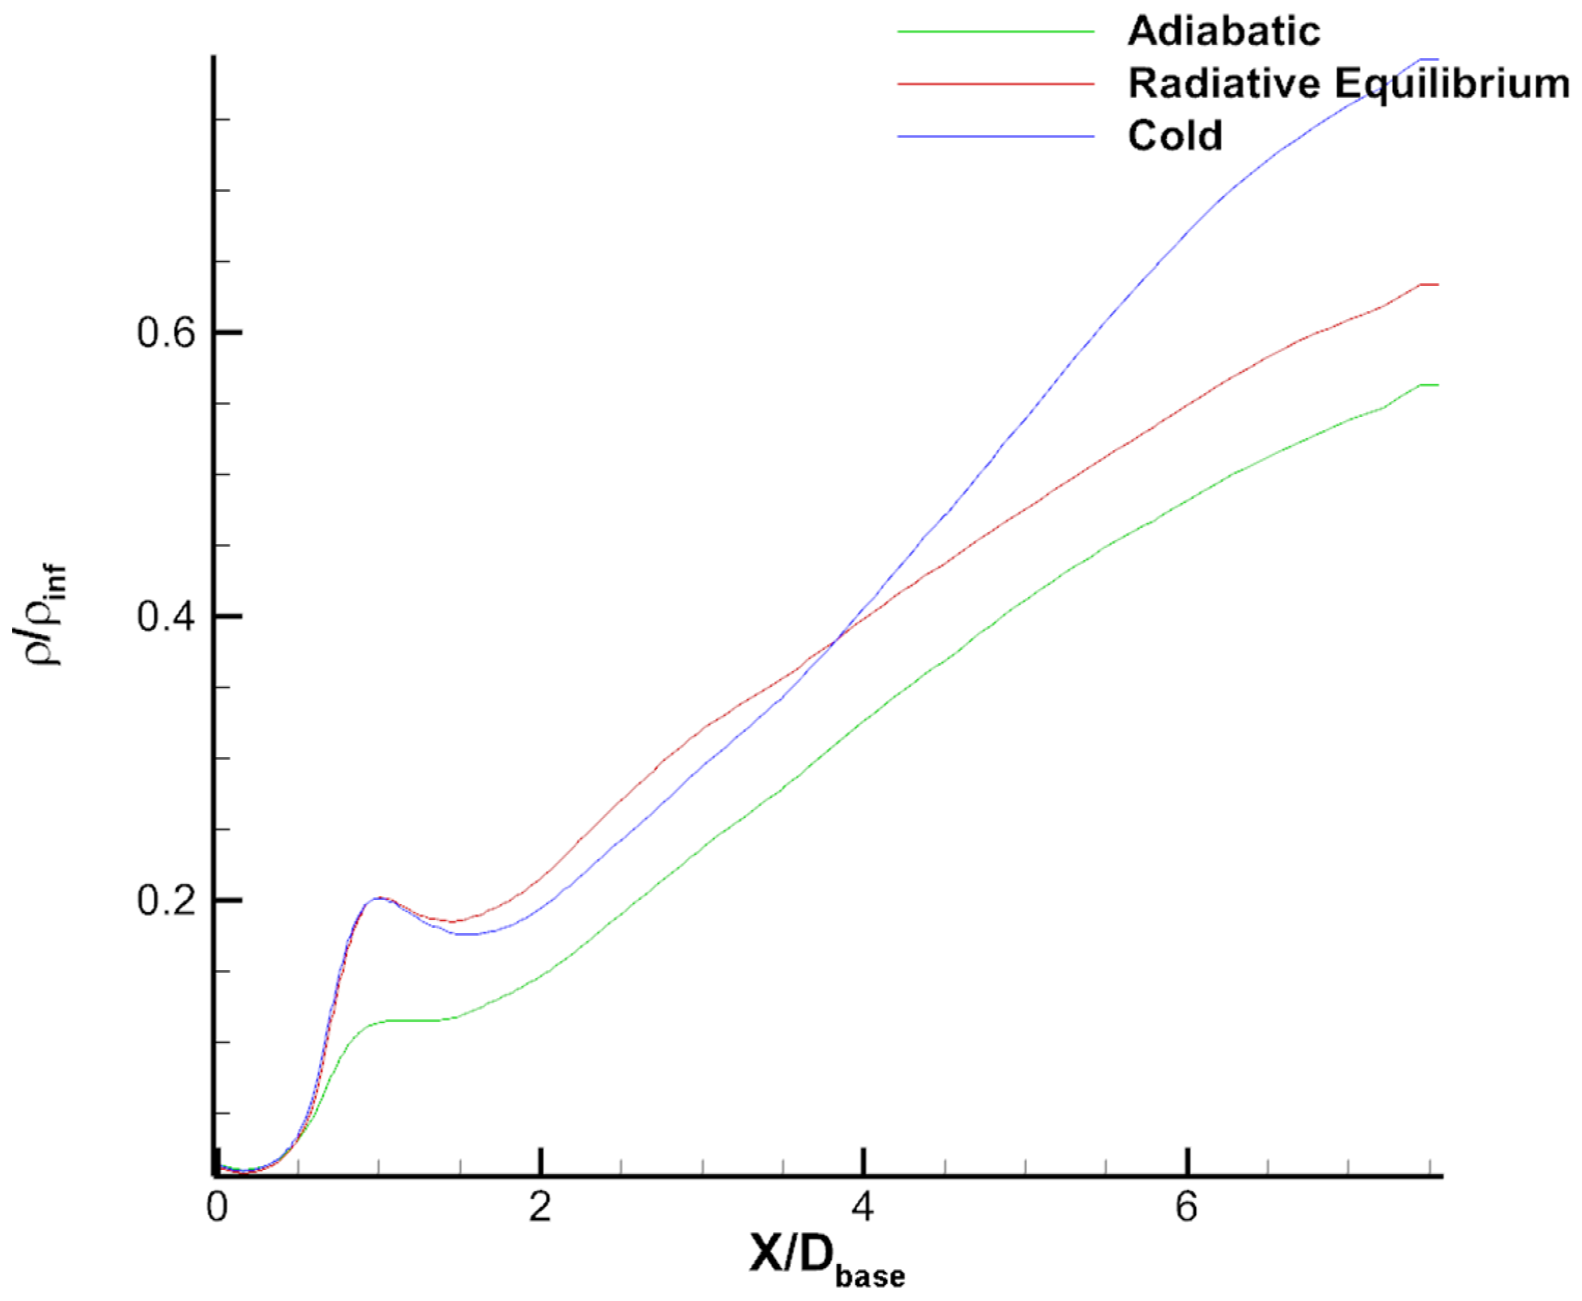
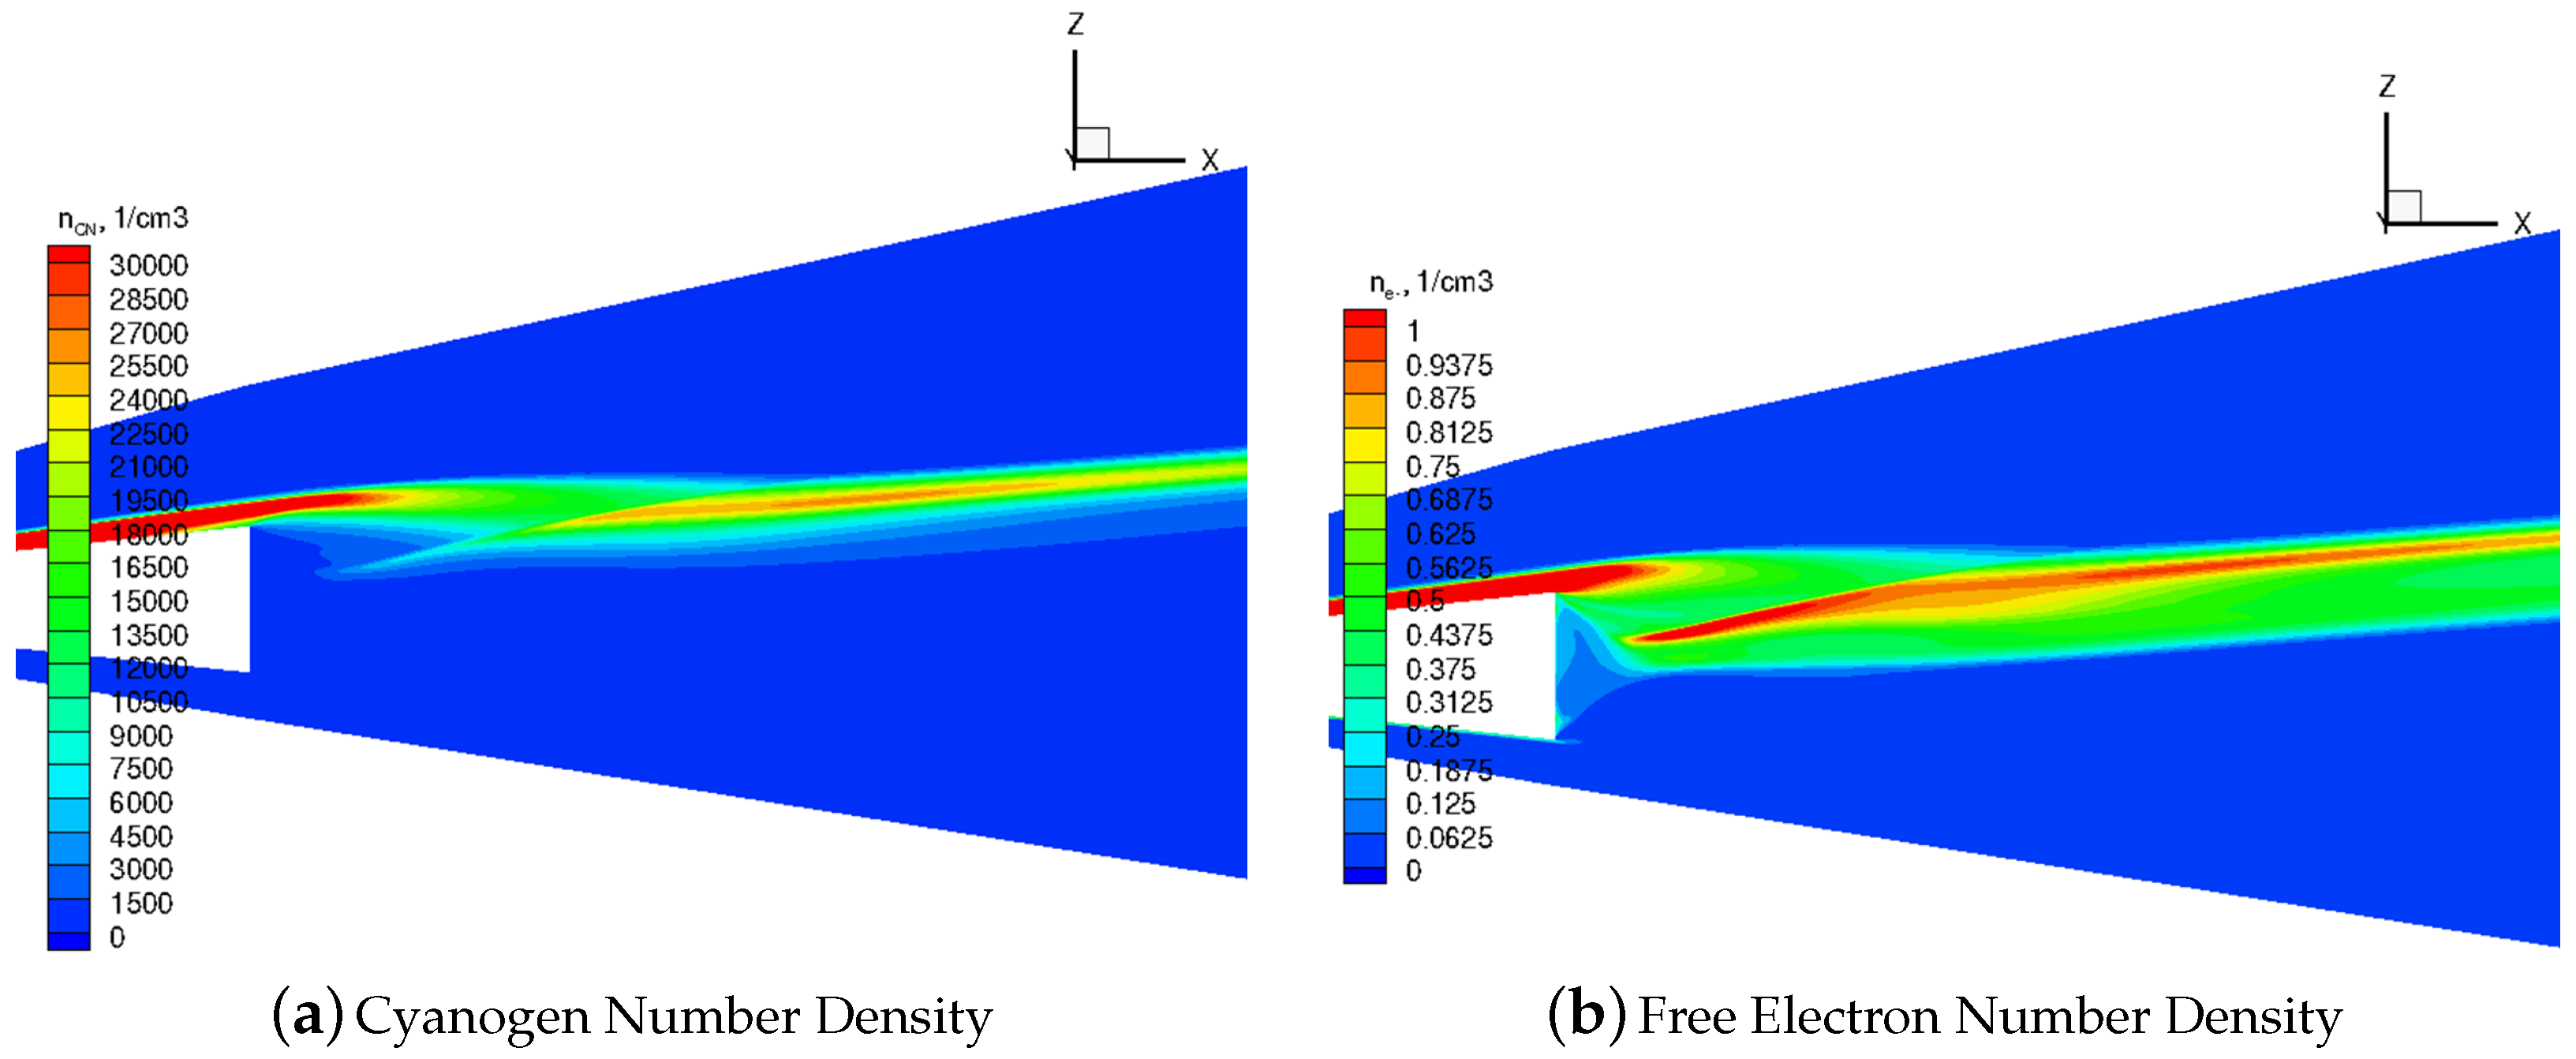
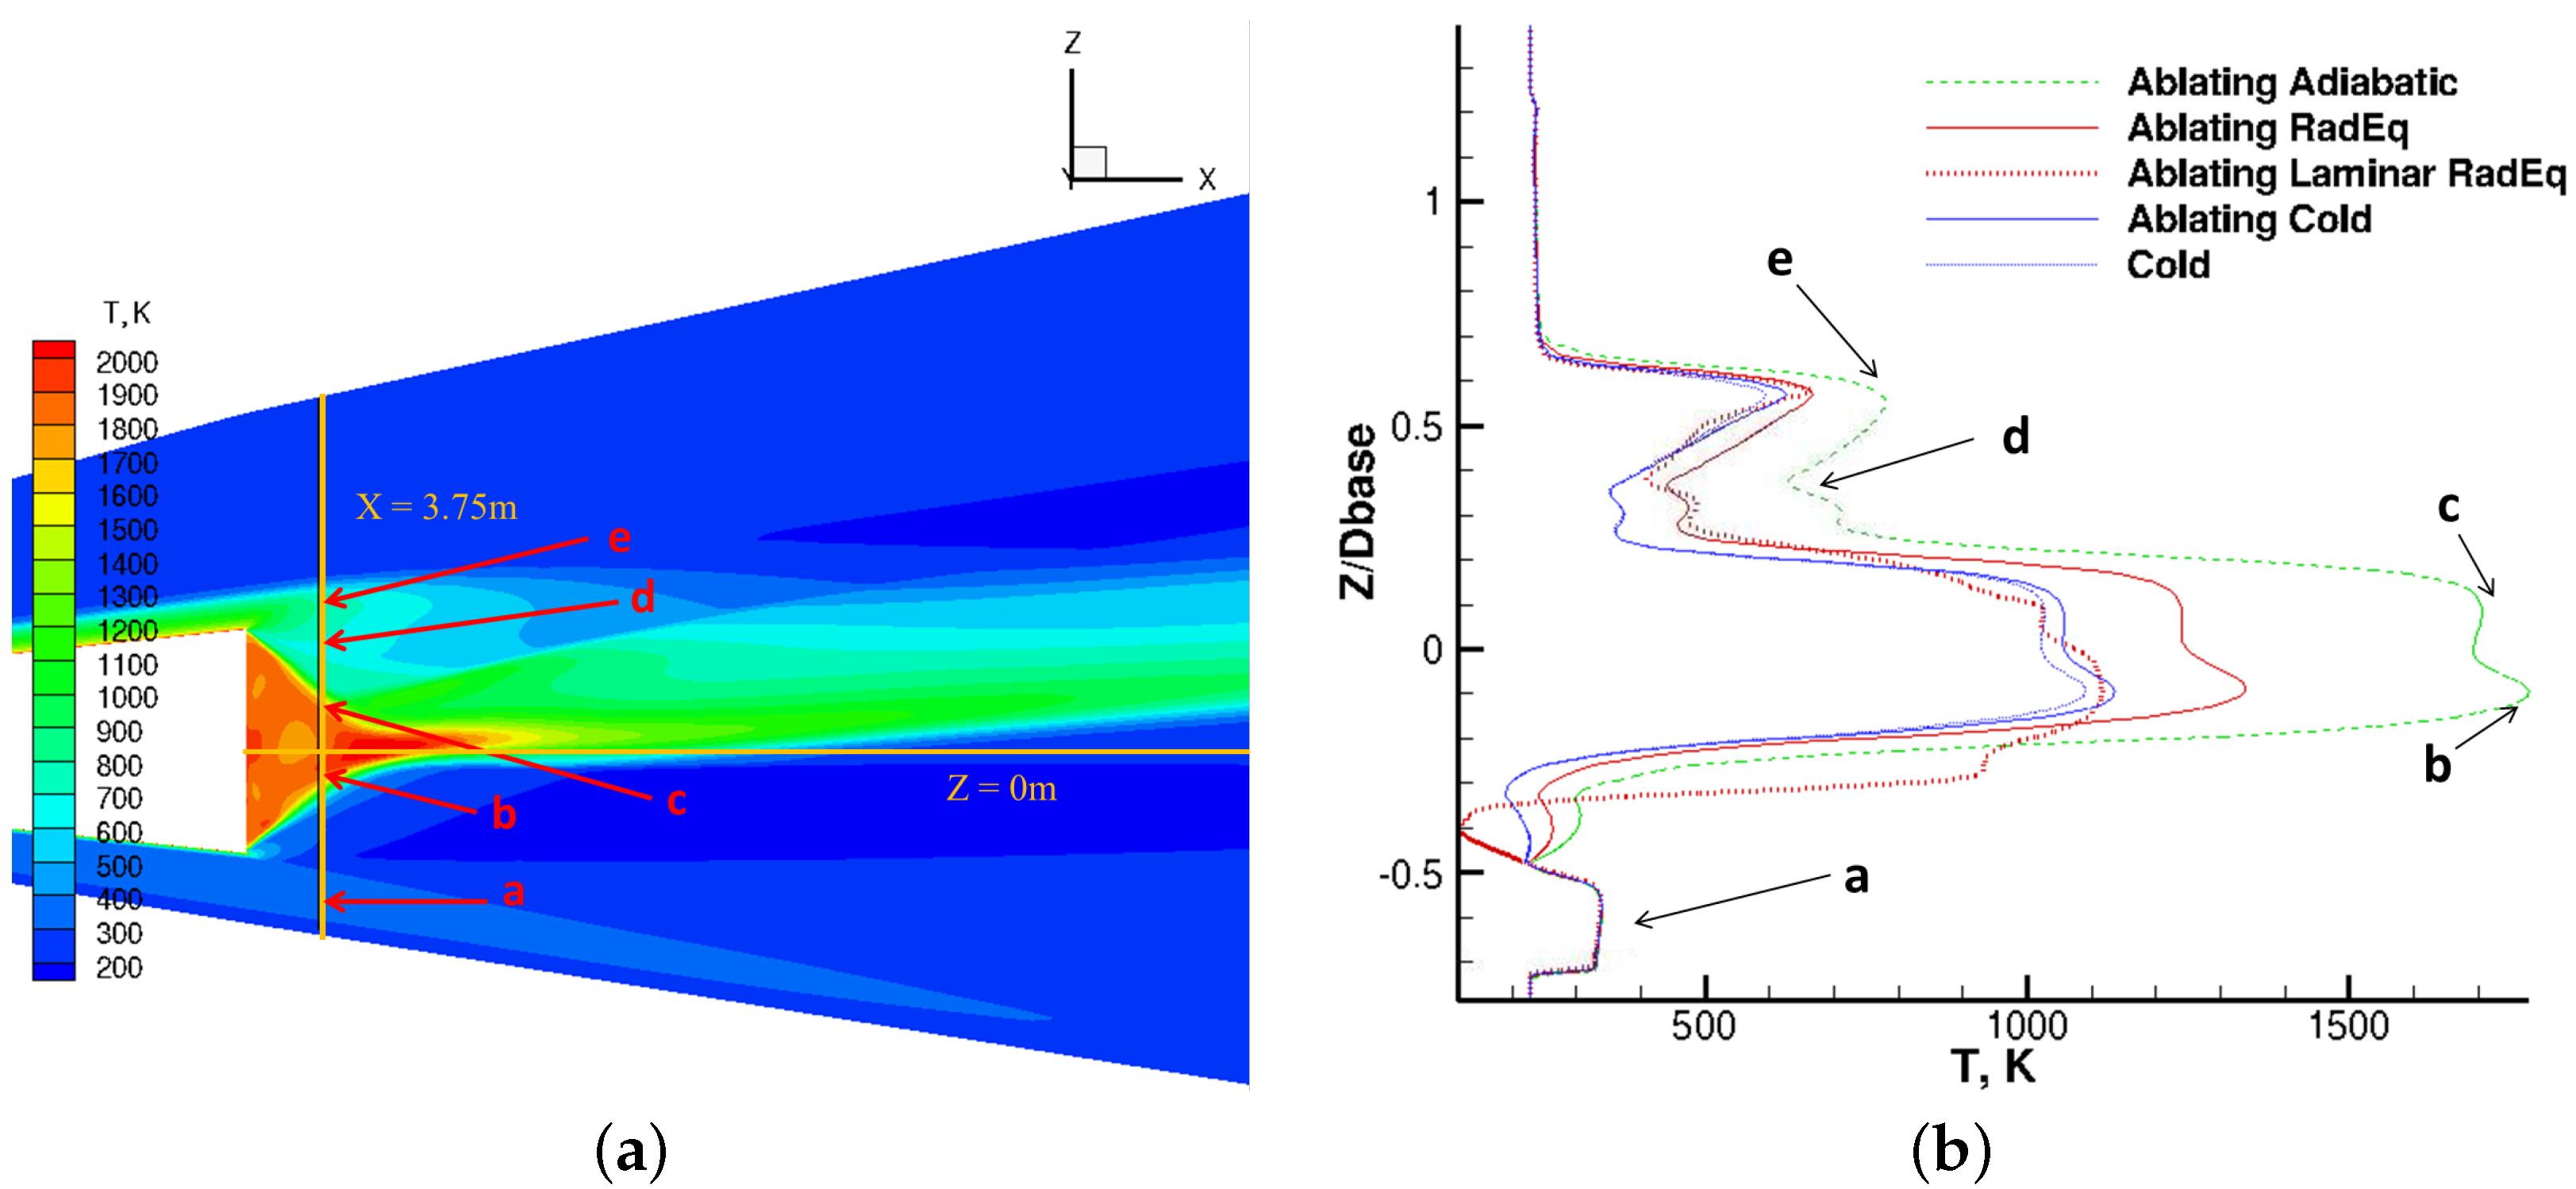
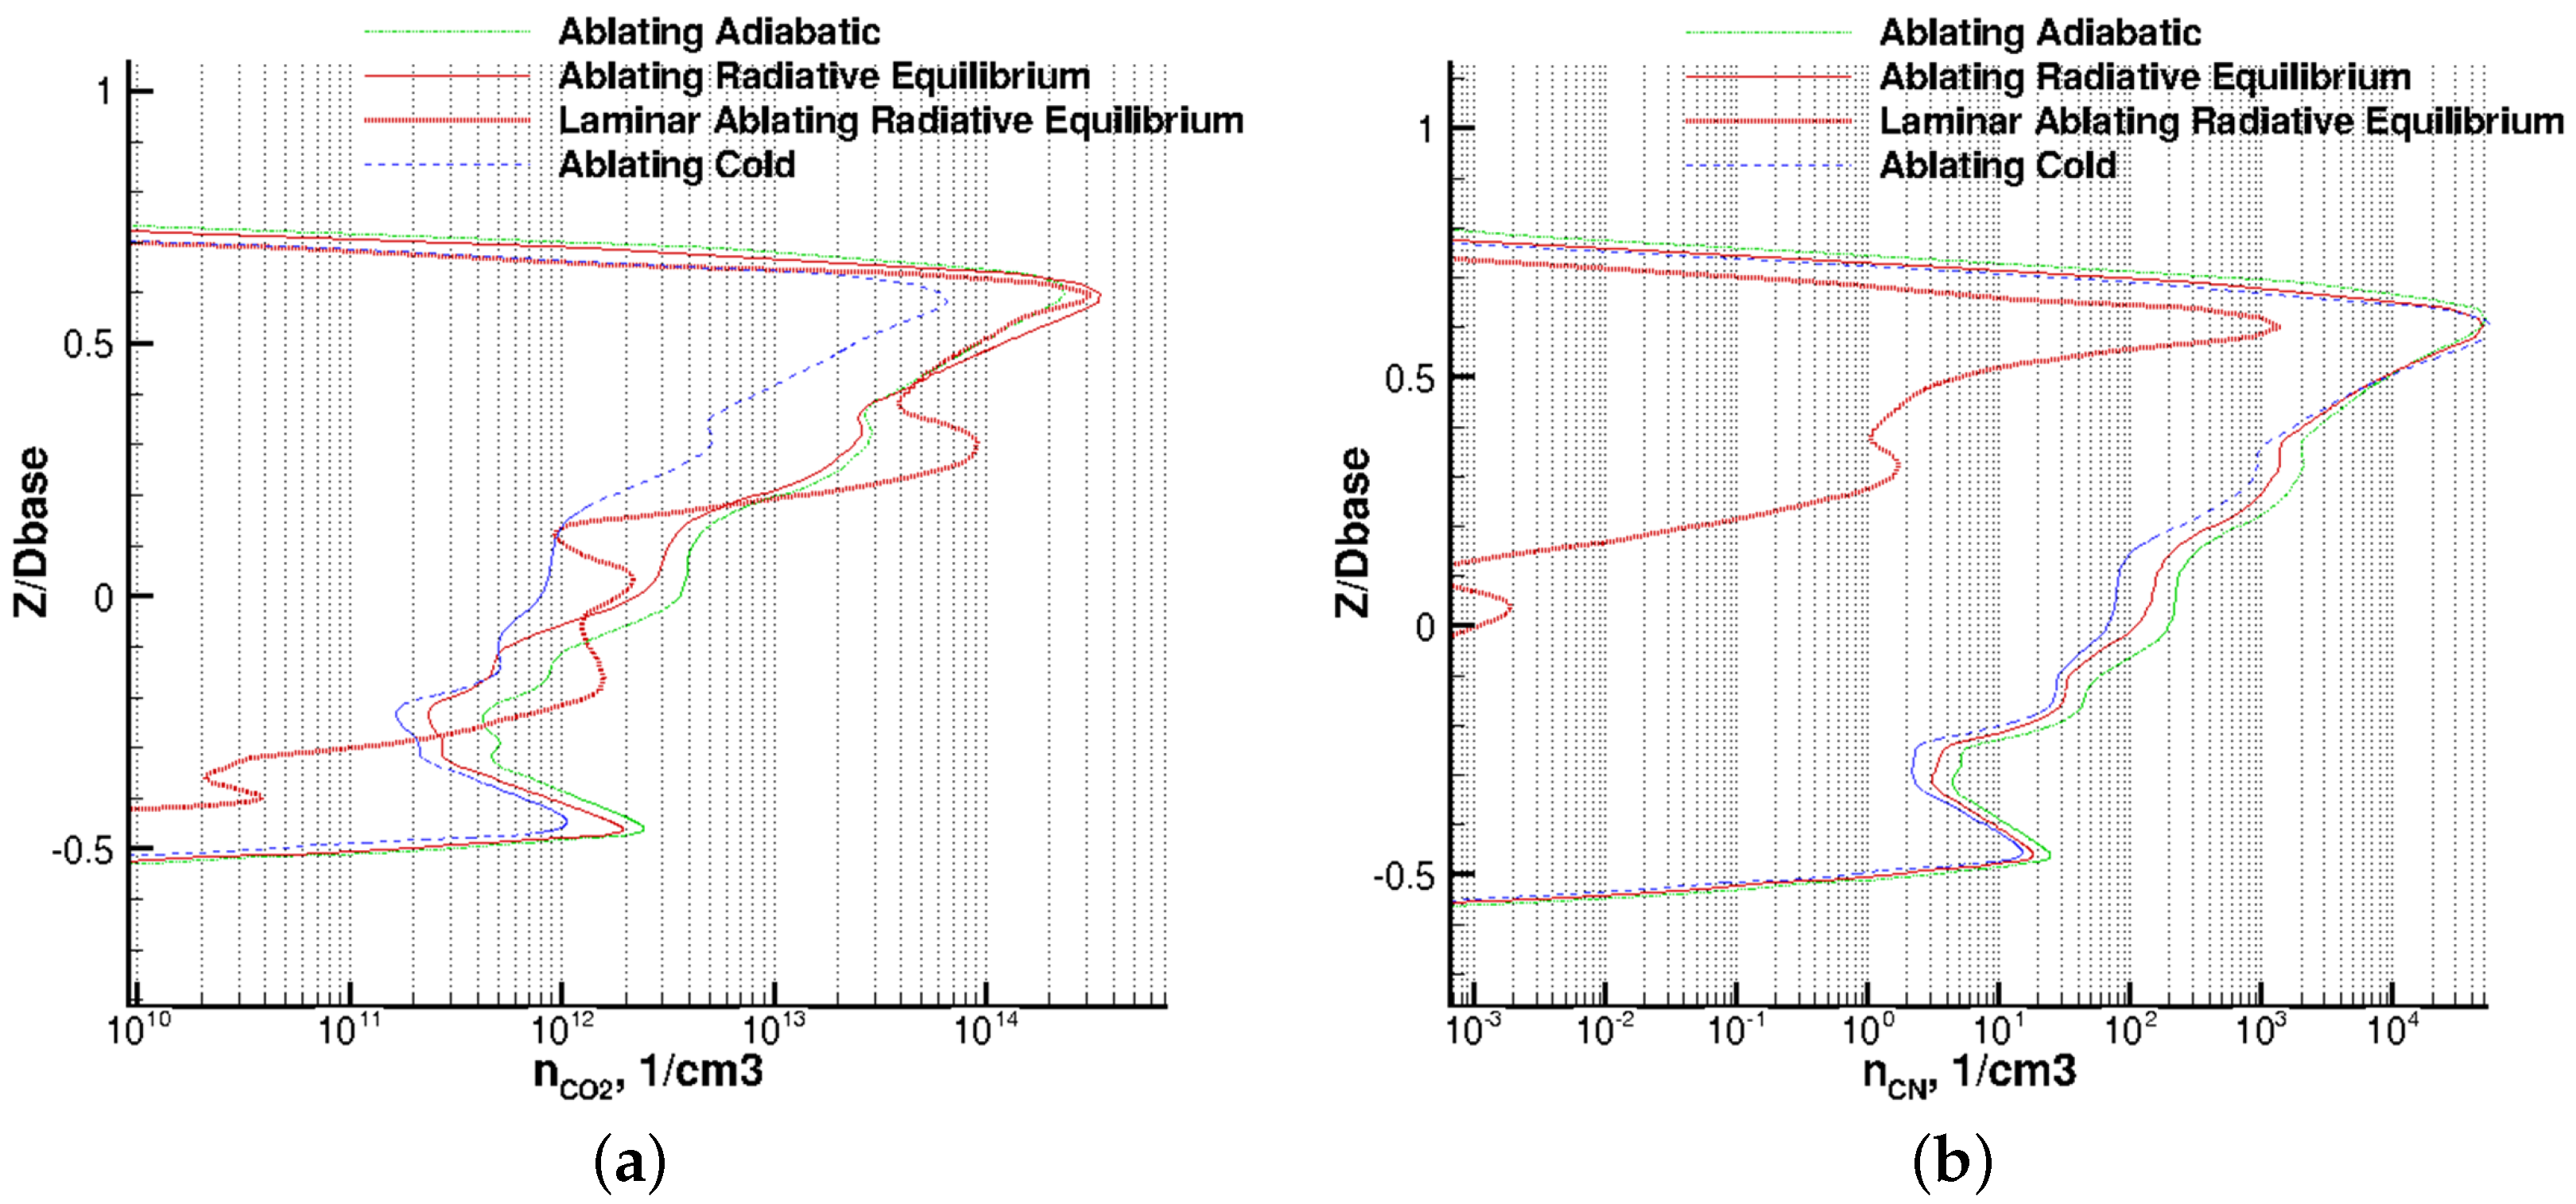
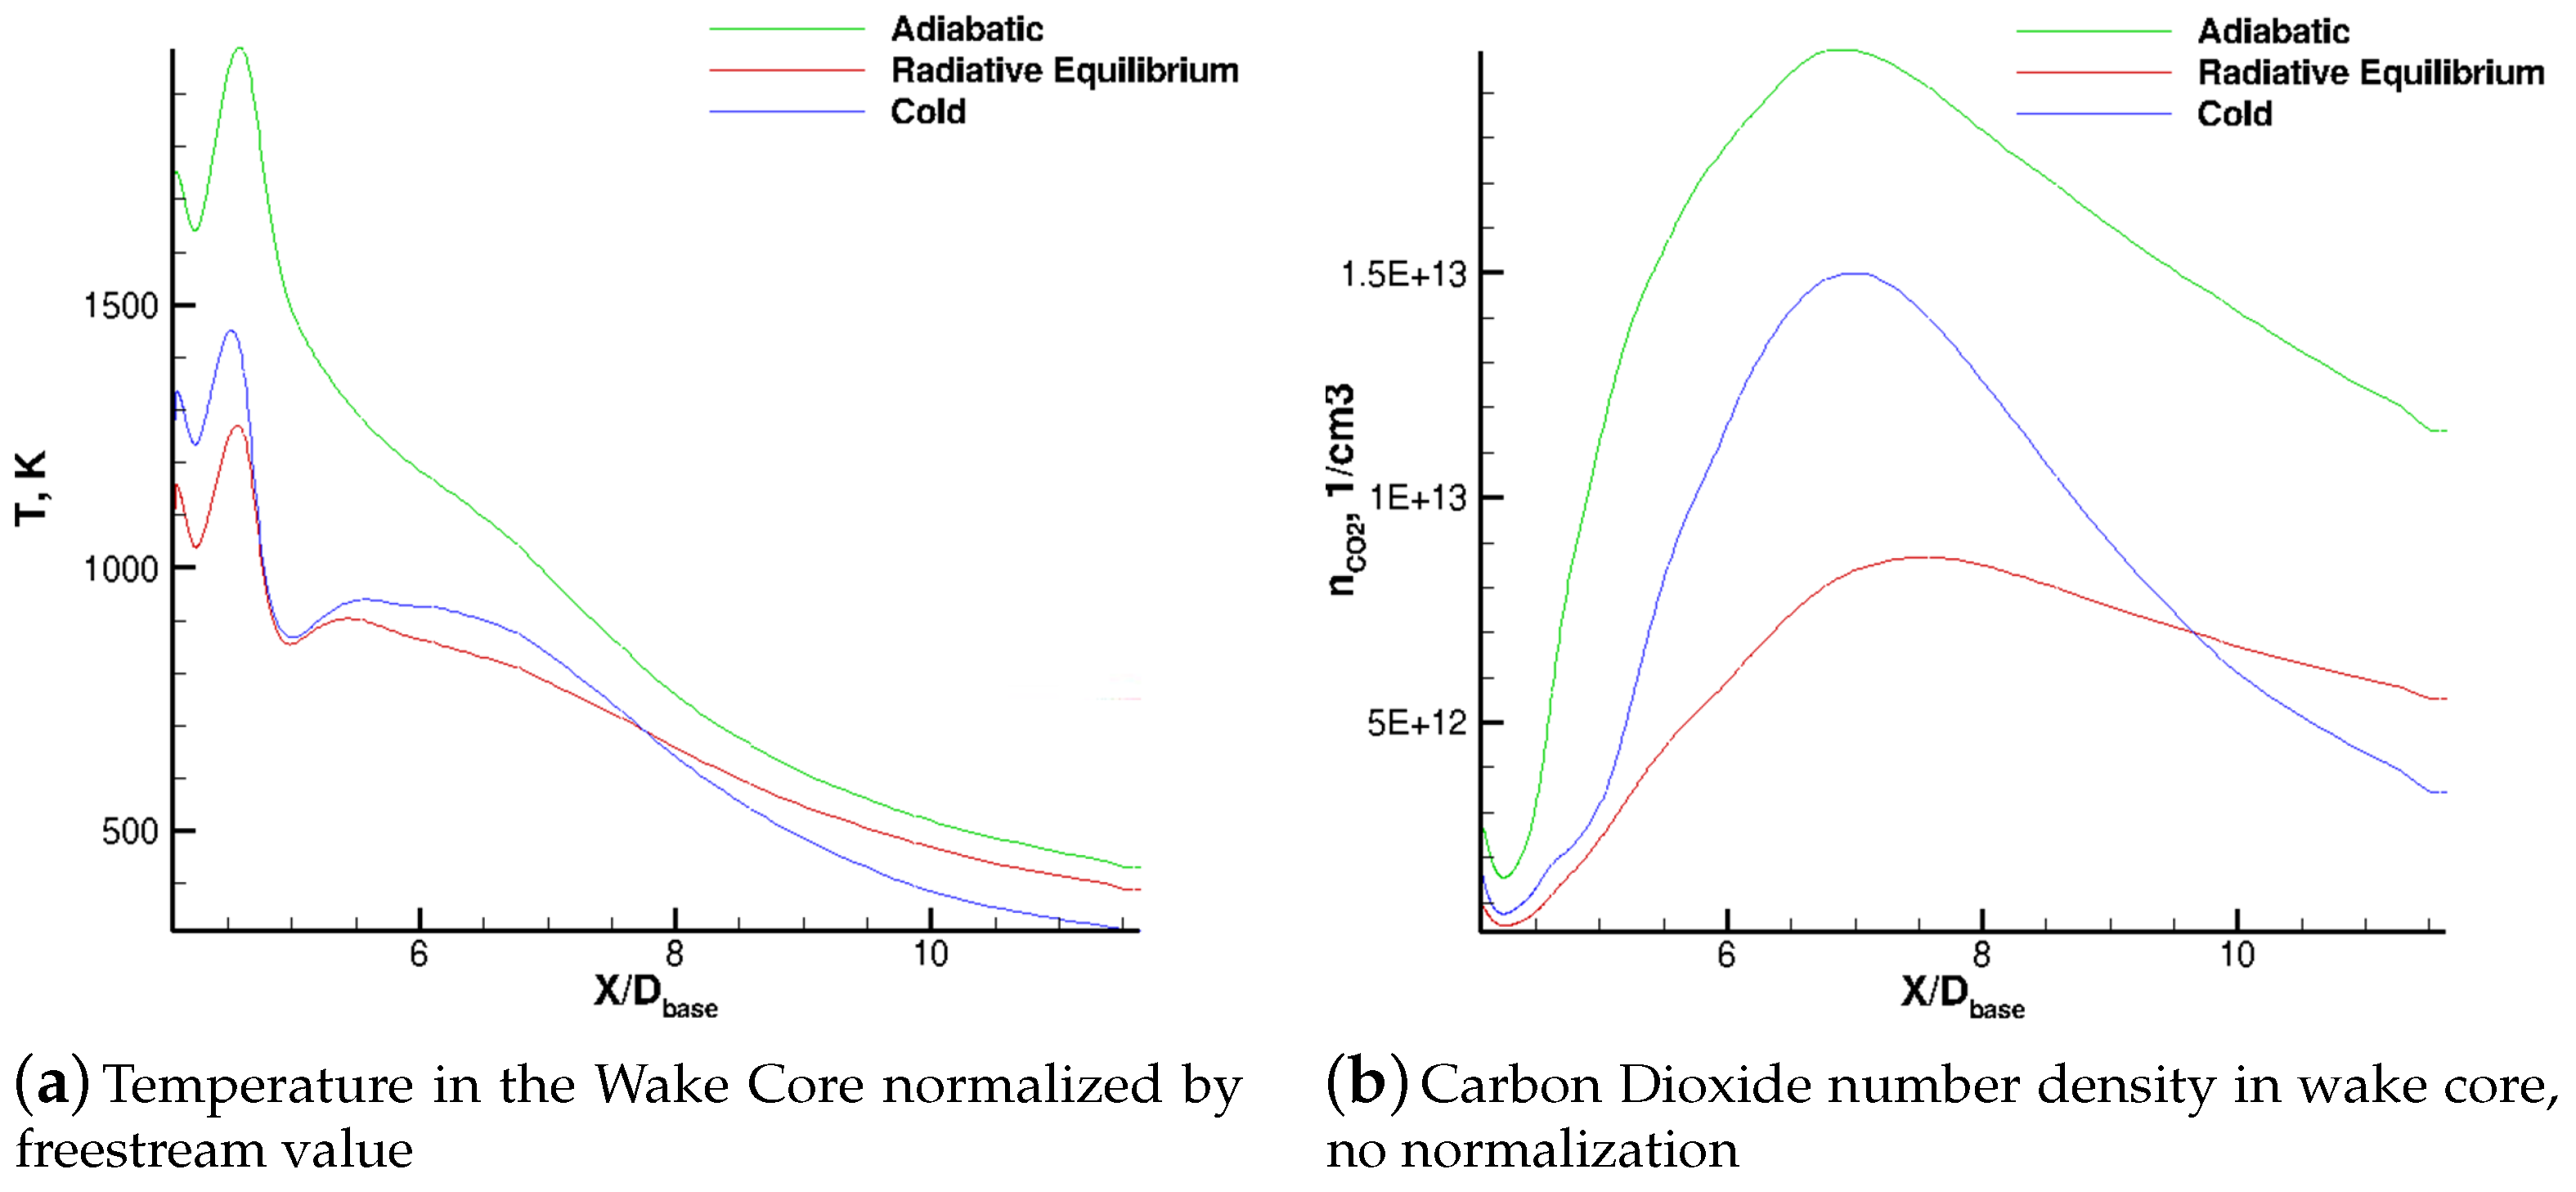
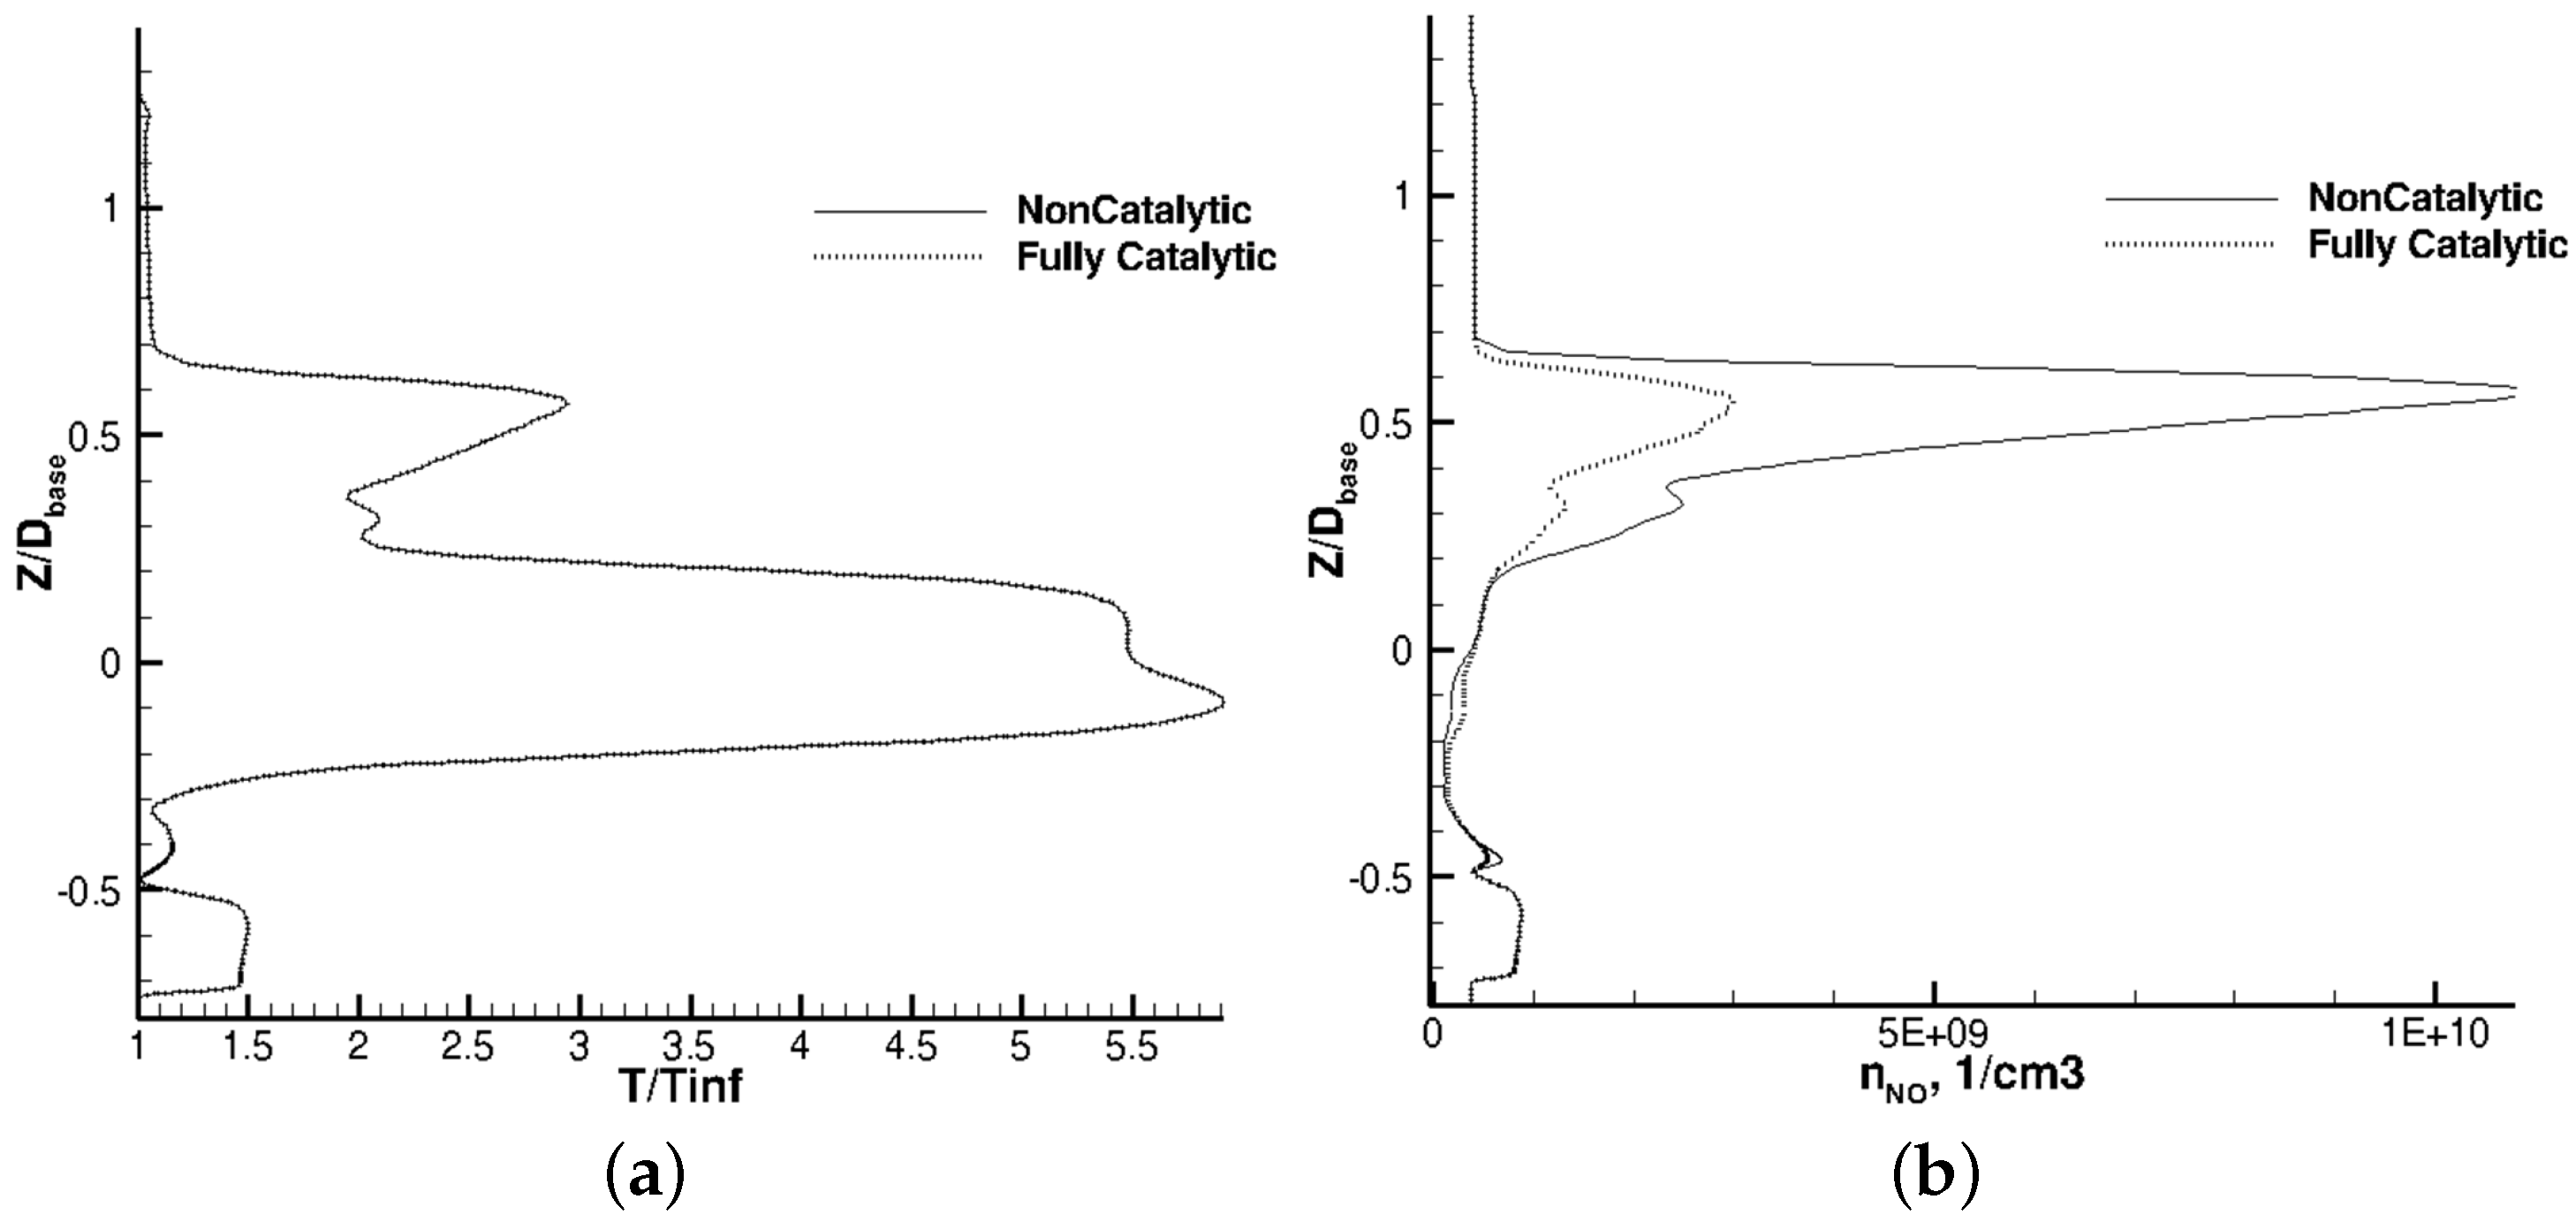
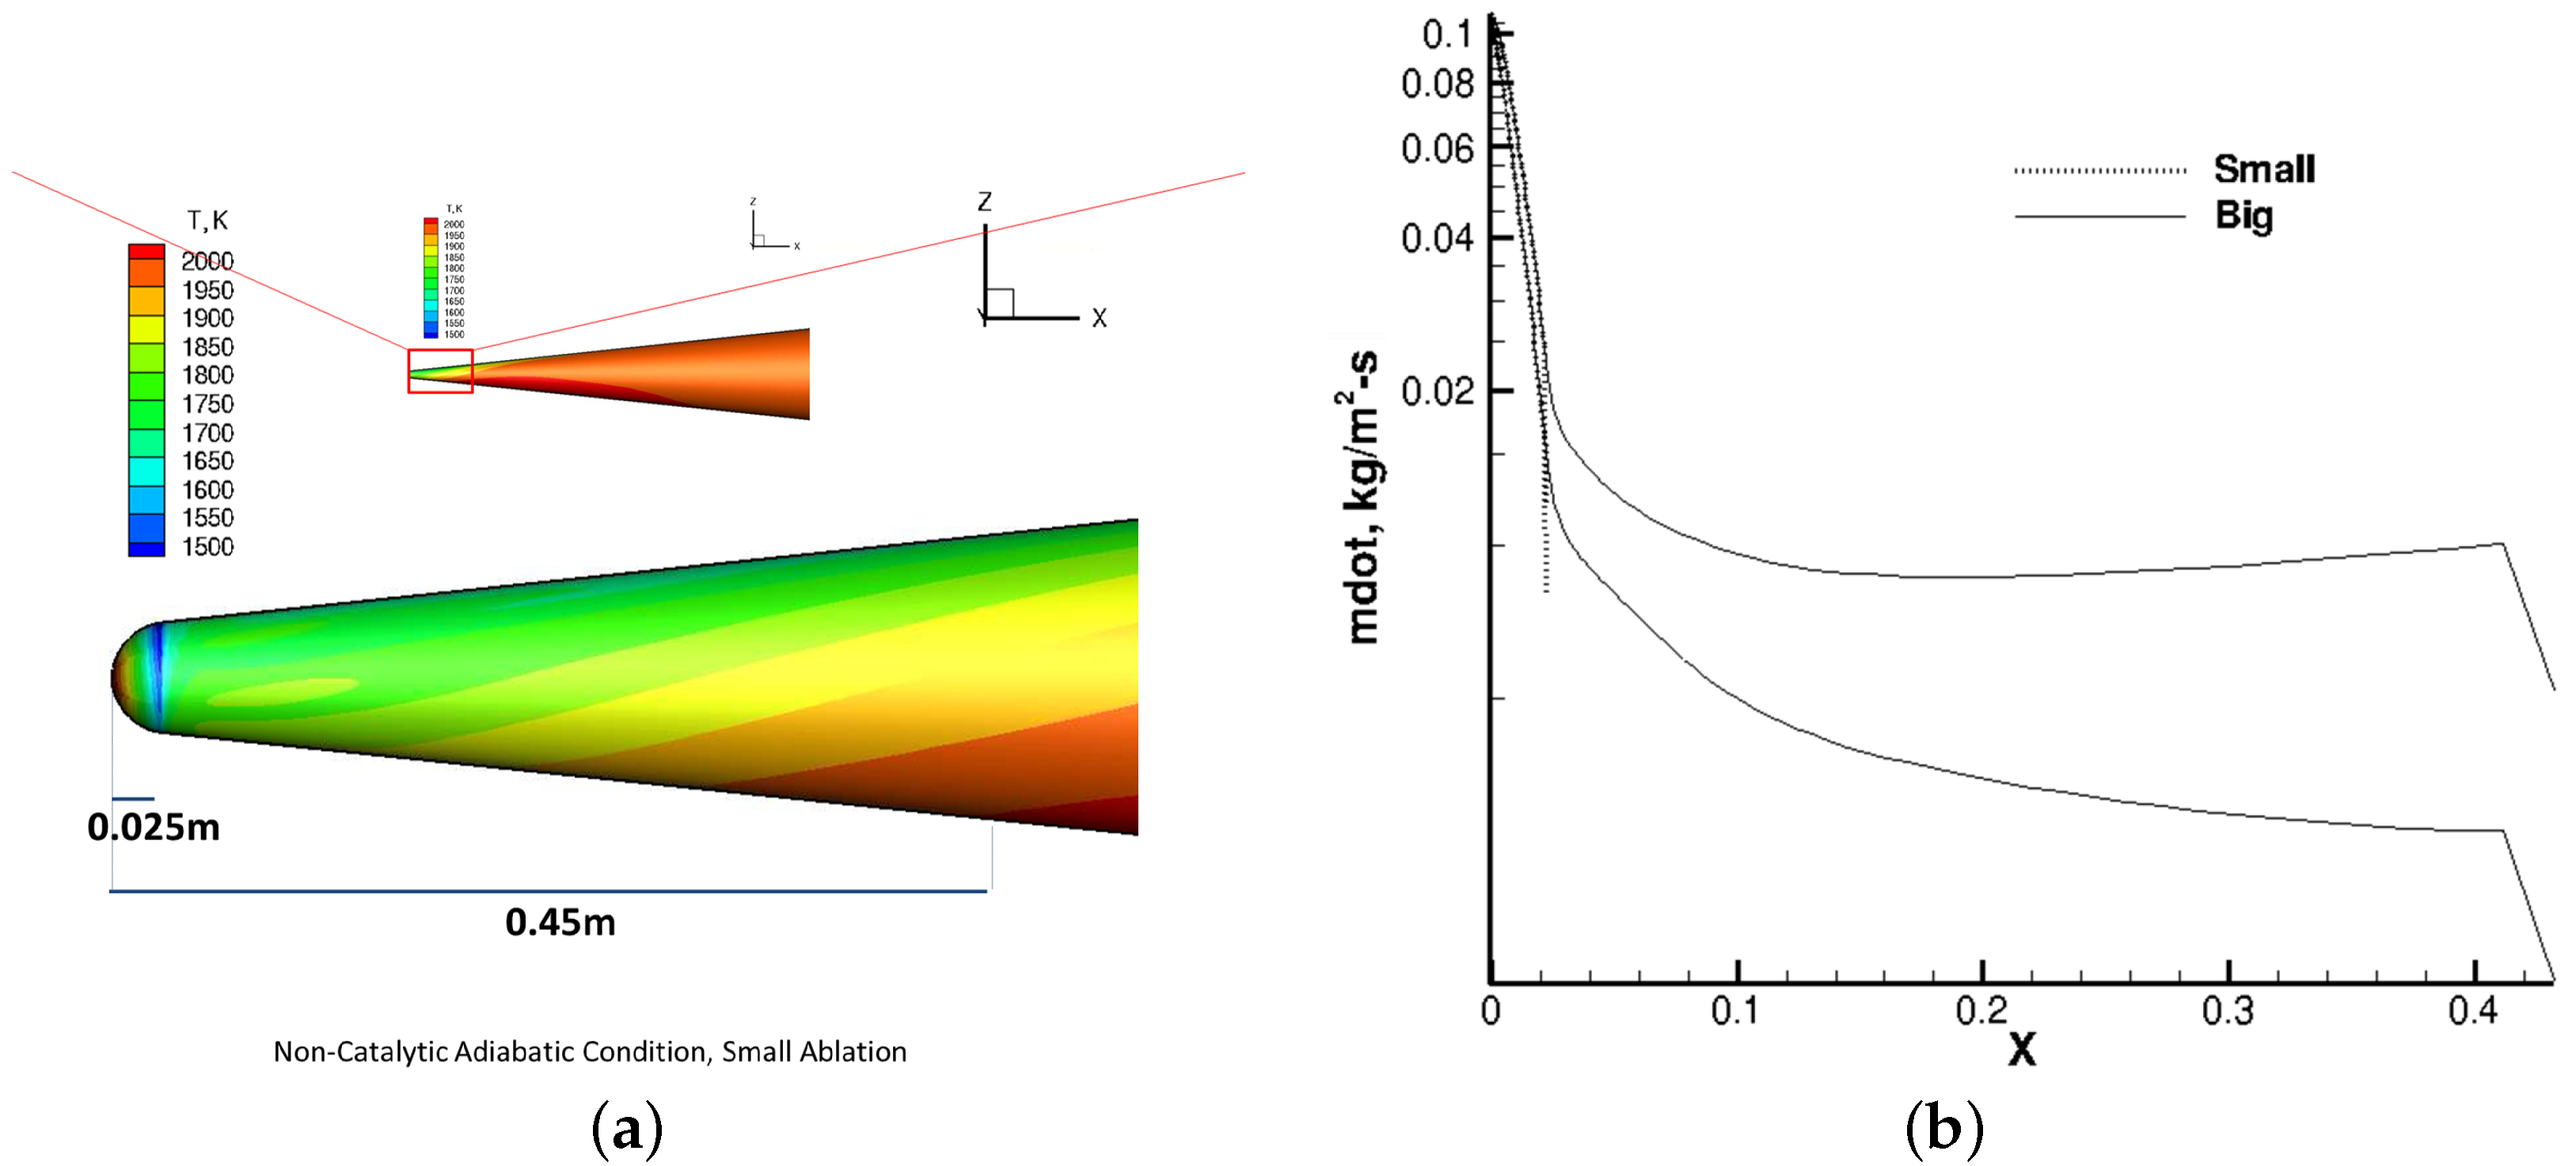
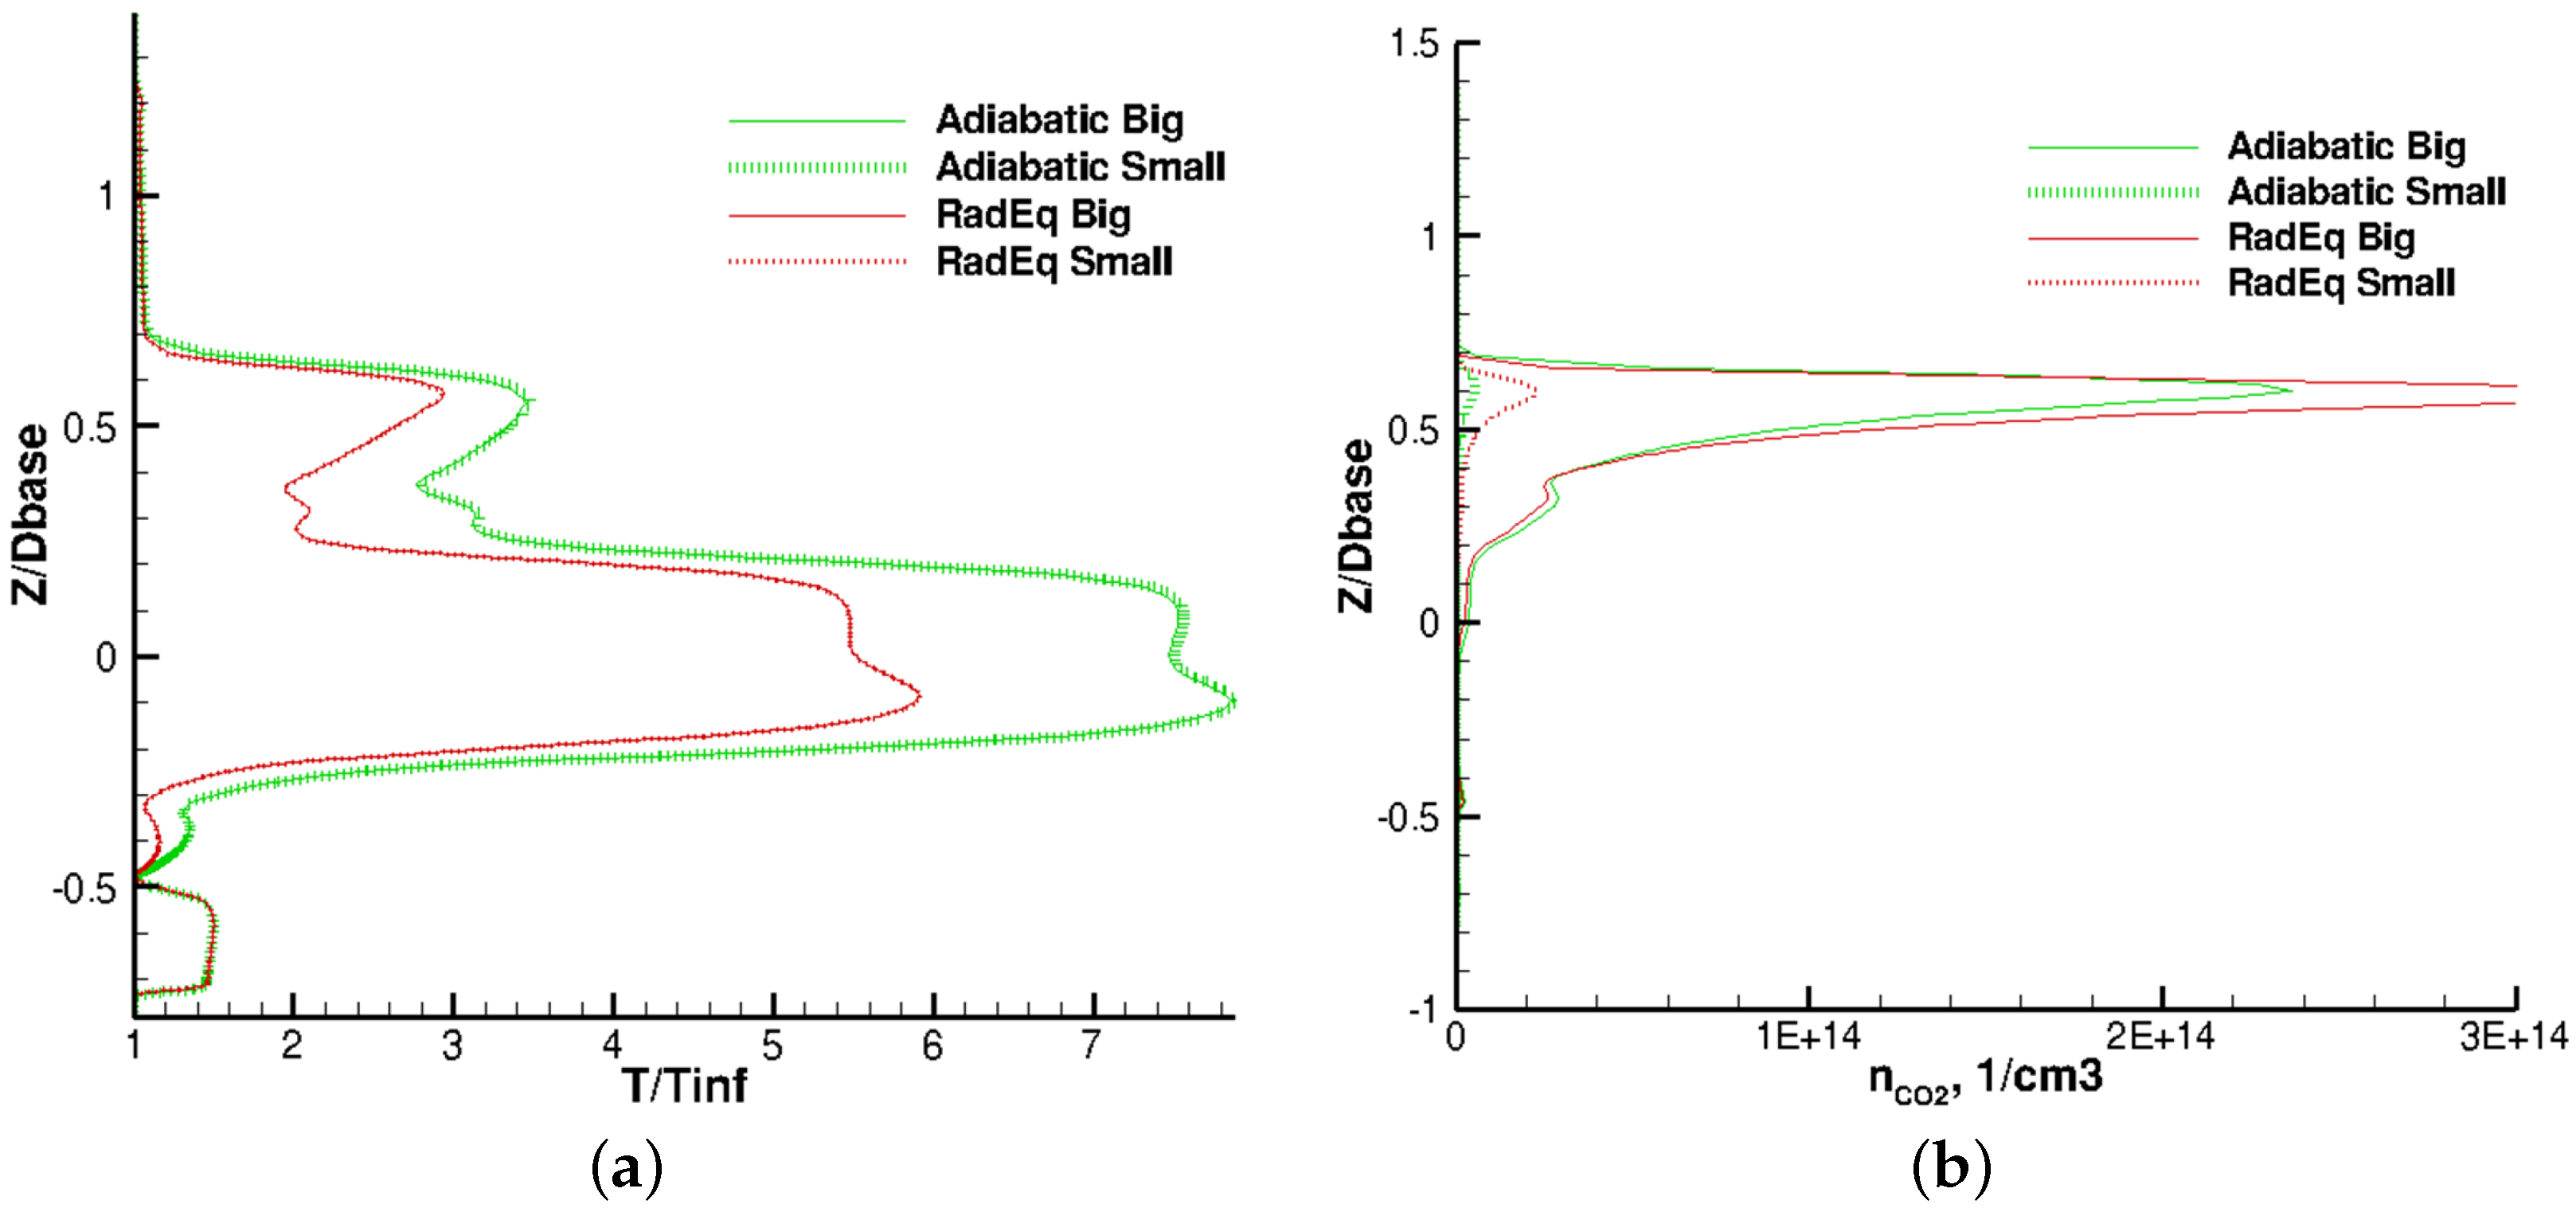
Table 1.
Summary of Flight Conditions.
| Flight Condition | Value |
|---|---|
| Mach | 7 |
| Altitude (Km) | 30 |
| Velocity (m/s) | 2115 |
| Angle of Attack (deg) | 5 |
| Density (kg/m3) | 0.01841 |
| Temperature (K) | 226.5 |
| Reynolds Number | 9,237,700 |
Table 2.
The 7-Species Model (a) and 13-Species Model (b).
| 7-Species Model (a) | |
| Species | Concentration |
| N | 6.22× |
| O | 7.76× |
| N2 | 0.737795 |
| O2 | 0.262205 |
| NO | 1.00× |
| NO+ | 4.57× |
| e− | 8.35× |
| 13-Species Model (b) | |
| Species | Concentration |
| N | 6.22× |
| O | 7.76× |
| N2 | 0.737795 |
| O2 | 0.262205 |
| NO | 1.00× |
| NO+ | 4.57× |
| e− | 8.35× |
| C | 1.00× |
| C2 | 1.00× |
| C3 | 1.00× |
| CO | 1.00× |
| CO2 | 1.00× |
| CN | 1.00× |
Table 3.
The various cases run for this study. All were performed at M = 7, 30 km altitude, angle of attack. ‘*’ denotes that these cases were run but are not explored in detail.
Table 3.
The various cases run for this study. All were performed at M = 7, 30 km altitude, angle of attack. ‘*’ denotes that these cases were run but are not explored in detail.
| Case | Wall Boundary Condition | Wall Catalycity | Ablation |
|---|---|---|---|
| 1 | Radiative Equilibrium * | Non-Catalytic | Off |
| 2 | Radiative Equilibrium | Fully-Catalytic | Off |
| 3 | Radiative Equilibrium | Non-Catalytic | On |
| 4 | Radiative Equilibrium | Fully-Catalytic | On |
| 5 | Radiative Equilibrium | Equilibrium Catalytic | On |
| 6 | Adiabatic * | Non-Catalytic | Off |
| 7 | Adiabatic | Non-Catalytic | On |
| 8 | Adiabatic | Fully-Catalytic | On |
| 9 | Cold | Non-Catalytic | Off |
| 10 | Cold | Non-Catalytic | On |
© 2018 by the authors. Licensee MDPI, Basel, Switzerland. This article is an open access article distributed under the terms and conditions of the Creative Commons Attribution (CC BY) license (http://creativecommons.org/licenses/by/4.0/).
Share and Cite
MDPI and ACS Style
Satchell, M.J.; Layng, J.M.; Greendyke, R.B. Numerical Simulation of Heat Transfer and Chemistry in the Wake behind a Hypersonic Slender Body at Angle of Attack. Aerospace 2018, 5, 30. https://doi.org/10.3390/aerospace5010030
AMA Style
Satchell MJ, Layng JM, Greendyke RB. Numerical Simulation of Heat Transfer and Chemistry in the Wake behind a Hypersonic Slender Body at Angle of Attack. Aerospace. 2018; 5(1):30. https://doi.org/10.3390/aerospace5010030
Chicago/Turabian StyleSatchell, Matthew J., Jeffrey M. Layng, and Robert B. Greendyke. 2018. "Numerical Simulation of Heat Transfer and Chemistry in the Wake behind a Hypersonic Slender Body at Angle of Attack" Aerospace 5, no. 1: 30. https://doi.org/10.3390/aerospace5010030
Note that from the first issue of 2016, this journal uses article numbers instead of page numbers. See further details here.