Simulation-Based Virtual Cycle for Multi-Level Airport Analysis
by

Miguel Mujica Mota
1,*,†, 
Alejandro Di Bernardi
2,†, 
Paolo Scala
1,† and
Gabriel Ramirez-Diaz
3,† 1
Aviation Academy, Amsterdam University of Applied Sciences, Weesperzijde 190, 1097 DZ Amsterdam, The Netherlands
2
Grupo Transporte Aéreo—UIDET GTA-GIAI, Departamento de Aeronáutica, Facultad de Ingeniería, Universidad Nacional de La Plata. Calle 116 e/47 y 48, 1900 La Plata, Pcia. Buenos Aires, Argentina
3
Grupo Transporte Aéreo—UIDET GTA-GIAI, Departamento de Aeronáutica, Facultad de Ingeniería, Universidad Nacional de La Plata, CONICET. Calle 116 e/47 y 48, 1900 La Plata, Pcia. Buenos Aires, Argentina
*
Author to whom correspondence should be addressed.
†
These authors contributed equally to this work.
Aerospace 2018, 5(2), 44; https://doi.org/10.3390/aerospace5020044
Submission received: 11 February 2018
/
Revised: 15 April 2018
/
Accepted: 16 April 2018
/
Published: 19 April 2018
(This article belongs to the Collection Air Transportation—Operations and Management)
Abstract
:The aeronautical industry is expanding after a period of economic turmoil. For this reason, a growing number of airports are facing capacity problems that can sometimes only be resolved by expanding infrastructure, with the inherent risks that such decisions create. In order to deal with uncertainty at different levels, it is necessary to have relevant tools during an expansion project or during the planning phases of new infrastructure. This article presents a methodology that combines simulation approaches with different description levels that complement each other when applied to the development of a new airport. The methodology is illustrated with an example that uses two models for an expansion project of an airport in The Netherlands. One model focuses on the operation of the airport from a high-level position, while the second focuses on other technical aspects of the operation that challenge the feasibility of the proposed configuration of the apron. The results show that by applying the methodology, analytical power is enhanced and the risk of making the wrong decisions is reduced. We identified the limitations that the future facility will have and the impact of the physical characteristics of the traffic that will operate in the airport. The methodology can be used for tackling different problems and studying particular performance indicators to help decision-makers take more informed decisions.
1. Introduction
Air transport is still under expansion, and in 2014 the number of flights in Europe increased by 1.7% compared to 2013 [1] and the number of passengers grew by 5.4% compared to 2013, reaching 3.3 billion passengers [2].
According to these trends, an increase in the volume of flights and number of passengers is expected in coming years. This situation is translated into a massive use of resources; therefore, it is likely to worsen congestion in many airports worldwide.
To avoid congestion problems, the improvement of capacity has become a challenge, and therefore many factors must be considered during the planning phase of new or improved facilities. Airports have been reported as the main bottleneck of air transportation when the system is congested [3].
Since aviation is an industry in which safety is a priority, decision-makers are not able to experiment in situ with potential solutions because this can put at risk costly operations and, in the worst cases, the safety of the aircraft involved. For these reasons, it is important to have decision-support tools that allow stakeholders and decision-makers to evaluate novel configurations of the system or new technology without putting at stake the operational procedures of the airport.
Simulation is a methodology that is gaining growing importance, since it is the only technique that allows the incorporation of important characteristics of a system like causal relationships and variability in a single model. Other techniques fall short in modelling key characteristics of systems such as synchrony, parallelism, cause–effect relationships and, most importantly, the uncertainty inherent in dynamic systems. Furthermore, all these characteristics are also implicitly dependent on the time dimension which is the common variable in all the different simulation approaches used in this field, such as discrete-event systems, system dynamics, agent-based technology or cellular automata among others.
When dealing with a simulation study, the level of abstraction is one of the fundamental questions that arise. In optimal situations, this question is answered by the experience of the analyst or the modeller; and in the worst cases, the analysts merely take any simulation tool and apply it to the problem under study [4]. However, in order to undertake a thorough analysis and reduce risks in a study, it is desirable to approach it from different angles and, sometimes, using different techniques besides simulation in order to gain as much knowledge from the system as possible without interfering with it.
Different modelling approaches exist, such as system dynamics, agent technology or discrete-event systems (DES). The former is used in systems in which stated variables such as the level of fuel in a tank change continuously over time, while agent technology is a relatively novel approach in which the power of computers is used to calculate the independent behaviour of the entities within a system [5]. On the other hand, DES is suitable for analysing systems in which the stated variables change at particular instants due to an event that happens in the system; this approach fits the modelling of aviation operations well, since the evolution of events in the system depends on the traffic that follows a particular schedule; thus, all the operations have a dependence on the arrival or departure of an aircraft. In addition, there are combinations of approaches in commercial tools in which some phenomena are modelled with DES while others are characterized by system dynamics or agent-based logic. The following section reviews the use of simulation and modelling techniques in aviation systems.
2. Literature Review
In literature, some works dealing with uncertainty when planning airport expansion and developments use diverse methodologies, ranging from mathematical programming to simulation. In [6], an algorithm for determining the required number of airport terminal resources for a departing process, such as check-in desks and security controls, was presented. In this algorithm, the objective function did not have a closed-form expression so, for that reason, simulation was included in order to calculate it. In [7], the sources of uncertainty that affect gate expansion were investigated. The objective of the study was to minimize the total gate expansion cost by optimizing timing and the number of new gates. The uncertainty was represented by the fluctuation of demand, and the problem was solved using an analytical model. In [8], aircraft-parking stands were planned for the short/medium/long periods for future Indonesian airports. In their work, the authors also considered the planning of the stand configuration and the area of the stands. They forecasted the future number of passengers and number of aircraft movements using regression analysis on collected data. In [9], the total cost of airport expansion was minimized by considering uncertain air-traffic demand. The problem was modelled analytically by implementing a mixed integer non-linear problem (MINLP), and then solved with an algorithm. The common factor of the work previously mentioned is that they used analytical models to formulate the problem and to obtain solutions; on the other hand, other works make use of simulation techniques for airport airside planning purposes. In [10], for instance, a general-purpose, activity-based and discrete-event simulation tool was used for modelling airport runway operations where the performance in terms of runway capacity and delays was evaluated. Another airside simulation model using general-purpose discrete-event simulation software was developed in [11], and this demonstrated good potential to perform analysis and visual validation. In [12], a complete airport airside simulation model was developed; in this work, an analysis of airside congestion was undertaken in which the main indicators were arrival and departure delays, runway throughput, and gate occupancy. The analysis was conducted by testing different scenarios, based on increases in traffic, highlighting the presence of bottlenecks in the system like the runway, and this provided a better understanding of system behaviour, identifying the flight-schedule structure as an impacting factor. In [13], a simulation-based analysis was conducted for apron configuration design. In this work, thanks to the use of simulation it was possible to consider different sources of uncertainty affecting the airside operations and how entities present such as aircraft and ground vehicles interact with each other. The turnaround time was taken as a performance indicator for selecting the best configuration of the apron area. Different scenarios were run based on the apron configuration and on different taxiway network circulation rules. Uncertainty was considered for all the turnaround operations involved and for aircraft and vehicle speeds on the taxiway. The results suggested a preferable apron configuration based on the minimum turnaround time. In [14], an overview is given of simulation software used for simulating airport operations that analyses the status of simulation technologies and points out further developments. One aspect not considered in the previous works, and that is also incorporated as an assumption in this work, is the fluctuation in demand. Demand is known to be stochastic and there are specific studies that deal with the demand forecast; for example, in [15] long-term and short-term demand forecasts are computed using different techniques such as time-series, local regression and averaging methods.
The studies previously mentioned reveal that simulation can be a powerful tool for supporting decisions in the planning phase of large and costly infrastructure such as airports. However, its use in the planning phases of an aviation study is not common, although it is an approach that some participants and researchers are actively exploring [13,16,17,18].
In this work we present an enhanced methodology for simulating infrastructure such as airports. We illustrate it with an example that combines two simulation approaches at different abstraction levels to gain as much insight as possible about the potential issues and benefits in the planning phase of an airport airside facility. Furthermore, by applying this approach, it is possible to get a better understanding of the potential issues that will be faced by the airport during the different phases of development and to obtain initial performance indicators of the future infrastructure with a corresponding reduction of the risk of failure of the investment. The methodology is applied in the study of a regional airport that will be developed in The Netherlands as a result of intensive studies made by the government [19]. The remainder of the article continues as follows: Section 3 presents the methodology and Section 4 presents a case study of an airport that we applied this to. Section 5 presents the results of the case study and we discuss the analysis, and in Section 6 we present the conclusions and future work.
3. Methodological Approach
Aviation systems have different operations that can be studied by using different levels of abstraction, such as high-level strategic analysis, to approach highly detailed passenger-level operations. In this work, we present a novel methodology that uses a combination of operational-level modelling with physical–technical analysis. The combination of both approaches allows identification of diverse particularities of the future system, enabling decision-makers to give more informed advice on the future operation of the airport.
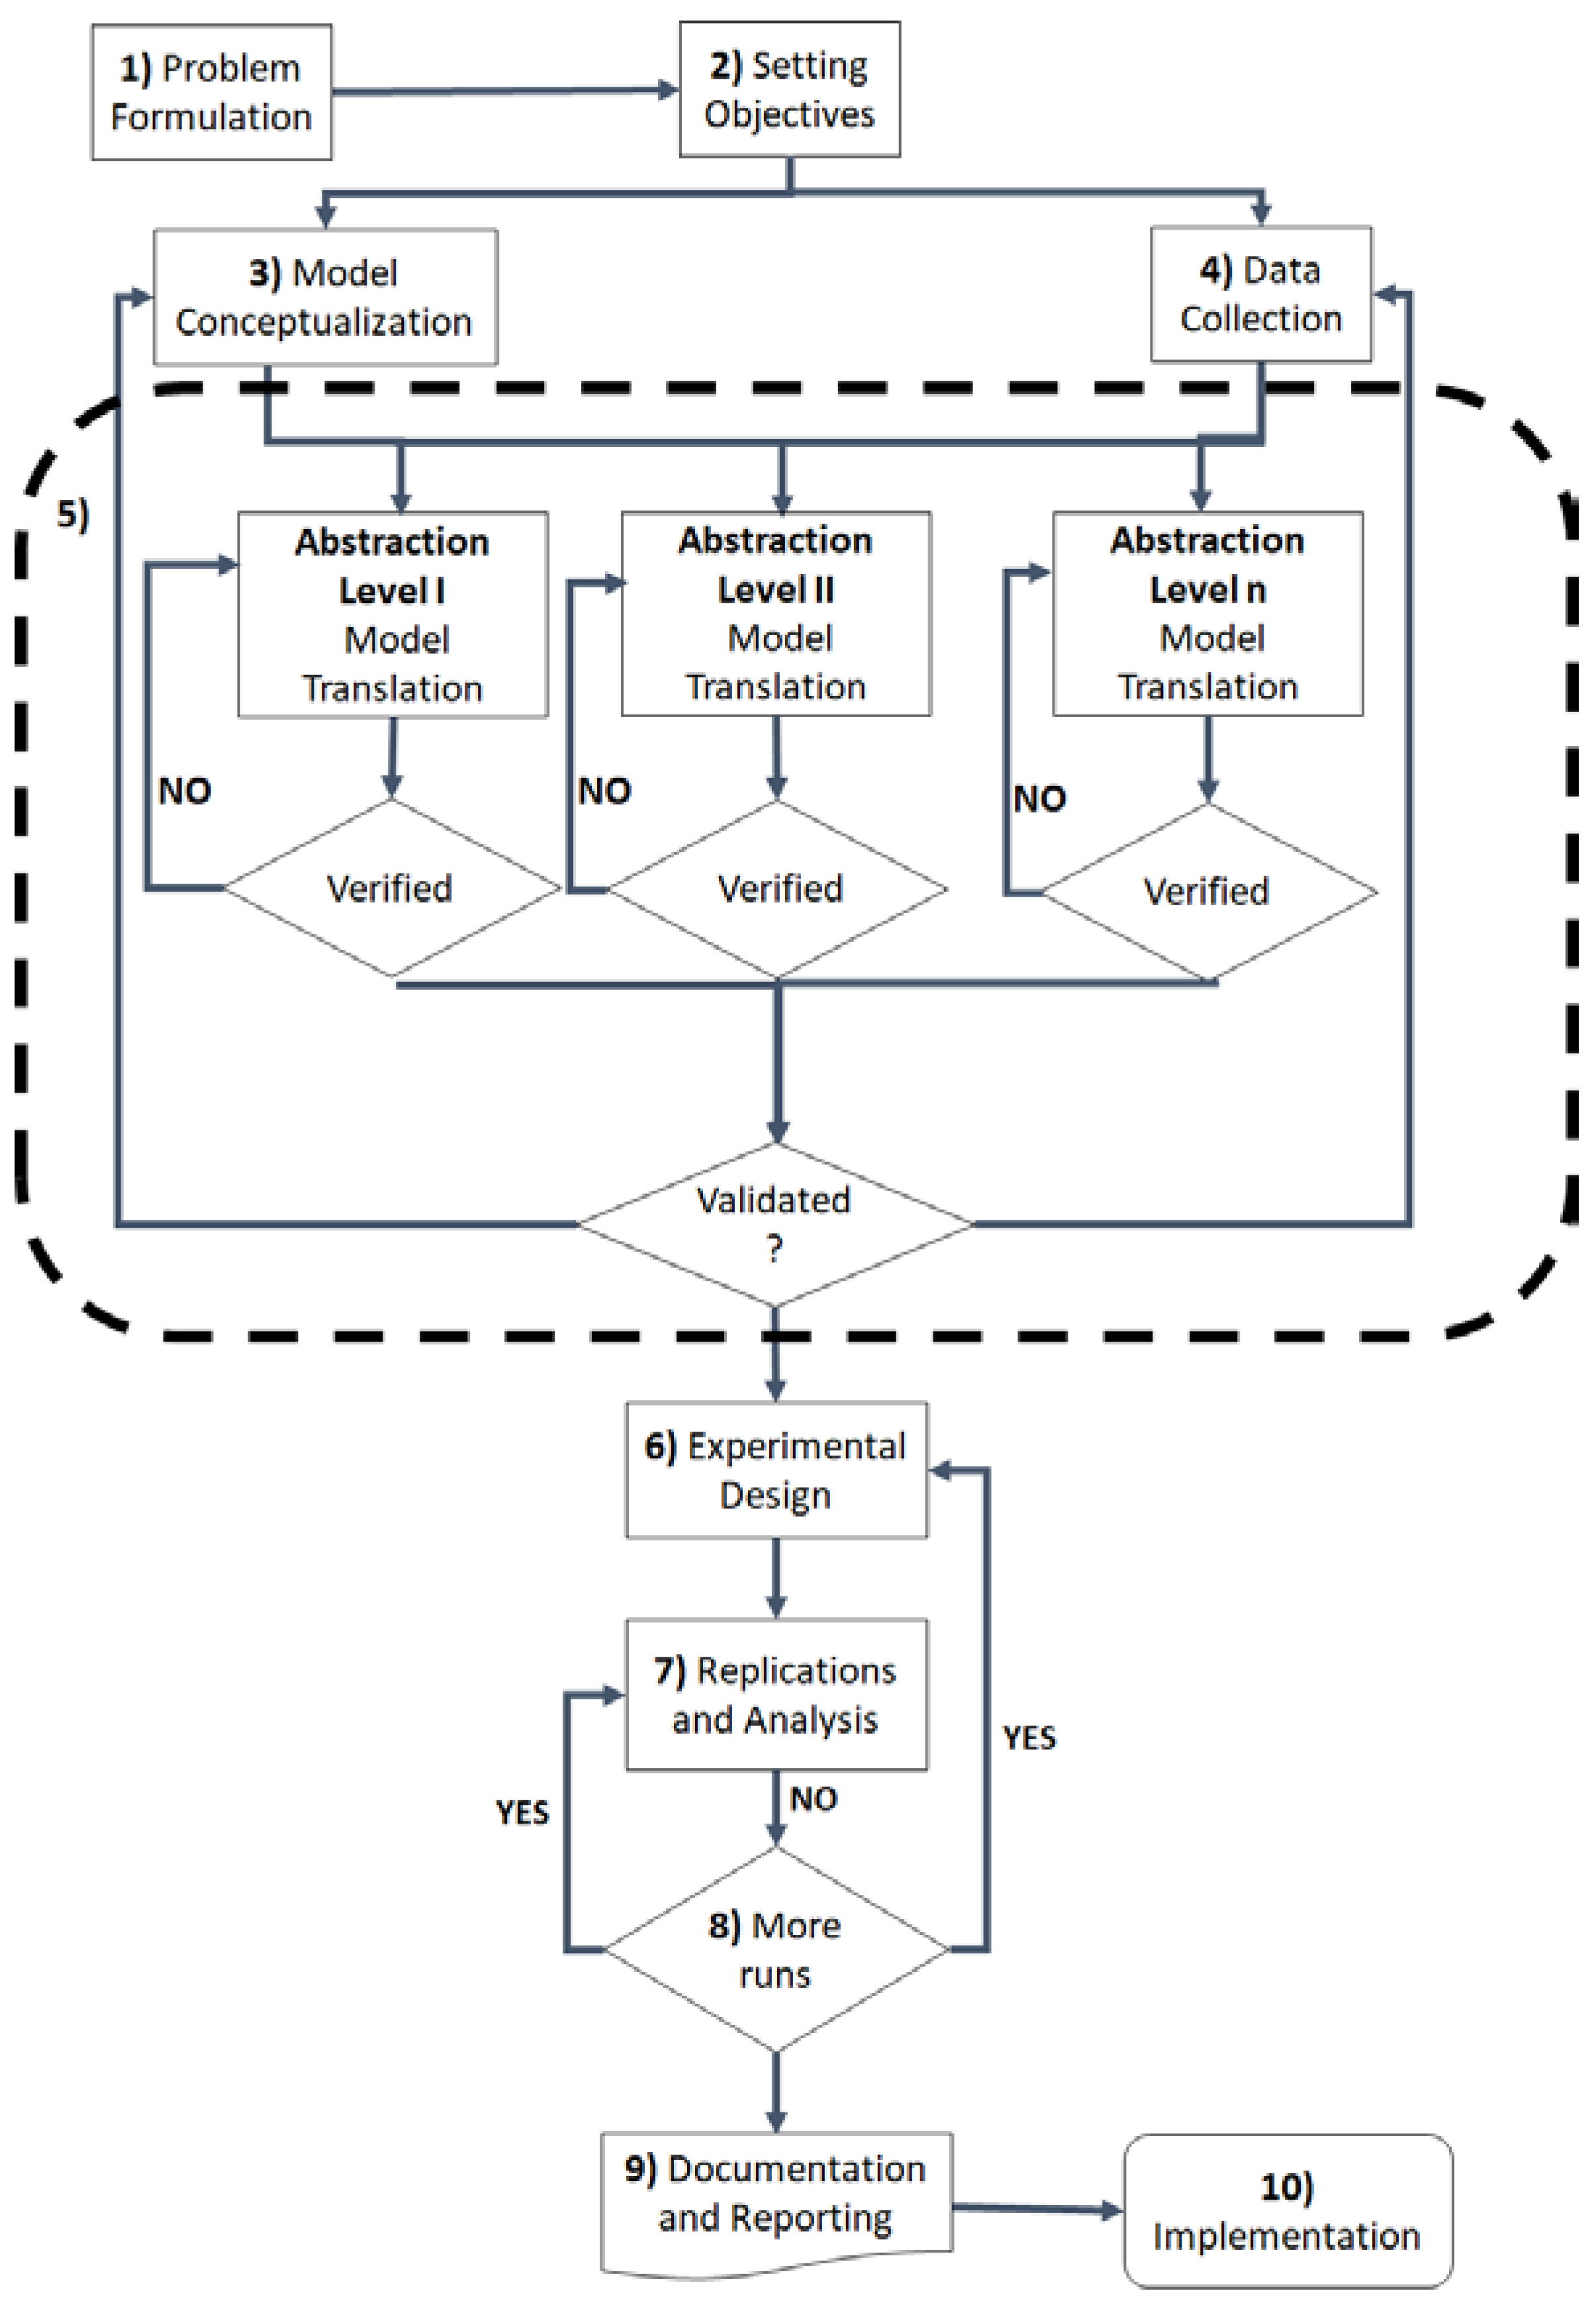
Figure 1 illustrates the general methodology proposed in the current work for different levels of abstraction. It is based on the original methodology formulated in [20]. The difference is that there are different levels of abstraction in the models and they interact with each other in a progressive fashion.
The methodology comprises different steps that the analyst needs to follow:
- (1)
- Problem formulation. In this step, the problem under study should be clearly described making use of descriptive elements that help to provide a clear understanding of the nature of the problem.
- (2)
- Setting objectives. Based on the problem formulation, the analyst should set the objectives pursued by the study. This step is fundamental, since it will determine different key decisions, such as the abstraction level and boundaries of the study (i.e., what is included and what is excluded).
- (3)
- Model conceptualization. In this step, as described in [20], the logic of the model and the artefacts that are within the scope of the model are defined. The analyst can make use of descriptive tools like flowcharts or Petri nets for this task.
- (4)
- Data collection. This step will iterate with the previous elements to identify the data that is required beforehand, what sources of data are available, and which need to be collected or not.
- (5)
- Model translation, verification and validation (V&V). It is in this step that the proposed methodology differs from those presented by other authors. In this case, the models with different abstraction levels are developed and verified. If the data and information is available, then the different models are validated. This step is a combination of models, which can number more than two, but the modelling effort will depend directly on the number of models to be developed.
- (6)
- Experimentation. In this step, and once the model(s) are validated, an experimental design is performed, making use of the different developed models and identifying the outcomes that should be in line with the objective stated. The experimental design can be a complex process, since it must deal not only with the combinatorial nature of the decision variables of each model but also with the outcomes of the interaction of the models once the cycle is progressing, as the example below illustrates.
- (7)
- Replications and analysis. This corresponds to the definition of the sample size of the model and the analysis of the data it generates. In comparison with standard methodology, this activity is more time-consuming, since the number of replications will increase linearly with the number of models in the cycle.
- (8)
- Documentation and reporting. This step relates to the description of the analysis and the reporting of results used by decision-makers.
- (9)
- Implementation. In the best situation, the insight gained from the analysis with the model(s) is implemented in the real system. However, this step does not always imply that the suggestions are implemented, but if the model is developed during the planning phase of a project, the results will serve to make corrections to the original plan. With this action, the risk of failure or over-/under-design are minimized in infrastructure projects.
The main methodological contribution of the current work is the formulation of the fifth step, which goes beyond what is found in literature. The standard methodology is a linear approach in which the study is undertaken using generally only one model. This novel approach is more time-consuming, however, for projects where an important amount of the budget is allocated; it is suggested that it is applied so that the risk of wrong estimations is minimized. In the following section, we present a case in which the authors applied the methodology with good results to support its use.
4. Example Case: Airport of Lelystad, The Netherlands
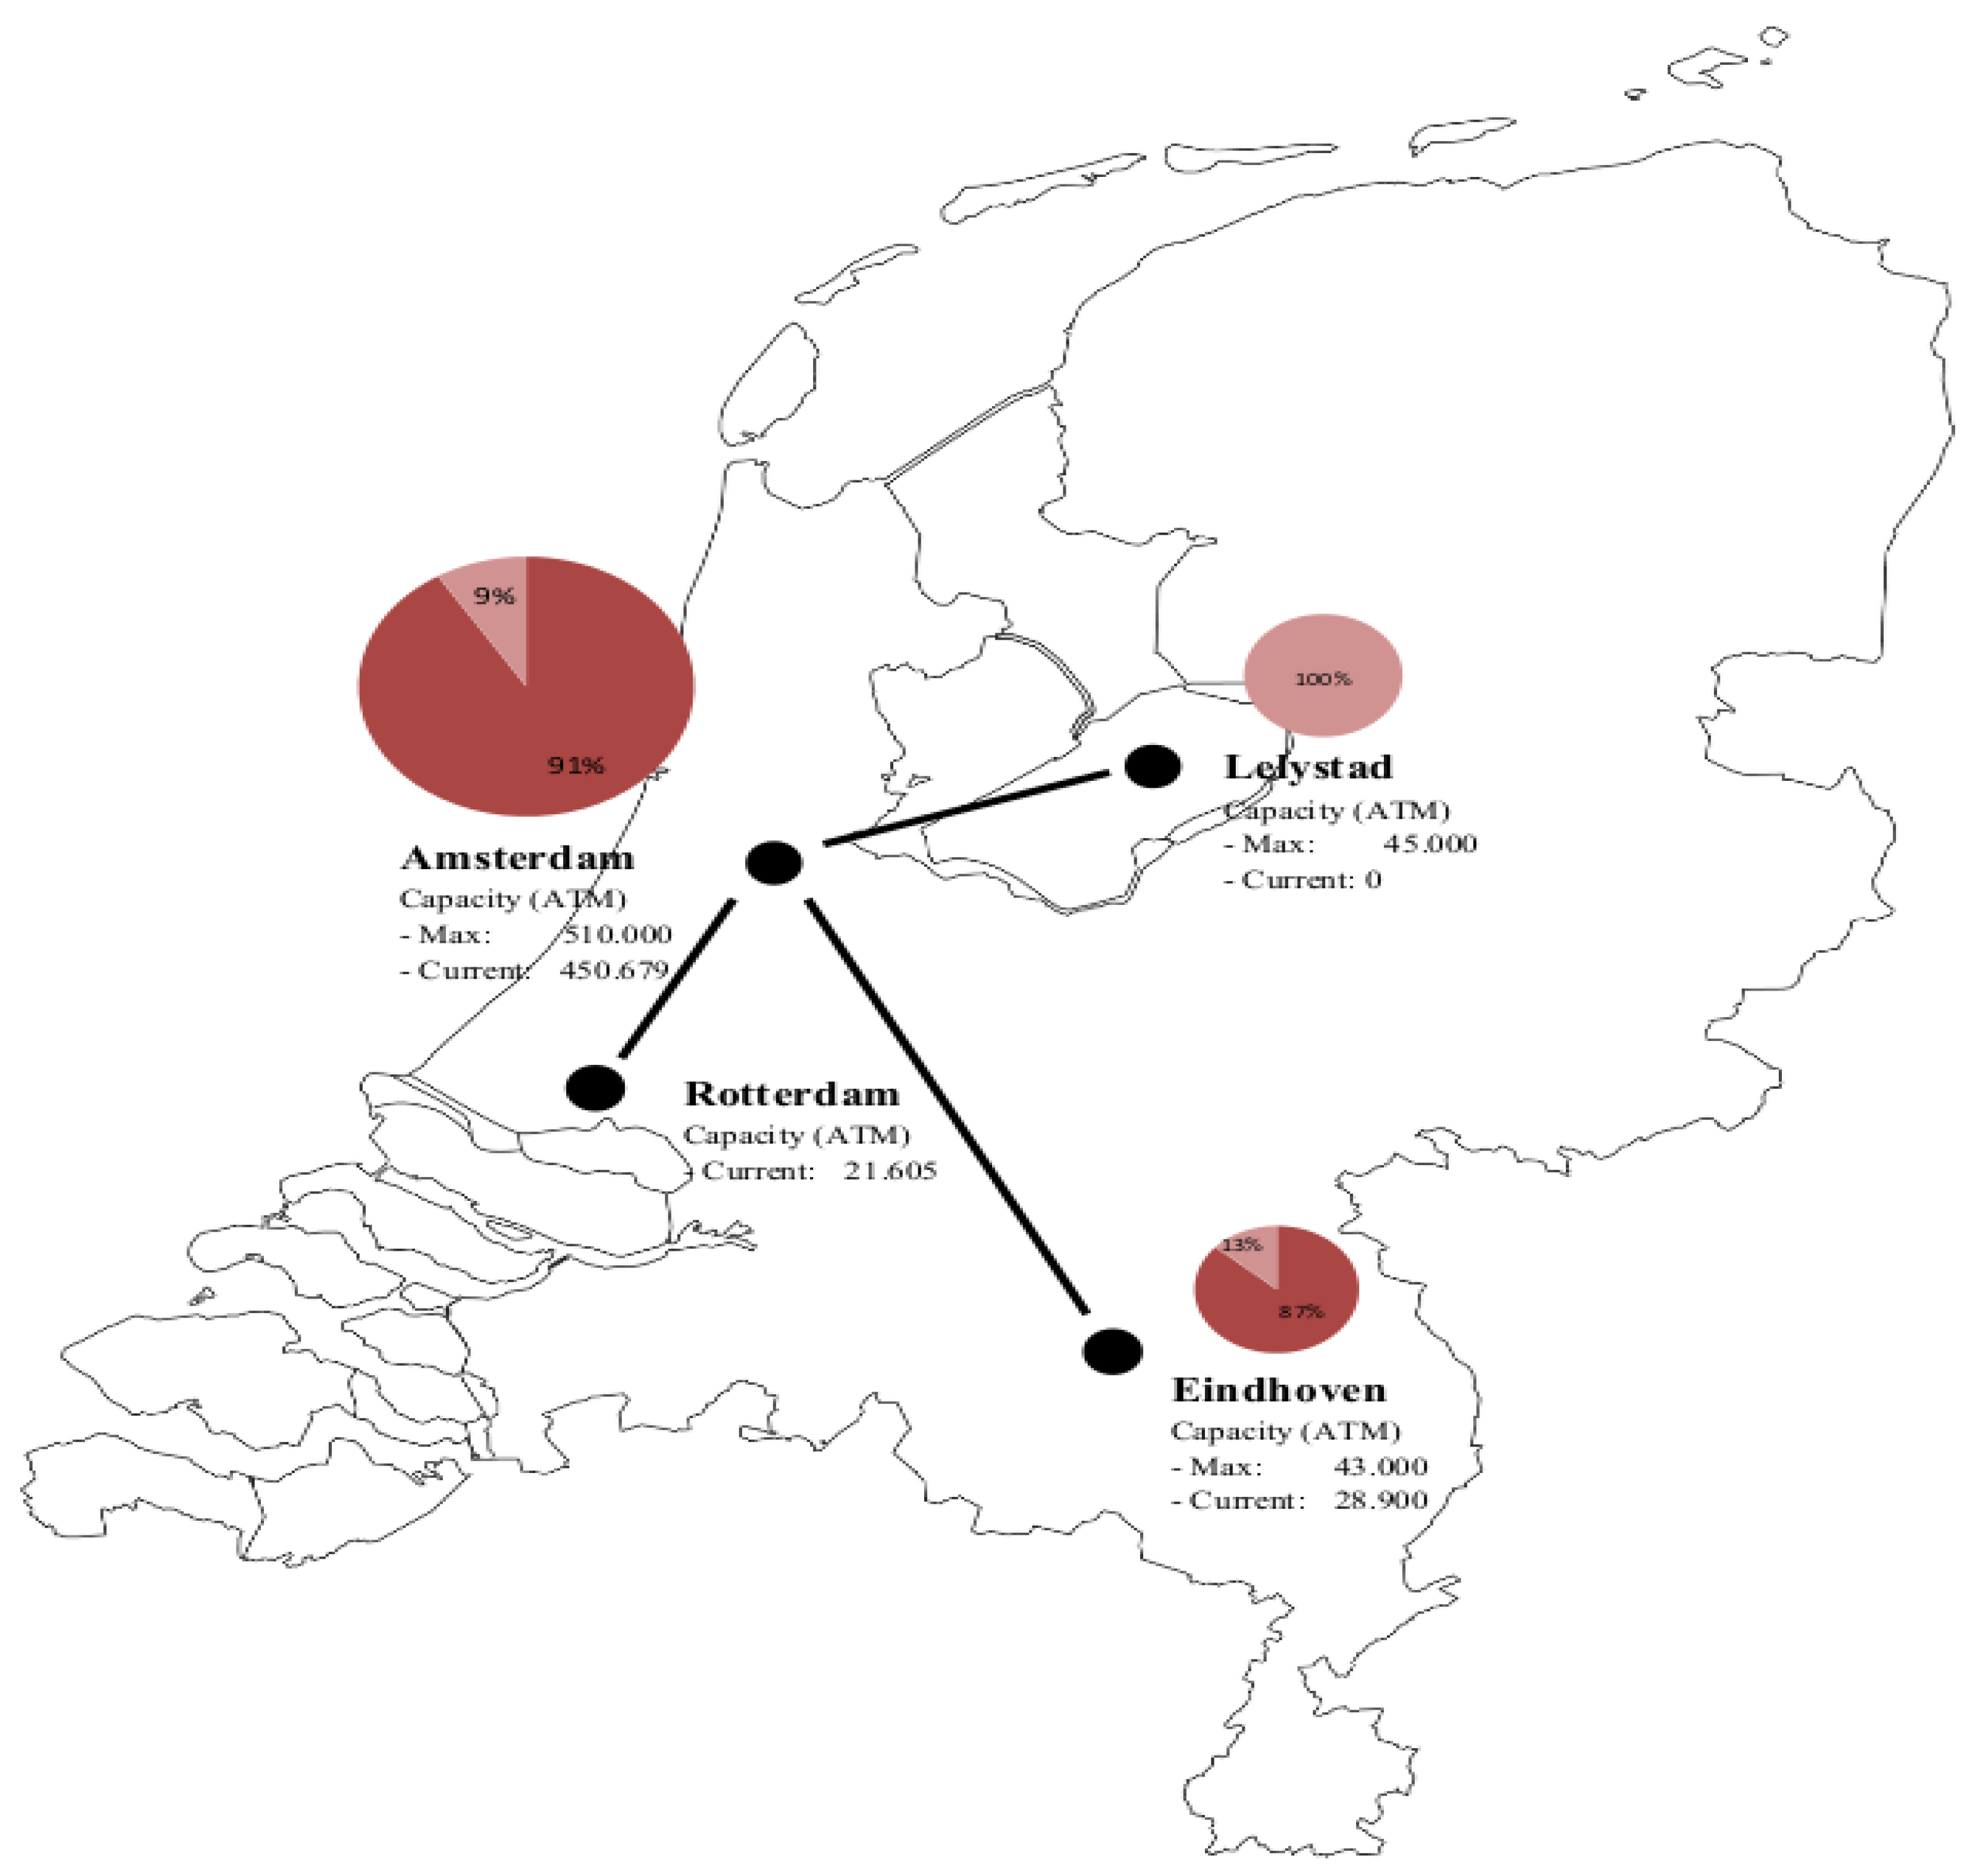
Amsterdam Schiphol (AMS) is the main airport in The Netherlands and was the fifth busiest airport in Europe in 2014 in terms of passenger traffic [21]. Furthermore, AMS is also the main hub of KLM, which provided 54% of the seats available at the airport in 2013, and is a major airport for the SkyTeam alliance whose members—including KLM—are responsible for 66.3% of air traffic movements (ATM) [22]. Its role as a hub is central to the airport’s strategy, especially considering the small size of the domestic market in The Netherlands and the airport's role as an economic engine for the region. For environmental reasons, the capacity at AMS is limited to 500,000 ATM per year. In 2014, there were 438,296 movements at the airport, 86% of the imposed cap. Since the operation is approaching its limit, Schiphol Group, the airport owner and operator, would like to support the hub strategy by redistributing traffic (that has a low positive impact on the hub) to other airports in The Netherlands in order to relieve capacity at Schiphol. The preferred alternative is to upgrade Lelystad Airport (LEY) to attract flights to European cities and regions, with a focus on tourist destinations.
In our example case, the authors applied the methodology for modelling operations of the upgraded airport of Lelystad. This airport is currently in operation and is the largest airport for general aviation traffic in The Netherlands but does not yet handle commercial traffic. It is located 56 km from central Amsterdam, about 45 min by car to the east. The airport is fully owned by Schiphol Group, which also owns Rotterdam airport (RTM) and a 51% stake in Eindhoven airport (EIN), both of which will form part, together with Lelystad and Schiphol, of what has been called the Amsterdam Multi-Airport System (see Figure 2).
The ambition to divert short-haul traffic “with a focus on tourism destinations”, to Lelystad implies a stronger focus on the airlines that can deliver such type of traffic. The low-cost carriers (LCCs) have been identified as the type of traffic that most likely would use the airport facilities. At Lelystad, the availability of slots can be hampered by the remaining general aviation traffic after the upgrading has been finalized and possible conflicts with air traffic in approach and departure trajectories at Schiphol. For this reason, the government has mentioned that short turnaround times will be important for attracting the right traffic, otherwise there is a high risk of another unsuccessful European airport project [23].
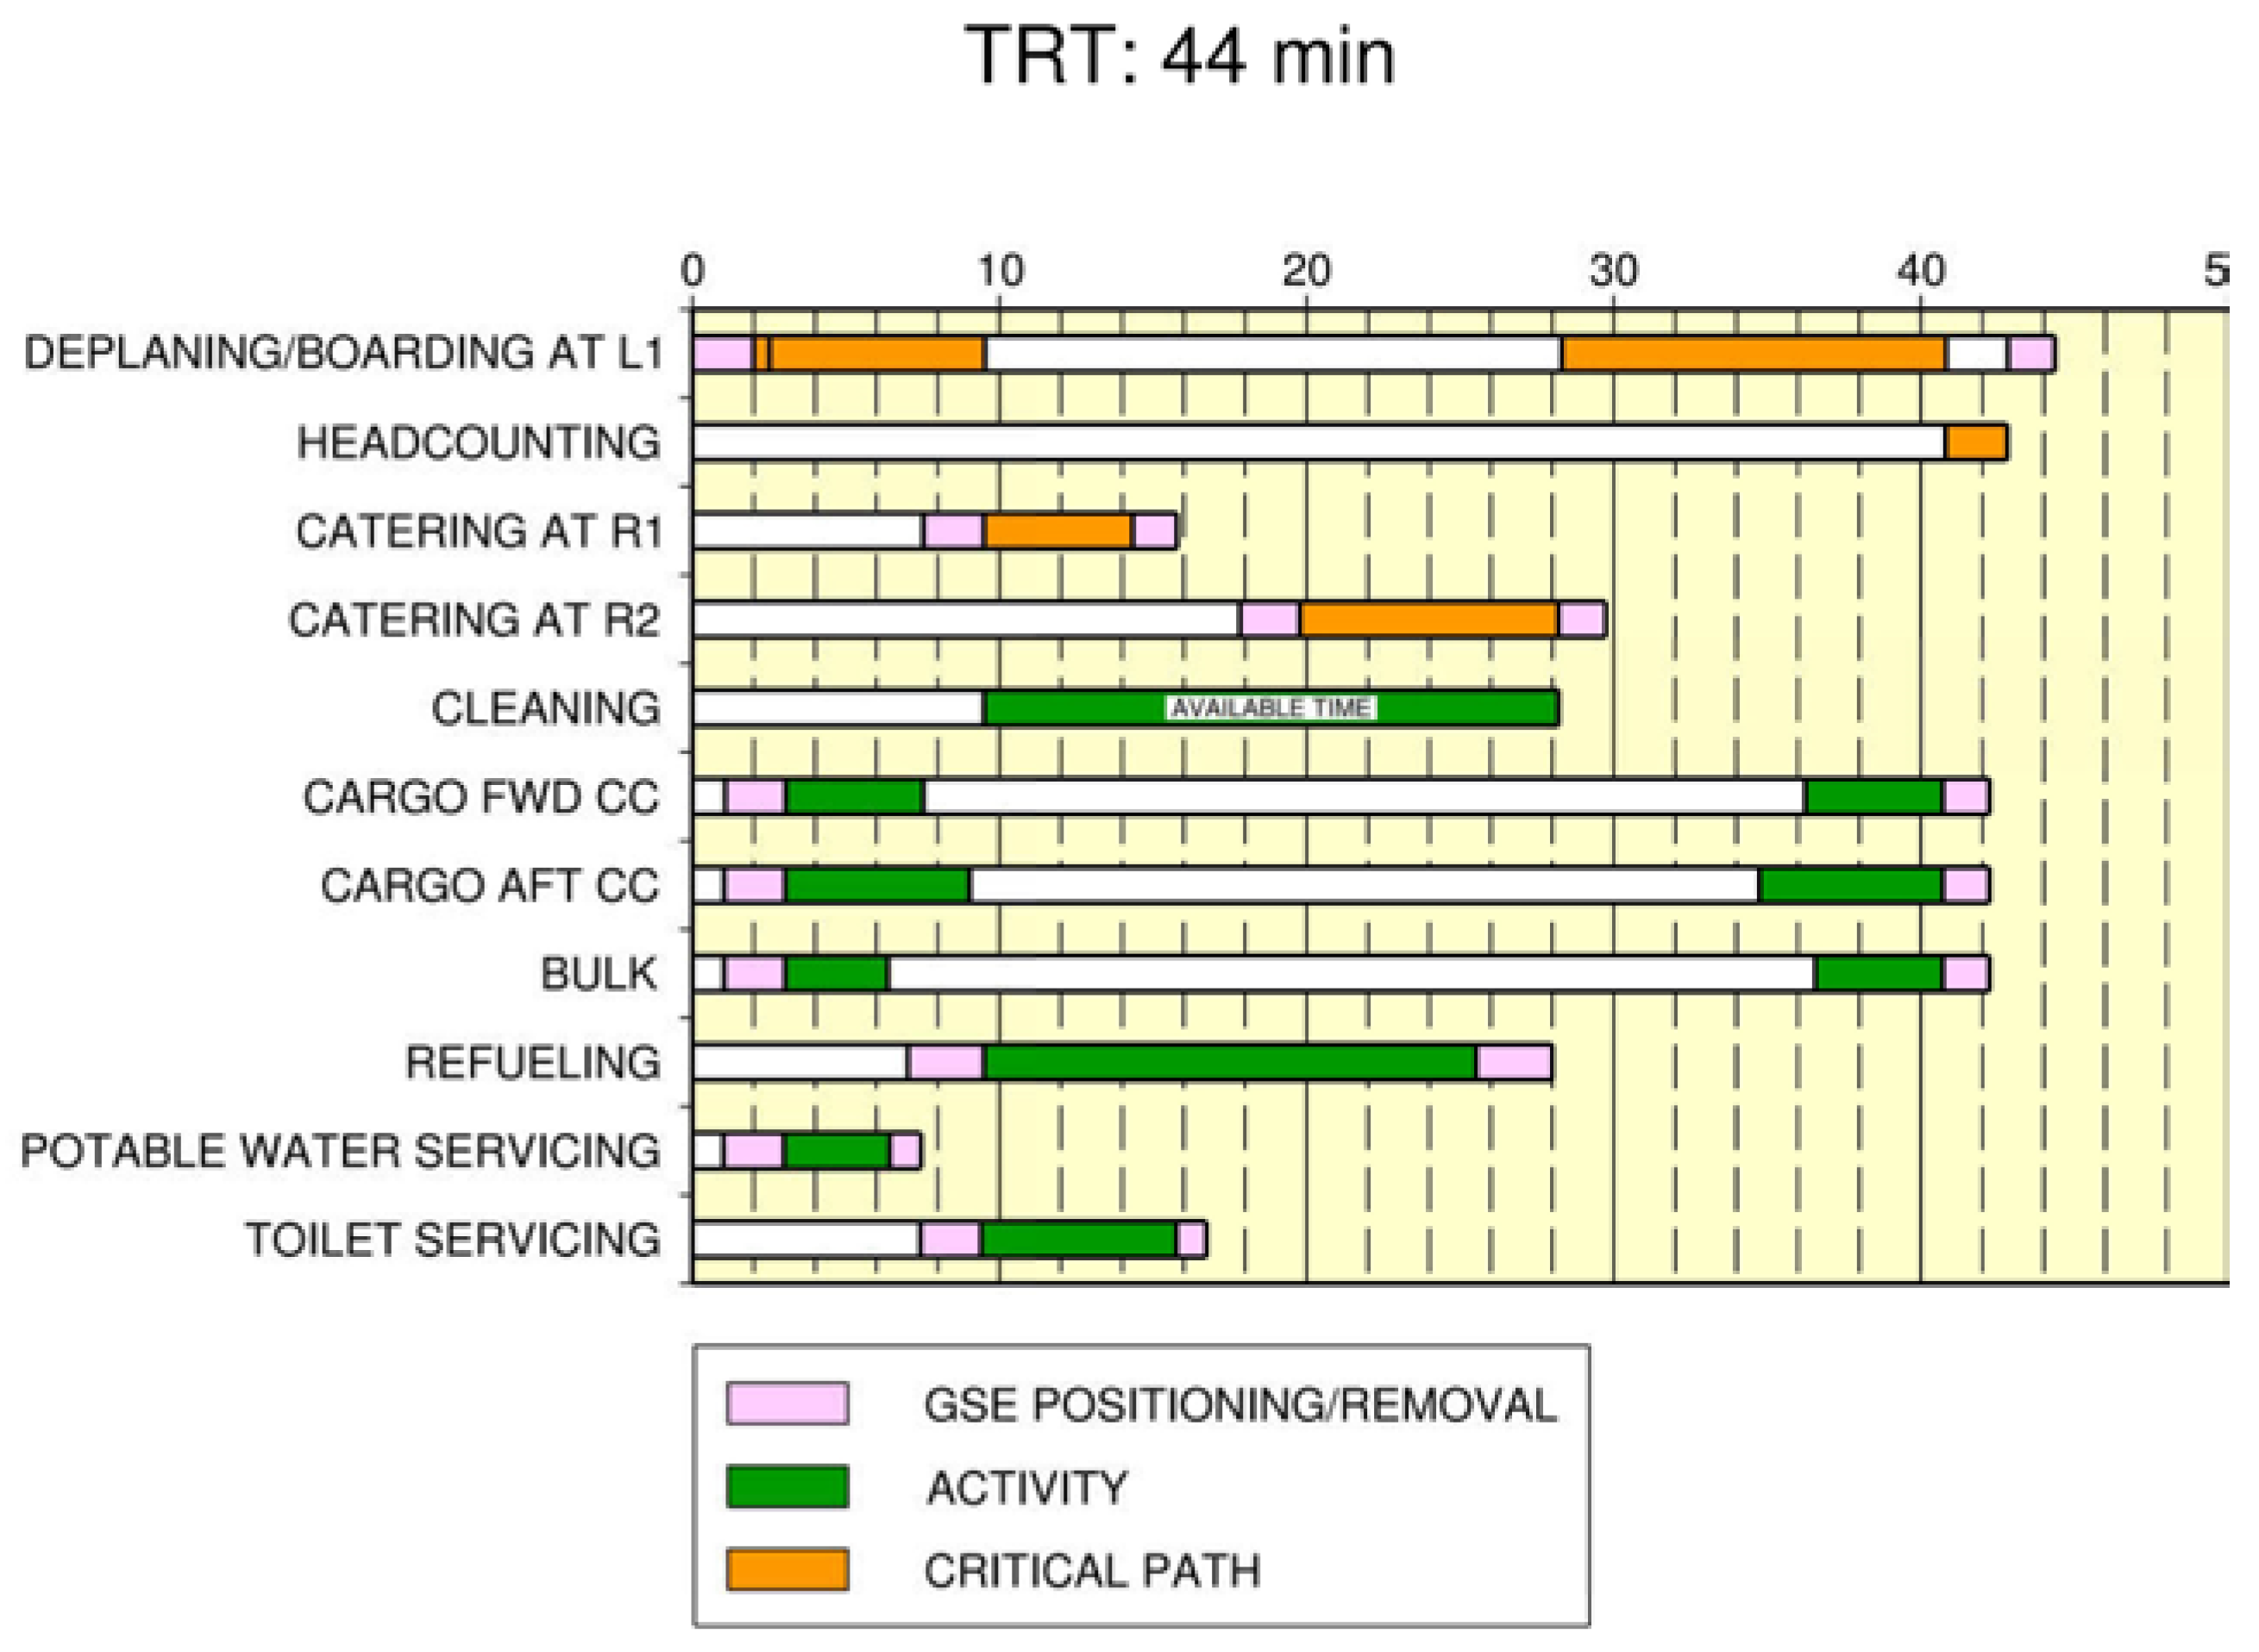
Turnaround time (TAT) is the time the aircraft is parked in the gate or stand in order to perform different activities and board new passengers. During this time, several operations like refuelling, cleaning and passenger boarding are performed. Figure 3 illustrates the TAT processes of an A320-200.
Normally, this time is counted from the moment chokes are placed beneath the wheels of the aircraft to make it completely still until they are removed. All the processes that happen in between consume time, time that the aircraft is not transporting people to destinations and thus not making any revenue. For this reason, the TAT is an indicator of performance in most airports on the globe. This indicator is used in our study for measuring how efficient one configuration would be over another. A different indicator that will be used for measuring the operational efficiency of the future airport is the delay that aircraft might experience due to variability in operations. In our case, this is measured by comparing a non-impeded flow of aircraft [24] from the stands to the runway, with their flow when there is traffic. This will serve as an indicator of congestion in the operation.
The proposed methodology was applied to evaluate the performance of the future facility, identifying what the requirements are in terms of apron configuration, TATs, and what potential issues might arise once the operation is in place. We evaluated diverse configurations under the reported expected traffic figures: 45 k annual movements [22].
In our study, we followed the methodology using two different simulators, one specifically intended for aviation and another that was general purpose. As has been pointed out, in the methodology, the models do not have to be constructed using the same tool. They can be developed using something as simple as an Excel-based model to something purpose-specific as presented in our study.
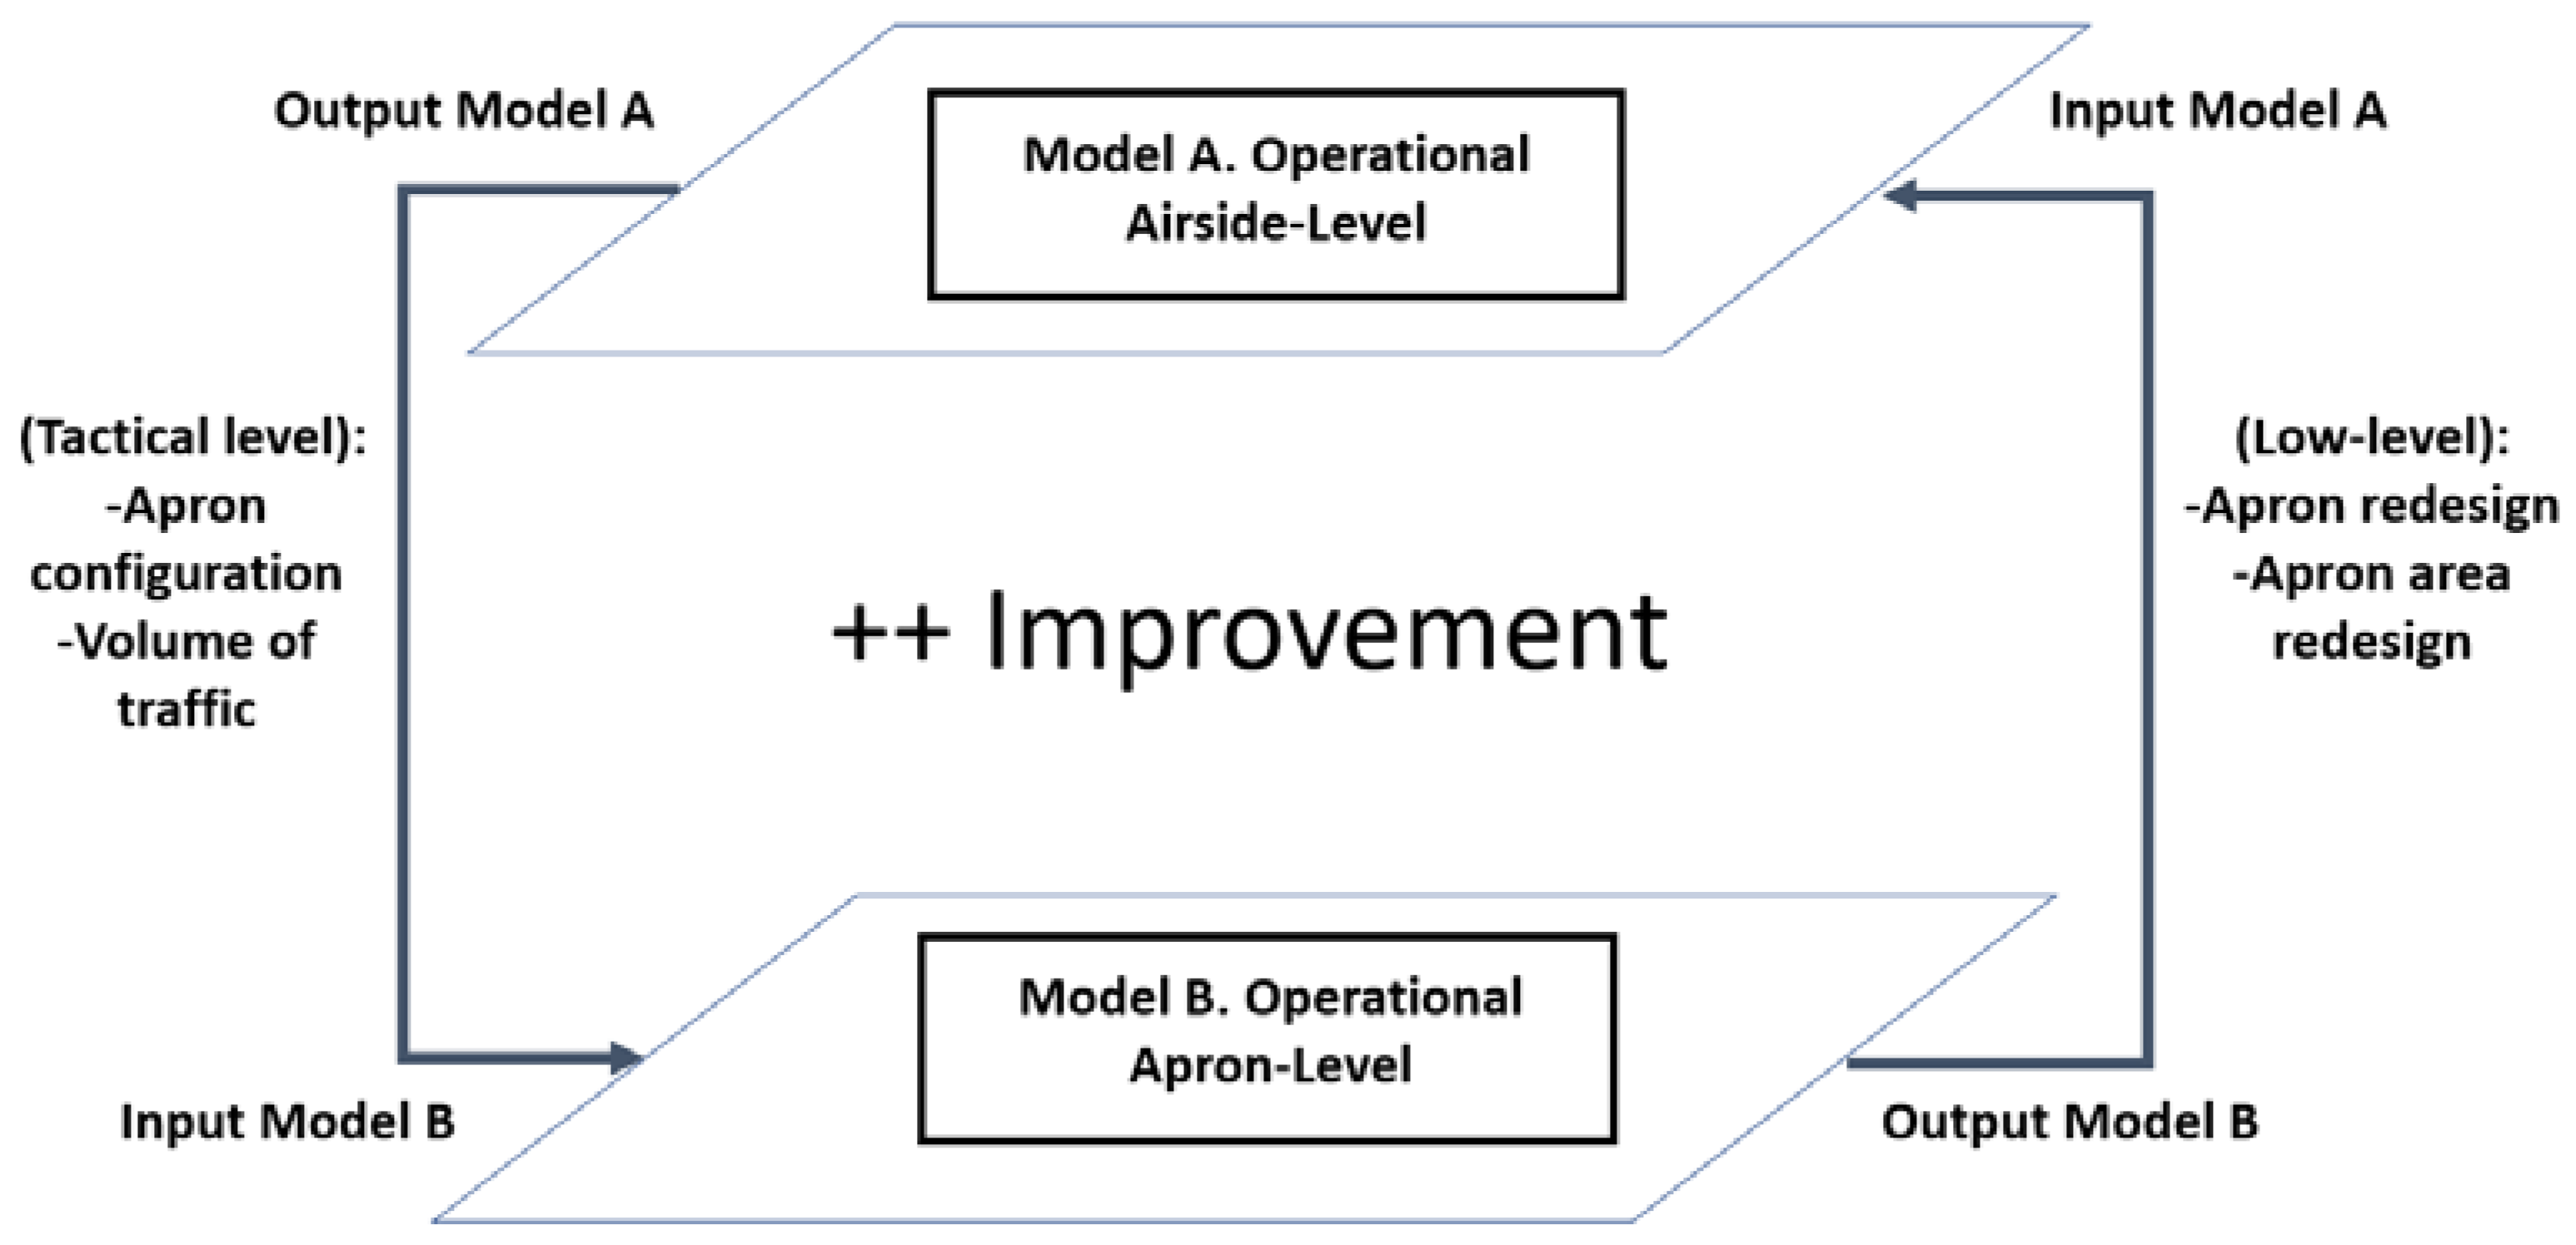
4.1. Model Interaction Architecture
In this study, the main step worth focusing on is step 5 of the methodology, since steps 1 to 4 are part of the standard methodology. Therefore, a couple of models were developed with different abstraction levels. They will interact with each other in order to identify the different characteristics of infrastructure to be constructed in the future.
As mentioned, two models, Model A (top graph of Figure 4) and Model B (bottom graph of Figure 4) were developed using different tools that allow different abstraction levels. Model A is developed with a general-purpose simulator called SIMIO [25] that mainly uses the DES approach and Model B is developed by using a specific-purpose simulator called AEROTURN [26] using a physical–technical approach. By using the two tools, the results complement each other and can interact in the virtual circle generating a powerful approach for the analysis of aviation systems. Model A incorporates different elements of the tactical operations such as traffic, landing, take-off, taxiing, terminal manoeuvring area (TMA) operations and the general configuration of the apron. Model B incorporates the physical and technical characteristics of the operation, such as the apron movements, and the jet blast and turning area, depending on the type of aircraft under study.
The cycle starts in Model A, produces an output of performance indicators, and reveals potential issues at tactical level. Then, with model B we identify low-level issues that can be used for improving model A, such as conflicts generated by the jet blast or the required area to turn the aircraft in the apron once the type of aircraft is included in the loop. With that information at hand, it is possible to use this as an input in model A so that the tactical operation can be modified accordingly to fix the problems identified in model B and so on. By following this procedure, the more iterations are performed, the more the risks and potential issues for the real system are reduced.
4.2. Model A Characteristics
A DES simulation model has been developed with SIMIO. This was adopted because it allows the development through a bottom-up approach of a dynamic model [16]. The developed model has characteristics that are dynamic, stochastic and asynchronous. These features allow identifying the potential problems of the future airside of the airport as well as the so-called emergent dynamics. Furthermore, to understand the potential problems for the airport in the future, we analysed the response for the different inputs (internal and external). Among different parameters and configurations, we focused on two configurations, one of which is a linear apron in which the aircraft parks perpendicular to the taxiways (nose-in configuration) and the other in which the aircraft’s parking positions are located parallel to the taxiway (parallel parking). This configuration has the advantage that, in theory, the turnaround times (TAT) are short, since the aircraft uses their own engines to perform the taxi-in and out to the Apron (see Figure 5). In addition, no use of push-back trucks implies that the aeronautical charges would also be less than in an airport that uses these in its operations.
Different combinations of the number of ground-handling vehicles were used for evaluating the capacity limitations of the future facilities. In the case of the ground-handling operations, an initial set of vehicles for the operation were included for performing the turnaround:
- 1 fuelling truck
- 1 bus boarding
- 1 bus for deboarding
- 2 stairs (for dual boarding)
- 1 water truck
- 1 cleaning truck
- 1 baggage cart for baggage in and out
For the sake of modelling purposes, we assumed that it is possible to use only 1 bus for boarding/deboarding and 1 baggage cart for luggage; however, there are situations that can be further explored when more information is available, such as the utilization of aircraft with dense seating configurations. For these types of aircraft, it might be necessary to use two buses and more than 1 baggage cart; however, this can also be performed in parallel with similar results as those presented in this work.
The turnaround operations for every aircraft that arrives are modelled following the sequence suggested by the manufacturer (Figure 3). Therefore, there are some operations that can be performed in parallel while others are sequential. This logic was included in the modelling of the TAT operation.
Figure 6 illustrates the approach for evaluating the response of Model A. It is an approach in which inputs are provided and then the outcomes are evaluated using statistical techniques. We present only a partial analysis of Model A, since the combinations of the input levels are too big to be included in this work and would be beyond the scope of the article. However, if the reader is interested in the complete analysis of Model A, we refer to [13,16]. In the following subsections, the sub models that compose Model A are presented and briefly discussed.
The simulation model was developed using a bottom-up approach in which different elements were developed independently and then put together and synchronized so that they worked as one. The model was verified following the technical restrictions of ICAO and assigned taxiing, takeoff and landing characteristics similar to those of an existing airport: Eindhoven airport. At this stage, it is not possible to validate the model since the airport (LEY) has only general aviation operations, hence the historical data from the operation is useless for validating future commercial operations.
4.2.1. Runway Module
In this module, runway operations such as landing and takeoff were modelled. There is only one runway, used for both landing and takeoff operations. The logic inherent to these operations was implemented, such as separation minima, aircraft speed and runway configuration. In Figure 7, a representation of the runway module is depicted.
The modelling concept of the runway is composed via a collection of segments linked by nodes (left-hand side of the figure) in which the aircraft entities perform the landing, takeoff, and taxi operations towards the terminal building.
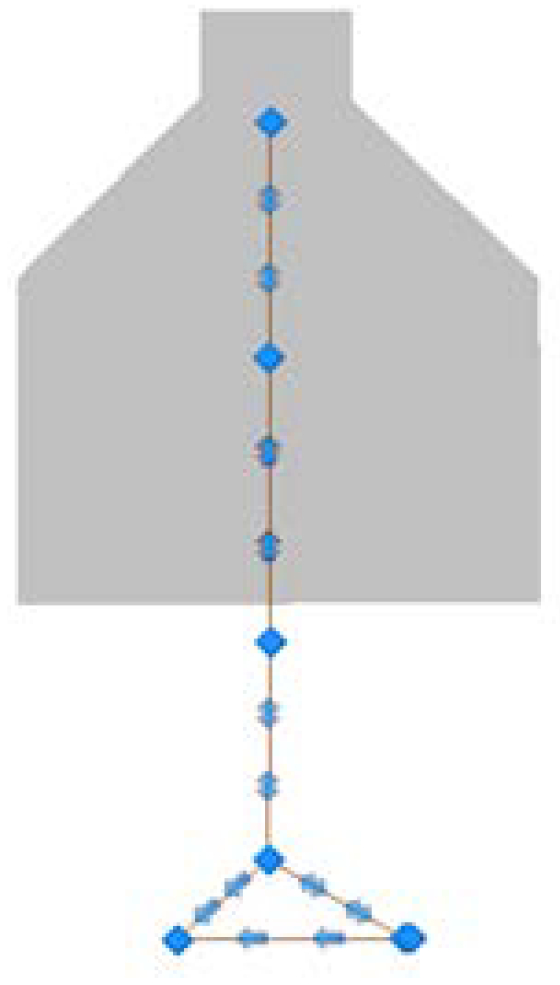
4.2.2. Stand Module
The stand module, simulates the ground operations performed at any stand in the airport. In this module, only some operations from those that are common to any full-service carrier are considered, namely fuelling, passenger boarding/deboarding, baggage loading/unloading, water service, and cleaning. Figure 8 illustrates the physical aspect of the module used for the stand.
The conceptual approach for the operations performed at the stand is a collection of nodes and segments in which the entities approach and use the network to simulate arrival and departure from the stand. Once the aircraft touches the last node, a series of stochastic delays are performed to simulate the turnaround process. The logic for the TAT is implemented in the module and is done in a way that is general enough to adapt it to different configurations and/or types of aircraft. Lastly, once one module of a stand is developed for simulating different layouts like piers, linear layout etc. a collection of these stands is joined together to simulate a complete infrastructure.
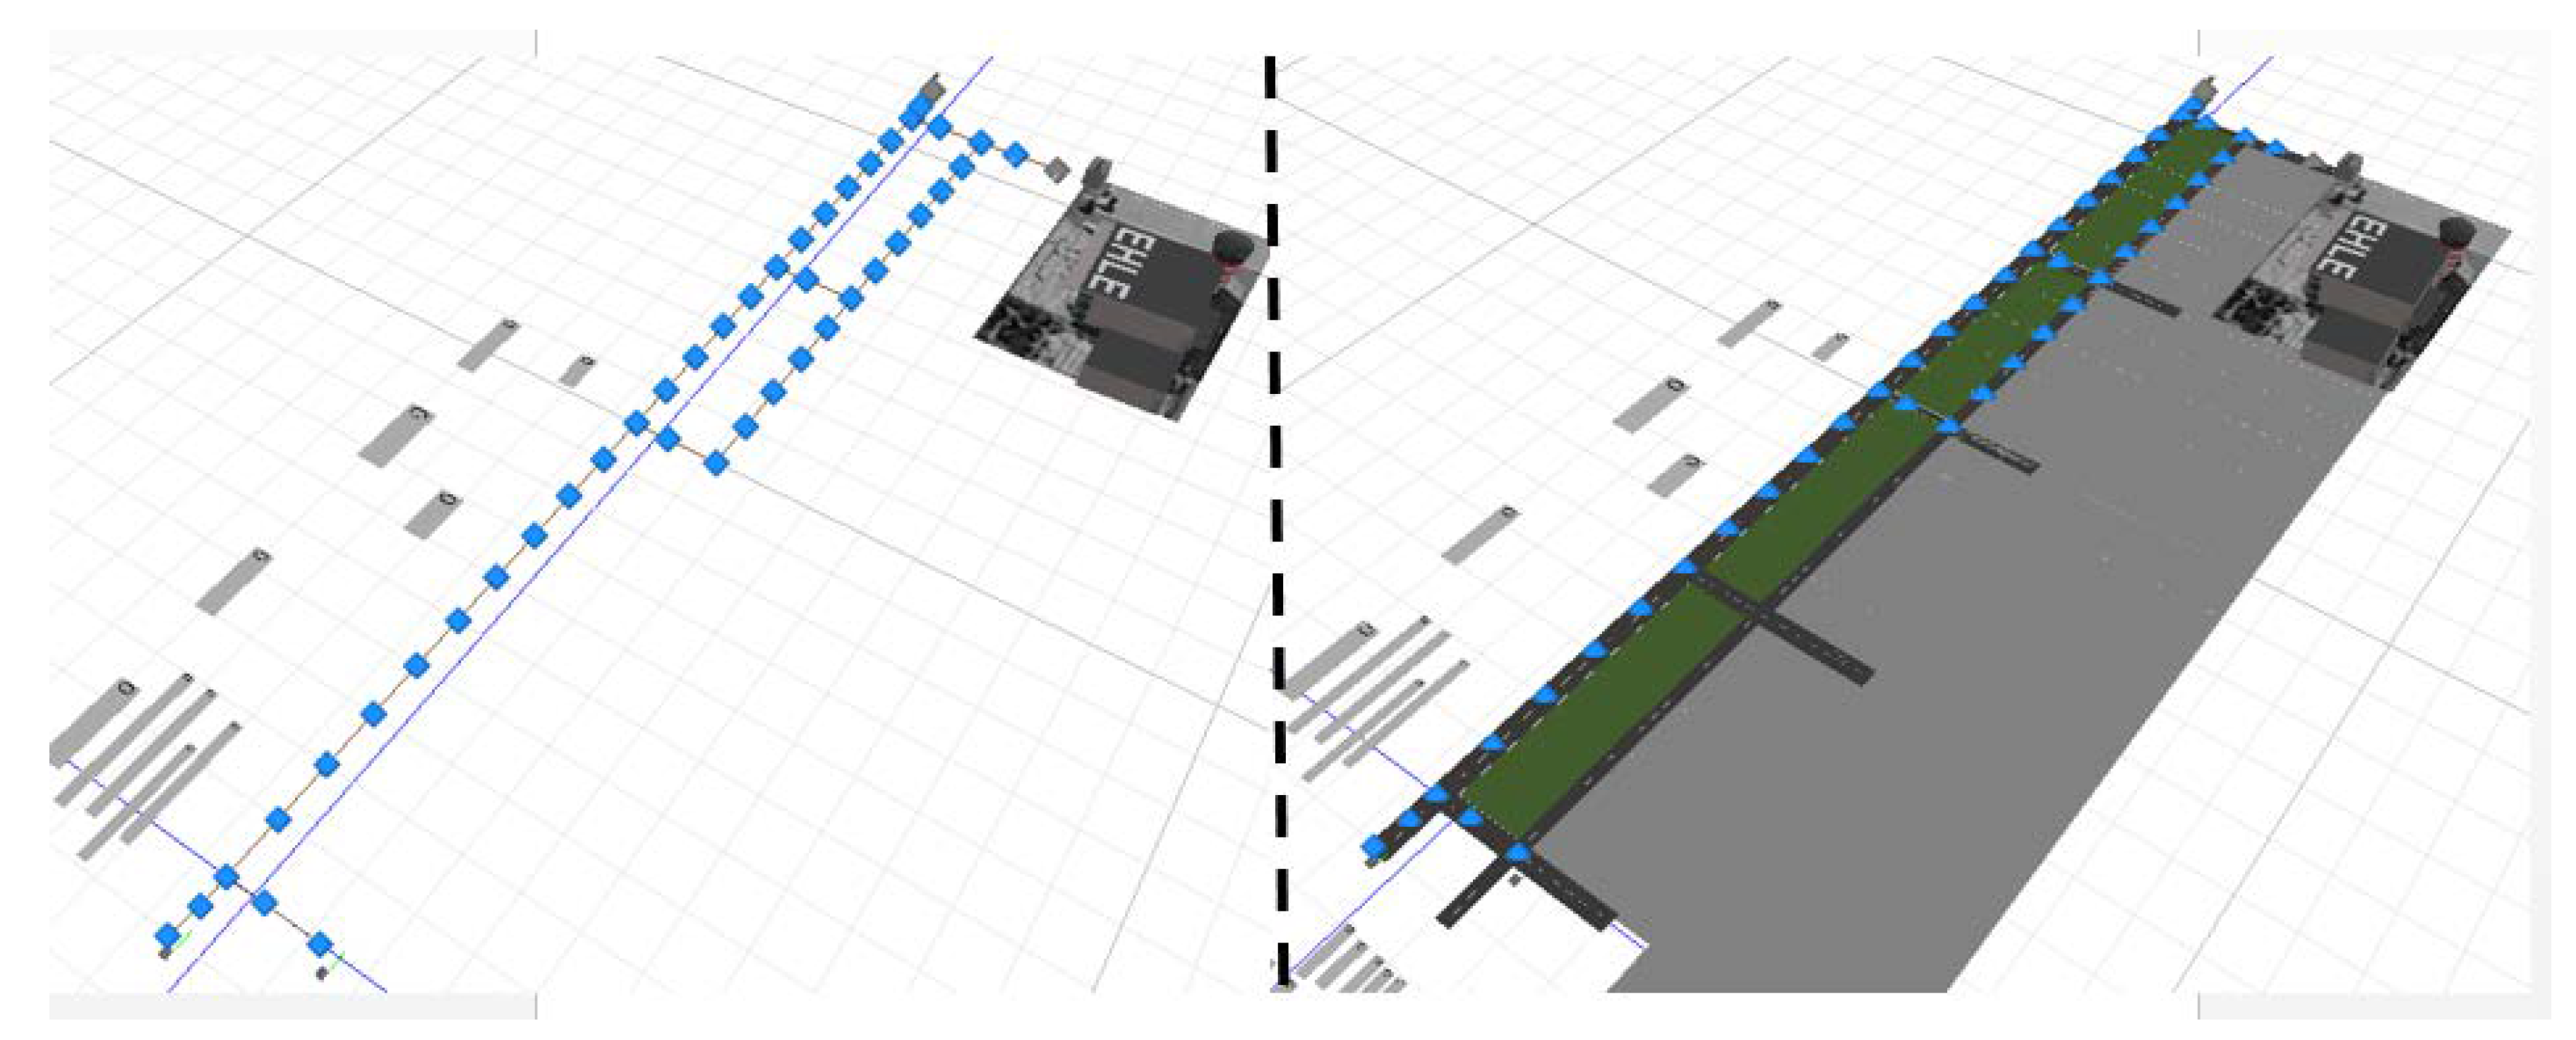
4.2.3. Taxiway Network Module
With all the stands connected, the next step is to connect them to the runway through a network of segments and nodes that represents the taxiways. Figure 9 illustrates the taxiway network that is used for modelling the airside of the airport.
The model is composed of 16 instances of the stand model. The taxiway network is composed of segments of links and nodes that connect the runway with the apron area. For the modelling of the operation, the ground service vehicles are also included, and the depot for those vehicles is in the north-west of the apron. As can be perceived, the model is an integral one that includes the apron, runway, vehicles and taxiway.
4.2.4. Assumptions
For this model, some assumptions have been made, and the most relevant of these are as follows:
- the turnaround processes start as soon as the aircraft has blocked in;
- the vehicles that perform the ground operations are in depots at one extreme of the apron;
- the engines’ jet blasts are neglected in the apron operation;
- the exact dimension is not considered in the operation, just an approximation that allows a smooth approach to the parking positions;
- the different operations at the parking positions follow the probability distributions reported in literature [13].
As mentioned, if the reader is interested in the probability distributions used in Model A, these can be found in [16].
4.3. Model B Characteristics
Model B was developed using a specific purpose simulator called AEROTURN 5.0 [26] which uses a combination of physical characteristics and the interaction of the layout for modelling at a lower level than Model A. The model developed was used for evaluating in detail the implications of the two configurations of the apron already mentioned.
The use of AEROTURN in the airport design process allows an optimized infrastructure design to be achieved, since it considers:
- aircraft performance, such as speed and turning angles required for the operation;
- aircraft push-back operations with tractor/towbar configurations and those without;
- jet blast contours and impact surfaces for various engine thrust levels;
- design of taxiway intersections, including fillets;
- definition of safety areas.
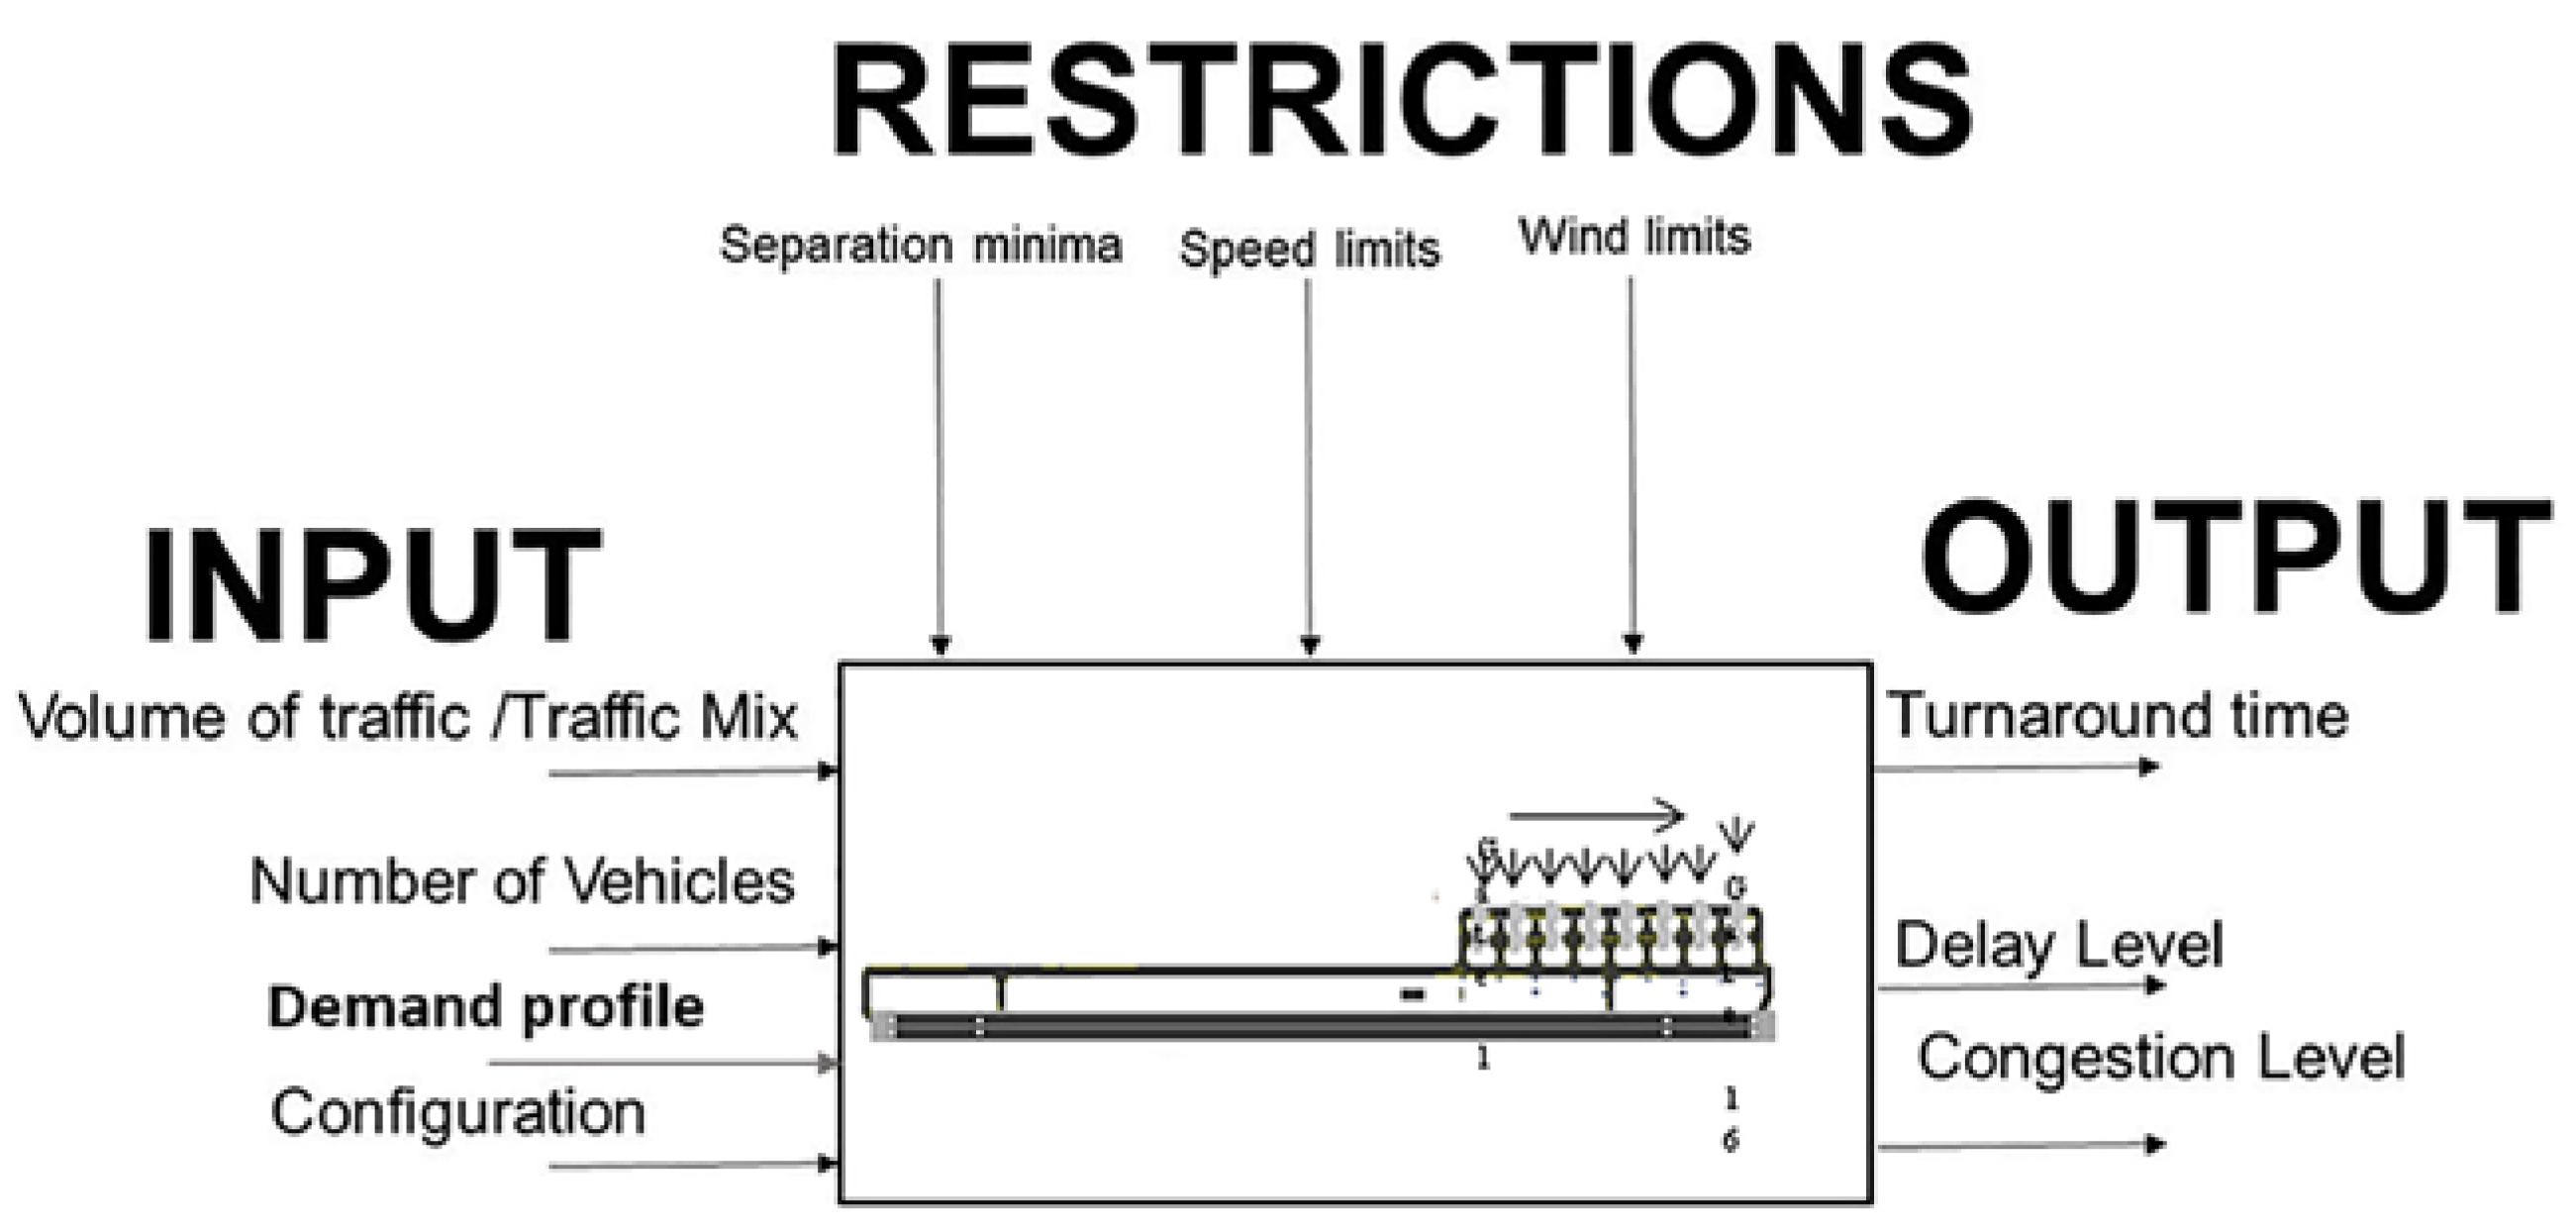
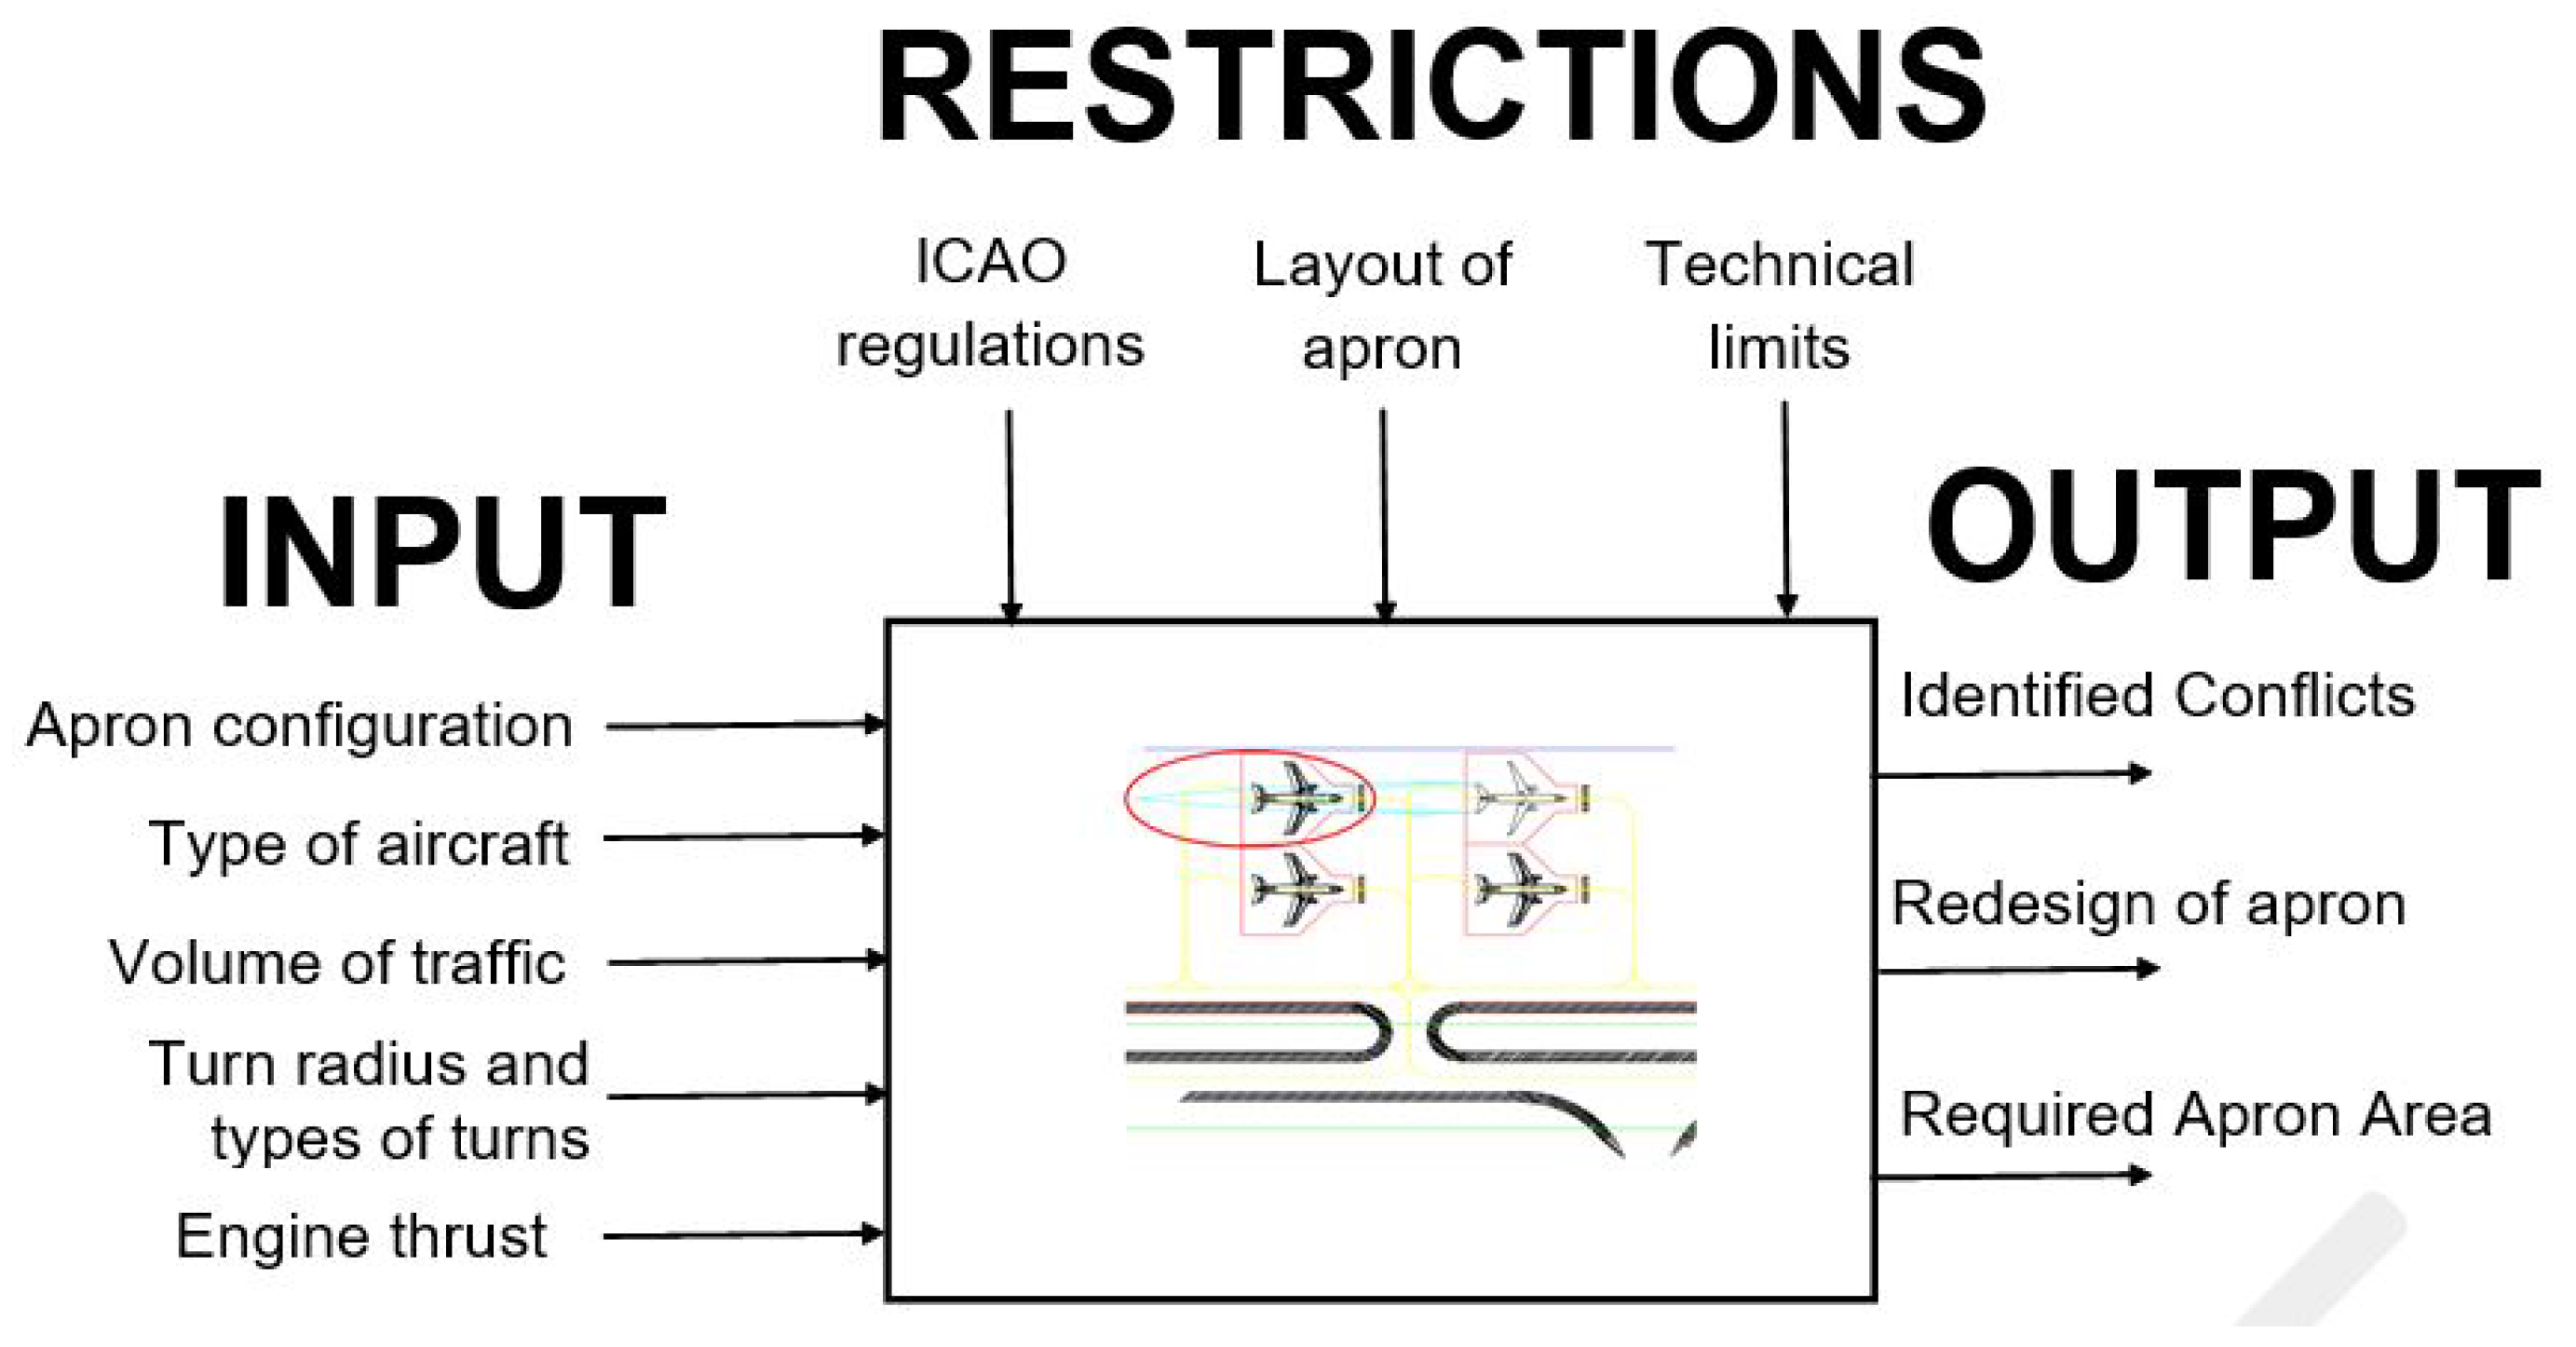
Model B consists of 12 scenarios based on the combination of the apron layout, demand, operational procedures and type of analysis (aircraft performance, safety margin or jet blast). Figure 10 illustrates the main characteristics of the model in terms of input–output and the main restrictions.
4.3.1. Apron Configuration
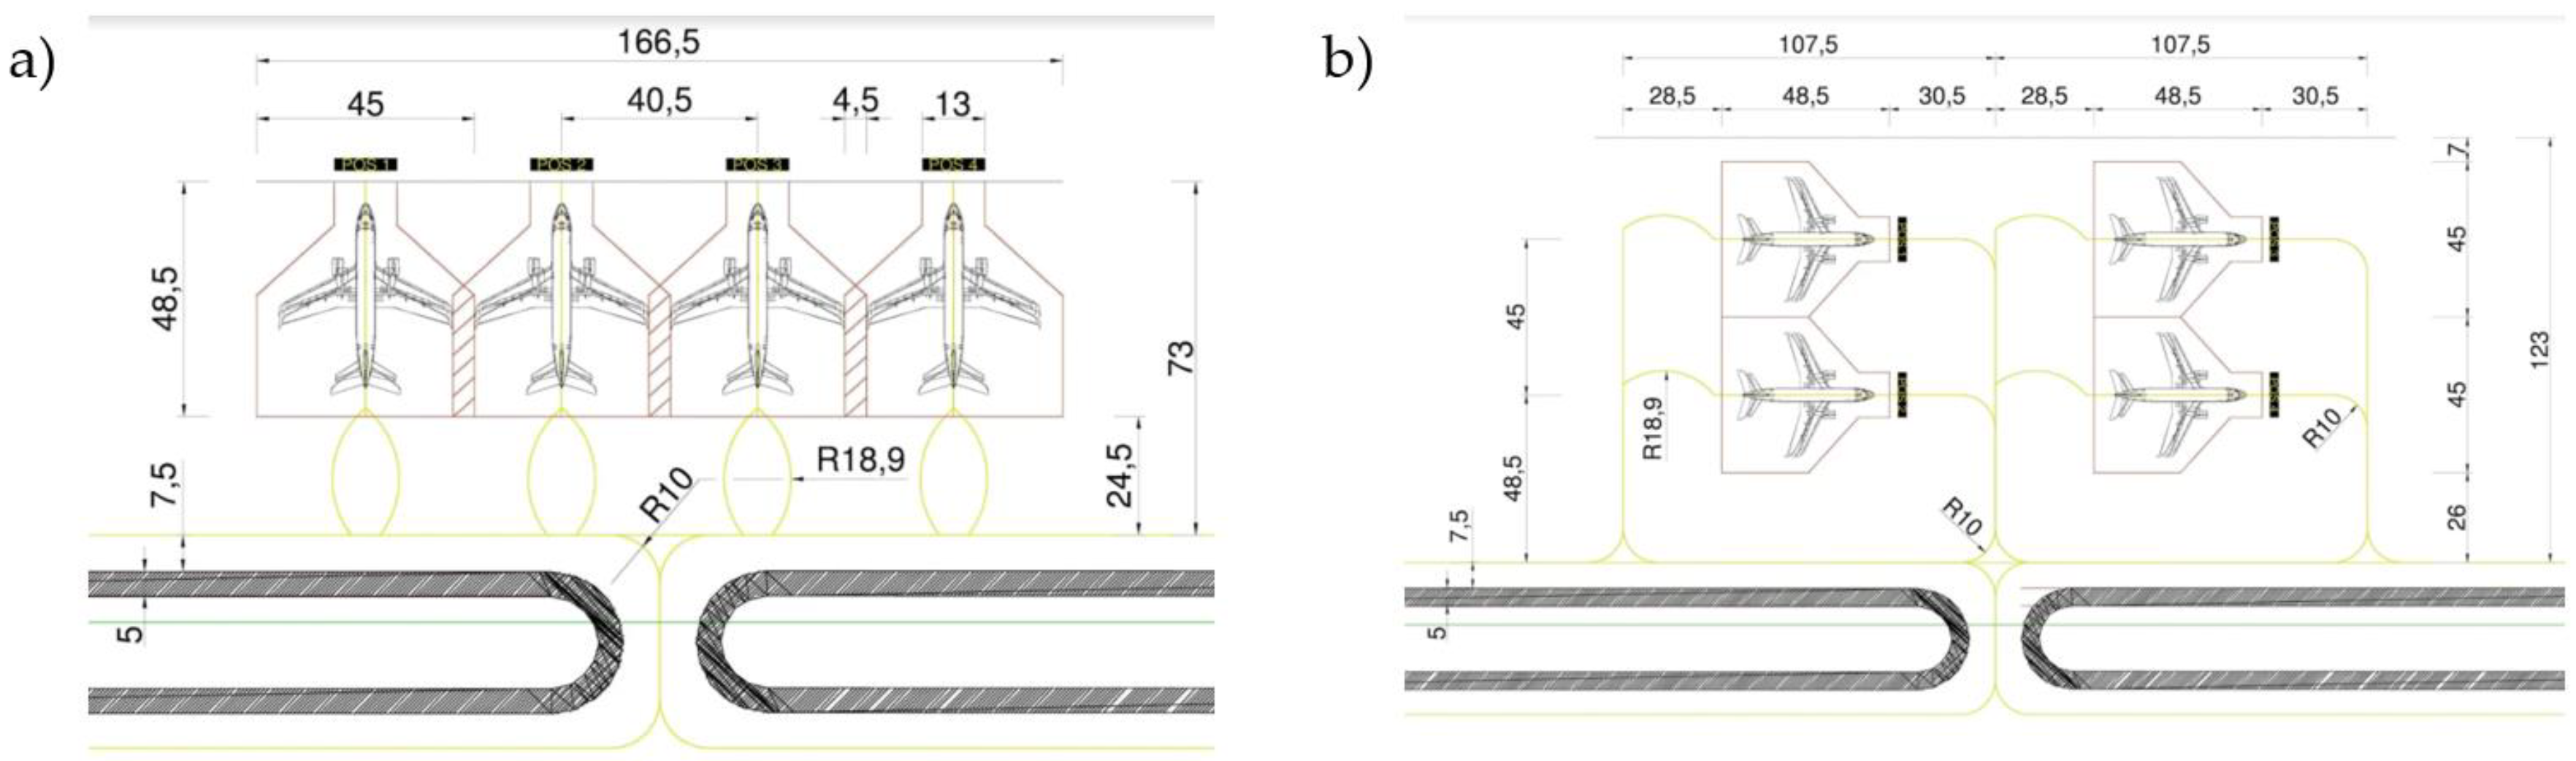
The apron area was analysed in small modules consisting of four parking positions even though, in Model A, the apron area has 16 parking positions. This approach allows us to identify problems related to the manoeuvres that might be faced by the aircraft once it is operational thanks to the characteristics of this module representing factors that impact normal operations.
In this study, three different configurations for the apron layout were considered: parking linear nose-in (with independent and dependent margins) and the linear with parallel parking position. Based on the apron configuration, taxiing procedures to and from stands were designed.
Model B was developed to consider technical requirements such as the minimum safety margins for the taxiways and the size of the apron according to ICAO regulations. Moreover, aircraft technical limits were also considered. Simulations were carried out to identify the operational conflicts and to adjust the dimensions according to the safety conditions.
4.3.2. Characteristics of the Traffic
Based on the volume of traffic and mix of aircraft used in Model A, it was possible to identify the critical aircraft with their main characteristics in terms of dimensions and performance. In this study, the aircraft considered were the A320-200 (sharklet) and B737-800 (w/winglets). In comparison with Model A, the physical characteristics of the aircraft are significant.
Regarding the number of parking gates in the apron area, in all the scenarios we considered a sub-area of four parking gates, where three of these were occupied by aircraft and one was available for a fourth aircraft to park. The simulation replicates the manoeuvre procedure of the fourth aircraft that is approaching the gate.
4.3.3. Operational Procedures
Operational procedures consider turns radius, types of turns, aircraft push-back operation, speed and engine-thrust configuration, because these are key for evaluating the operations at the apron level based on the experience of the authors.
In all cases, the turn radius and the types of turns (anticipated, exact or past) are defined in accordance with the performance of each aircraft. The main requirement for the aircraft in the parking procedure is that it must be aligned with the central axis of its respective parking position. The following procedures were also considered.
For the scenario with push-back trucks (nose-in configuration):
- the taxiing manoeuvres are made in an autonomous way, with the engines in the slow-speed regime;
- the taxiing-out manoeuvres are made with a push-back truck until the aircraft is aligned with the apron stand taxi lane.
For the scenario with linear configuration with parking positions in parallel:
- the taxiing manoeuvres towards the parking positions are made in an autonomous way with the engines in the slow-speed regime;
- the taxiing-out manoeuvres are made in an autonomous way, with the engines in start-up mode for the first 10 m and then in the slow-speed regime for the remainder of the manoeuvre.
4.3.4. Assumptions
The following assumptions are considered for the development of the model:
- For jet engines, the critical admissible speed in the area of manoeuvres is 56 km/h as advised by ICAO. The aircraft considered in the study were the B737-800 (w/winglets) and the A320-200 (sharklet).
- The scenarios at the apron that do not include the jet in the analysis allow the apron dimension to be minimized.
- The operation with the engine jet assumes that the apron dimension will be bigger in order to minimize potential conflicts.
5. Experimental Design and Results
The experimental design was developed based on configurations considered in public information available about the Schiphol group. Table 1 and Table 2 illustrate the different scenarios that were analysed for the two models.
After verifying the models, several replications were performed for Model A and Model B. The main objective at this stage was to identify the potential problems or conflicts that might arise and to gain an insight into the operation performance; thus, special attention was given to the TATs and the delay.
5.1. Results
5.1.1. Model A
After running the models, some of the most relevant results obtained can be summarized in Table 3. For the following results we used 8 sets of vehicles (in total, 64 vehicles) to perform the TAT.
The results indicate that the center–out parking allocation has the least TAT, sometimes having a minimum of 27 min and with a minimum delay of 2.17 min on average. However, the operation with the smallest variability in terms of TAT is centre–out with linear nose-in; and in terms of delay, the parallel parking position is that with minimum variability according to the half width indicator.
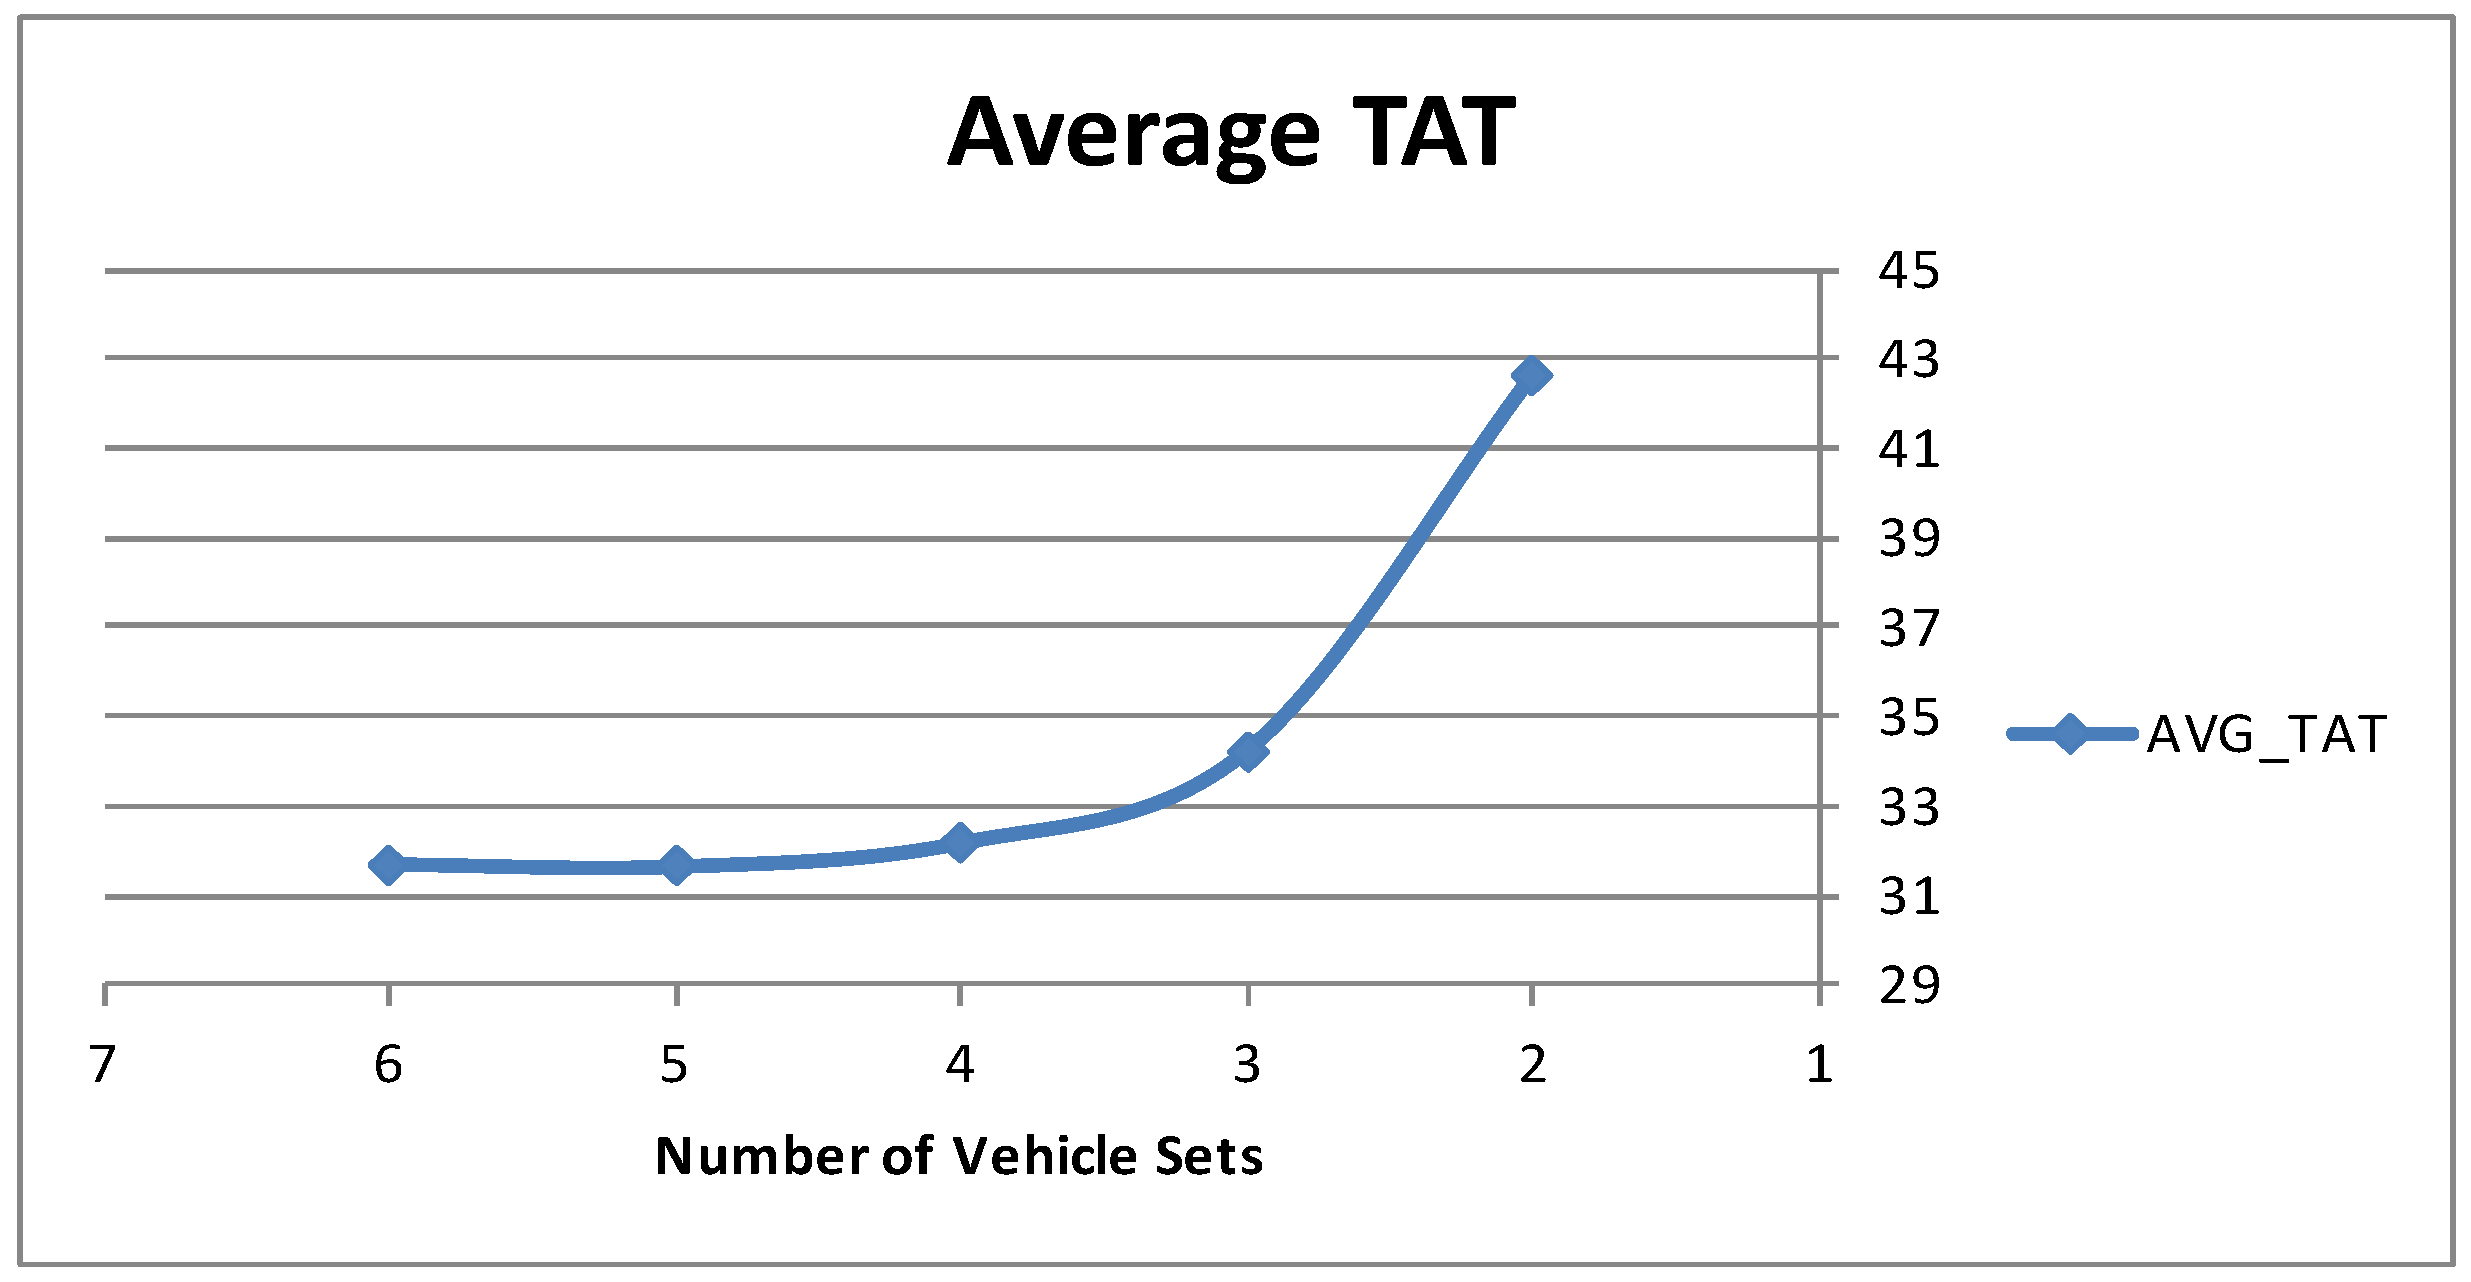
Besides turnaround time, performing the experiments enabled us to evaluate the number of vehicles required for a smooth operation and the turning point when the behaviour became unstable (exponential delay). Figure 11 provides an example of the configuration with parallel parking positions in which approximately 3 or 4 sets of vehicles (8 vehicles per set) is the threshold for this behaviour.
In the figure, it can be appreciated that the system is able to manage the operation with 4 sets of vehicles (32 vehicles) giving an average total gate time of less than 33 min.
5.1.2. Model B
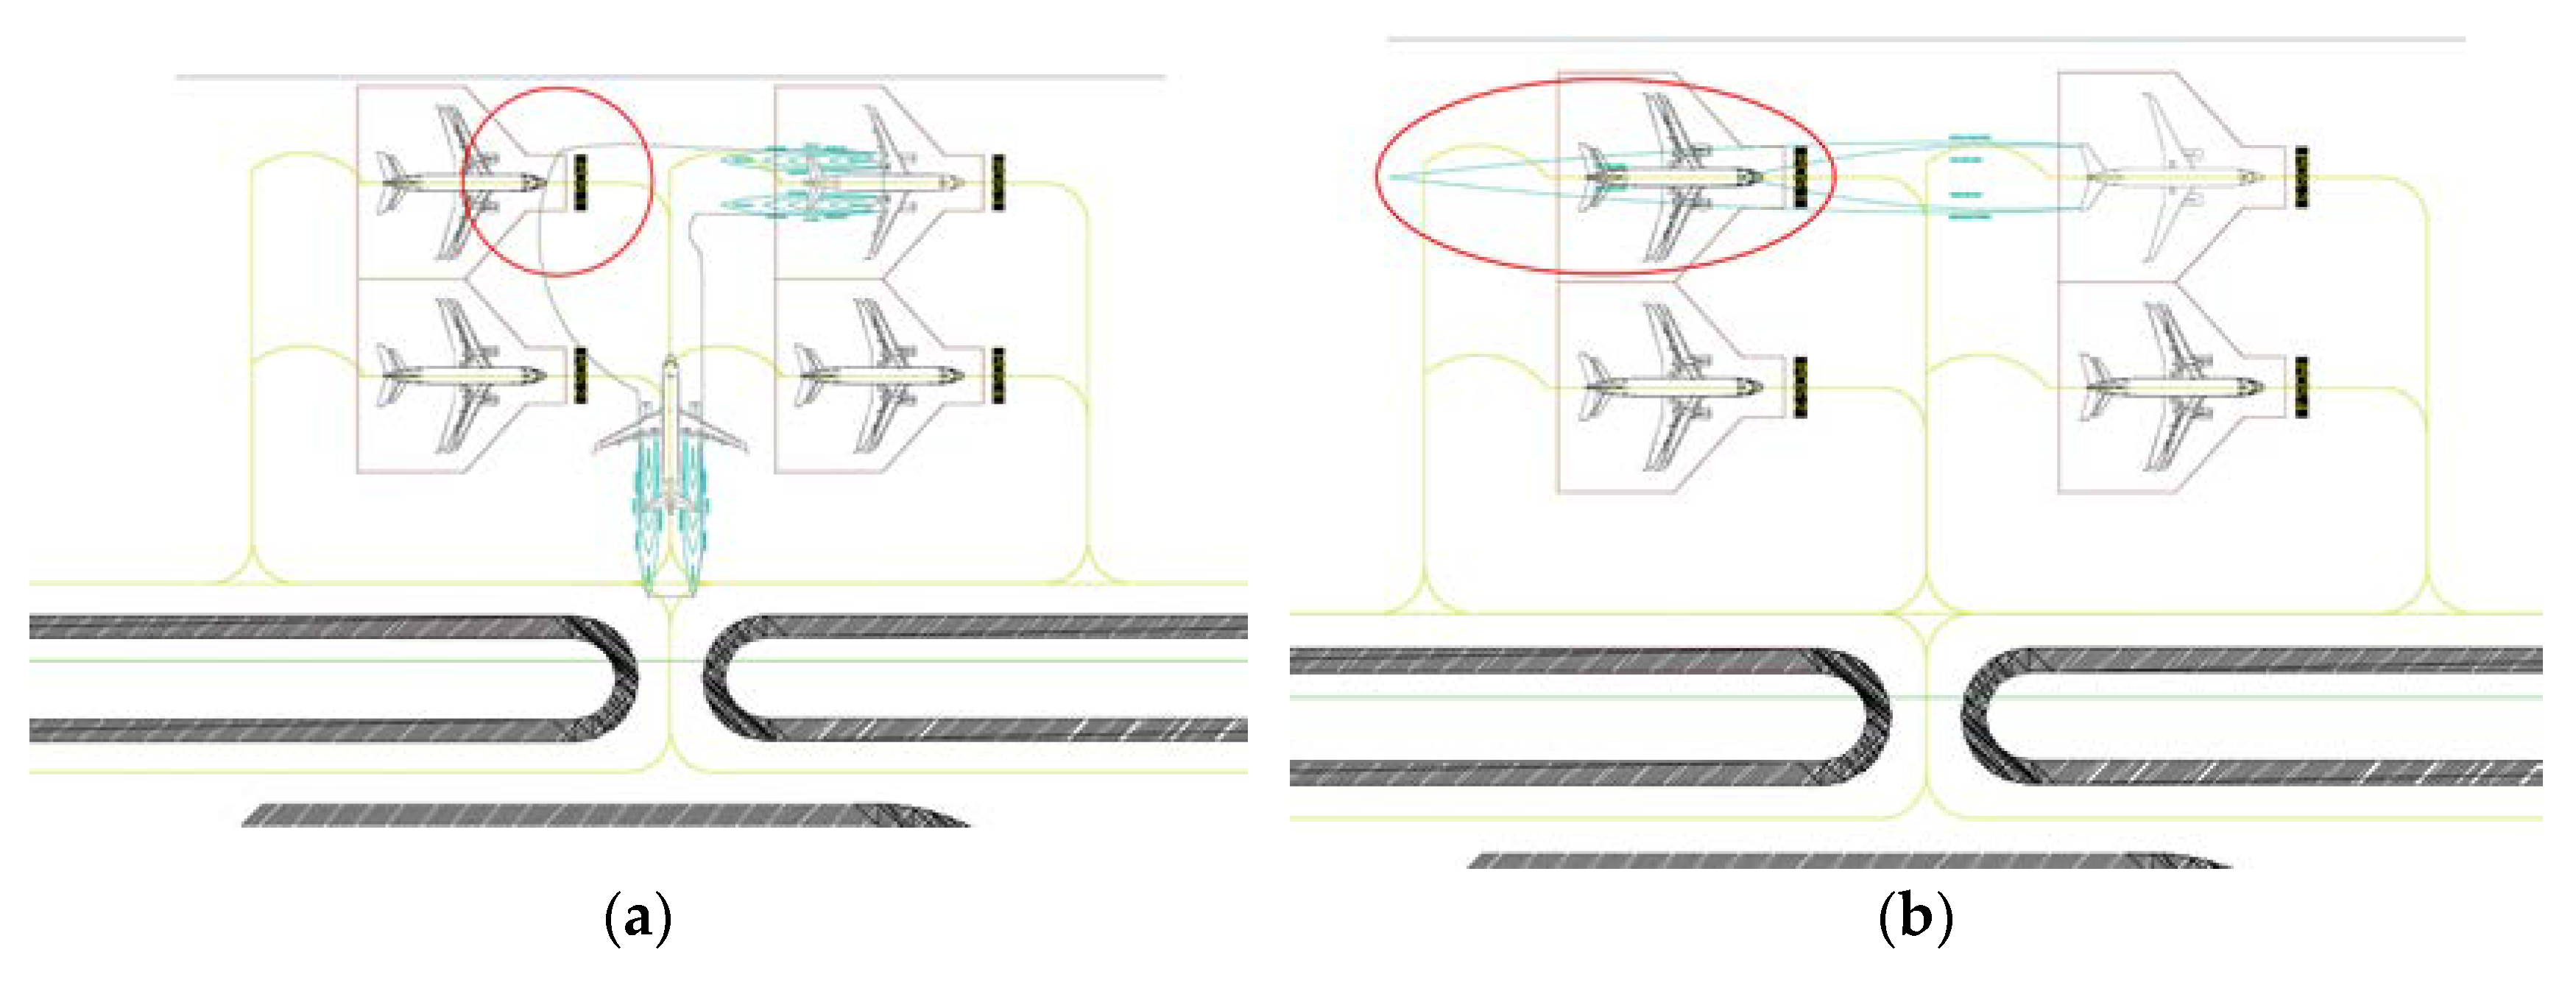
We were able to identify potential conflicts, such as those illustrated in Figure 12, which partially determined the optimum size of the apron.
Taking into consideration all these factors (minimum distances according to regulations, manoeuvres, turns radius and jet blast), we could define the required characteristics of the apron in order to avoid those situations. Table 4 summarizes the results obtained from the simulation of the linear nose-in configuration.
Table 5 summarizes the requirements for the linear configuration with parallel parking positions. In this configuration, the minimum distances need to be adjusted for the engine jets to avoid interaction between the different parking positions.
As can be seen in Table 5, the study reveals that by using this configuration the aircraft can perform the operation with their own engines; however, the impact on the size of the apron is significant. The area of the apron that needs to be selected should allow the use of the B-737s and A320s, which in this case is the biggest of 47,601 m2 (for four positions).
6. Conclusions and Future Work
In this work, we have introduced a model-based virtual circle methodology for analysing the performance of airports. The methodology is illustrated by an example where the authors use two simulation models with two different levels of abstraction. In Model A, which is more tactical, we provide high-level input such as the expected traffic, the lay-out of different apron configurations, and the expected number of ground-handling vehicles. With Model A, we gained an initial insight into the operational performance indicators without focusing on low-level interactions. On the other hand, Model B differs in its level of abstraction. This model is low-level, and we analysed the interactions of the different aircraft at the apron taking into consideration the physical characteristics of the expected traffic. We were able to raise other potential conflicts not revealed by Model A and we came up with the initial requirements of the apron size which depends directly on the configuration and expected traffic.
The analysis also illuminates different issues that might arise in the development of the new airport. In the case of Model A, there are configurations in which it is possible to obtain short turnaround times; and other configurations tested by the authors [13] result in being more inefficient. On the other hand, when we performed the analysis of operations at the apron with Model B, different issues were raised. The dimension of the apron is drastically affected by the configuration of the apron and the type of aircraft used. Because the engine jet from the B-737 is more powerful, this affects the area required for maintaining 4 parking positions and has a significant effect on the size of the apron (and the cost of construction). After applying the methodology for the first iteration, we were able to gain insights into the requirements, issues and potential performance indicators. This was done by analysing public information about the airport.
The second iteration includes in Model A the results of Model B: it adds the dimension of the apron, increases detail on the turns, and verifies the impact of the nose-in configuration in the case of the independent and dependent margins. After updating Model A with the new results, it will be the turn of Model B, and so on.
By using this approach, planners can reduce the risk of over-dimensioning or not fulfilling demand posed by expected traffic. Furthermore, its use will be useful for avoiding potential failure in investments in expansion projects or in the development of a new airport or similar infrastructure. The authors strongly encourage the use of this methodology, or at least the use of simulation in one of the planning phases of critical infrastructure such as airports.
In future work, the authors will apply a second iteration of the methodology as it has been described above. In addition, other operations will be included in the models, such as de-icing operations, maintenance, low-visibility conditions, snow or the use of aircraft with dense seating configurations which were not considered in this study and might have a significant impact on the design of the apron. The implementation of those variations can take place in both models or in just one of them. Finally, we will incorporate the economic variable and landside operations to the cycle, since these might be relevant to the feasibility of the future operation of the airport.
Acknowledgments
The authors would like to thank the Aviation Academy of the University of Applied Sciences for supporting this study and the Dutch Benelux Simulation Society (www.dutchbss.org) and EUROSIM for dissemination of the findings of this study.
Author Contributions
For this research Miguel Mujica Mota and Paolo Scala worked mostly on the development of model A, while Alejandro Di Bernardi and Gabriel Ramirez-Diaz focused on Model B. The four authors then interacted to formalize the virtual-cycle methodology for operational planning.
Conflicts of Interest
The authors declare no conflict of interest.
References
- EUROCONTROL. Industry Monitor; Issue N. 169; EUROCONTROL: Brussels, Belgium, 30 January 2015. [Google Scholar]
- IATA. Fact Sheet: Industry Statistics; IATA: Hong Kong, China, December 2014. [Google Scholar]
- Airport Council International. A Vision for European Aviation; ITM Publishing Services: Brussels, Belgium, 2005. [Google Scholar]
- Becu, N.; Bousquet, F.; Barretau, O.; Perez, P.; Walker, A. A Methodology for Eliciting and Modelling Stakeholders’ Representations with Agent Based Modelling; Multi-Agent-Based Simulation 3. MABS2003. Lecture Notes in Computer Science; Hales, D., Edmonds, B., Norlina, E., Touchier, J., Eds.; Springer: Berlin/Heidelberg, Germany, 2003; Volume 2927, pp. 131–148. ISBN 978-3-540-20736-8. [Google Scholar]
- Mujica, M.; Flores, I. Revisiting the Flaws and Pitfalls using Simulation in the Analysis of Aviation Capacity Problems. Case Stud. Transp. Policy 2018. [Google Scholar] [CrossRef]
- Adacher, L.; Flamini, M.; Romano, E. A model to optimize the airport terminal departure operations. Transp. Res. Proced. 2017, 27, 53–60. [Google Scholar] [CrossRef]
- Chen, C.; Schonfeld, P. Uncertainty Analysis for Flexible Airport Gate Development. Proced. Soc. Behav. Sci. 2013, 96, 2953–3961. [Google Scholar] [CrossRef]
- Hamzah, S.; Adisasmita, S.A. Aircraft parking stands: Proposed model for Indonesian airports. Proced. Environ. Sci. 2015, 28, 324–329. [Google Scholar] [CrossRef]
- Sun, Y.; Schonfeld, P. Stochastic capacity expansion models for airport facilities. Transp. Res. Part B 2015, 80, 1–18. [Google Scholar] [CrossRef]
- Martinez, J.; Trani, A.; Ioannou, P. Modelling Airside Airport Operations Using General-Purpose, Activity-Based, discrete-Event Simulation Tools. Transp. Res. Rec. J. Transp. Res. Board 2011, 1744, 65–71. [Google Scholar] [CrossRef]
- Khoury, H.M.; Ramat, V.R.; Ioannou, P.G. Evaluation of General-purpose Construction Simulation and Visualization tools for Modeling and Animating AirSide Airport Operations. Simulation 2007, 83, 663–679. [Google Scholar] [CrossRef]
- Chen, X.; Li, J.-H.; Gao, Q. A simple process simulation model for strategic planning on the airside of an airport: A case study. J. Simul. 2015, 9, 64–72. [Google Scholar] [CrossRef]
- Mujica, M.; Boosten, G.; de Bock, N.; Jimenez, E.; Pinho de Souza, J. Simulation-Based Turnaround Evaluation for Lelystad Airport. J. Air Transp. Manag. 2017, 64, 21–32. [Google Scholar] [CrossRef]
- An, R.; Yang, X.K. Application of Simulation Technology on Airport System. Appl. Mech. Mater. 2013, 392, 936–940. [Google Scholar] [CrossRef]
- Danesi, A.; Mantecchini, L.; Paganelli, F. Long-Term and Short-Term Forecasting Techniques for Regional Airport Planning. ARPN J. Eng. Appl. Sci. 2017, 12, 739–745. [Google Scholar]
- Scala, P.; Mujica, M.; de Bock, N. A divide a conquer approach for simulating an airport system. Int. J. Simul. Proc. Model. 2016, 12, 470–484. [Google Scholar] [CrossRef]
- Mujica, M. Check-in allocation improvements through the use of a simulation–optimization approach. Transp. Res. Part A 2015, 77, 320–335. [Google Scholar] [CrossRef]
- Mujica, M.; Scala, P.; Boosten, G. Simulation-based capacity analysis for a future airport. In Proceedings of the 2014 Asia-Pacific Conference on Computer Aided System Engineering (APCASE), Bali, Indonesia, 10–12 February 2014. [Google Scholar]
- Aldres, H. Presentatie en Toelichting van de in Het MER te Ondezoeken Routevarianten. Informatiebijeenkomst voor Bewoners in de Region Gelderland/Overijssel en Bewoners van Flevoland. Available online: http://slideplayer.nl/slide/10267236/ (accessed on 13 January 2014).
- Banks, J.; Carson, J.S.; Nelson, B.; Nicol, D.M. Discrete-Even System Simulation, 5th ed.; Pearson: Westlake Village, CA, USA, 2009. [Google Scholar]
- Schiphol Magazine. Available online: http://trafficreview2014.schipholmagazines.nl/air-transport-movements.html#atmmainairlinesa (accessed on 31 March 2015).
- Schiphol Group. Ondernemingsplan Lelystad Airport. Available online: https://www.rijksoverheid.nl/documenten/rapporten/2014/04/08/ondernemingsplan-lelystad-airport (accessed on 19 April 2018).
- European Court of Auditors. EU-Founded Airport Infrastructure: Poor Value for Money; European Union: Brussels, Belgium, 2014. [Google Scholar]
- EUROCONTROL. Technical Note: “Measuring Operational ANS Performance at Airports”; Version 1.01; EUROCONTROL: Brussels, Belgium, 9 May 2011. [Google Scholar]
- SIMIO. Available online: https://www.simio.com/applications/industry-40/index.php (accessed on 19 April 2018).
- TransoftSolutions. Aeroturn 5.0. Available online: http://www.transoftsolutions2015.com/aeroturnpro (accessed on 19 April 2018).
Figure 1.
Methodology of the n-model virtual cycle approach.

Figure 2.
The multi-airport system of The Netherlands.

Figure 3.
The turnaround processes of an A320-200.

Figure 4.
The simulation-based virtual circle approach.

Figure 5.
Partial view of the linear lay out configuration: (a) nose-in, (b) parallel parking.

Figure 6.
Model A, black-box representation.

Figure 7.
Runway module.

Figure 8.
The module of the operations at the stands.

Figure 9.
Final airport model: linear with parallel parking positions and parallel taxiway.

Figure 10.
Relationship of variables and restrictions in the apron model.

Figure 11.
Average turnaround time (TAT) for parallel parking positions.

Figure 12.
Example of identified conflicting situations, (a) regarding minimum distances–manoeuvres-and-turns radius; (b) regarding jet blast.
Figure 12.
Example of identified conflicting situations, (a) regarding minimum distances–manoeuvres-and-turns radius; (b) regarding jet blast.


Table 1.
Experimental design Model A.
| Input | Description | Assumptions |
|---|---|---|
| Airside configuration | 1. Linear with nose-in apron configuration. 16 stands 2. Linear with taxi-in taxi-out apron configuration. Parallel parking stands | Scenarios created, according to [13] |
| Stand Allocation | 1. Left–right 2. Centre–out | Aircraft enter the apron area from the closest parking gate available on the left (left–right), or from the closest gate available centered with respect to the apron area (centre–out) based on the dominant runway in use. |
Table 2.
Experimental design Model B.
| Apron Configuration | Manoeuvres | Margin | Type of Aircraft | Analysis | Scenario |
|---|---|---|---|---|---|
| Linear nose | Taxi in: autonomous manoeuvre Taxi out: assisted manoeuvre with towing | dependent | A320 | no engine jet | 1 |
| with engine jet | 2 | ||||
| B737 | no engine jet | 3 | |||
| with engine jet | 4 | ||||
| independent | A320 | no engine | 5 | ||
| with engine jet | 6 | ||||
| B737 | no engine | 7 | |||
| with engine jet | 8 | ||||
| Linear w/parallel parking | Taxi in: autonomous manoeuvre Taxi out: autonomous manoeuvre | dependent | A320 | no engine | 9 |
| with engine jet | 10 | ||||
| dependent | B737 | no engine | 11 | ||
| with engine jet | 12 |
Table 3.
Experimental results Model A.
| Configuration | Performance Indicator | Statistics | ||||
|---|---|---|---|---|---|---|
| Average (minutes) | Min. (minutes) | Max. (minutes) | Half Width | |||
| Linear nose in | Left–right parking allocation | Turnaround time | 30.75 | 27.86 | 33.9 | 1.43 |
| Expected delay | 2.42 | 2.09 | 2.88 | 0.19 | ||
| Centre–out parking allocation | Turnaround time | 30.95 | 28.86 | 33.83 | 1.16 | |
| Expected delay | 3.56 | 2.13 | 7.89 | 1.45 | ||
| Linear w/parallel parking positions | Left–right parking allocation | Turnaround time | 30.40 | 27.85 | 34.19 | 1.75 |
| Expected delay | 2.18 | 1.97 | 2.50 | 0.16 | ||
| Centre–out parking allocation | Turnaround time | 29.66 | 27.31 | 33.06 | 1.37 | |
| Expected delay | 2.17 | 1.83 | 2.83 | 0.32 | ||
Table 4.
Experimental results Model B: linear nose-in configuration.
| Physical Characteristics of the Apron | Independent Margins | Dependent Margins |
|---|---|---|
| Parking position (length) | 48.5 m | 48.5 m |
| Parking position (max. width) | 45.0 m | 45.0 m |
| Separation between central axis in parking positions | 45.0 m | 40.5 m |
| Distance between the axis of the taxi entrance to the parking position and the security line | 24.5 m | 24.5 m |
| Distance between the taxiway to the parking position and the service road | 73.0 m | 73.0 m |
| Required length for the parking positions (total width) | 180.0 m | 166.5 m |
| Approx. apron area (4 positions) | 13,140 m2 | 12,154 m2 |
Table 5.
Experimental results Model B: linear with parallel parking positions.
| Physical Characteristics of the Apron | Minimum Distances According to Regulations | Distances According to Modules | |
|---|---|---|---|
| A320-200 (Sharklet) | B737-800 (Winglets) | ||
| Parking positions (length) | 48.5 m | 48.5 m | 48.5 m |
| Parking positions (max. width) | 45.0 m | 45.0 m | 45.0 m |
| Separation between parking positions central axis | 45.0 m | 45.0 m | 45.0 m |
| Distances between axis of taxiway to parking positions and security lines | 24.5 m | 28.5 m | 72.5 m |
| Distance between taxiways axis in apron and security line | 26.0 m | 26.0 m | 26.0 m |
| Distance between taxiway axis in apron and service path | 118.0 m | 123.0 m | 123.0 m |
| Separation between taxiway axis towards parking positions | 97.5 m | 107.5 m | 193.5 m |
| Total length required for the parking positions (total width) | 195.0 m | 215.0 m | 387.0 m |
| Approx. apron area (4 positions) | 23,010 m2 | 26,445 m2 | 47,601 m2 |
© 2018 by the authors. Licensee MDPI, Basel, Switzerland. This article is an open access article distributed under the terms and conditions of the Creative Commons Attribution (CC BY) license (http://creativecommons.org/licenses/by/4.0/).
Share and Cite
MDPI and ACS Style
Mota, M.M.; Di Bernardi, A.; Scala, P.; Ramirez-Diaz, G. Simulation-Based Virtual Cycle for Multi-Level Airport Analysis. Aerospace 2018, 5, 44. https://doi.org/10.3390/aerospace5020044
AMA Style
Mota MM, Di Bernardi A, Scala P, Ramirez-Diaz G. Simulation-Based Virtual Cycle for Multi-Level Airport Analysis. Aerospace. 2018; 5(2):44. https://doi.org/10.3390/aerospace5020044
Chicago/Turabian StyleMota, Miguel Mujica, Alejandro Di Bernardi, Paolo Scala, and Gabriel Ramirez-Diaz. 2018. "Simulation-Based Virtual Cycle for Multi-Level Airport Analysis" Aerospace 5, no. 2: 44. https://doi.org/10.3390/aerospace5020044
Note that from the first issue of 2016, this journal uses article numbers instead of page numbers. See further details here.