Abstract
The VisionCube is a 2-unit CubeSat developed in house, of which the primary mission is detecting the occurrence of transient luminous events (TLEs) in the upper atmosphere and obtaining corresponding images from a low Earth orbit. An onboard TLE observation system of the VisionCube CubeSat is designed and developed by incorporating a photon-sensitive multi-anode photon-multiplier tube (MaPMT) and an image sensor. Also, a distinctive TLE observation software which enables detection of the TLEs and capture of images in a timely manner is devised. By taking into account the limited resources of a small CubeSat in size and power, the onboard observation system is developed employing a system-on-chip device by which both hardware and software can be integrated seamlessly. The purpose of this study is to investigate the functionality of the hardware and the validity of the software algorithm to show that the onboard system will function properly with no human intervention during the operations in space. To this end, a ground simulation facility is constructed to emulate TLEs occurring in space using a set of ultraviolet light-emitting diodes (UV LEDs) inside a darkbox. Based on the analysis of the spectral and temporal properties of the TLEs, the randomly generated UV LED pulses are chosen for verification scenarios for the TLE observation system. The validation results show that the hardware and the software algorithm of the onboard observation systems can effectively detect the TLEs and obtain the images during the in-orbit operation.
1. Introduction
Transient luminous events (TLEs) are a result of electrical discharge phenomena that occur in the upper atmosphere. Since the first TLE recording, accidently captured in the year 1989 [1], researchers have made various efforts to observe TLEs on a variety of platforms such as ground-based facilities [2,3,4], aircrafts [4,5,6], space shuttles [7,8], satellites [9,10,11], and the International Space Station [12,13]. From these studies, TLEs are categorized into five groups such as sprite, blue jet, halo, elf, and gigantic jet. Figure 1 illustrates the different types of TLEs. Sprites are large-scale TLEs that typically occur in the upper stratosphere and mesosphere regions (altitude of 40 to 90 km) and move rapidly downwards at speeds of up to 10,000 km/s [14]. It resembles a reddish-orange colored carrot with tendrils below. Sprites sometimes accompany halos which are quick extending glows with diameters of 40 to 70 km. Elves are similar to halos but the diameter of elves is greater than 100 km while they occur in the thermosphere region (altitude of 80 to 100 km) [15]. Finally, blue jets are relatively small and slow-moving TLEs as compared to sprites. They propagate from the top of thunderclouds towards an altitude of 40 km [5,6]. Table 1 summarizes the properties of respective TLEs. Researchers have tried to understand the underlying principles of TLEs occurrence and the relevant effects by obtaining and analyzing scientific data from diverse sources. Several attempts are still underway to collect the relevant data from space [16].
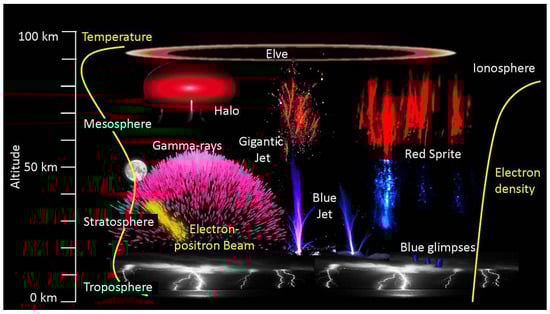
Figure 1.
Representation of transient luminous events (elf, sprite, and blue jet) [20]. Elves are flat, round TLEs and occur in the thermosphere. Sprites are large-scale TLEs that mostly appear in the mesosphere. Blue jets are relatively small TLEs compared to sprites and they occur in the stratosphere.

Table 1.
The properties of Transient Luminous Events (TLEs) [17,18,19].
A scientific platform in orbit for TLE research has advantages in many aspects: a daily global coverage, simultaneous monitoring over large-scale storm areas, and a diminished atmospheric influence on the emitted radiation [21]. In addition to these advantages in observing from the orbiting platform, using a CubeSat constellation enables multi-point simultaneous measurements over a large area of the globe, thus enabling a greater temporal coverage of the observation for short-lived events such as TLEs. References [22,23,24,25,26] present the activities employing small satellites on the purpose of Earth observation. A CubeSat is a miniaturized satellite that is specified by a multiple of single unit (1U). For a 1U CubeSat, the volume is 1 cubic cm (10 cm × 10 cm × 10 cm) and the weight is no more than 1.33 kg [27,28]. Because the CubeSat system is intended to be developed within a rather short time period at reduced cost using commercial off-the-shelf (COTS) parts [29], a small research institute or an individual research team can have a satellite constellation system for scientific purpose with a small budget as compared to conventional multi-satellite constellation.
The VisionCube is a 2U CubeSat developed by Unmanned Systems Control Lab at Korea Aerospace University, whose scientific mission aims at detecting the occurrence of TLEs in the upper atmosphere and obtaining the corresponding digital images taken with a complementary metal-oxide-semiconductor (CMOS) image sensor. The VisionCube is currently scheduled to be launched in the third quarter of 2018. The planned orbit of VisionCube is a Sun-synchronous orbit with an inclination of and an altitude of 575 km. The other orbit parameters such as the argument of perigee and right accession of the ascending node (RAAN) will be determined after VisionCube is deployed in orbit. The life span of the VisionCube is expected to be three months, carrying out the TLE observation mission. The mission requirement states that VisionCube should be able to detect TLEs at an arbitrary location, to reorient its camera towards the TLE, and to acquire the images of successive events. This is because that the repetition rate of TLEs is difficult to predict in advance. Nonetheless, it is known that TLEs occur in the upper atmosphere of the cloudy area [4], it is a possible scenario that another TLE would occur again near the initial location of occurrence. Figure 2 shows two possible scenarios of TLE detection process. When the observation system detects a TLE occurring along the nadir direction of the satellite shown in the left, the VisionCube starts locking-on to the detected TLE area by initiating attitude control. The lock-on lasts up to 40 s, waiting for another TLE occurrence in the detected area. In the second case, the detection process begins with scanning the large area by a roll maneuver of the satellite. Similar to the previous case, the VisionCube locks-on to the detected TLE area near the limb of the Earth when the TLE observation system detects a TLE occurrence. During the lock-on period, the TLE observation system would acquire the images of successive events of TLEs. Since the onboard camera is equipped with a lens of 35 field of view (FOV), the geographical coverage of the acquired image is computed by 98,736 km in the nadir direction and 301,920 km in the limb direction, respectively. The lock-on duration 40 s is empirically determined in the consideration of the speed of the VisionCube and the minimum sensitivity of the TLE observation system.
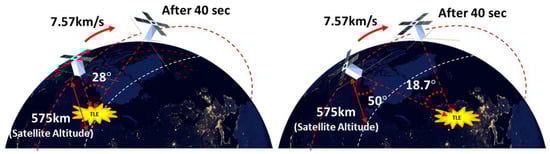
Figure 2.
Two possible mission scenarios of the VisionCube to detect TLEs. The left figure shows the case when the VisionCube looks down towards the nadir direction. In contrast, the right figure shows the case when the VisionCube extends the observation area by scanning motion via the roll maneuver.
The onboard TLE observation system is designed and manufactured by taking advantage of system-on-chip (SoC) device so that the entire system fits on a small CubeSat platform. This TLE observation system allows detection of the occurrence of TLEs in orbit on its own and then captures and stores the digital images for later ground downlink. The technical significance of the presented paper lies in the development of miniaturized satellite, which is capable of detecting TLEs and obtaining digital images at considerably lower cost. In particular, both the dedicated electronic hardware and the software to implement the TLE observation algorithm were designed and built in the university laboratory.
The paper focuses on three major aspects of the onboard TLE observation system: hardware development, TLE observation algorithm and software, and the experimental validation using the ground simulation facility, and is organized as follows: Section 2 describes the hardware design of the TLE observation system including electrical components and mechanical parts. Section 3 explains the basic algorithm for TLE observation with details about the software design of TLE observation system. In Section 4, the design of a ground experimental facility that simulates the mission environment and the validation results of the developed TLE observation system are presented. Finally, Section 5 summarizes the main results of this paper and possible future research directions will be presented.
2. Hardware of Transient Luminous Event (TLE) Observation System
2.1. Background
Under the constraints imposed by CubeSat Design Specification (CDS Rev.13), a CubeSat is limited in size, weight and power [28]. For such a CubeSat to observe a short-lived phenomenon, it requires developing compact and power-efficient hardware. Specifically, the hardware should include low-level logic to process signals from the detector and CMOS image sensor on the order of a few microseconds, as well as high-level processing unit capable of handling large amounts of data in a few seconds. Such a hardware will allow implementation of the TLE observation algorithm involving the detection of TLEs and the acquisition of digital images. By taking into account the tight design requirements of a CubeSat and the recent trend in embedded hardware design, the SoC architecture was chosen as the basis for hardware design. The SoC consists of field programmable gate array (FPGA) and embedded Nios-II softcore, so that it can implement not only low-level hardware logic for TLE detection but also high-level data handling process, efficiently.
2.2. Hardware Component
The hardware of the TLE observation system is composed of six main components: an SoC chip, a multi-anode photon-multiplier tube (MaPMT), a high voltage supply for the MaPMT, an analog-to-digital converter, a CMOS image sensor, and two synchronous dynamic random-access memories (SDRAMs) as video buffer. The SoC chip, Cyclone II SoC by Intel (Santa Clara, CA, USA) is chosen as the main processor since it has sufficient on-chip memory and user-configurable I/O pins, which can deliver high performance and low power consumption at a reduced cost.
To detect ultraviolet (UV) photon from TLEs, the Hamamatsu H7546B MaPMT [30] is adopted because of its high responsivity and sensitivity on a single UV photon. The MaPMT has a wide spectral range from 185 nm to 650 nm and a peak response at 420 nm as specified in the datasheet [31]. It will be triggered by any flash lights that exceed the threshold of the detector with similar spectral characteristic. Nonetheless, the intensity level of a UV photon due to TLEs is known to be much higher than the level of other similar phenomena [32], and the MaPMT is assumed only to detect the TLEs by capturing the UV photon derived from a TLE occurrence. Furthermore, as shown in Figure 3, the MaPMT is a 2-dimensional (2D) sensor providing continuous UV intensity information of 64 cells arranged in an 8 × 8 array. A pin-hole lens with an aperture of 300 m is utilized to get focused over the specified field of view (FOV). The aperture of the pin-hole lens is selected to allow sufficient photons to pass through. In Section 4, an analysis on the number of UV photon arriving at the MaPMT taking into account the size of aperture of the pin-hole lens is discussed. Because the output of the MaPMT is the 64 channels of analog current signal, an external analog-to-digital converter is required to obtain digital data. The sensitivity of the MaPMT output can be configured externally by adjusting the negative supply voltage to the MaPMT. Since the main power supply of VisionCube is relatively low voltage, a DC to high-voltage DC converter unit Q10N by XP Power (Singapore) is used to supply the variable voltage down to negative 1000 V. The output of the high-voltage converter is directly proportional to the analog command input provided by an external digital-to-analog converter (DAC) in order to set the sensitivity level of the MaPMT.
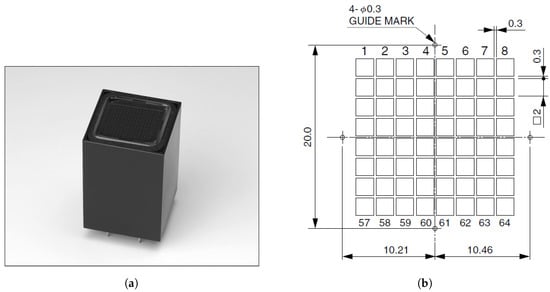
Figure 3.
Multi-anode photon-multiplier tube (MaPMT) by Hamamatsu. (a) H7546B MaPMT [30]; (b) Sensing plane containing 8 × 8 anode array.
The DDC264 [33] is a 64-channel, current-input analog-to-digital converter from Texas Instruments (Dallas, TX, USA), which provides simple and reliable conversion of consecutive channels in a small form factor. Because the DDC264 uses the dual switched integrator front-end at each channel, continuous current integration is possible without charge leakage. The integration times can be adjusted ranging from 160 s to 1 s, enabling currents from femto-amperes to micro-amperes being continuously measured with outstanding precision [33].
As the mission requirements of VisionCube is to acquire an image of a TLE occurrence, a CMOS image sensor MT9P031 from ON Semiconductor (Phoenix, AZ, USA) is chosen to capture the digital images of TLEs. The imager is an 1/2.5-inch image sensor with an active 5 Mega pixel array of 2592 H × 1944 V. Besides the merit of size, cost, and integration advantages, the CMOS sensor achieves CCD image quality in terms of signal-to-noise ratio and low-light sensitivity at the maximum pixel rate of 96 MHz [34], which allows the frame rate of gray-scale VGA images (640 × 480 px) to be up to 40 frames per second (fps). The spectral response of this sensor is specified from 350 nm to 1050 nm. However, because the spectral response of blue pixels of the imager has a common response from 350 nm to 550 nm with the MaPMT, the TLE observation system is designed only to collect the blue pixels for a clear distinction of TLEs. Finally, the system has two SDRAMs, one with 512 Mbit and the other with 64 Mbit. The 512 Mbit SDRAM is used by the Nios-II softcore as system memory and the 64 Mbit SDRAM is utilized as buffer memory for the image processing software.
2.3. Board Configuration
The TLE observation system communicates with the command and data handling system (C&DHS) via an RS-422 universal asynchronous receiver/transmitter (UART) interface. For compatibility with the electrical interface standards for bus interconnection between all modules in the VisionCube, the TLE observation board has a PC/104 stack-up connector. The board is powered by 3.3 V and 5 V supply voltage provided via the PC/104 connector. The simplified board configuration for the TLE observation system is shown in Figure 4. It has an extra 10 pin header for programming the SoC configuration data to a flash memory device EPCS16. The CMOS image sensor is configured via I2C (inter-integrated circuit) serial bus from the FPGA logic to set the effective pixel area, exposure time, gain, and other parameters. The detailed hardware specifications are summarized in Table 2.
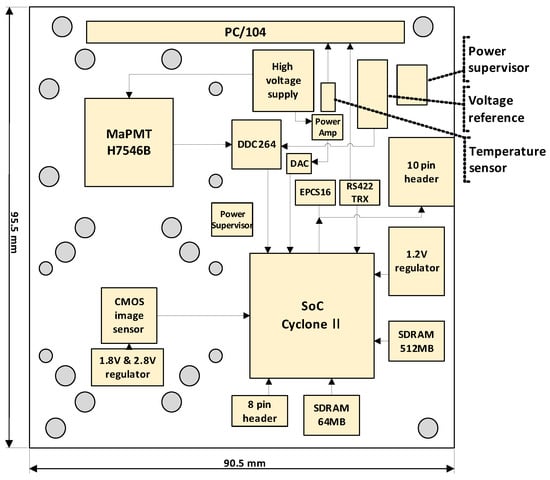
Figure 4.
Board configuration of TLE observation system. It is composed of six main components: an SoC chip, an MaPMT, a high voltage supply, a DDC264 analog-to-digital converter, CMOS image sensor, and two SDRAMs.
Table 2.
Hardware Specification Summary of the TLE Observation System.
Figure 5 shows the 8-layer printed circuit board (PCB) artwork design for fabrication. The size of the board is 90.5 mm × 95.5 mm, which is specified by the CubeSat electrical board standard. The MaPMT and the CMOS image sensor are carefully placed in consideration of the mechanical design of lens adapter and housing fixture. The trace wire from the DDC264 is directly connected to the MaPMT while minimizing its lengths to prevent signal pollution.
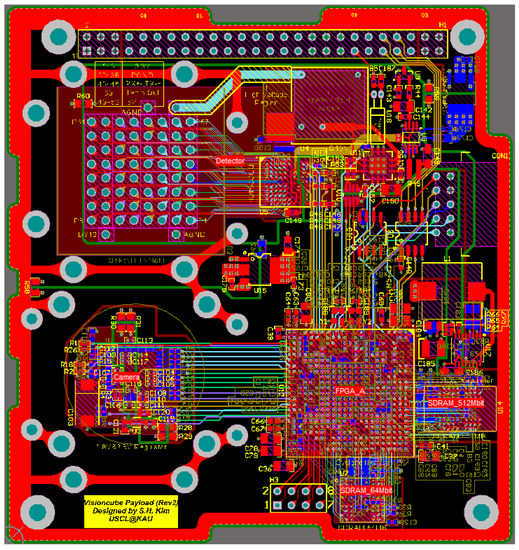
Figure 5.
Design of PCB artwork of the TLE observation system.
2.4. Mechanical Design
For the CMOS image sensor, the ruggedized fixed-focal length lens LM8JCM-V by Kowa (Nagoya, Japan) is selected for optics. Considering the size of CMOS image sensor (1/2.5-inch in diagonal), this lens can achieve a FOV 35, which is derived from the mission requirement of the TLE observation system [35]. The focal length of the Kowa lens is 8 mm, thus an additional C-mount lens holder is used to fit the lens on the board. On the other hand, a pin-hole type lens is adopted for the MaPMT. The FOV of the pin-hole lens is purposely chosen to be same as that of the image sensor. The reason for this is discussed later in this paper. Subsequently, by taking into account the height of the MaPMT, the pin-hole is rendered at a distance of 76 mm from the bottom of the board. The aperture of the pin-hole lens is designed to be 300 m based on the calculation of the number of photons which would be projected on the sensing plane of the MaPMT, as discussed in Section 4.1.1.
The mechanical design of the lens housing is shown in Figure 6. It is a box shaped fixture that has room to hold both the MaPMT and the optical lens. To minimize light reflection inside the lens housing, the aluminum fixture is anodized in matte black. Because the fixture is securely attached to the board, it can also protect the optical lens assembly from vibration and shocks, so that the structure robustness is assured. The entire TLE hardware including the PCB board and the lens housing occupies approximately the volume of 0.35U. For efficient use of the limited space of the 2U VisionCube, other modules such as the onboard battery and the attitude determination and control board are assembled by fully using the empty space next to the lens housing.
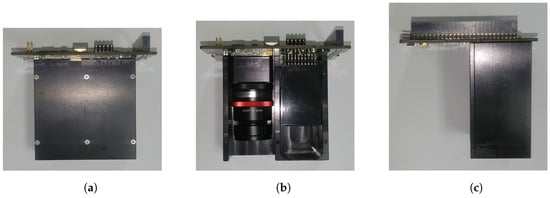
Figure 6.
Design of lens housing for TLE observation system. (a) Side view with cover; (b) Side view without cover; (c) Front view with cover.
3. The Software of TLE Observation System
3.1. TLE Detection Algorithm
In order to observe a TLE during the VisionCube mission, the onboard observation system first detects possible UV radiations originated from a TLE. The detection algorithm was designed to distinguish the TLE from other light sources by detecting short flashes around the ultraviolet band at 391.4 nm where the spectral intensity of blue jet is centered. Furthermore, it should differentiate TLEs from flash lighting using a similar method presented in [21]. In addition, the detection process involves localizing the TLE location in the image plane, as this information will be utilized to capture specific areas of the digital images from the onboard CMOS camera. This detection scheme ensures robust and reliable operation in obtaining potential images of TLE, which is an essential requirement when considering the limited onboard image processing time, onboard storage capacity for acquired images, etc. Accordingly, three discriminators are incorporated in the detection algorithm being implemented on low-level hardware logic: the temporal, energy, and spatial discriminators.
As the TLE has rather short duration, the first temporal discriminator distinguishes a pulse-type signal from DC signals that are generated by background light sources such as auroras and city lights. If the light intensity changes abruptly in a short time scale, for instance 0.3 ms, the temporal discriminator recognizes the existence of pulsed light that could be originated from a TLE source. At the same time, the energy discriminator determines the signals that only exceed the pre-specified threshold. The differential energy in a specific time span can be regarded as the radiation energy input by TLE occurrence, thus the combination of the temporal and energy discriminators can confirm whether a TLE has occurred within the field of view of the MaPMT sensor. It should be noted that the combination of these two discriminators can also distinguish the TLE from flash lighting, because the TLE has much more energy than flash lighting. Figure 7 illustrates the operation of these discriminators, as the radiant power is assumed to be injected on the 54th cell out of 8 × 8 cells of the MaPMT. The current output of the MaPMT is sampled by the DDC264 at every fixed period of 166 s. Each MaPMT frame is constructed by averaging two successive samples of the MaPMT to mitigate noisy measurements. Subsequently, two consecutive MaPMT frames at and are continuously compared by the temporal discriminator to discover a change over time. It follows that the energy discriminator checks the energy differential exceeds the predetermined threshold.
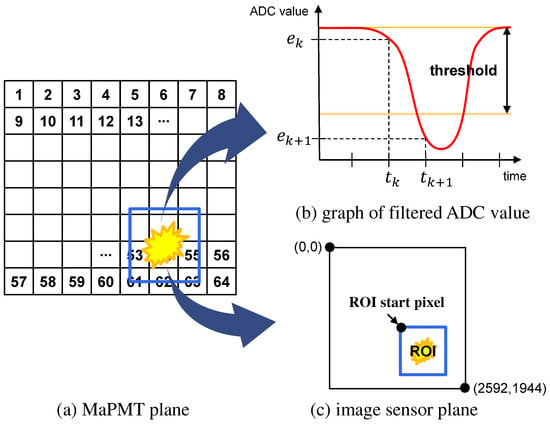
Figure 7.
Three discriminators for TLE detection algorithm. (a) Potential radiant power by a TLE is assumed to be injected on the 54th cell of the MaPMT. (b) Comparison of two consecutive samples of the filtered ADC values by the temporal and energy discriminators confirms that the radiant power is originated from TLE. (c) The information from the spatial discriminator is used to set the region of interest (ROI) for the image acquisition purpose.
The spatial discriminator extracts the information regarding the location of the TLE in the image plane. For this purpose, recall that the MaPMT is a spatial detector that yields 64 intensity signals of incoming UV radiations at the sensing elements as shown in Figure 3b. Because the sensing elements are arranged by 8 × 8 configuration on its sensing plane, the MaPMT can provide the relative location of the TLE with respect to the sensing axis that is perpendicular to the image plane. With the 35 FOV of the pin-hole lens which is purposely chosen to be same as that of the image sensor, the MaPMT can provide the roughly estimated location of the TLE in the image plane. Also the difference of intensity values between adjacent cells will provide additional information of the TLE occurrence. This gradient values along the horizontal and vertical direction in the image plane are also compared with the predetermined threshold to confirm the location of the TLE. Finally, the estimated location determines the region of interest (ROI) so that the onboard CMOS camera only captures images over the ROI, which allows efficient memory usage of the onboard TLE observation system.
3.2. System Operation
The operational scenarios of the VisionCube have been devised to observe blue jets by taking into account the TLE’s size (up to 20 km), duration (up to 250 ms) and possible occurrence rate [5]. Figure 8 illustrates a sequence of overall mission operation including the transaction activity between C&DHS.
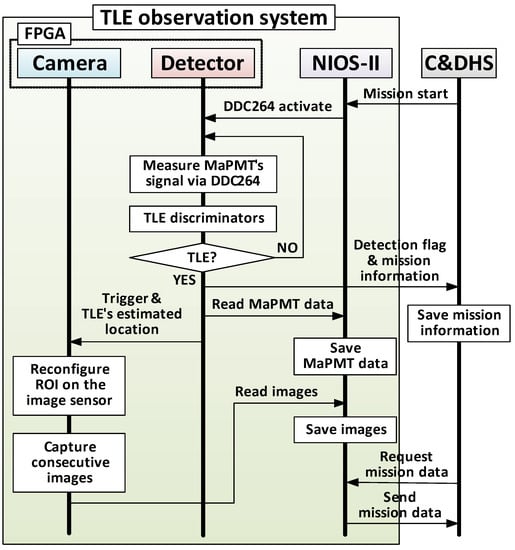
Figure 8.
Operation sequence of TLE observation system. The TLE observation system conducts its mission independently after receiving the start command from C&DHS. The Nios-II manages the system and communicates with C&DHS.
When the mission start signal is triggered by the C&DHS, the Nios-II initiates the detection process by enabling digitization of the signals from MaPMT. The DDC264 integrates the current outputs of the MaPMT and digitizes them at the sampling rate of 6 MHz, providing the digital data to the discriminators continuously. Three discriminators described in Section 3.1 are written in Verilog-HDL (hardware description language) to determine whether the sampled signals represent the TLE existence within the FOV, and if that is the case, the location of the TLE on the MaPMT’s sensing plane is estimated. It should be noted that the DDC264 measures signal uninterrupted until a TLE is detected, while the temporal and energy discriminators continues to check the signals from the MaPMT. As a voting logic consisting of three discriminators decides the detection of TLE, the camera IP (intellectual property) logic is triggered by the detector system with the estimated location of the TLE. Because the 8 × 8 cell array of the MaPMT is associated with the CMOS sensor pixel array (2592 × 1944 px) by a lookup table, the image data on the CMOS sensor can be partially read over the ROI to the onboard SDRAM buffer memory. This feature allows consecutive acquisition of as many frames of TLE images at the reduced size (640 × 480 px), albeit the limited availability of onboard memory. In the meantime, the Nios-II reads the digitized data of the MaPMT’s 64 channels as the mission log data. Note that the Nios-II also raises a flag to the C&DHS in order to request the mission information, which includes the mission identification number, UTC time, and the GPS position of the VisionCube, etc. The mission information is merged with the data generated by the detector and camera subsystem to create a time-stamped mission log files. Taking into account the limited data capability of downlink channel, the data collected per event are chosen to be three gray-scale images in VGA format, 128 frames of MaPMT data, and a mission status file, of which the data volumes are 921.6 KBytes, 20.48 KBytes, and 40 bytes, respectively. After being requested by the C&DHS, the TLE observation system sends the collected mission log files. The C&DHS stores the mission log files on the flash memory and transmits them to the ground station whenever the ground communication is ready. Because the capacity of downlink communication is approximately 340 KBytes per a single access, three or four access will be required to downlink the entire mission data of a single event.
3.3. Software Modules
The software modules of the TLE observation algorithm consist of the low-level hardware IP cores and the high-level management module. Two main hardware IP cores are the detector IP core and the camera IP core, written in Verilog-HDL for the sake of low latency and fast processing speed. The detector IP core implements three discriminators for TLE detection, based on the MaPMT data retrieved from the DDC264 controller IP. It should be emphasized that the analog-to-digital conversion process by the DDC264 controller IP is synchronized with a single start conversion signal, thus the 64 channels data exhibit concurrent event for 8 × 8 cells of the MaPMT. The detector IP core stores the MaPMT’s 64 cell data on an on-chip FIFO memory uninterruptedly. When an event is detected by the discriminators, a data packet of 128 consecutive frames are extracted from the FIFO memory for being sent to the Nios-II softcore as the mission log data. At the same time, the detector IP core triggers the camera IP core for acquisition of image pixels over the ROI of the estimated location of the TLE event. As a result, the camera IP starts to transfer images pixels to the 64 Mb SDRAM memory so that a total of twenty five successive images at 40 fps are stored in the memory. Finally, it follows that the camera IP raises an interrupt flag to the Nios-II softcore to notify that a cycle of mission operation is completed. Figure 9 shows the details of command and data flow between the software modules.
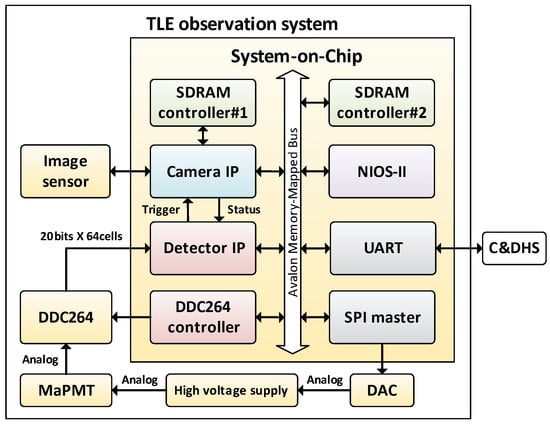
Figure 9.
Data flow diagram of TLE observation system. Hardware IPs on the SoC interacts each other via Avalon Memory-Mapped Bus. Embedded software is implemented on the Nios-II to manipulate the mission data from low-level hardware IPs.
Next, the high-level data processing software modules are implemented on the Nios-II softcore. The Nios-II exchanges commands and data with the C&DHS via the UART serial link. Upon receiving mission-related commands from the C&DHS, the Nios-II softcore manages the TLE observation system by starting or stopping both the detector IP and the camera IP. At the end of the data collection session, the Nios-II softcore retrieves the obtained TLE images in conjunction with the MaPMT cell data to pack in a binary format with the collected mission log information such as the status of detector, the number of TLE detection, and the estimated location of the TLE. In addition, the Nios-II softcore controls the output of the high voltage supply to adjust the gain of the MaPMT by utilizing the 16-bit SPI (serial peripheral interface) bus which is connected to an external DAC.
4. Experimental Validation
4.1. Ground Simulation Facility
In order to validate the functionality and performances of the TLE observation system, a ground experimental facility that simulates the mission environment of the low Earth orbit is developed. The key consideration in building the ground simulation facility is choosing a flash UV source that has similar spectral properties to the actual TLE. This can be justified by the amount of current output by the MaPMT detector, as it generates electric charges proportional to the number of photons arrived at its sensing area. In this respect, it is necessary to calculate the number of electrons that will be produced by the MaPMT due to the injected photons. Subsequently, the strength of the imitating TLE source that yields the equivalent amount of electric charges is determined.
4.1.1. Electron Counts Generated by TLE
The TLE observation system is aimed at observing blue jets in the upper atmosphere. A blue jet is assumed to occur at an altitude of and generates a total of photons during the T duration time [17,36]. If the VisionCube orbits at an altitude of over the blue jet, the effective number of electrons that is produced by the photomultiplier during the sampling period of is calculated in Equation (1).
where is the quantum efficiency of the MaPMT at the wavelength of 405 nm. Using the parameters shown in Table 3, the maximum number of electrons generated by the MaPMT is approximately when a blue jet occurs along the nadir direction at the closest distance of 535 km. On the other hand, considering the case where the TLE observation system detects blue jets near the limb of the Earth as depicted in Figure 10, the distance between the TLE and the VisionCube is computed as = 2674 km by trigonometry. In this case, the effective electrons from the MaPMT is dramatically reduced to about using instead of in Equation (1). It should be noted that the electric charge is computed by multiplying the number of electrons by the elementary electron charge in coulomb, that is, . The maximum and the minimum electric charge due to the TLEs will be utilized in the next section to determine the desired radiant power of the UV LED for the ground simulation experiments.
Table 3.
The parameters for calculation of electric charge produced by TLE emission in space.
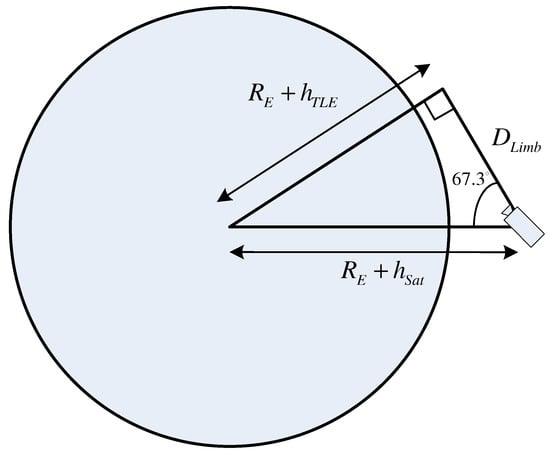
Figure 10.
Detection of TLEs near the Earth’s horizon. The line of sight angle to the TLE is computed as by simple trigonometry, which is within the observation range of the TLE observation system. The distance to the TLE is then denoted by .
4.1.2. Electric Charge Generated by UV LED
Since the dominant spectral component of blue jets is distributed over the ultraviolet band, an appropriate UV LED is chosen to imitate blue jets. Based on the characteristics of the selected UV LED, designing the ground experimental facility begins with choosing operational parameters for UV LEDs, that is, the distance between UV LED and the pin-hole lens () and the required radiant power for the UV LED (), respectively. These parameters permit the electric charge due to the UV LED to match the total electron count caused by the actual TLE as estimated in Equation (1). For this reason, the amount of electric charge output by the MaPMT due to the UV LED should be estimated first as accurate as possible. The radiant power emission of the UV LED can be obtained from the geometry relationship. The geometry of the UV LED and the detector with a pin-hole lens is illustrated in Figure 11. The circular area of the light cone at is calculated using the beam angle of the UV LED as in Equation (2).
where is the beam angle of the UV LED. Although the UV LED delivers most of the radiant power to the front, but here it is assumed that the UV LED is regarded as a point light source and emits light in three-dimensional space. Hence, the equivalent solid angle of the UV LED beam, , is determined by the ratio of the total irradiated area of a sphere at the radius of to the area of the light spot .
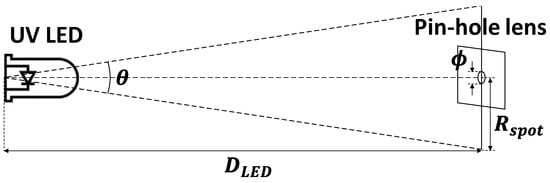
Figure 11.
Geometry of UV LED and detector in the ground simulation facility.
Note that the full solid angle is known to be . The radiant intensity, defined by radiant power emitted per unit solid angle, can be utilized to eliminate the effect of power reduction over distance. Thus by ignoring the attenuation of radiant power due to the interference of the medium, the actual radiant power received at a given distance is directly computed using the solid angle of the corresponding irradiated area. The radiant intensity of the UV LED is calculated as Equation (4),
where is the radiant power emitted by the UV LED.
The actual radiant power received by the MaPMT is due to the light passing through the pin-hole lens. The radiant power of light that passes through the pin-hole lens, denoted by , is computed using the solid angle of the pin-hole lens,
where the effective solid angle of the pin-hole lens is calculated as follows,
It follows that the radiant power received by the MaPMT is computed using Equation (2) and Equations (4)–(6),
The amount of electric charge caused by the radiant power over the sampling interval is calculated as follows,
where is a specific gain value of the MaPMT used for the ground simulation. It should be noted that the gain of the MaPMT is set to be minimum to avoid the output saturation of the MaPMT during the ground simulation. Because the electron count is converted into electric charge by multiplying the elementary electron charge in coulomb, the electric charge output of the MaPMT due to the actual TLE is derived from Equation (1) such that . Thus, in order to generate the equivalent charge due to both the actual TLE and the UV LED, the power injected to the pin-hole lens is calculated as follows,
Subsequently, from Equations (7) and (9), the desired radiant power of the UV LED is calculated as follows,
The distance between the UV LEDs and the pin-hole lens is chosen to be by taking into account the field of view angle of the TLE observation system. The detailed sizing of the experimental facility is described in Section 4.1.3. With the given parameters listed in Table 3 and , the desired power is determined by 1.22 W for the limb case and 31.7 W for the nadir case. Because the nominal radiant power of the UV LED is specified by 40 mW with the forward current of 15 mA [37], in order to achieve the specified emitting power, a current limiting resistor in the UV LED driver circuit is utilized to limit the forward current between 0.46 A and 11.9 A. As a result, when the UV LED operates with the forward current ranging from 0.46 A to 11.9 A, the UV LED in the ground simulation facility is assumed to imitate the TLE emission while enabling the MaPMT to generate the equivalent charge to the actual TLE.
4.1.3. Design of Ground Simulation Facility
The block diagram of the ground simulation setup is shown in Figure 12. There are assorted LEDs arranged by 3 × 3 array configuration on the wall of the dark box. The LEDs are driven by an external function generator to simulate TLE pulses in various amplitude and width. In particular, five 405 nm UV LEDs are employed to imitate randomly generated blue jets and the rest are used to simulate other interference sources.
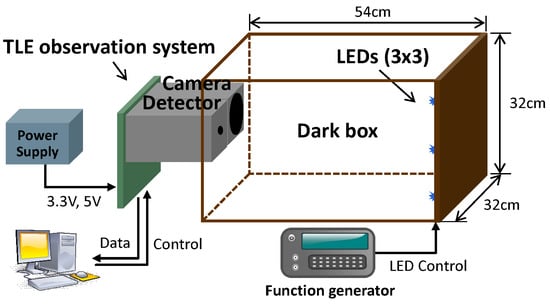
Figure 12.
Diagram of ground simulation setup. Blue jet is emulated by flashing UV LEDs in specific radiant power and duration.
The TLE observation system is installed on the other side of the dark box at the distance of 0.54 m from the UV LEDs. The size of dark box is designed by taking into account the FOV of the detector and the camera lens so that the TLE observation system can have full coverage on the wall. The function generator can adjust the pulse duration and the peak voltage so that LEDs can emit light in a specific radiant power as being calculated in Section 4.1.2. A custom graphical user interface (GUI) software is designed to allow the user to control the TLE observation system and analyze the test results. In particular, the continuous data logging capability of the GUI allows the monitoring of the MaPMT data frames. This feature overcomes the capacity limit of the on-chip memory where only the 128 frames of the MaPMT data frame can be stored at once, and enables continuous data acquisition during the ground experiments for data analysis.
4.2. Experimental Results
With the major components of the hardware logic are verified for its functionality, the actual operation of the TLE observation system was verified on the ground simulation facility. Figure 13 illustrates a scenario for this experiment. As the targeted TLE is assumed to be a blue jet, a 405 nm UV LED on the bottom left corner blinks every 1 s and is turned on for 100 ms. As soon as the detector IP senses the flash light on the 54th cell of the MaPMT, it triggers the camera IP with the corner coordinates for the ROI of which the size is predetermined by 640 by 480 px. Then the camera IP scans the internal buffer of the CMOS image sensor and only extracts the ROI pixels out of entire active image pixels.
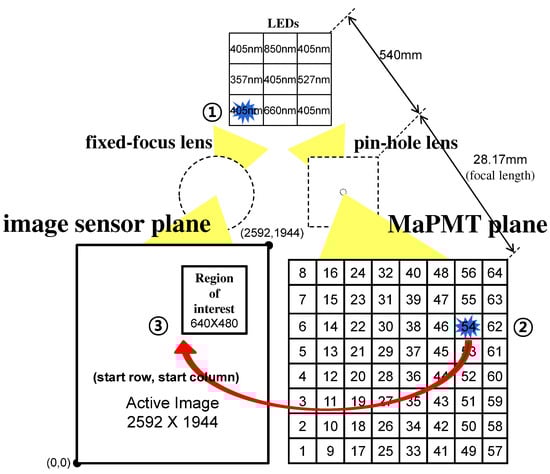
Figure 13.
Scenario of the experiment on the ground simulation facility. First, a 405 nm UV LED blinks every 1 s and is turned on for 100 ms duration to emulate a blue jet. Next, as soon as the detector IP senses the flash light, it triggers the camera IP with the estimated location of the light. Finally, the camera IP captures successive images around the ROI.
The MaPMT’s 64 cell data before and after the trigger signal are plotted in Figure 14. The graph displays the time history of the MaPMT data of the 640 successive MaPMT frames at the MaPMT frame rate of 3.012 kHz. The abrupt change of the digitized value of the 54th cell data clearly shows a pulse and its location on the MaPMT sensing plane. The y-axis value of each graph represents the electric charge output of the MaPMT during the period of 332 s. When the UV LED is off, the output value represents the amount of charge due to the dark current of each cell, which is approximately 0.0143 pC. On the other hand, during the UV LED on period, the electric charge of the 54th cell increased by about 0.057 pC, which appears to be a drop in the graph. The increased electric charge is due to the radiant power of the UV LED for TLE simulation is arbitrarily chosen between the case of the limb direction and the nadir direction, corresponding to the electric charge of 0.407 pC and 0.0157 pC, respectively. The experimental result shows that the TLE observation system can sufficiently detect TLEs occurring at very long distances. In addition, the latency of the TLE detection algorithm is experimentally confirmed by measuring the time delay between the external command signal to the UV LED and the trigger signal from the detector IP. The experimental result, as shown in Figure 15, shows that the TLE detection flag occurs 664 s after the external UV LED is commanded on. Since the TLE discriminator needs to be run on two consecutive MaPMT frames in order to determine a TLE occurrence, it can be seen that the latency of the system is twice the MaPMT frame period, which is 332 s, as described in Section 3.1.
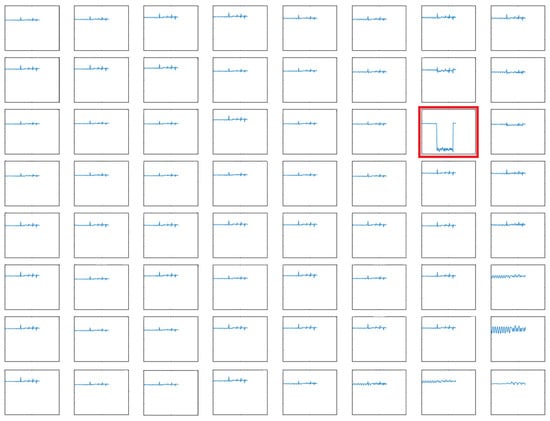
Figure 14.
Graph of MaPMT measurements for 128 frames from 1st cell (left bottom corner) to 64th cell (right top corner). x-axis is the number of frame and y-axis is ADC value. On the 54th cell (red box), the ADC value abruptly dropped as soon as receiving the flash light.
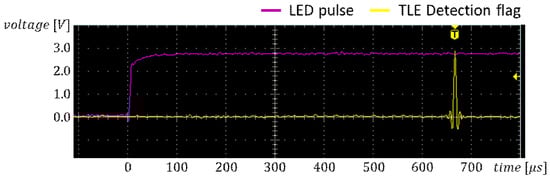
Figure 15.
Latency between the UV LED pulse and the TLE detection flag. The latency was 664 s which is caused by the TLE detection algorithm.
As soon as the image sensor reconfigured, the camera started to capture images over the LED light and stored it until the user requested the data. As shown on Figure 16, LED light was captured on the four consecutive images since the camera had the frame rate of 40 frame per second.
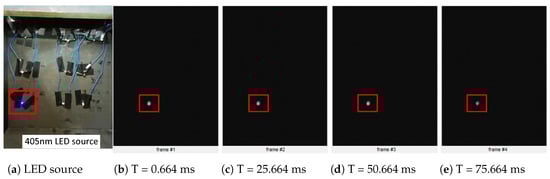
Figure 16.
Experimental results on the ground simulation facility. The TLE observation system successfully detected the 405 nm LED flash light which has the duration of 100 ms and obtained four consecutive images of it. The results also show that the camera IP only captured the pixels around the region of interest using the TLE location estimate from the detector IP.
5. Conclusions
In this paper, the design and development of the onboard TLE observation system for the CubeSat VisionCube is presented. The onboard TLE observation system consists of dedicated hardware and software so as to detect occurrence of TLEs and obtain corresponding images from the low Earth orbit. Both hardware and software are designed and developed in-house, as the main hardware components are the MaPMT and the CMOS image sensor while the software including the low-level hardware logics and data manipulation algorithms are implemented on a SoC device. This device allows both hardware and software to be integrated seamlessly into a compact form factor. In order to verify the functionality of the developed hardware and the validity of the software algorithm of the onboard TLE observation system, the experimental validation has been conducted on the ground simulation facility. The ground simulation facility was designed to imitate a TLE on the ground using a set of ultraviolet LEDs. By the similarity justification on the output of the MaPMT compared to the actual TLE, the UV LED was chosen to emulate a random flash light of TLE. Finally, the experimental results using the onboard TLE observation system on the ground simulation facility reveals that the hardware and the software algorithm can effectively detect TLEs and obtain the digital images, demonstrating the capability of the onboard TLE observation system for the in-orbit operation. The TLE observation system will be integrated into the VisionCube and will go through space environmental tests, as it is currently scheduled to be launched in the second half of 2018.
Author Contributions
Conceptualization, D.J.; Methodology, D.J.; Software, S.K., T.N.; Validation, S.K., T.N.; Formal Analysis, D.J., S.K.; Investigation, D.J.; Resources, S.K.; Data Curation, D.J.; Writing-Original Draft Preparation, S.K., T.N.; Writing-Review & Editing, D.J.; Visualization, S.K.; Supervision, D.J.; Project Administration, D.J.; Funding Acquisition, D.J.
Funding
This research was supported by the Program through the National Research Foundation of Korea (NRF) funded by the Ministry of Science and ICT (No. NRF-2017M1A3A3A02016572, Research and Development of Variable Speed Control Moment Gyroscope for Nanosatellites Attitude Control).
Conflicts of Interest
The authors declare no conflict of interest.
References
- Franz, R.C.; Nemzek, R.J.; Winckler, J.R. Television Image of a Large Upward Electrical Discharge above a Thunderstorm System. Science 1990, 249, 48. [Google Scholar] [CrossRef] [PubMed]
- Fukunishi, H.; Takahashi, Y.; Kubota, M.; Sakanoi, K.; Inan, U.S.; Lyons, W.A. Elves: Lightning-induced Transient Luminous Events in the Lower Ionosphere. Geophys. Res. Lett. 1996, 23, 2157–2160. [Google Scholar] [CrossRef]
- Su, H.T.; Hsu, R.R.; Chen, A.B.C.; Lee, Y.J.; Lee, L.C. Observation of Sprites over the Asian Continent and over Oceans around Taiwan. Geophys. Res. Lett. 2002, 29, 3-1–3-4. [Google Scholar] [CrossRef]
- Bering, E.A.; Benbrook, J.R.; Bhusal, L.; Garrett, J.A.; Paredes, A.M.; Wescott, E.M.; Moudry, D.R.; Sentman, D.D.; Stenbaek-Nielsen, H.C.; Lyons, W.A. Observations of Transient Luminous Events (TLEs) associated with Negative Cloud to Ground (-CG) Lightning Strokes. Geophys. Res. Lett. 2004, 31, L05104. [Google Scholar] [CrossRef]
- Wescott, E.M.; Sentman, D.; Osborne, D.; Hampton, D.; Heavner, M. Preliminary Results from the Sprites94 Aircraft Campaign: 2. Blue Jets. Geophys. Res. Lett. 1995, 22, 1209–1212. [Google Scholar] [CrossRef]
- Wescott, E.M.; Sentman, D.D.; Heavner, M.J.; Hampton, D.L.; Osborne, D.L.; Vaughan, O.H. Blue Starters: Brief Upward Discharges from an Intense Arkansas Thunderstorm. Geophys. Res. Lett. 1996, 23, 2153–2156. [Google Scholar] [CrossRef]
- Boeck, W.L.; Vaughan, O.H.; Blakeslee, R.J.; Vonnegut, B.; Brook, M. The Role of the Space Shuttle Videotapes in the Discovery of Sprites, Jets and Elves. J. Atmos. Sol. Terr. Phys. 1998, 60, 669–677. [Google Scholar] [CrossRef]
- Yair, Y.; Israelevich, P.; Devir, A.D.; Moalem, M.; Price, C.; Joseph, J.H.; Levin, Z.; Ziv, B.; Sternlieb, A.; Teller, A. New Observations of Sprites from the Space Shuttle. J. Geophys. Res. 2004, 109, D15201. [Google Scholar] [CrossRef]
- Chern, J.L.; Hsu, R.R.; Su, H.T.; Mende, S.B.; Fukunishi, H.; Takahashi, Y.; Lee, L.C. Global Survey of Upper Atmospheric Transient Luminous Events on the ROCSAT-2 Satellite. J. Atmos. Sol. Terr. Phys. 2003, 65, 647–659. [Google Scholar] [CrossRef]
- Blanc, E. Space Observations of Transient Luminous Events and Associated Emissions in the Upper Atmosphere above Thunderstorm Areas. C. R. Geosci. 2010, 342, 312–322. [Google Scholar] [CrossRef]
- Yoshida, K.; Takahashi, Y.; Sakamoto, Y.; Ujiie, E.; Takiuchi, K.; Nakazato, Y.; Sawakami, T.; Sakanoi, T.; Kasaba, Y.; Kondo, S.; et al. SPRITE-SAT: A Micro Satellite for Scientific Observation of Transient Luminous Events and Terrestrial Gamma-Ray Flashes. Trans. Jpn. Soc. Aeron. Space Sci. Aerosp. Technol. Jpn. 2010, 8, Tm_7–Tm_12. [Google Scholar] [CrossRef]
- Blanc, E.; Farges, T.; Roche, R.; Brebion, D.; Hua, T.; Labarthe, A.; Melnikov, V. Nadir observations of sprites from the International Space Station. J. Geophys. Res. 2004, 109. [Google Scholar] [CrossRef]
- Jehl, A.; Farges, T.; Blanc, E. Color pictures of sprites from non-dedicated observation on board the International Space Station. J. Geophys. Res. 2013, 118, 454–461. [Google Scholar] [CrossRef]
- Pasko, V.P.; Qin, J.; Celestin, S. Toward better Understanding of Sprite Streamers: Initiation, Morphology, and Polarity Asymmetry. Surv. Geophys. 2013, 34, 797–830. [Google Scholar] [CrossRef]
- Frey, H.U.; Mende, S.B.; Cummer, S.A.; Li, J.; Adachi, T.; Fukunishi, H.; Takahashi, Y.; Chen, A.B.; Hsu, R.R.; Su, H.T.; et al. Halos Generated by Negative Cloud-to-ground Lightning. Geophys. Res. Lett. 2007, 34, L18801. [Google Scholar] [CrossRef]
- Pasko, V.P.; Yair, Y.; Kuo, C.L. Lightning Related Transient Luminous Events at High Altitude in the Earth’s Atmosphere: Phenomenology, Mechanisms and Effects. Space Sci. Rev. 2012, 168, 475–516. [Google Scholar] [CrossRef]
- Jeon, J. Development of MEMS Telescope for Extreme Lightning (MTEL) for the Study of Transient Luminous Events. Ph.D. Thesis, Ewha Womans University, Seoul, Korea, 2014. [Google Scholar]
- Van der Velde, O.A.; Lyons, W.A.; Nelson, T.E.; Cummer, S.A.; Li, J.; Bunnell, J. Analysis of the first gigantic jet recorded over continental North America. J. Geophys. Res. 2007, 112. [Google Scholar] [CrossRef]
- Pasko, V.P.; George, J.J. Three-dimensional modeling of blue jets and blue starters. J. Geophys. Res. 2002, 107. [Google Scholar] [CrossRef]
- Upper Atmosphere Phenomena Caused by Thunderstorms (NASA). Available online: https://www.nasa.gov/image-feature/upper-atmosphere-phenomena-caused-by-thunderstorms (accessed on 1 August 2018).
- Yair, Y.; Rubanenko, L.; Mezuman, K.; Elhalel, G.; Pariente, M.; Glickman-Pariente, M.; Ziv, B.; Takahashi, Y.; Inoue, T. New Color Images of Transient Luminous Events from Dedicated Observations on the International Space Station. J. Atmos. Sol. Terr. Phys. 2013, 102, 140–147. [Google Scholar] [CrossRef]
- Myhrvold, N. Comparing NEO Search Telescopes. Publ. Astron. Soc. Pac. 2016, 128, 045004. [Google Scholar] [CrossRef]
- Shao, M.; Turyshev, S.G.; Spangelo, S.; Werne, T.; Zhai, C. A Constellation of SmallSats with Synthetic Tracking Cameras to Search for 90% of Potentially Hazardous Near-Earth Objects. Astron. Astrophys. 2017, 603, A126. [Google Scholar] [CrossRef]
- Cahoy, K.; Kennedy, A.K. Initial Results from ACCESS: An Autonomous CubeSat Constellation Scheduling System for Earth Observation. In Proceedings of the 31st Annual AIAA/USU Conference on Small Satellites, Logan, UT, USA, 5–10 August 2017. [Google Scholar]
- Ma, Y.; Zou, X.; Weng, F. Potential Applications of Small Satellite Microwave Observations for Monitoring and Predicting Global Fast-Evolving Weathers. IEEE J. Sel. Top. Appl. Earth Obs. Remote Sens. 2017, 10, 2441–2451. [Google Scholar] [CrossRef]
- Reising, S.; Kummerow, C.D.; Chandrasekar, V.; Berg, W.; Olson, J.P.; Gaier, T.C.; Padmanabhan, S.; Lim, B.H.; Heneghan, C.; Brown, S.T.; et al. Temporal Experiment for Storms and Tropical Systems Technology Demonstration (TEMPEST-D) Mission Enabling Time-Resolved Cloud and Precipitation Observations from 6U-Class Satellite Constellations. In Proceedings of the 31st Annual AIAA/USU Conference on Small Satellites, Logan, UT, USA, 5–10 August 2017. [Google Scholar]
- Wikipedia Contributors. Available online: https://en.wikipedia.org/wiki/CubeSat/ (accessed on 1 August 2018).
- The CubeSat Program. Available online: http://www.cubesat.org/s/cds_rev13_final2.pdf (accessed on 6 April 2018).
- Heidt, H.; Puig-Suari, J.; Moore, A.; Nakasuka, S.; Twiggs, R. CubeSat: A New Generation of Picosatellite for Education and Industry Low-cost Space Experimentation. In Proceedings of the 14th Annual AIAA/USU Conference on Small Satellites, Logan, UT, USA, 21–24 August 2000. [Google Scholar]
- Hamamatsu. Available online: https://www.hamamatsu.com/jp/en/product/type/H7546B/index.html (accessed on 1 September 2018).
- Hamamatsu. Available online: https://www.hamamatsu.com/resources/pdf/etd/H7546A_H7546B_TPMH1240E.pdf (accessed on 1 August 2018).
- Pasko, V.P. Recent Advances in Theory of Transient Luminous Events. J. Geophys. Res. 2010, 115. [Google Scholar] [CrossRef]
- Texas Instruments. Available online: http://www.ti.com/lit/ds/symlink/ddc264.pdf (accessed on 1 August 2018).
- ON Semiconductor. Available online: http://www.onsemi.com/pub/Collateral/MT9P031-D.PDF (accessed on 1 August 2018).
- Jung, D.; Kim, S. VisionCube Preliminary Design Review; Technical Report; Korea Aerospace Research Institute: Daejeon, Korea, 2016. [Google Scholar]
- Garipov, G.; Khrenov, B.; Klimov, P.; Klimenko, V.; Mareev, E.; Martines, O.; Mendoza, E.; Morozenko, V.; Panasyuk, M.; Park, I.; et al. Global Transients in Ultraviolet and Red-Infrared Ranges from Data of Universitetsky-Tatiana-2 Satellite. J. Geophys. Res. 2013, 118, 370–379. [Google Scholar] [CrossRef]
- BIVAR. Available online: https://www.bivar.com/portals/0/products/UV3TZ-XXX-XX.pdf (accessed on 1 August 2018).
© 2018 by the authors. Licensee MDPI, Basel, Switzerland. This article is an open access article distributed under the terms and conditions of the Creative Commons Attribution (CC BY) license (http://creativecommons.org/licenses/by/4.0/).