Determination of Serviceability Limits of a Turboshaft Engine by the Criterion of Blade Natural Frequency and Stall Margin


1
Motor Sich JSC, 15 Motorostroiteley Ave., 69068 Zaporizhzhia, Ukraine
2
Mechanical Engineering Department, National University “Zaporizhzhia Polytechnic”, 64 Zhukovskogo st, 69061 Zaporizhzhia, Ukraine
3
Zaporizhzhia Machine-Building Design Bureau Progress State Enterprise Named After Academician A.G. Ivchenko, 2 Ivanova st, 69068 Zaporizhzhia, Ukraine
4
Instytut Techniczny Wojsk Lotniczych, ul. Księcia Bolesława 6, 01-494 Warsaw, Poland
5
Technology Partners Foundation, ul. Pawińskiego 5A, 02-106 Warsaw, Poland
*
Author to whom correspondence should be addressed.
Aerospace 2019, 6(12), 132; https://doi.org/10.3390/aerospace6120132
Submission received: 2 November 2019
/
Revised: 3 December 2019
/
Accepted: 4 December 2019
/
Published: 9 December 2019
(This article belongs to the Special Issue 9th EASN International Conference on Innovation in Aviation & Space)
Abstract
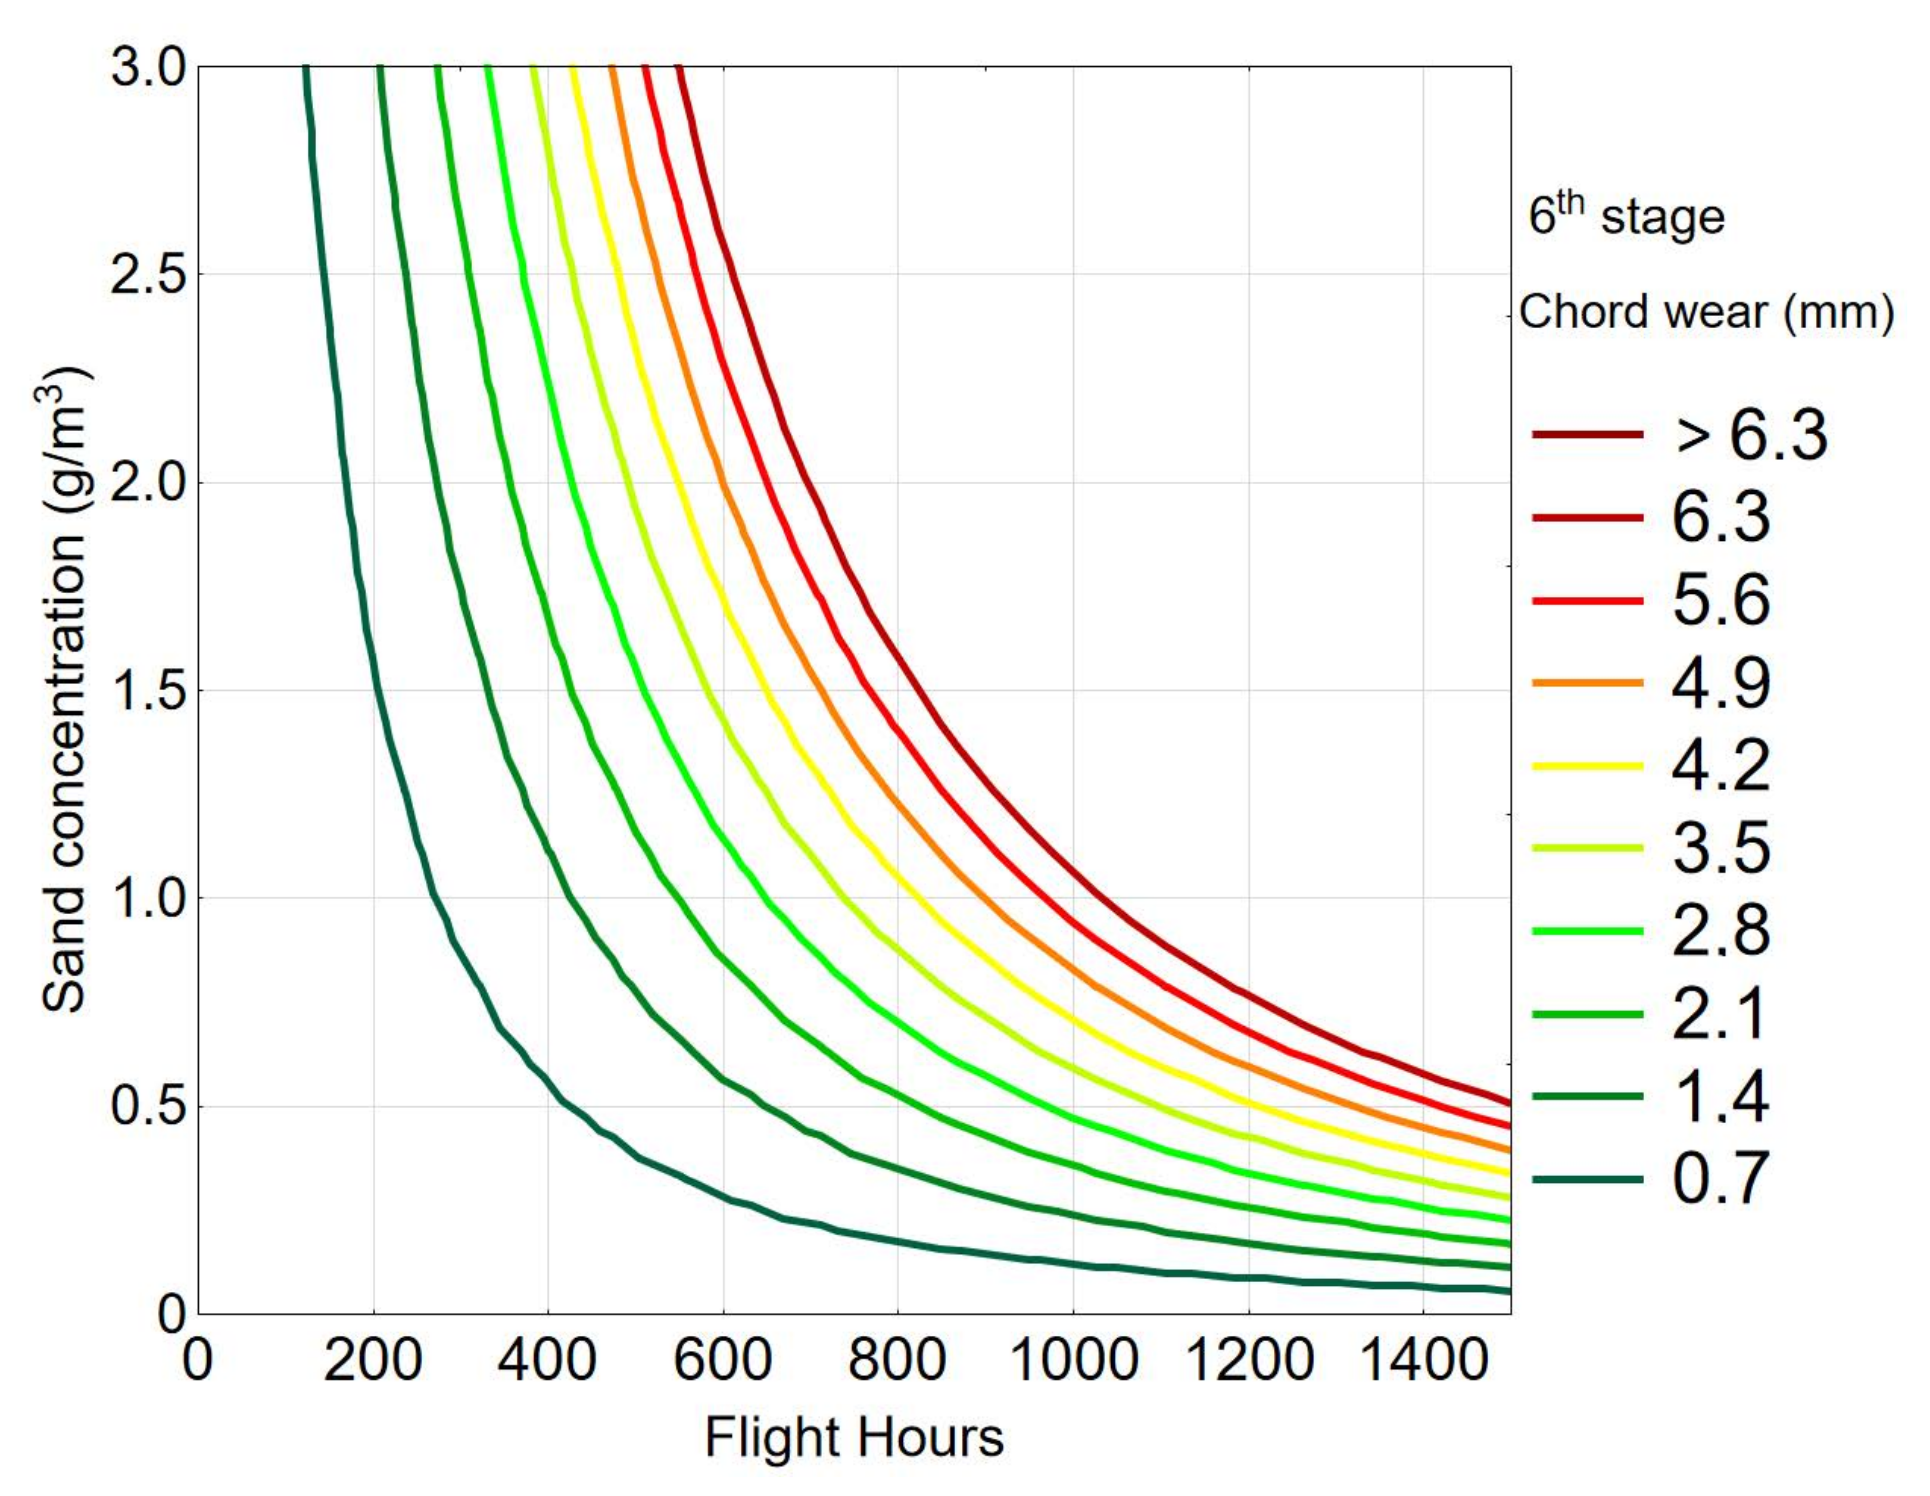
:This paper analyzes the health and performance of the 12-stage axial compressor of the TV3-117VM/VMA turboshaft operated in a desert environment. The results of the dimensional control of 4800 worn blades are analyzed to model the wear process. Operational experience and two-phase flow simulations are used to assess the effectiveness of an inlet particle separator. Numerical modal analysis is performed to generate the Campbell diagram of the worn blades and identify resonant blade vibrations which can lead to high cycle fatigue (HCF): mode 7 engine order 30 in the first stage and mode 8 engine order 60 in the fourth. It is also shown that the gradual loss of the stall margin over time determines the serviceability limits of compressor blades. In particular, the chord wear of sixth-stage blades as high as 6.19 mm results in a reduction of the stall margin by 15–17% and a permanent stall at 770–790 flight hours. In addition, recommendations setting out go/no-go criteria are made to maintenance and repair organizations.
Keywords:
gas-turbine performance; turboshaft; axial compressor; blade; FEM; CFD; erosion; wear; stall margin; compressor surge; brownout1. Introduction
Long-term engine performance in adverse operating conditions is one of the main prerequisites for successful helicopter missions. Unlike airplanes, helicopters have to hover for a long time above the ground, often raising a cloud of dust and causing a brownout. Therefore, the ability to ensure long-term operations at elevated dust concentrations is one of their most important features. Studies on the impact of environmental particles on the efficiency of helicopter engines were already being carried out during the development of the first helicopter types [1].
The gas path of the helicopter engine operated in a dusty environment is exposed to contamination [2,3]. Deposition of particles on aerofoils [4,5] and the heat transfer surfaces of the air cooling system [6] can lead to the deterioration of the aerodynamic and thermodynamic properties of these components. Moreover, given that dust particles (no matter how small they are) have abrasive properties, they also cause erosive wear of the engine components and contribute to various types of structural damage [7,8,9]. Erosive wear of compressor blades leads to reduction in the stall margin of the compressor, an increase in the likelihood of fatigue damage of compressor blades due to changes in their natural frequencies of vibration, and a decrease in the efficiency of the engine due to the wear of the gas path.
Rotating components are sensitive to mechanical damage caused by solid particles [10]. Models describing their impact and related erosive damage have been proposed by many researchers, such as Finney [11], Bitter [12], and Sheldon [13], but predicting the actual aerofoil degradation is still difficult. The main factors affecting the magnitude of erosion consist of the angle of collision, velocity and particle size, blade surface properties, and particle concentration. Van der Walt [14] showed that the wear rate of the aerofoils is directly proportional to dust concentration. The mechanical properties of the material are also an important parameter influencing the mechanisms of erosion [15,16].
Eustyfeev [17] performed experimental and theoretical studies of compressor blades eroded by solids to determine the erosion resistance of the blade material EI-961. The limiting ratio of the particle size to their velocity of contact with the material was determined. However, the experiment was performed on a cut-out sample, not on a real blade, as well as on one type of material, that is EI-961 steel, while most blades of modern compressors are made of titanium alloy.
Batcho [18] and Singh [19] analyzed loss of performance caused both by erosion and deposition. The impact of ingested particles on engine operation depends on the physical and chemical properties of the dust, its composition and concentration. Particles deposited on compressor aerofoils change their geometry and roughness, which leads to a decrease in the efficiency, and consequently, reduces the pressure ratio and performance of the compressor [20].
The time between overhauls (TBO) of an engine operated in a highly dusty environment is much less than that set out by the manufacturer and is reduced by the erosion of the compressor blades. The statistical analysis [21] showed that engines with eroded compressors represent the largest group of engines grounded due to compressor blade damage (30–35%). This value is comparable to the ratio of engine removals due to foreign objects ingested from the runway during take-off (25–30%). The share of aviation incidents, bird ingestion, or human errors during maintenance accounts for 15–20%.
The aim of this study was to assess the serviceability limits of the compressor blades of a helicopter engine operating in a dusty environment. To achieve this goal, the following tasks based on the results of the dimensional control of worn blades were performed:
- Establishing patterns of blade wear as a function of flight hours (FH) and dust concentration;
- Evaluating the increase in the natural frequency of blades by modeling the geometry of worn aerofoils over the engine operating time;
- Development of a methodology for modeling the flow through the axial compressor;
- Calculating the compressor maps describing the blades with different degrees of wear.
2. Methods
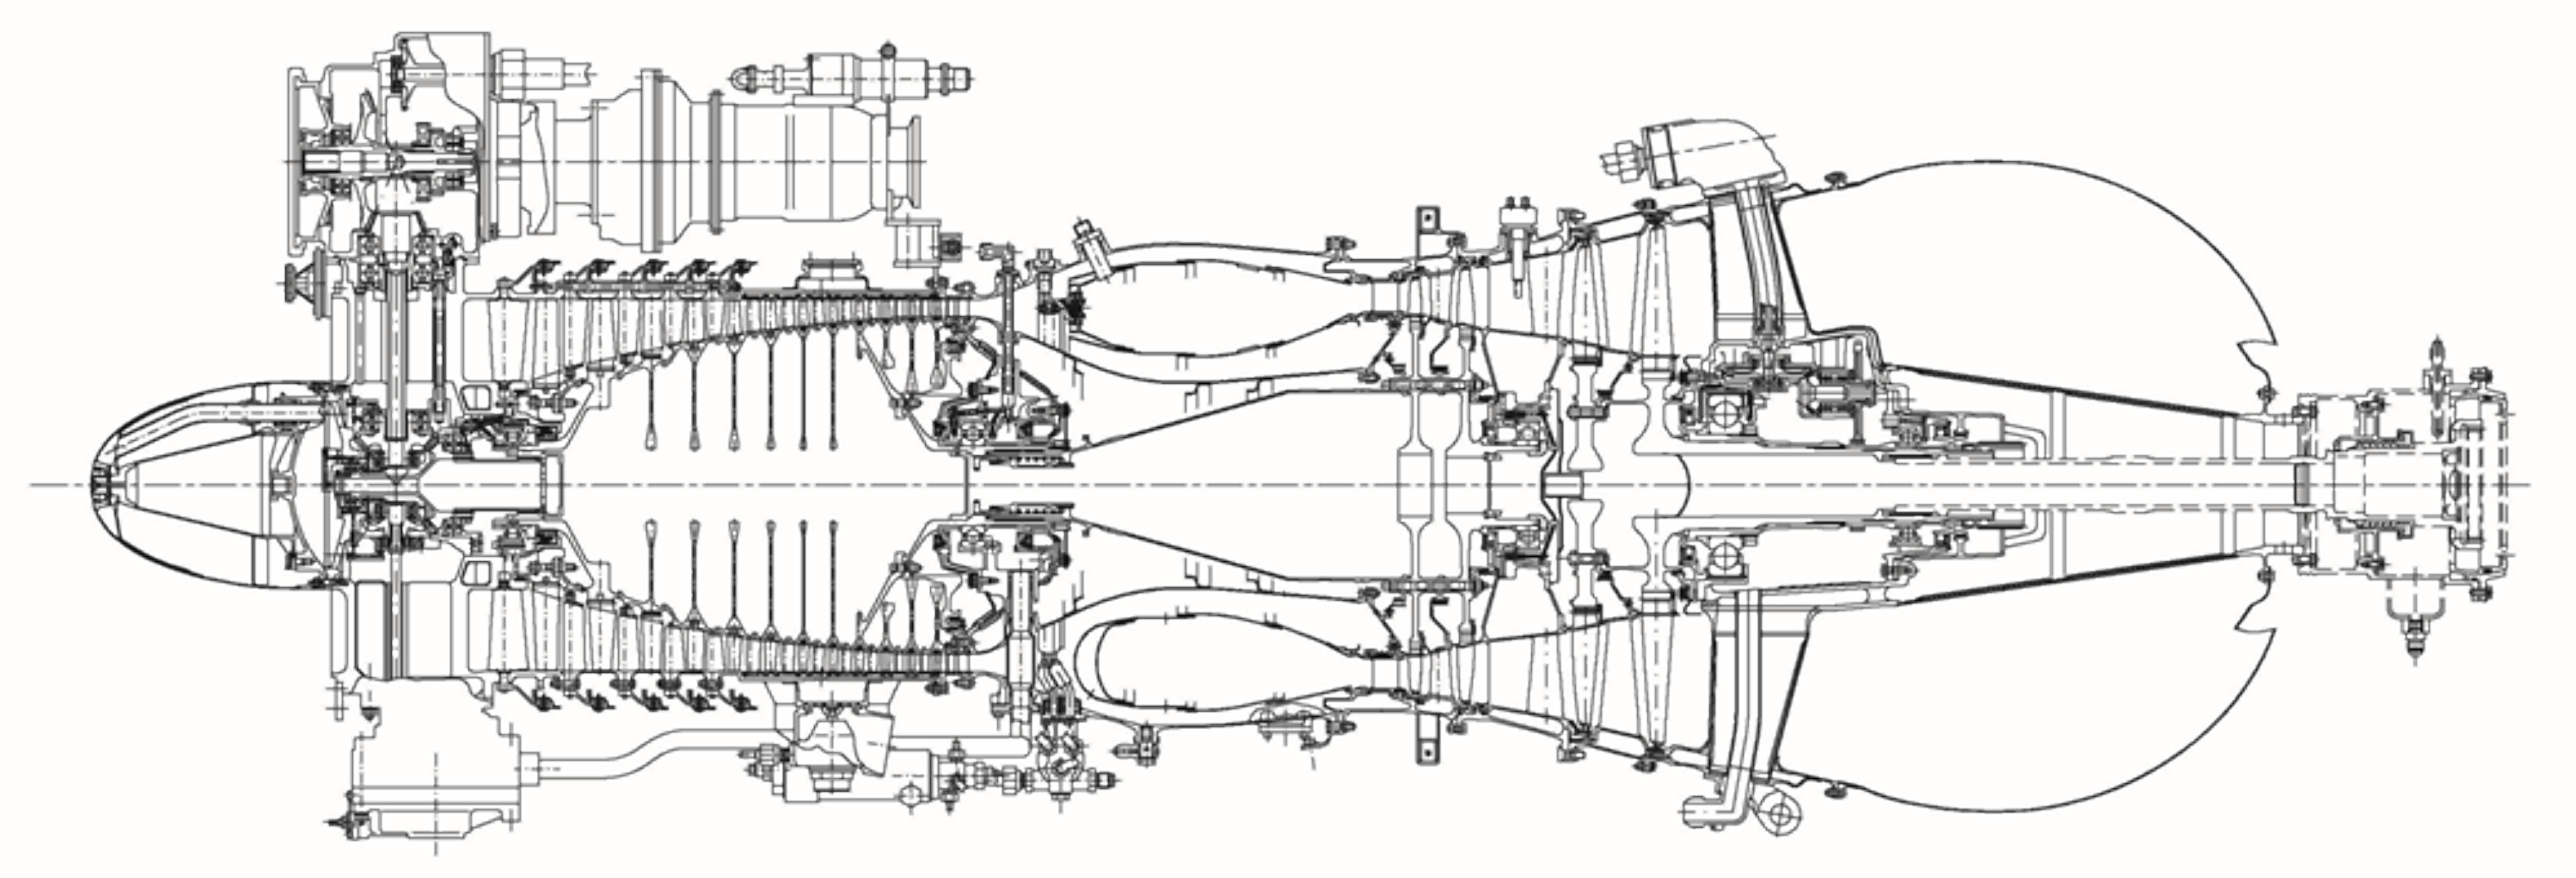
The TV3-117 turboshaft (Figure 1) with a maximum power of 1640 kW and overall pressure ratio of 9.4 belongs to one of the world’s most popular helicopter engines. It rotates anticlockwise (looking from aft to fore) and has a 12-stage axial compressor with a subsonic inlet and variable inlet guide vanes. Close to the blade tip, the Mach number is M = 0.8–0.92. The tip radius is 163 mm. The number of blades in subsequent stages are as follows: 37, 43, 59, 67, 73, 81, and 89 in further stages.
This work aims to analyze and predict the erosive wear of the TV3-117 engines powering the Mi-8MTV and Mi-24 helicopters in the desert environment of the Republic of Algeria. The region of North Africa and the Middle East is known for extreme ambient temperatures, a high concentration of dust, and sand dispersing up to a height of 6000 m, which is the helicopter operation zone. For example, in North Sudan, dust concentration is g/m3, and in Algeria 1.3– g/m3. The size of particles ingested into the gas path ranges from 0.01 to 2 mm.
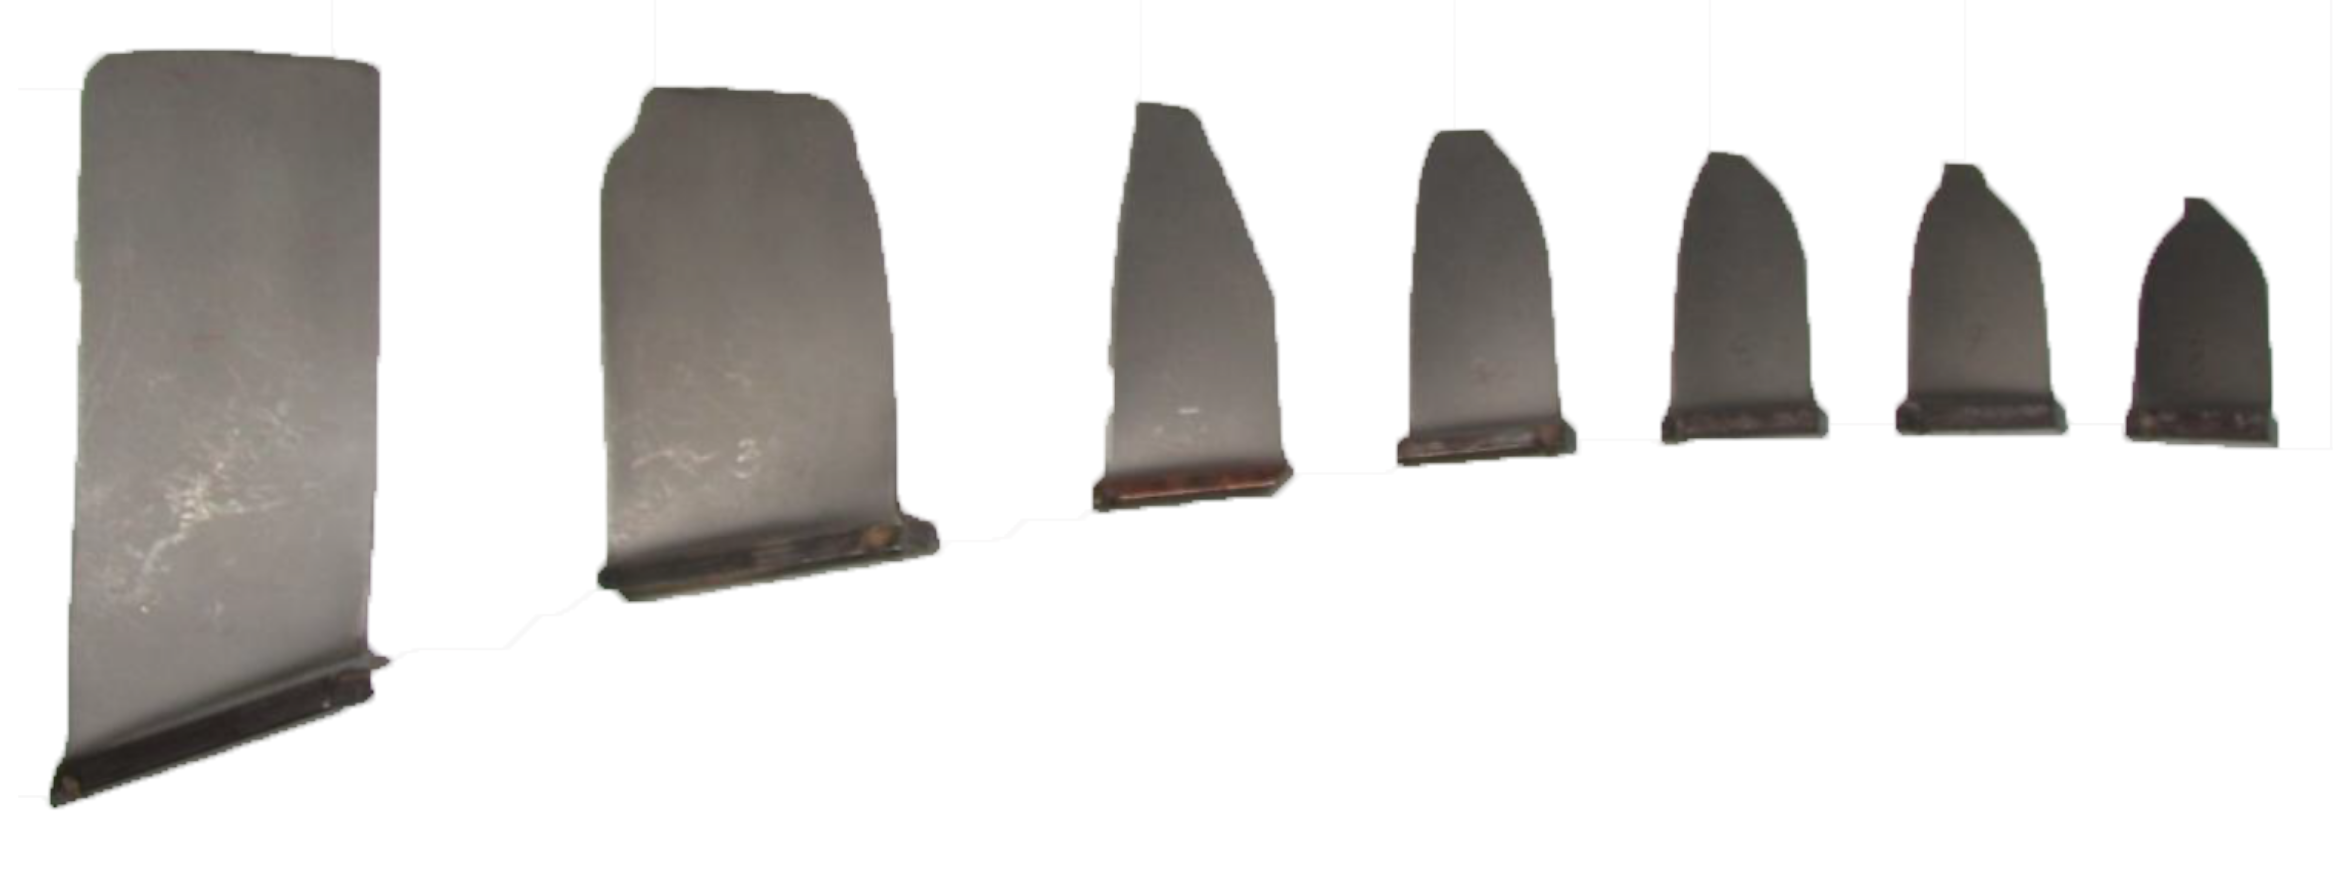
The operation of gas-turbine engines in the regions described above, with a high content of dust and sand, inevitably leads to deterioration of the engine [22,23]. Airborne particles may cause substantial erosive wear of compressor blades. As a consequence, tip clearance is widened and the aerofoil profile is modified—in particular, the chord length and the blade thickness appear to decrease, especially above 66% of the span (Figure 2). This leads to a reduction in the compressor pressure ratio and ultimately a reduction in the efficiency of the entire engine.
Firstly, a statistical analysis was carried out to study the nature of compressor wear and to determine its critical components. On the basis of the subsequent regression analysis, patterns of wear of the blades of all compressor stages as a function of engine operation time and dust concentration were established.
The obtained patterns of the chord wear of blades of all compressor stages were used to predict their geometry, depending on the engine operating time. This allowed for the simulation of the flow through the worn compressor and modeling blade vibration, and a determination of the serviceability limit of the blades in terms of structural integrity and stall margin.
For the analyzed engines, the observed impact of erosion on compressor performance was several times greater than deposition due to high dust concentration and fair inlet protection. Moreover, compressor fouling can be reversed by washing. Therefore, particle deposition is not taken into account in this work.
2.1. Blade Inspection
The inspected engines were grounded and torn down for one of two reasons: Either due to the chord wear of first-stage blades higher than 2 mm at the tip; or due to exceeding the threshold levels of performance parameters such as the gas generator speed or the turbine inlet temperature (TIT).
The dimensional control of blade geometry was performed by measuring the chord and the thickness of the profile at various sections as well as blade height. Ten blades were selected for the evaluation from each stage of 40 engines [25]. In total, 4800 blades were inspected. Statistica 12 was used to analyze the results.
The inspected engines were initially divided into two groups. The first one included those that were operated without a particle separator (IPS), and the second with an IPS.
2.2. Structural Analysis
Compressor blades of modern turboshafts are characterized by thin profiles and relatively low stiffness, hence forced vibration presents a notable threat to them [26,27]. Compressor blades absorb intensive static and dynamic loads. When rotating under large centrifugal forces, the blades are deformed, which leads among others to a decrease in their twist. As a result of unsteady flow forces, compressor blades vibrate relative to their static deformations. The distribution of dynamic stresses in blades has to be determined to ensure that they remain below the fatigue limit of the material [28,29].
The erosive wear of blades has a significant impact on their strength, which was confirmed by Hamed [1,30]. The properties of the blade surface and its ability to withstand erosion are one of the key factors that determine the reliability of the system, since a variety of surface irregularities can lead to stress concentration that increases the risk of high cycle fatigue (HCF) [31,32,33,34].
The main reason for forcing blade vibration is an irregularity of flow in the circumferential and radial direction. The frequencies of the driving forces are multiples of the rotor speed (engine orders) that are equal to the number of obstacles around the circumference, e.g., the number of guide vanes and struts in the gas path. When the speed changes, a number of resonant frequencies can be excited. To predict the frequencies of resonant vibration, a modal analysis of blades and the Campbell diagram are necessary [35,36].
Vibration frequencies and operational deflection shapes can be determined with a certain degree of accuracy by numerical methods, in particular using volumetric finite element models (FEM). At present, this research method is preferred, since the analytical method of calculating frequencies and vibration modes is not suitable for the complex geometry of aerofoils.
Blade geometry was measured using 3D scanning, followed by postprocessing in the CAD system ASCON KOMPAS 16.0. Geometry models of compressor blades were developed in Unigraphics NX8. Compressor blades operated in a dusty environment were described using parameterized solid-state models. By varying the blades height, chord length, and thickness in the corresponding sections of the aerofoil, several variants of blade geometry were generated.
The grid models of blades, created with the ANSYS ICEM CFD grid generator, consisted of 15–18 thousand hexagonal SOLID 185 elements. The natural frequencies of blades were calculated by the ANSYS 14.5 solver.
2.3. CFD Model
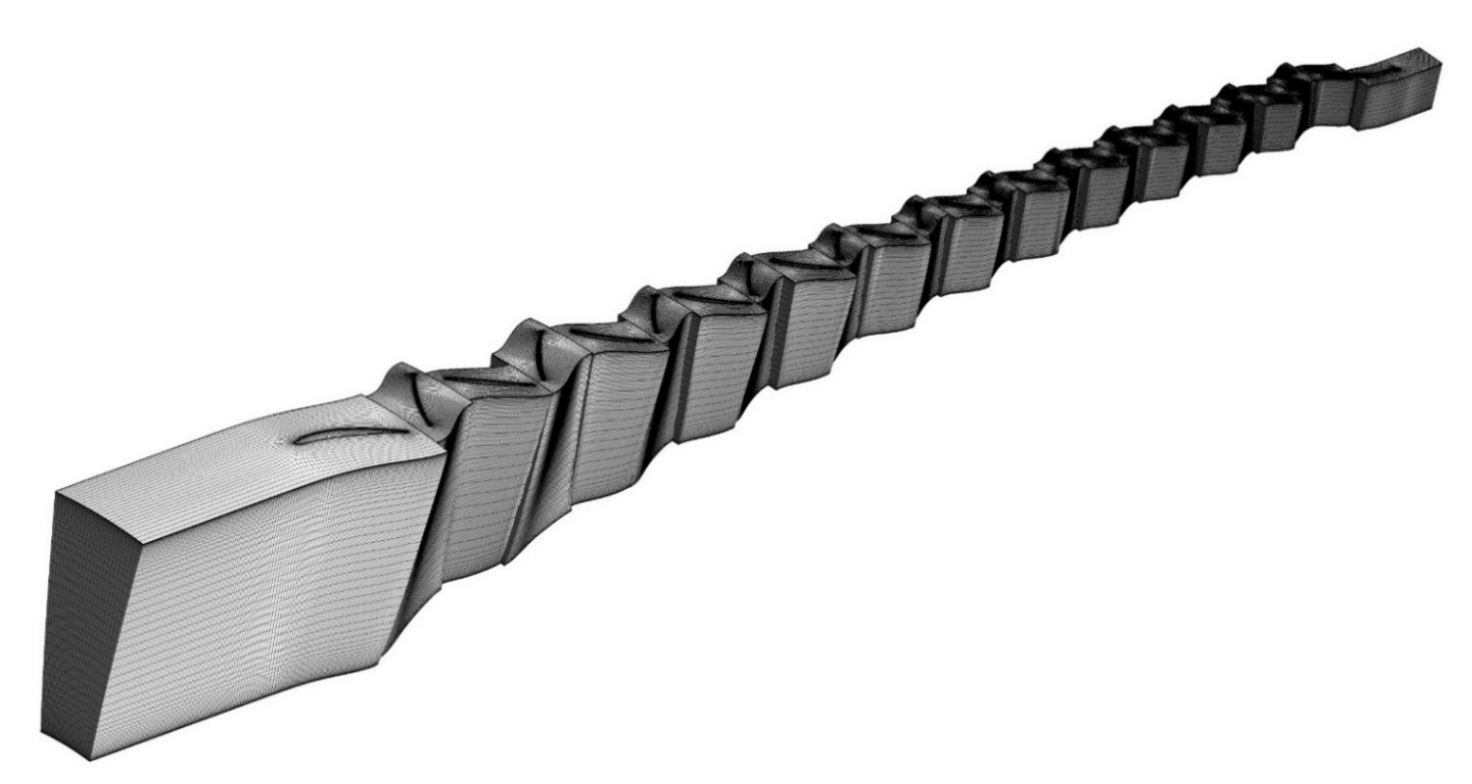
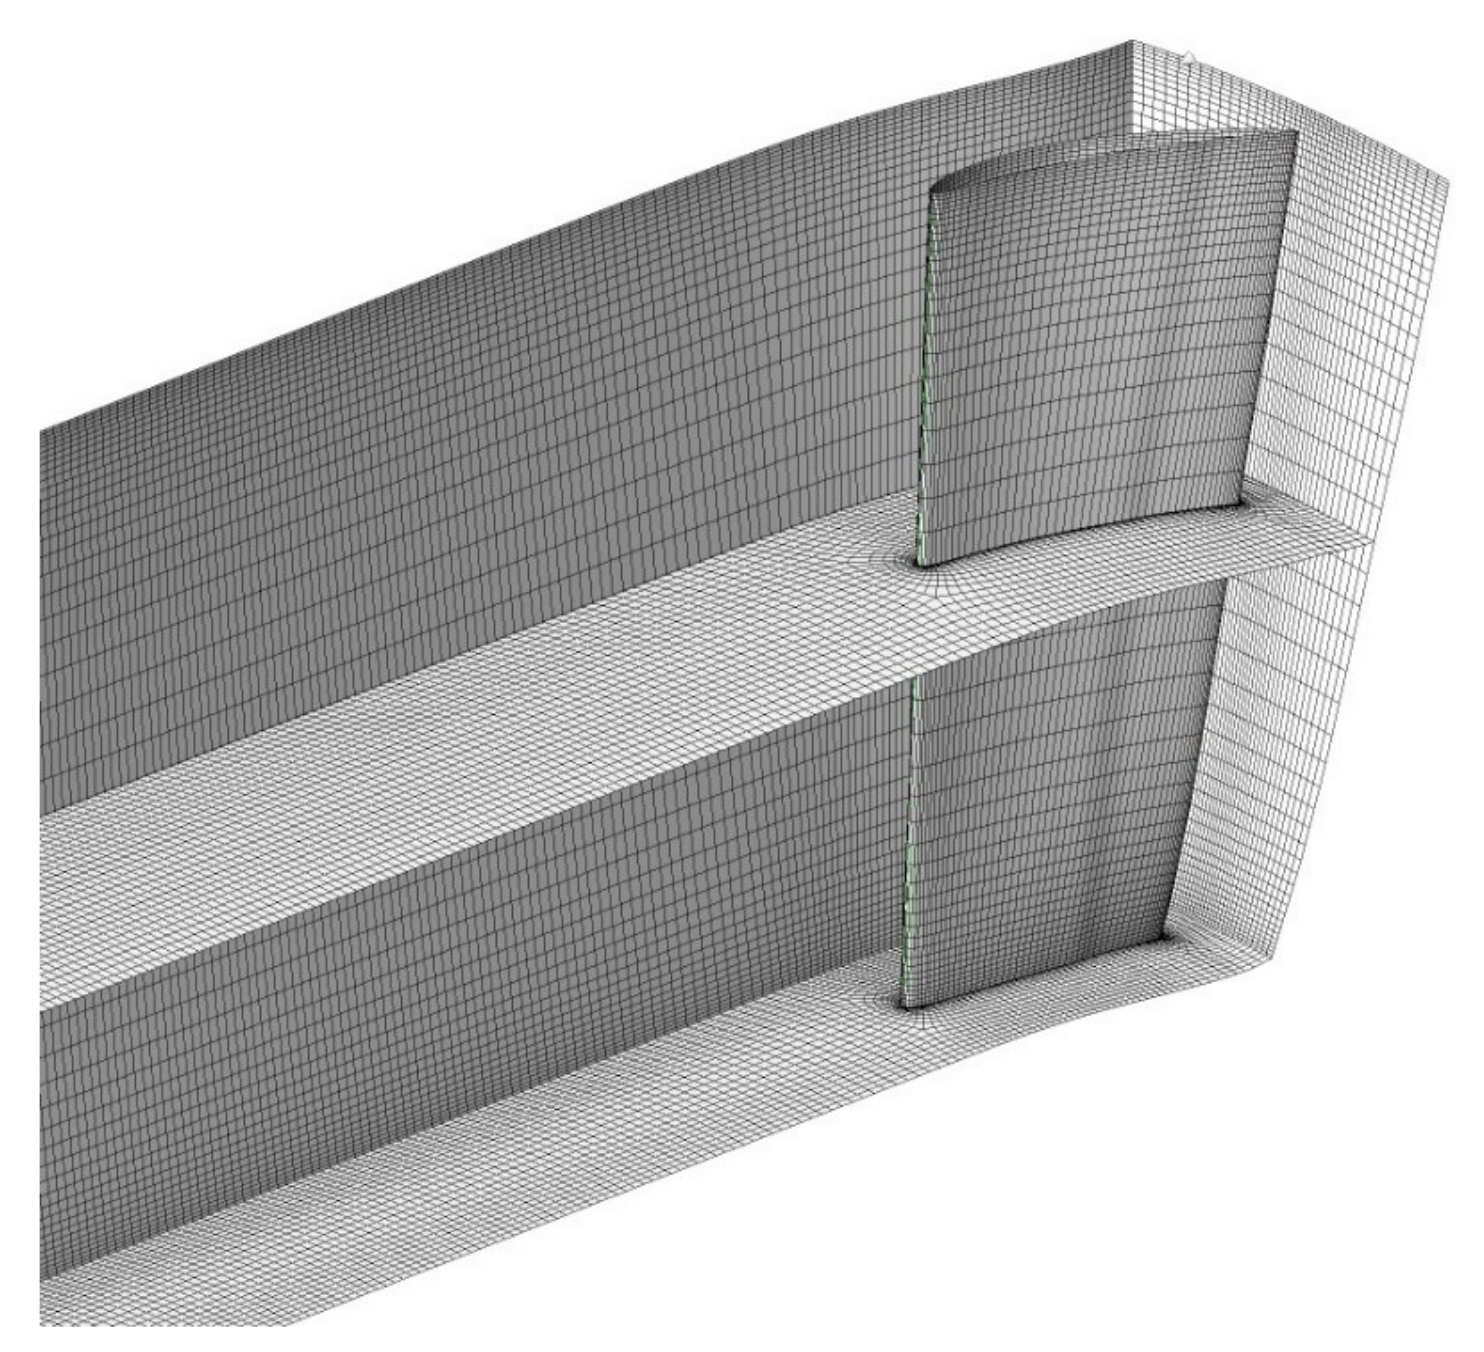
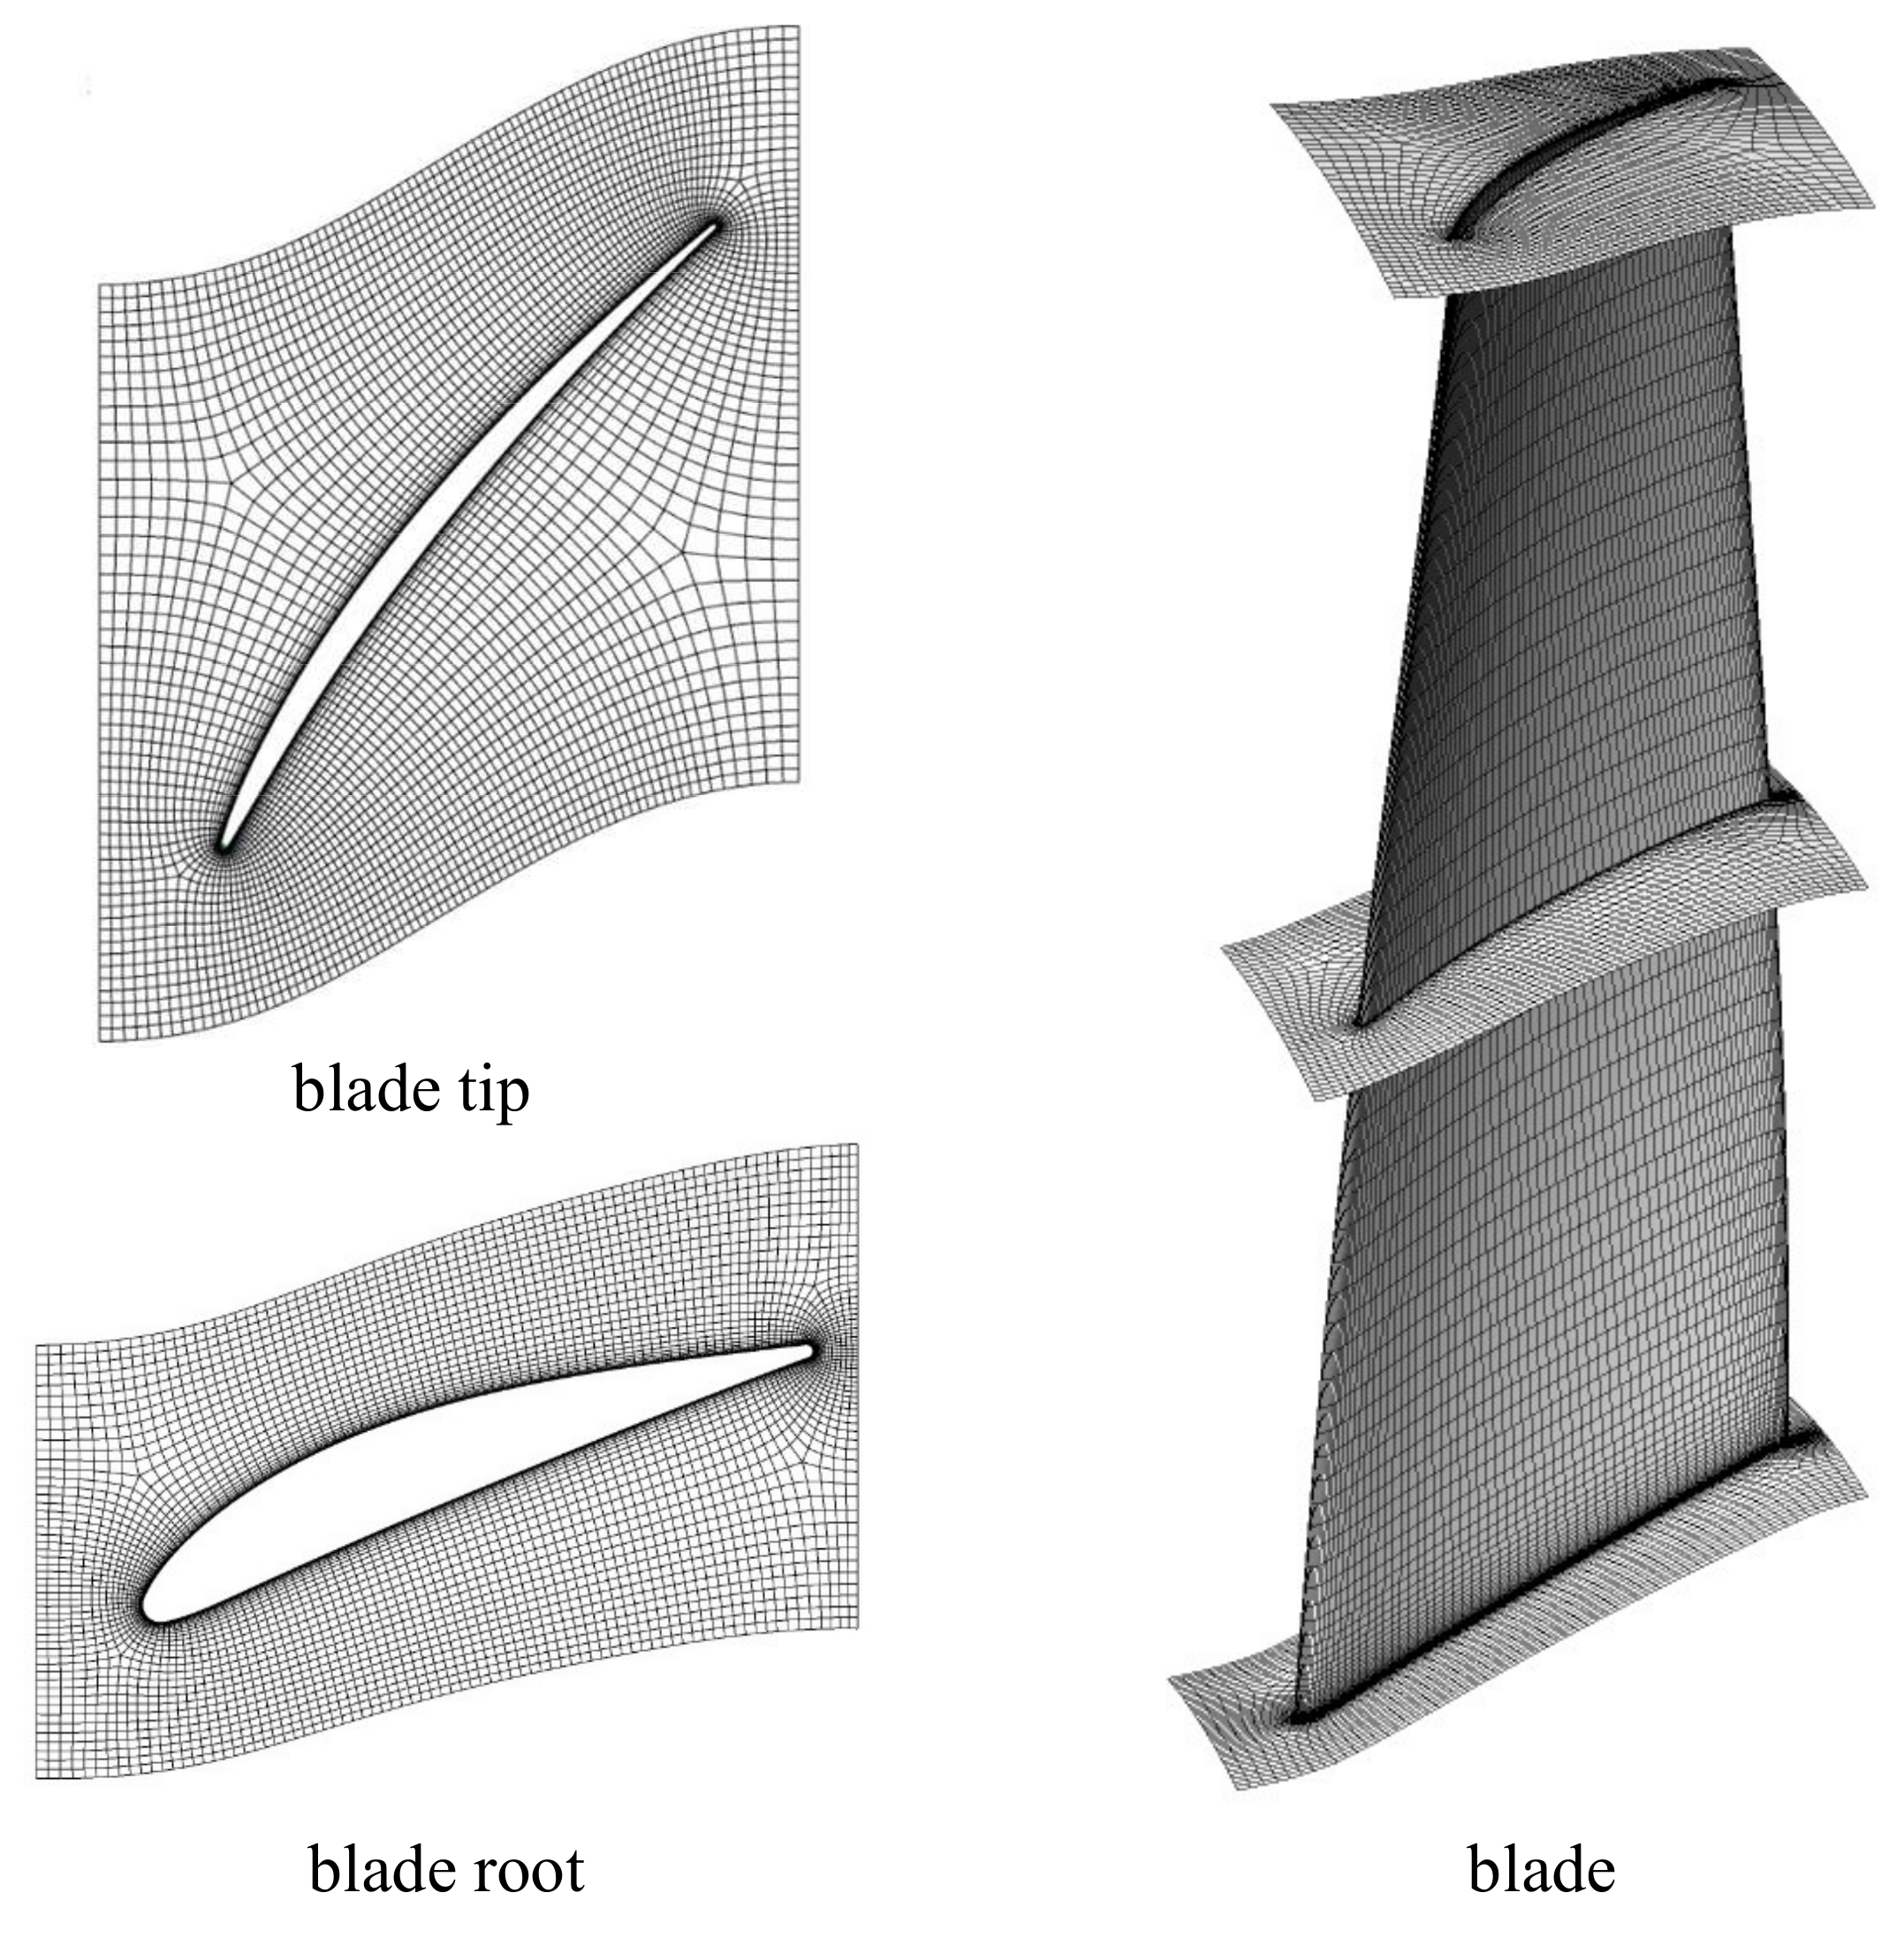
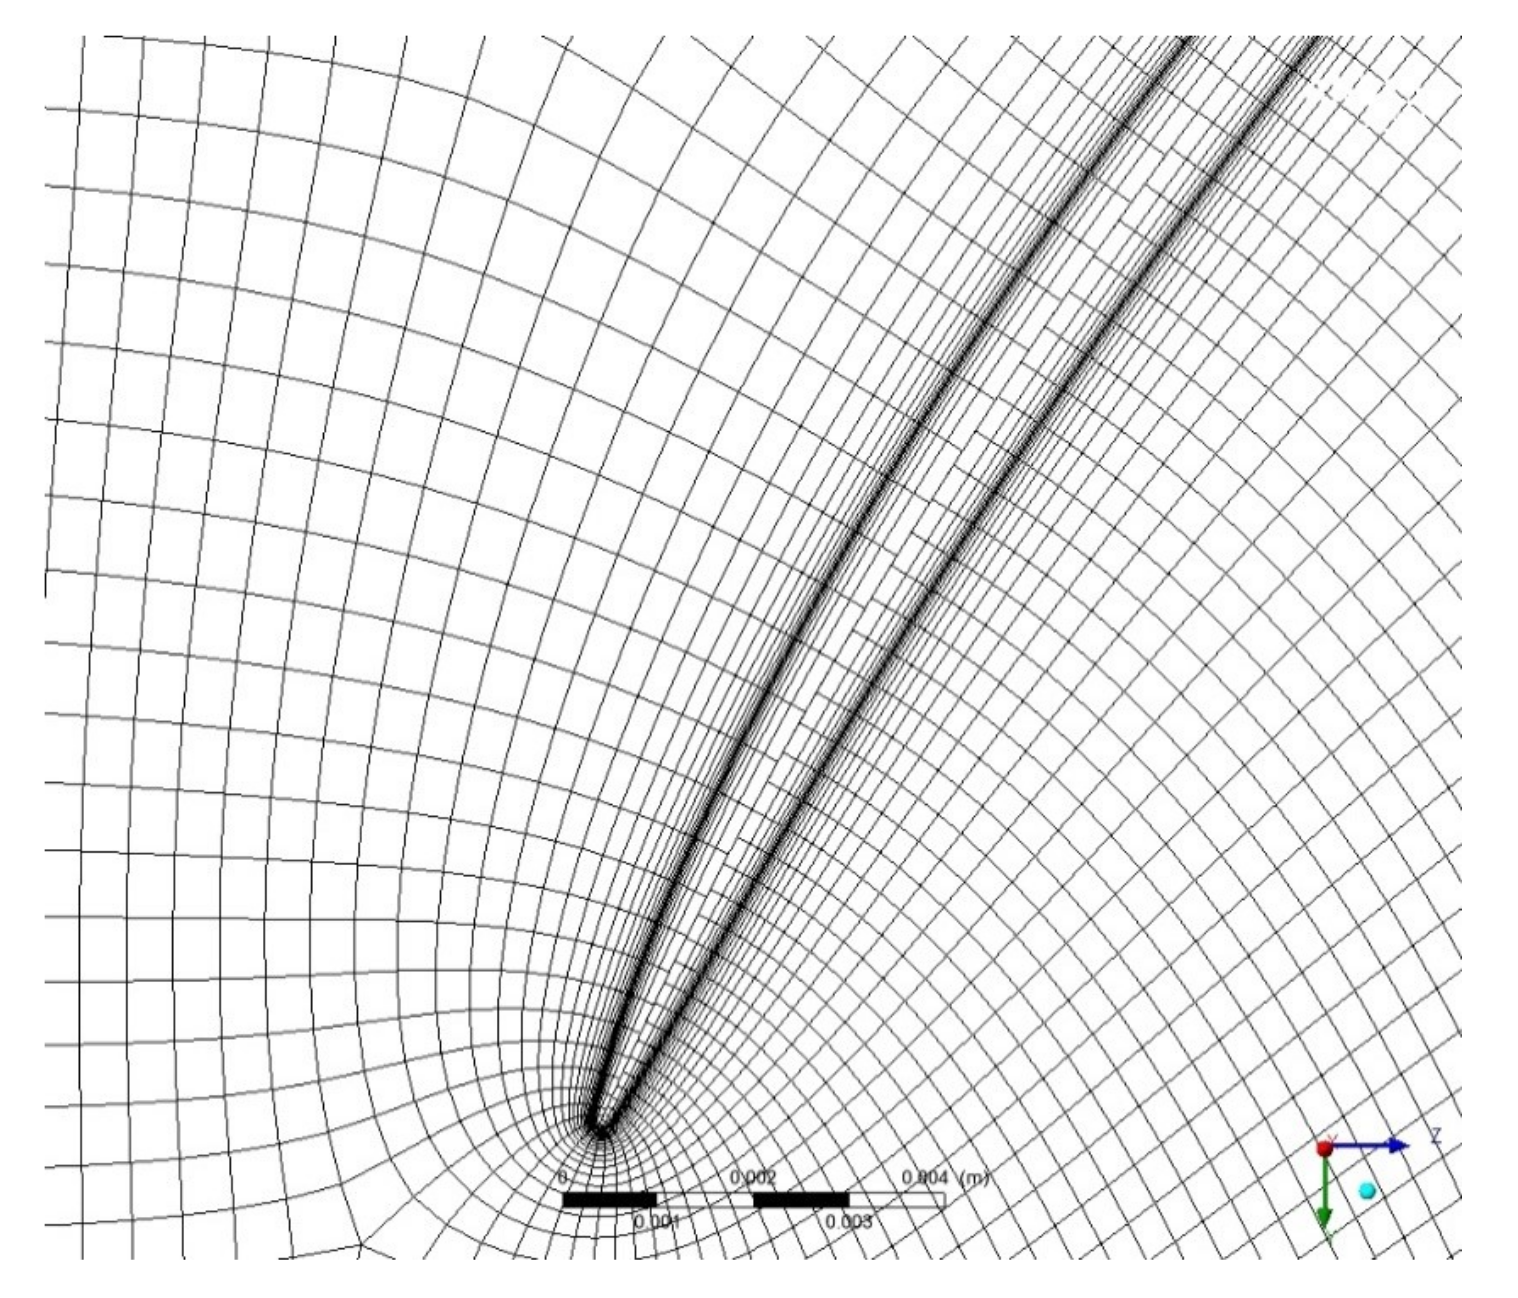
The 3D flow calculation, with an ideal gas as the working fluid, was based on the Navier–Stokes equations and the finite element method (FEM), implemented in the ANSYS CFX solver. The mesh was created in ANSYS Turbo Grid to model the operation of the compressor (Figure 3). A separate mesh flow model (domain) was designed for each stage (Figure 4 and Figure 5). The domains were designed taking into account the possibility of air flow leaking in the radial gap (Figure 6) by adding the interface in the blade tip. The compressor model consisted of 26 domains (Table 1).
The following grid parameters were considered when building the grid:
- ATM optimized topology ensures a high-quality mesh with hexahedral elements for twisted aerofoils;
- Parameter size of the first wall element has a value within (80–160) units;
- The ratio of the dimensions of the elements does not exceed 6.
First, the flow calculation was performed for two rotational speeds: 95% and 98%, where 1% corresponds to 195.37 rpm. An ambient air temperature of 288 K and pressure of 101.325 kPa were assumed. Each rotational speed of the compressor rotor corresponds to certain angles of the variable inlet guide vanes (VIGV) and guided vanes of the further four stages.
To reduce the required computing power, a single blade with cyclic symmetry along the lateral boundaries of the domain was modeled for each compressor stage. Stage interfaces (Mizing-Plane) between fixed and rotating domains were defined, which allowed for interpolation between interconnected grids, taking into account the laws of mass conservation.
The choice of the turbulence model depends on the nature of the turbulent flow, the required accuracy, the available time and computational resources. The SST K- turbulence model of Mentera was chosen as more accurate and reliable for the class of flows with a positive pressure gradient. The residual RMS error of 1E-6 was assumed as a satisfactory condition of computational fluid dynamics (CFD) convergence and it was achieved after 600–870 iterations.
CFD results were used to estimate the compressor maps, as in another paper about this turboshaft [37]. The mass flow rate was measured at the outlet of the compressor. Each operating point corresponded to a certain mass flow, in the range from 4 to 11 .
2.4. Modeling Two-Phase Flow through IPS
The modeling of multiphase flows presents a number of difficulties compared to single-phase flows, since it is necessary to solve the equation of mass, amount of motion, and energy conservation for each phase separately. These equations are much more complicated than for the single-phase case, because they have additional terms that govern the exchange of mass and energy between phases. However, as a result of various concomitant physical phenomena and possible changes in the flow regime, the exact values of many parameters are not always known [6].
To study the operation of the inlet particle separator, we describe multiphase dispersion flows, in which there is a continuous and dispersion phase. The dispersed phases contained many particles distributed in a continuous phase. The Euler model and the ANSYS CFX software were used for modeling. The equations of mass, amount of motion, and energy conservation were solved separately for each phase. In the equations of motion, the interfacial drag force and other forces observed in multiphase dispersed systems were adopted. The calculations determined the local flow rate, temperature, and volume fraction of the dispersed phase. A granulation model was used to account for particle collision, friction, and density of the particles.
To simulate two-phase flow and obtain results on the velocity of motion and distribution of dust particles in the air, the following assumptions were made:
- Geometric model of the separator;
- Concentration and chemical composition of dust;
- Pressure and air velocity in the separator;
- Flow model: two-phase;
- Full pressure at the inlet to the engine: 101,325 Pa;
- Exit velocity: 150 m/s;
- Temperature: 288 K;
- Turbulence model: K-;
- Dust concentration at the inlet: 2 ;
- Foreign particles material: quartz sand;
- Particle size: 10–50 in Case 1 and 50–100 in Case 2.
The IPS geometry, mesh, and other details are described in our previous publication [38]. Although particle separation is not the subject of this work, the selected calculation results are presented here to explain the wear process in engines operated with or without the IPS.
3. Results and Discussion
3.1. Chord Wear
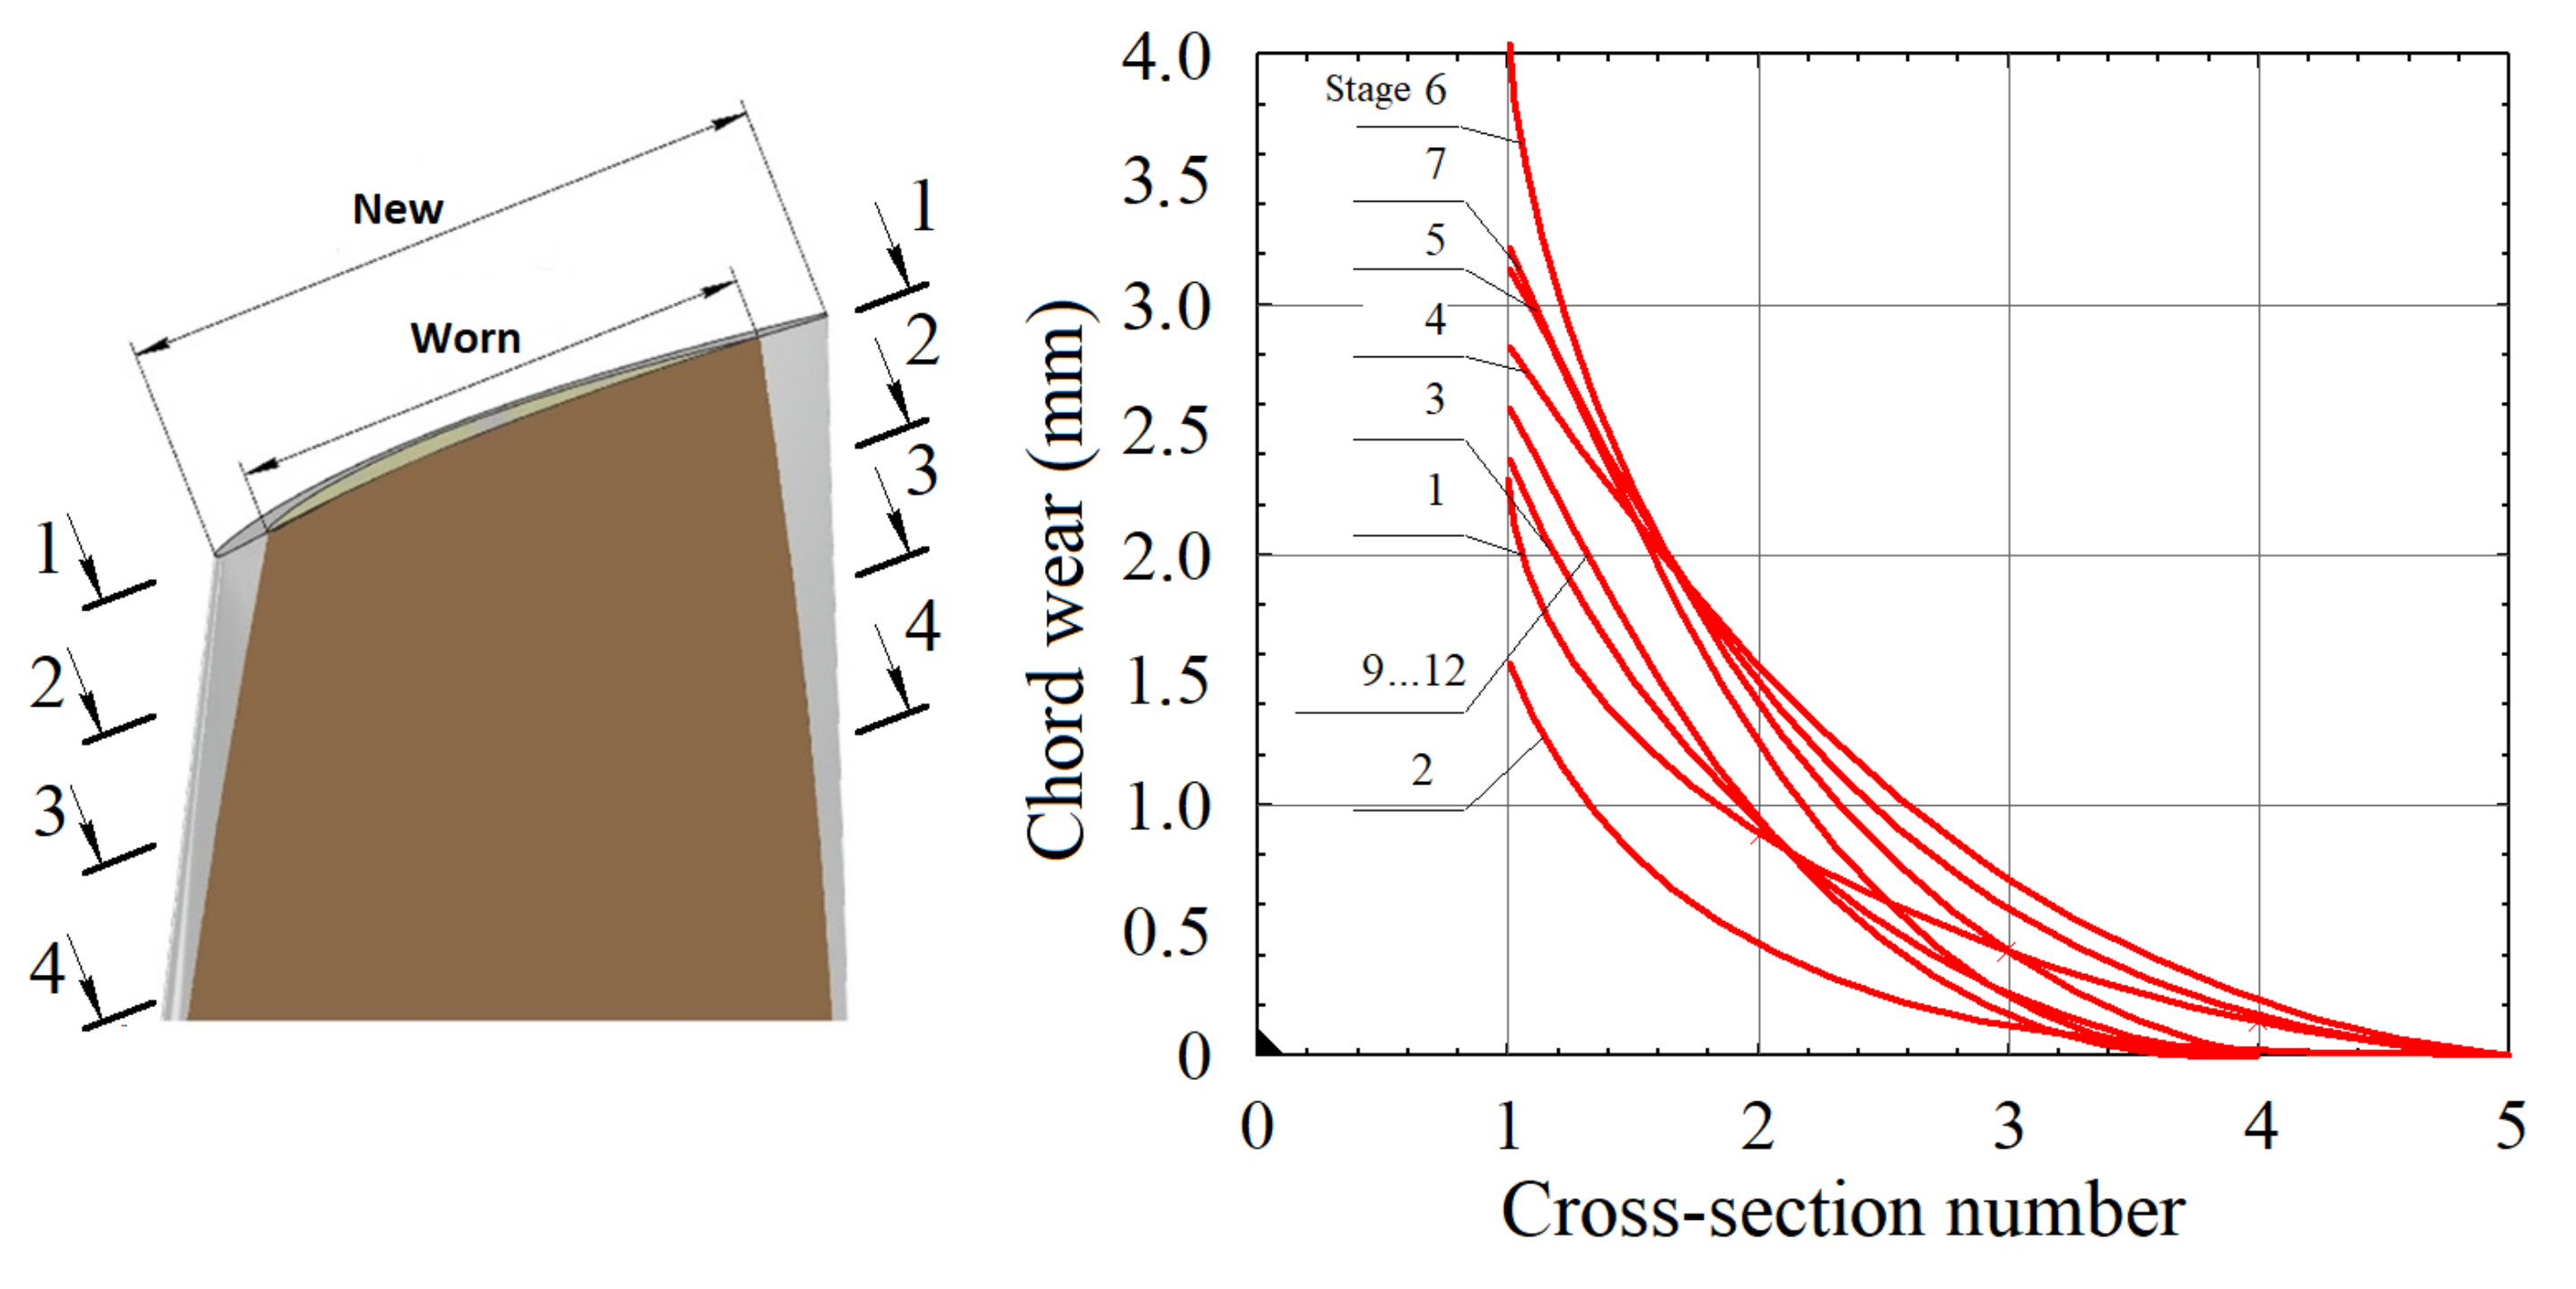
The results of the dimensional control of the compressor blades show that the largest wear is observed at the blade tip, while a much smaller wear is exhibited near the root (Figure 7). The chord wear of Section 2, Section 3 and Section 4 can be expressed as a function of the wear of the tip section.
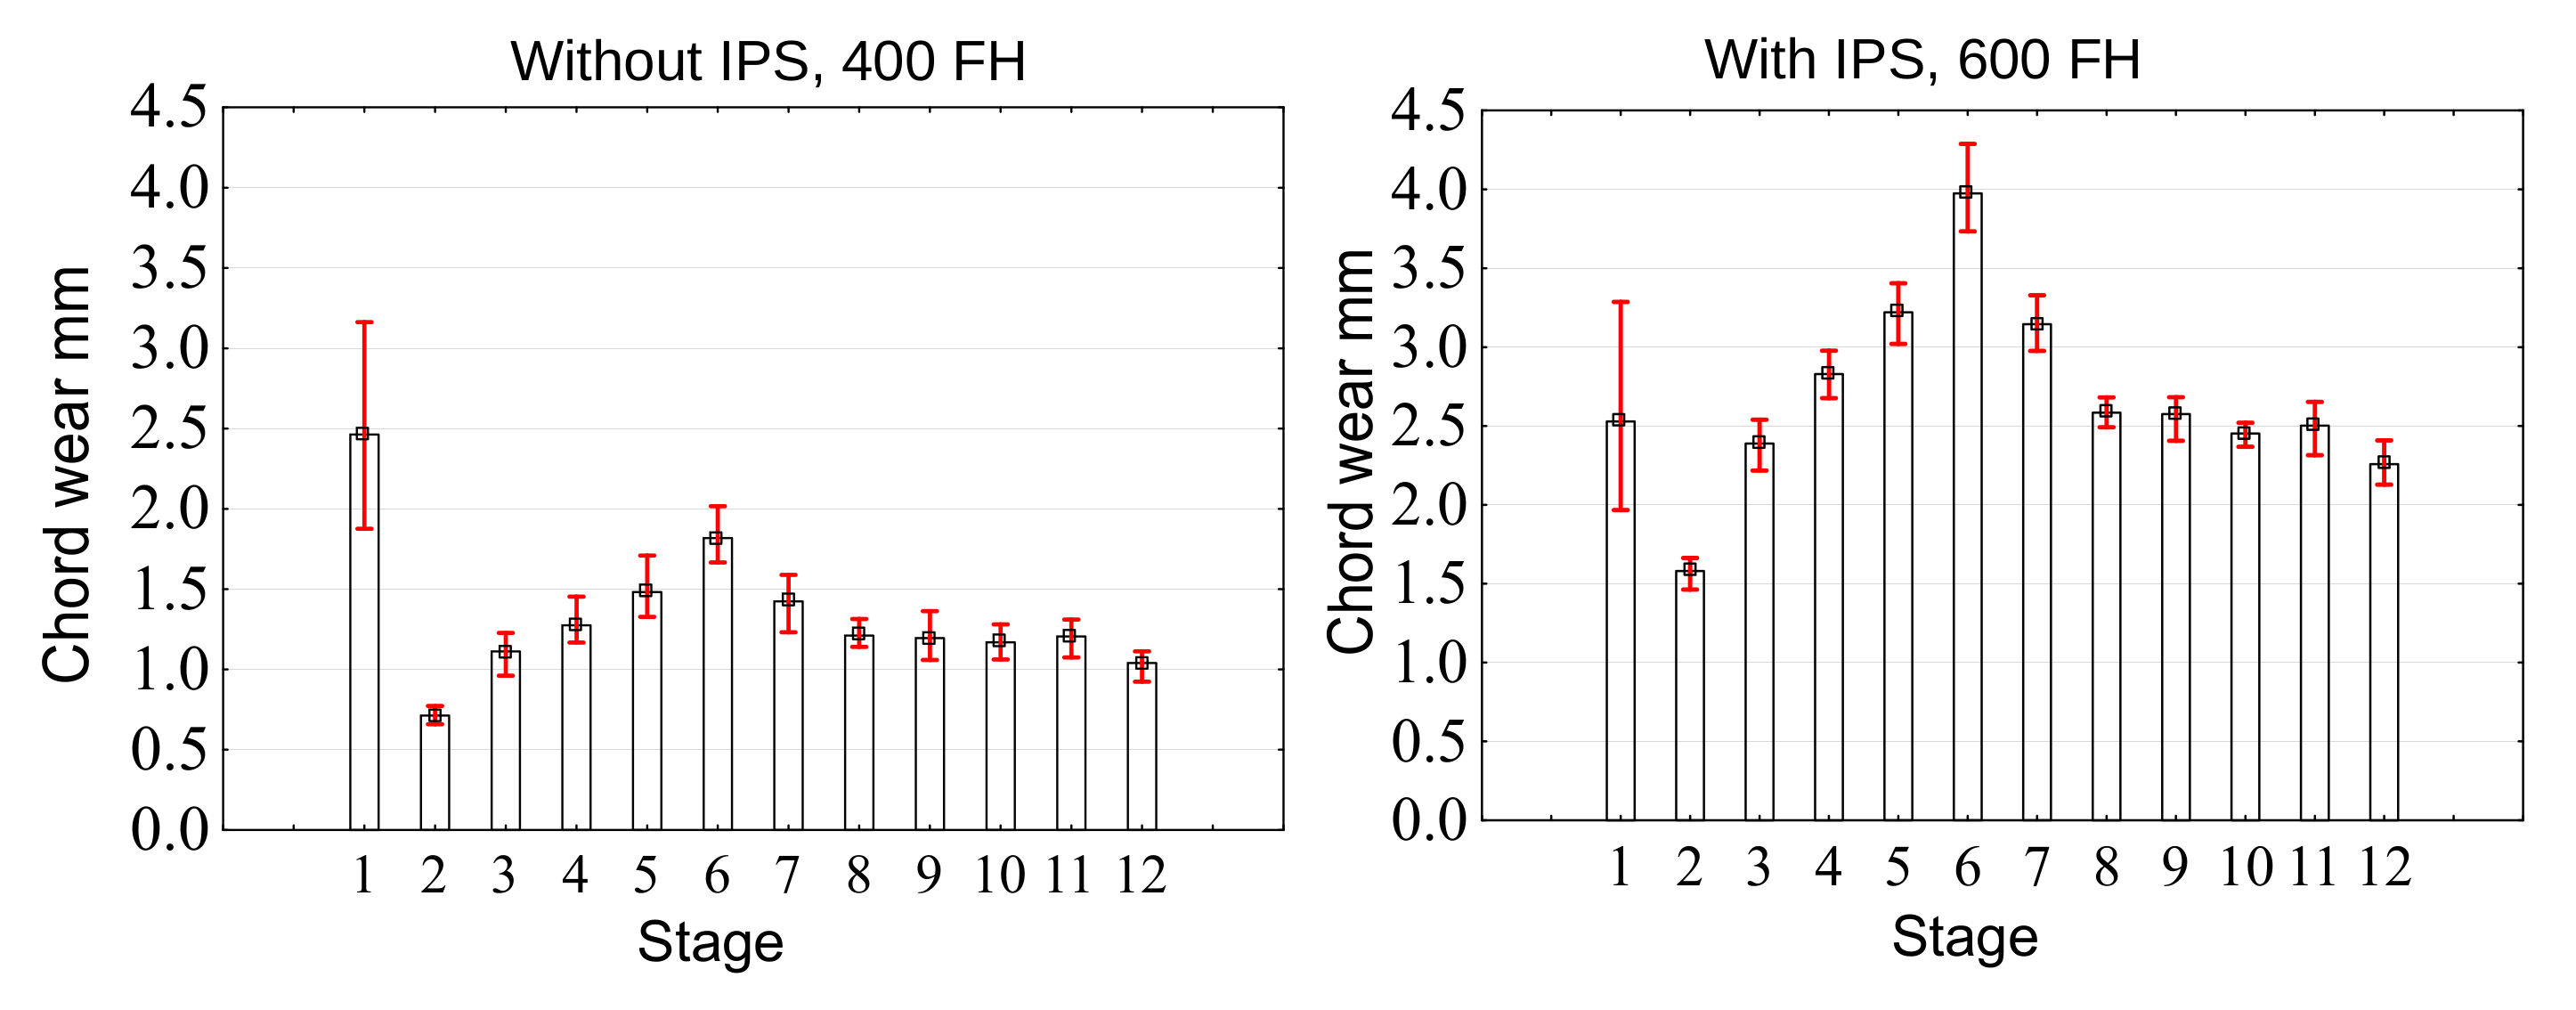
The statistical analysis carried out for individual stages revealed the wear patterns caused by the design features of the compressor [25]. Figure 8 shows the chord wear of the compressor blades for all stages. For engines operated without IPS, the largest wear is observed for the first-stage blades, while for engines operated with IPS, for the sixth-stage blades.
Engines belonging to the first category, operated without IPS, were grounded in accordance with the current standards for the maximum allowable chord wear of first-stage blades i.e., 2 mm at the tip. The effective TBO of the first category engines was only 150–200 FH, provided that it is nominally 1500 FH for this type of engine.
Engines from the second category, operated with IPS, were removed from service due to their operating parameters, such as speed and turbine inlet temperature beyond permissible limits. The effective TBO for the second category was 600–650 FH which indicates a partial effectiveness of the applied IPS [38].
Given the close correlation (R > 0.856) of chord wear among stages 2–12, it is possible to use these regression dependencies for modeling compressor wear. The chord wear of the sixth-stage blades is used as the independent variable. This choice is explained by the fact that, despite the obvious advantages of using the first stage for the dimensional control of blades, which is the most convenient in terms of monitoring and predicting the remaining useful life (RUL) without removing and disassembling the engine, it does not correlate well with the wear of the remaining stages (R < 0.4).
The chord wear of stages 2–12 correlates with the wear of the sixth stage and can be estimated using the linear regression.
The dependence of the chord wear on the compressor blades on the engine operating time in a dusty environment can be described by a second-order curve (Figure 9).
where is dust concentration in . For the analyzed fleet, the average concentration g/m3 can be assumed:
3.2. Modal Analysis of Blades
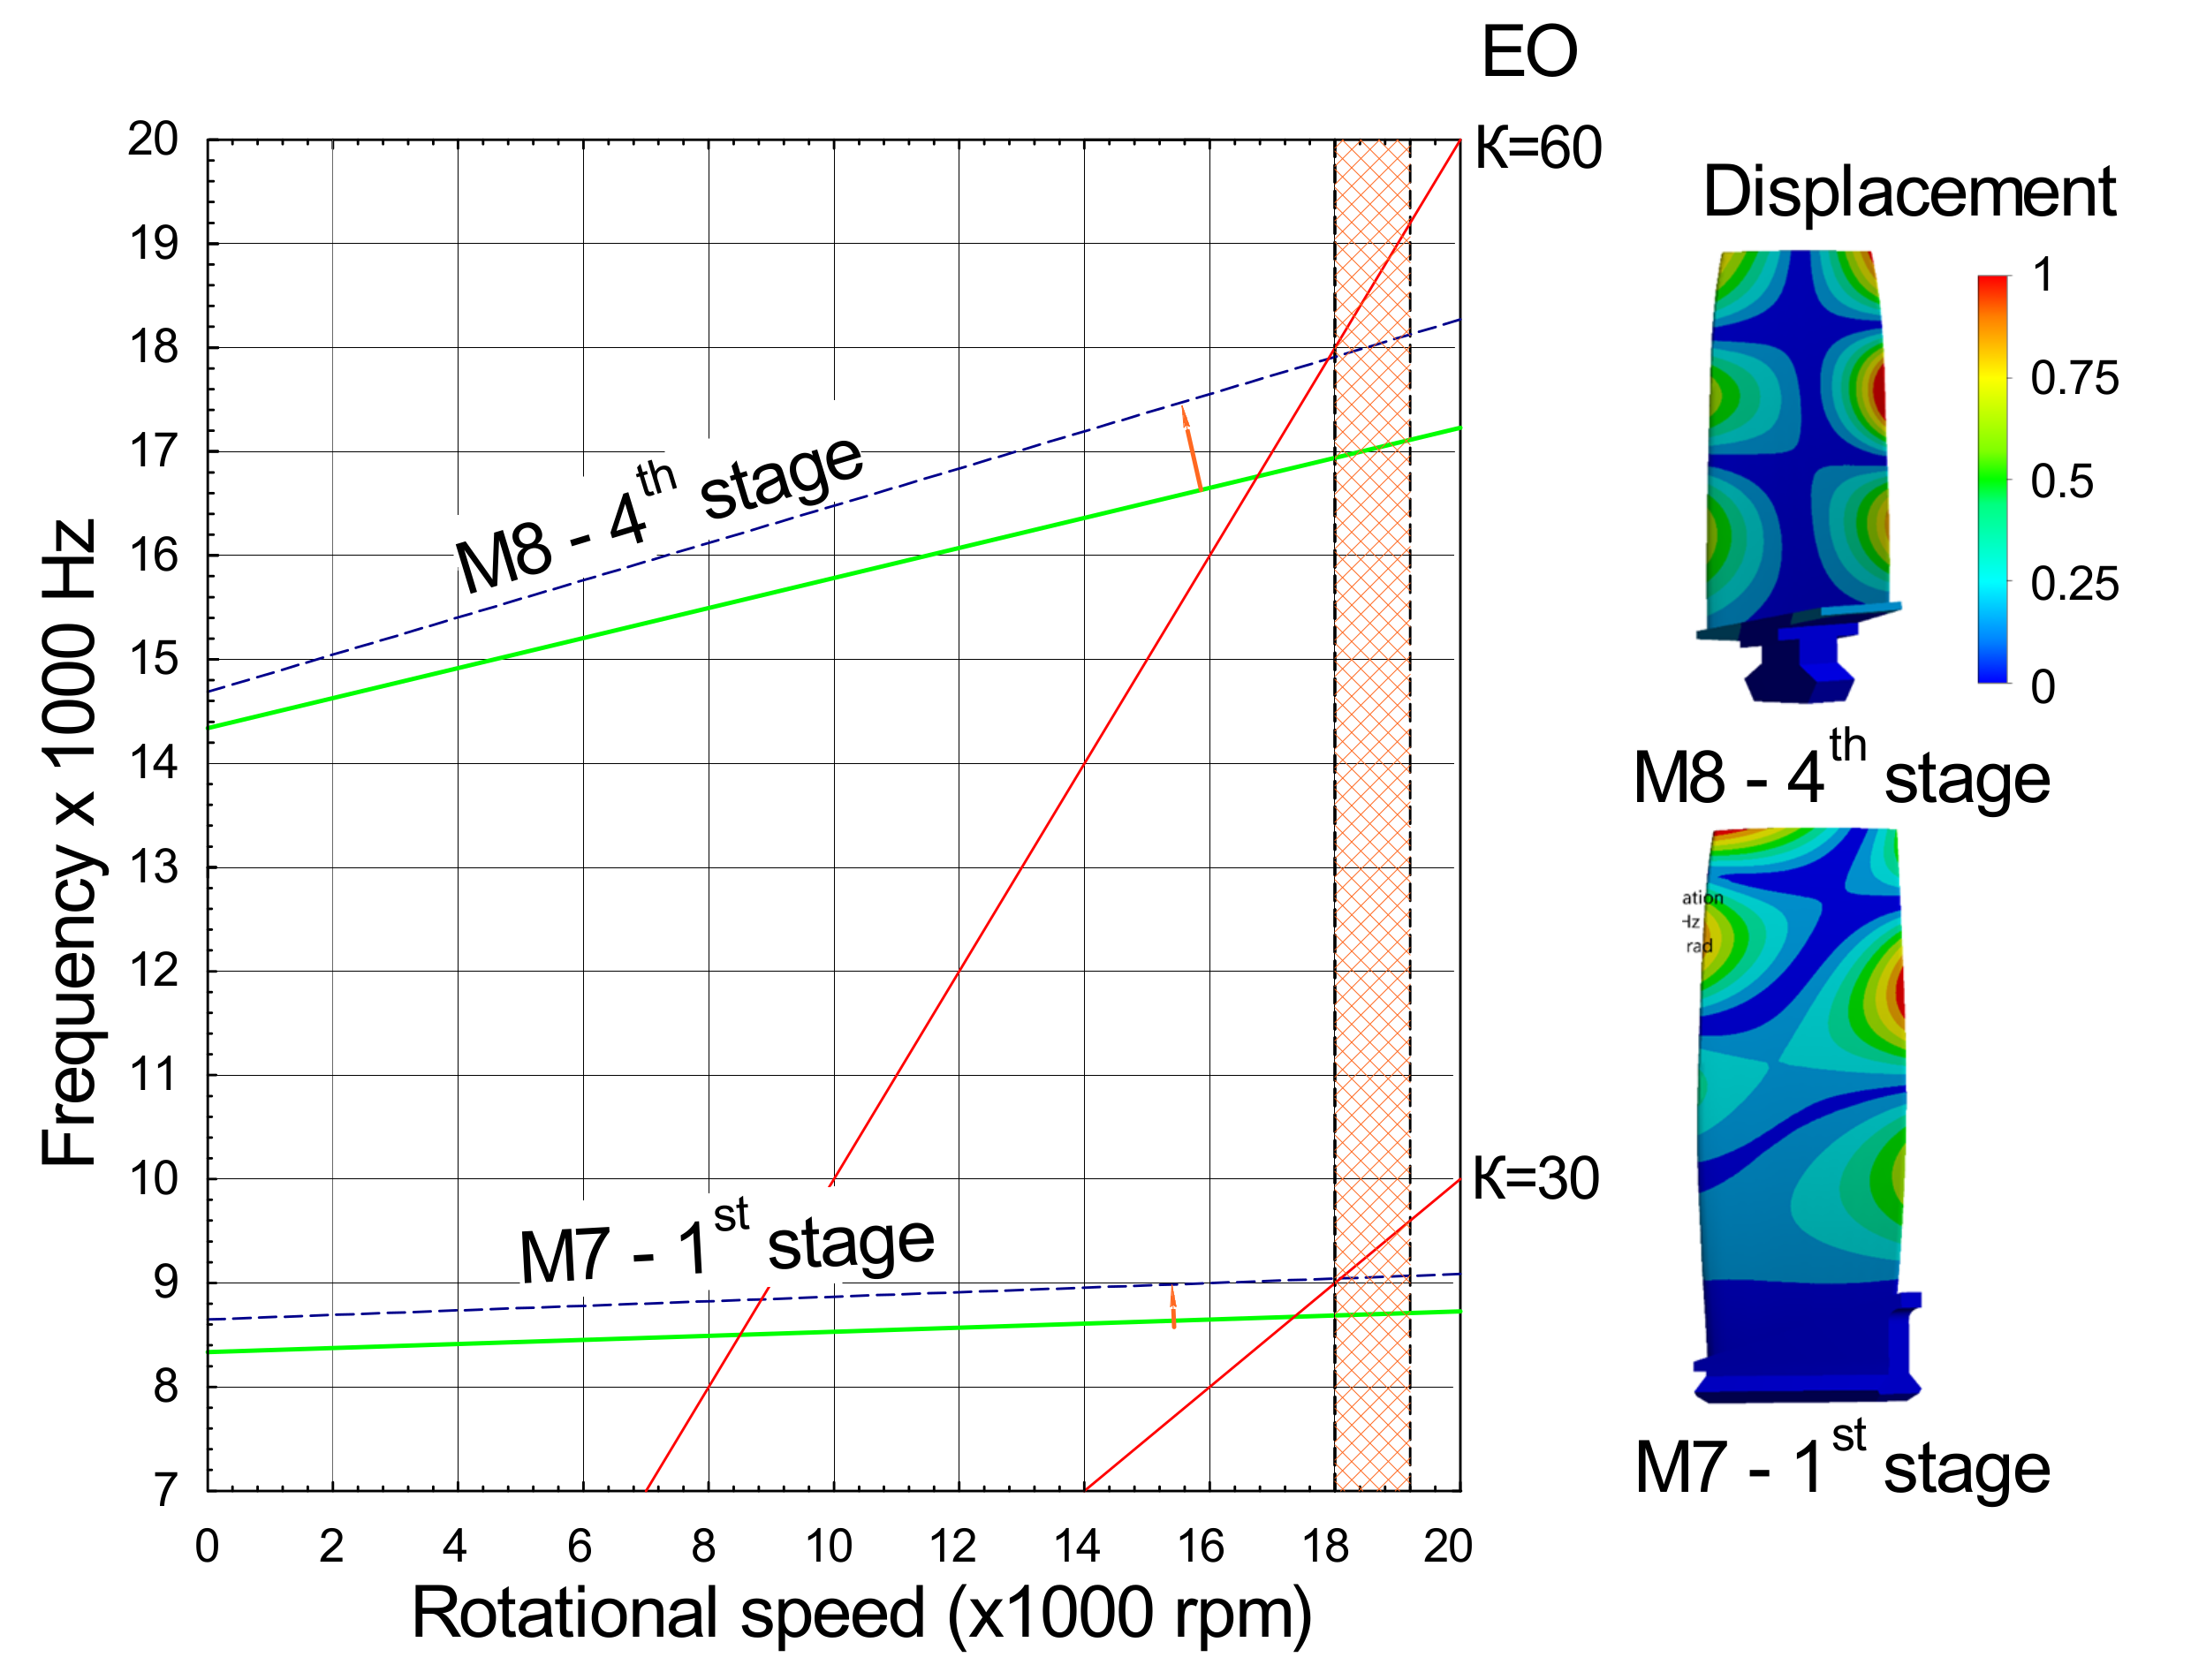
To assess the effect of wear on the natural frequency of the vibration, a modal analysis was performed (Figure 10). For each stage, an individual Campbell diagram was developed describing the nominal and worn profile of the aerofoil. Erosion significantly increases the natural frequencies of the blades. The analysis reveals several resonances excited by engine orders. Some stages were identified with a risk of resonance in the operating speed range (Figure 11).
Stages and modes for which the risk of resonance is identified:
- M7 of the first stage resonates with the EO30 due to the number of the inlet guide vanes. This resonance is possible at 4 mm chord wear at the tip;
- M8 of the fourth stage resonates with the EO60 due to the number of the guide vanes of this stage. Resonance occurs when chord wear equals 6.3 mm.
3.3. Particle Separator
A particle separator cleans the air entering the engine from dust, sand, dry twigs, leaves, and other foreign objects during taxiing, take-off, and landing from unpaved runways or landing areas [39]. When IPS is turned on, with the engine running, hot air from the compressor enters the dust ejector nozzle. At the same time, as a result of centrifugal forces, part of the airflow entering the engine is pressed to the rear of the central fairing and enters the separator inlet. Most of the cleaned air passes through a separator to the engine inlet. Contaminated air, including foreign particles, enters the dust exhaust pipe, in which a vacuum is created by the ejector. Thus, particles are expelled into the atmosphere.
The results of modeling the speed and trajectory of foreign particles of various sizes flowing in the gas path showed that most of the particles are separated along the internal curved surface of the IPS due to the action of centrifugal forces. However, experience from the operation of helicopters in a dusty environment shows that the use of a particle separator of this type does not solve the problem of erosive wear of compressor aerofoils [38].
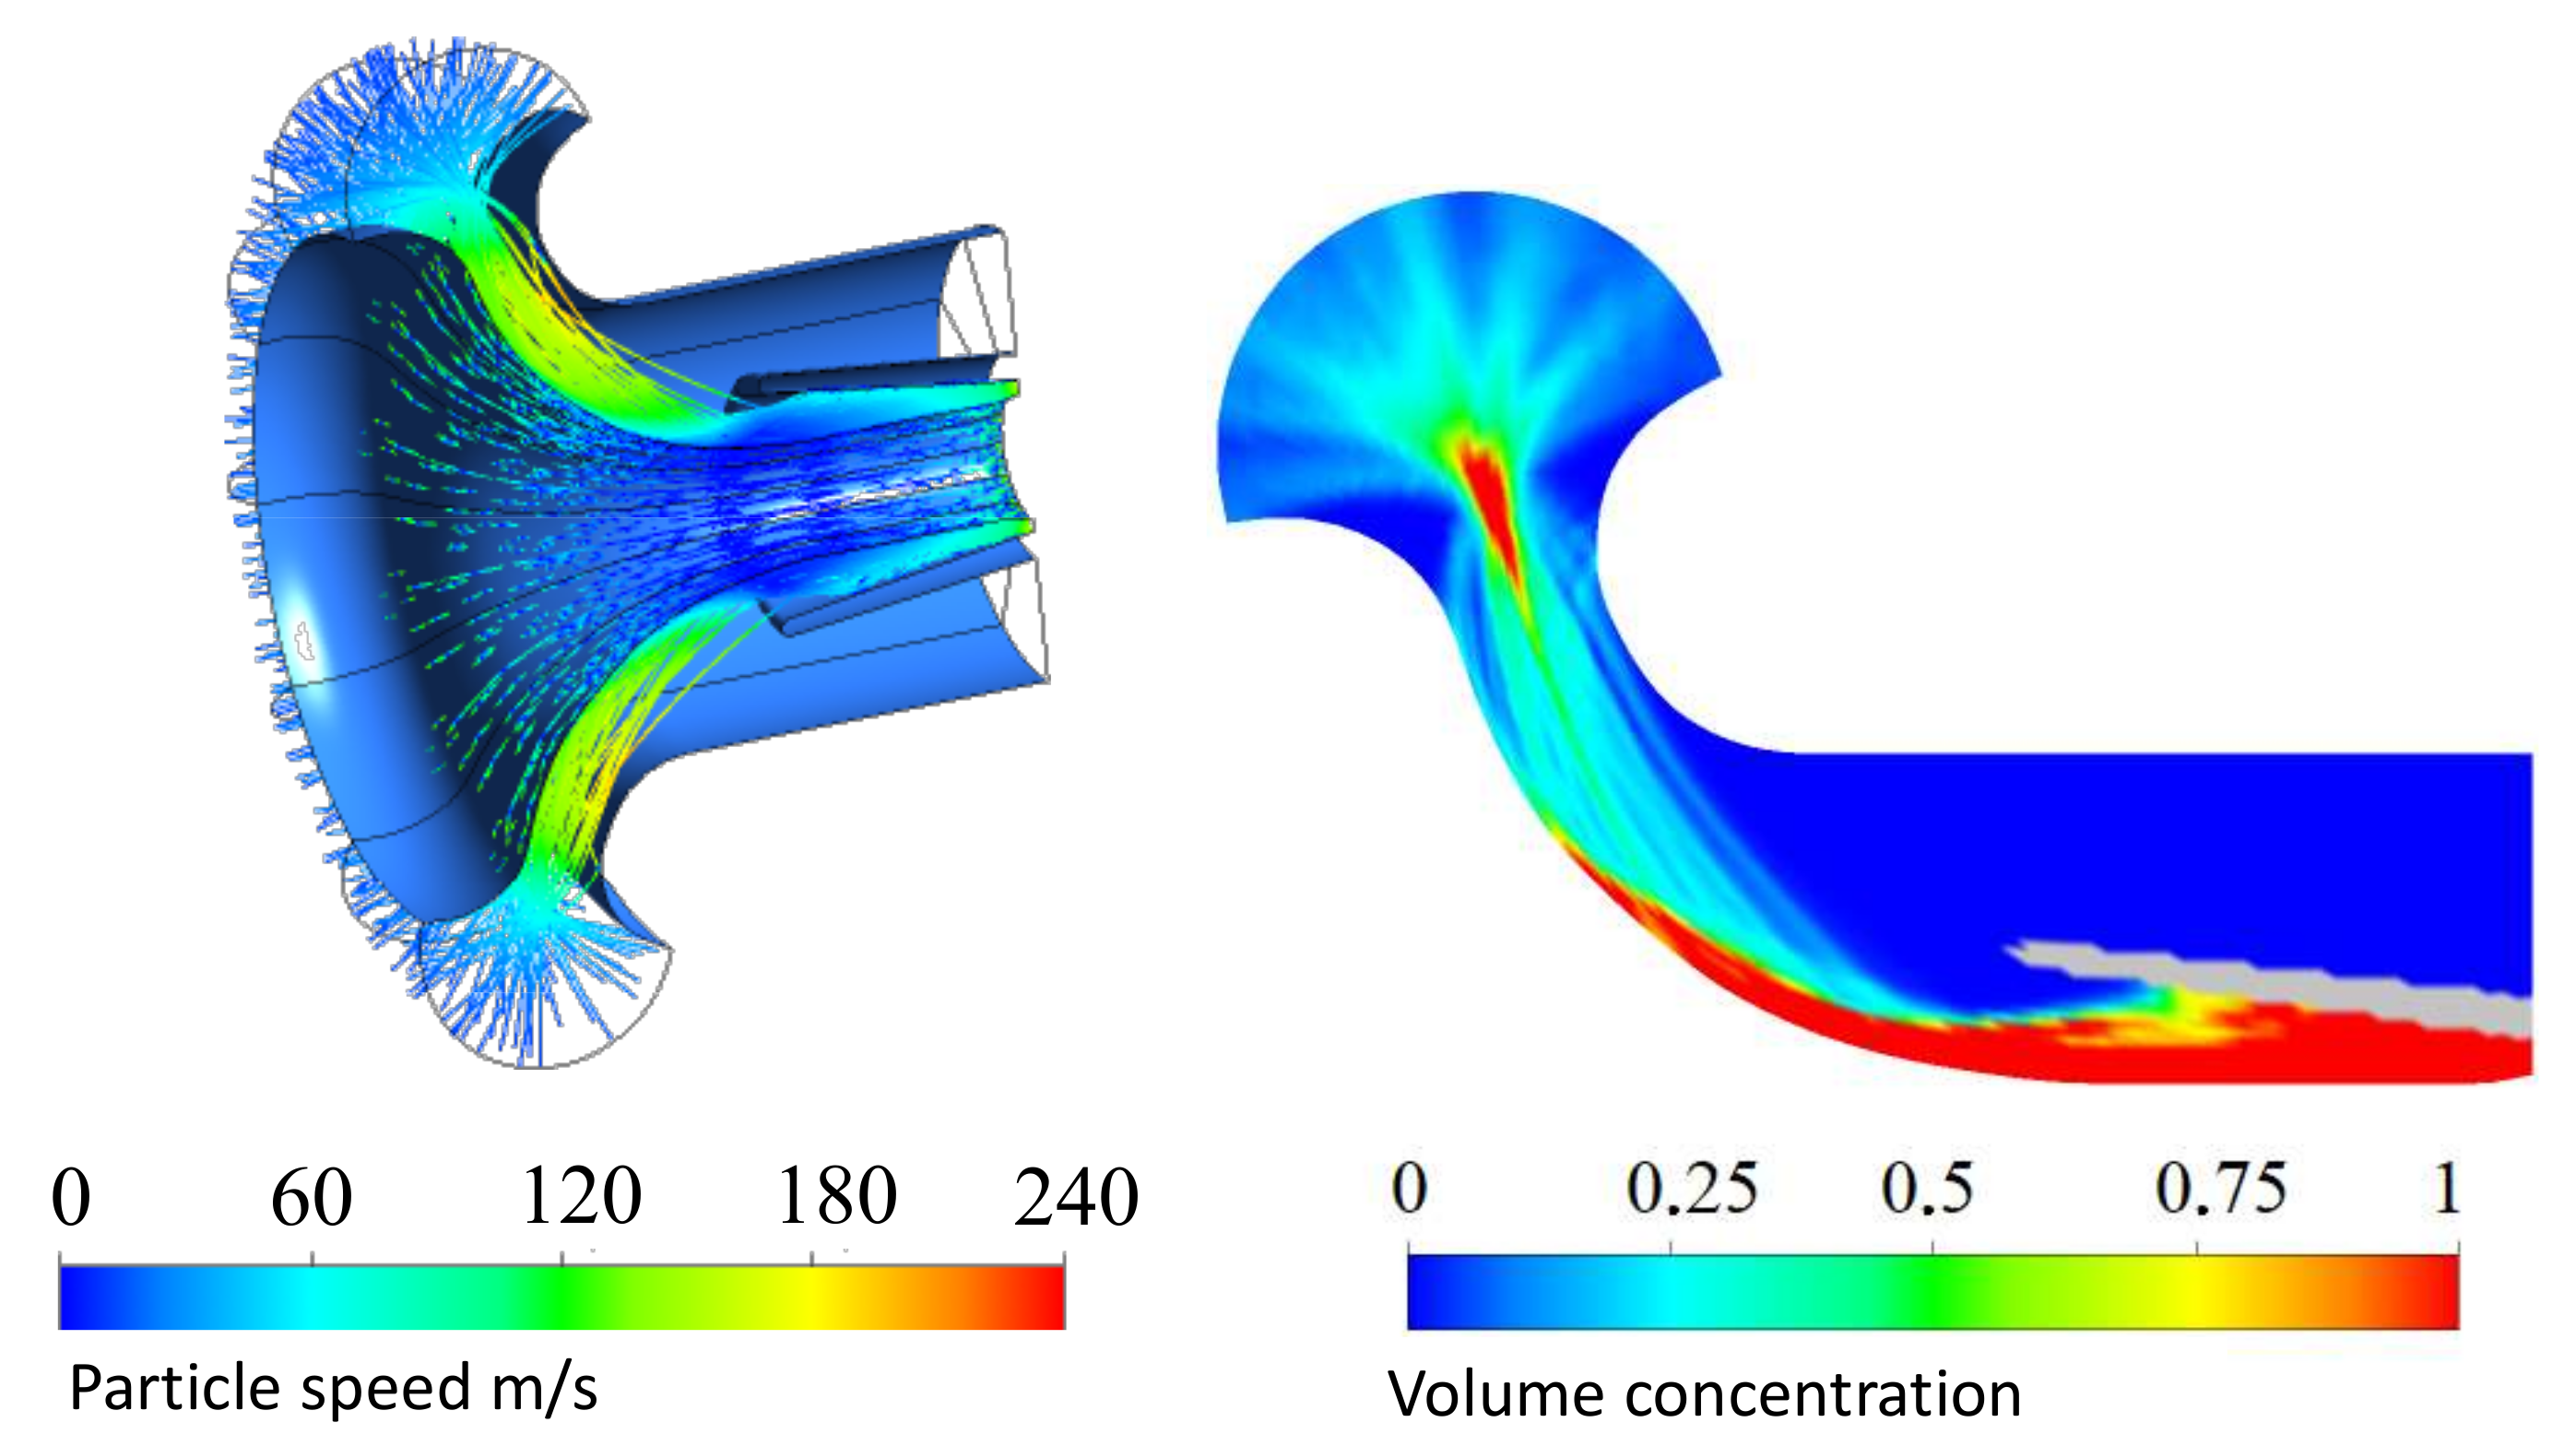
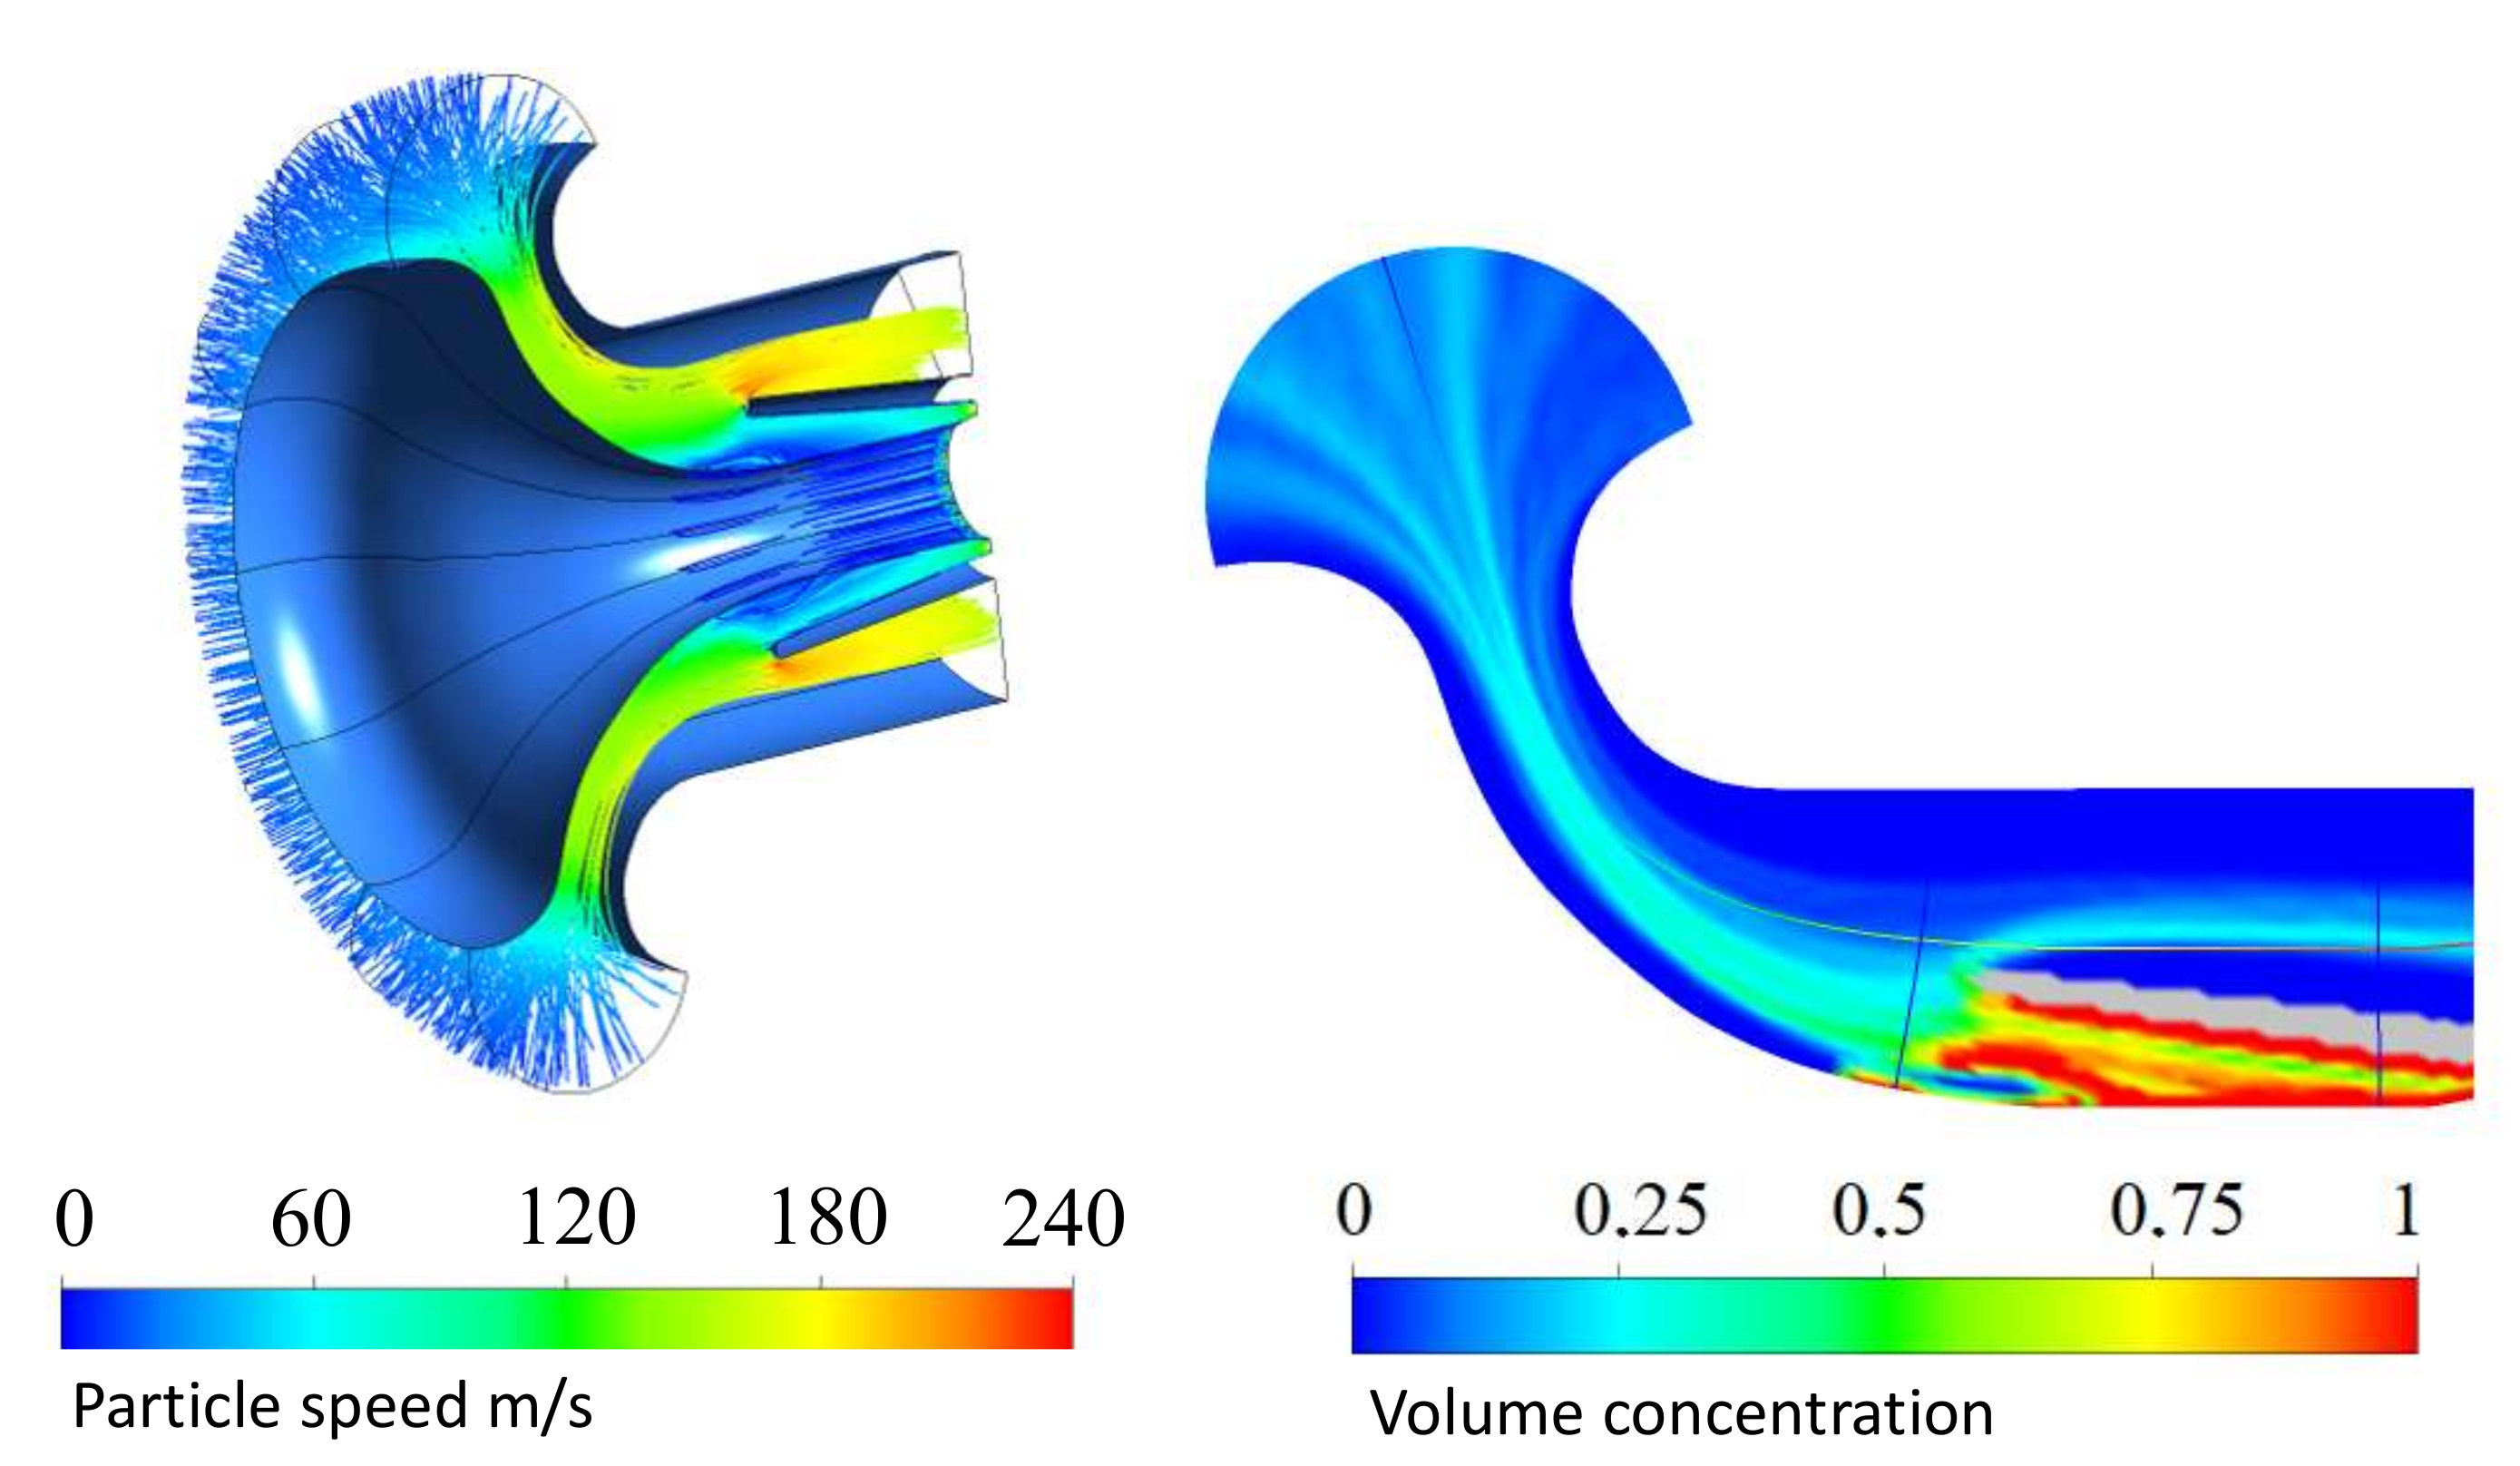
IPS is effective at separating large fractions of particles ranging from 50 to 100 , almost completely cleaning the air supplied to the engine compressor (Figure 12). If the particle size is relatively small—from 10 to 50 , about 20% of the particles enter the engine compressor bypassing the IPS separator under the influence of viscous forces following the flow. (Figure 13).
3.4. Stall Margin Analysis
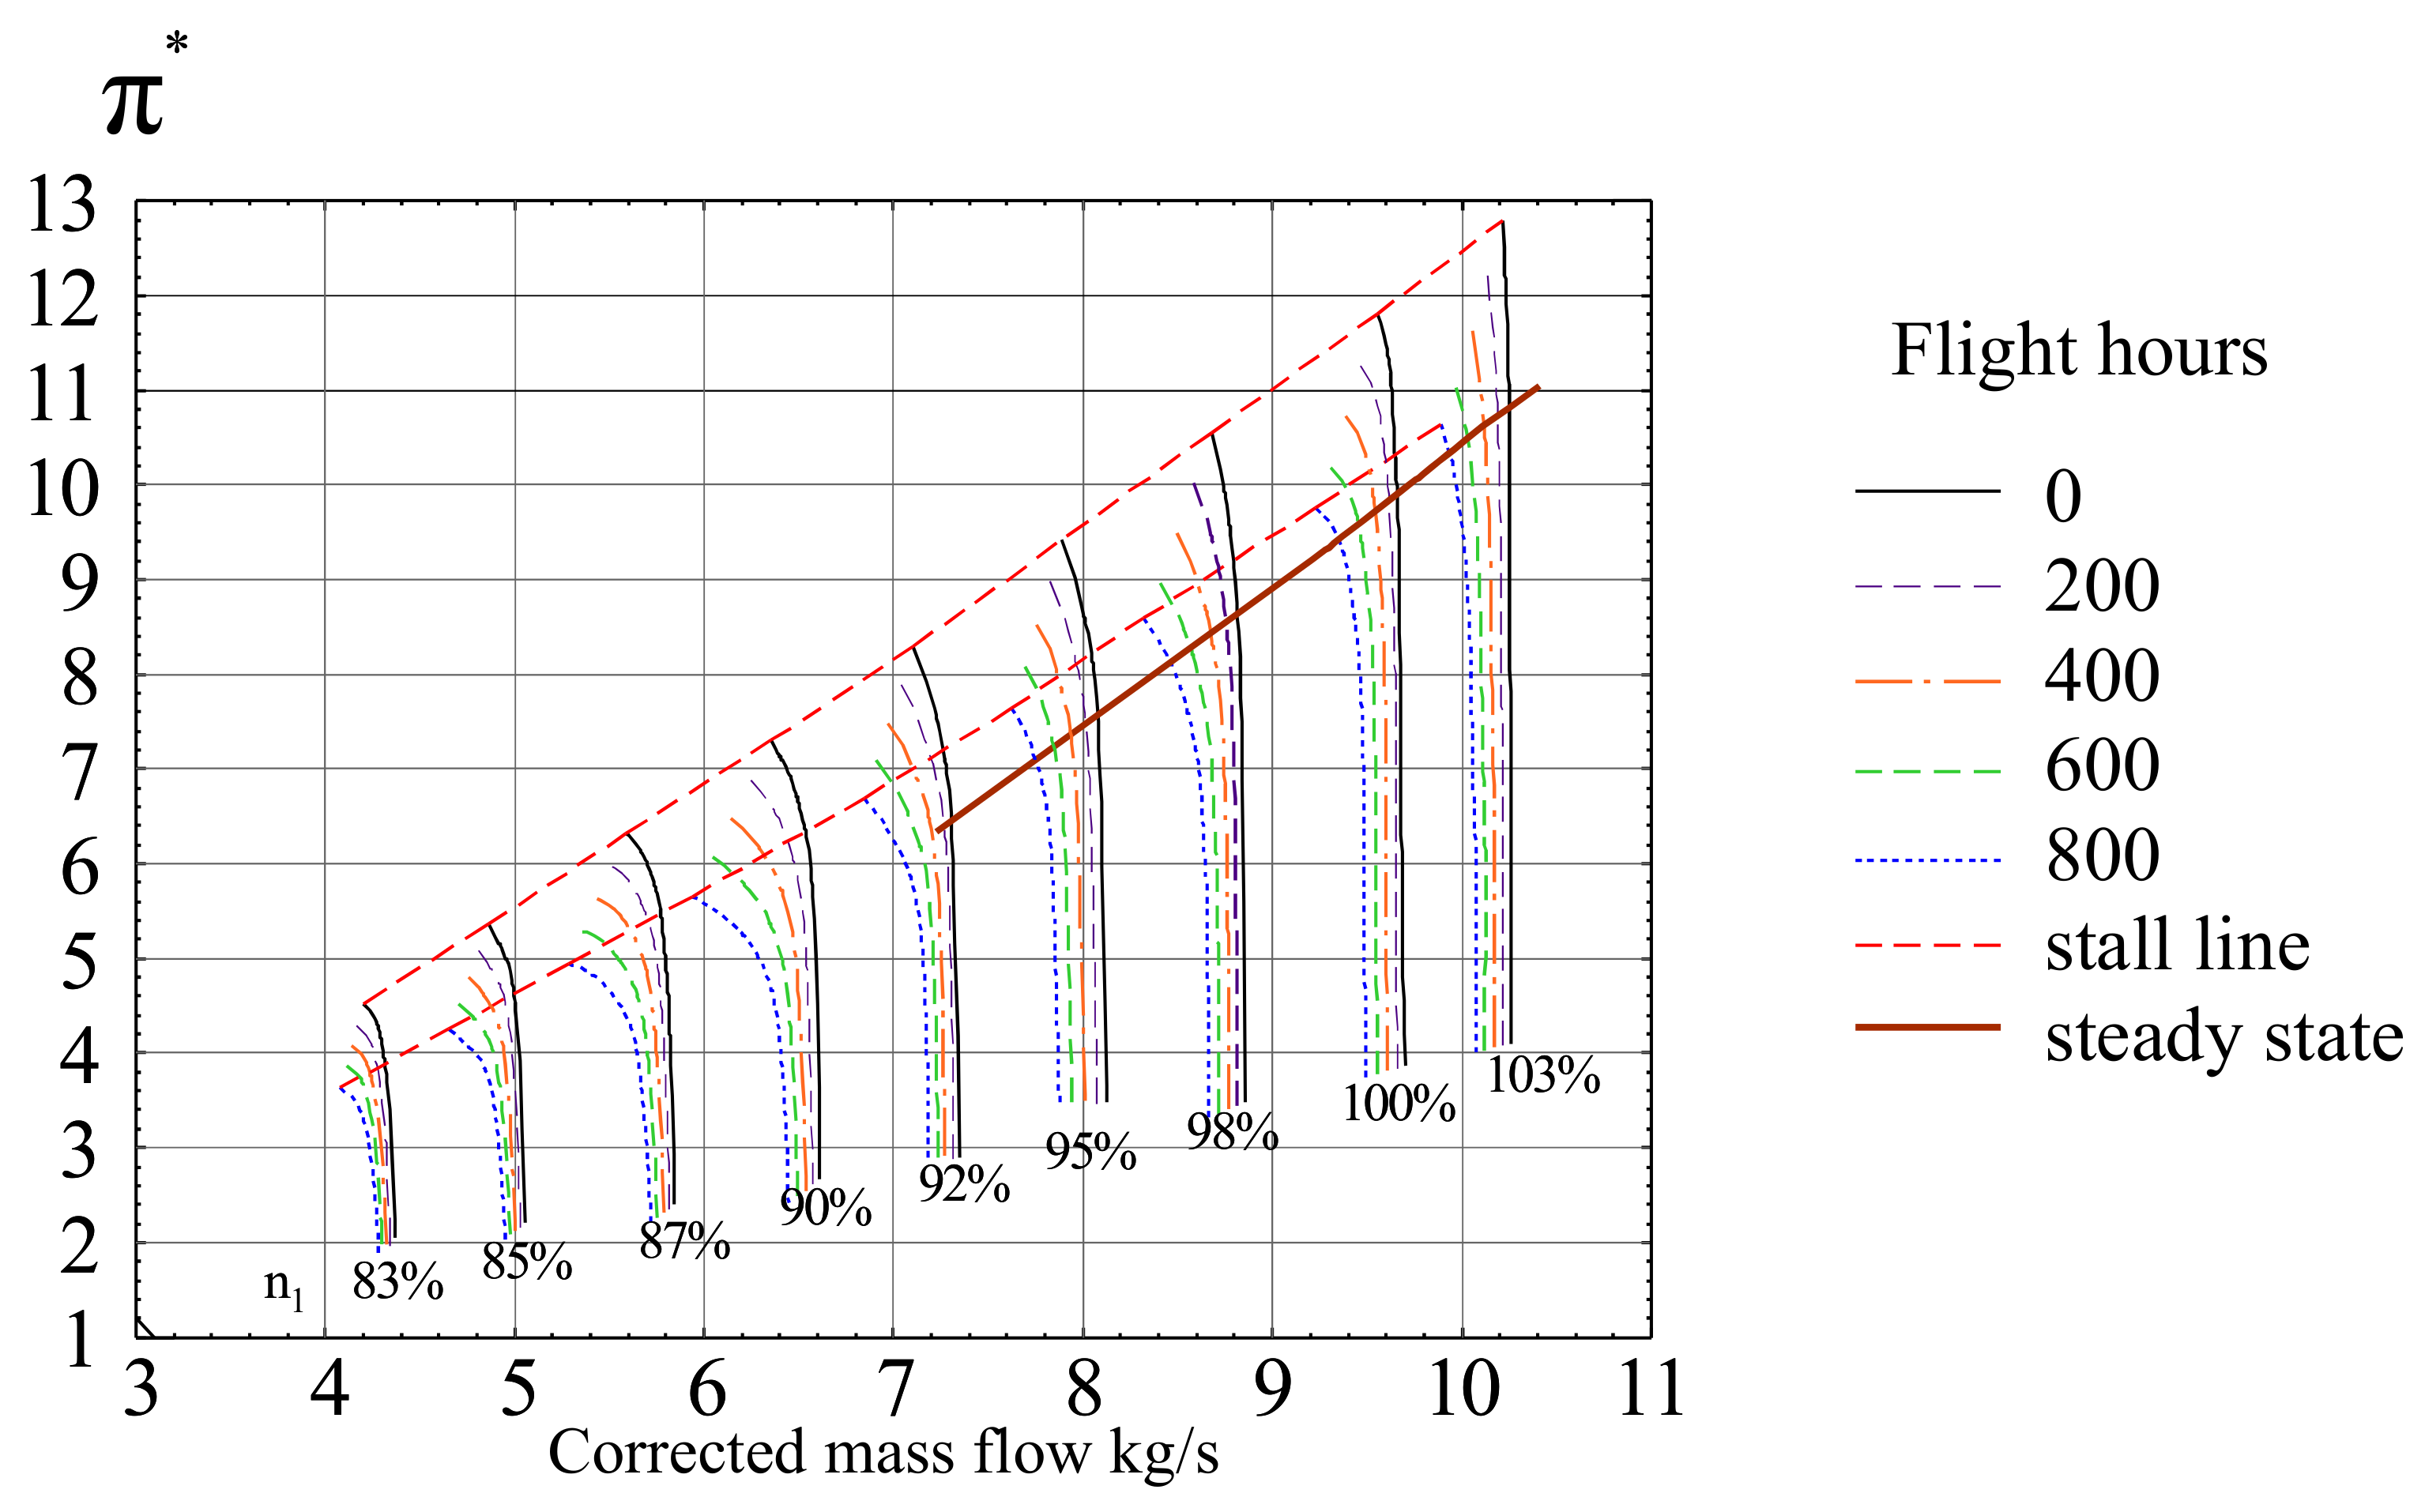
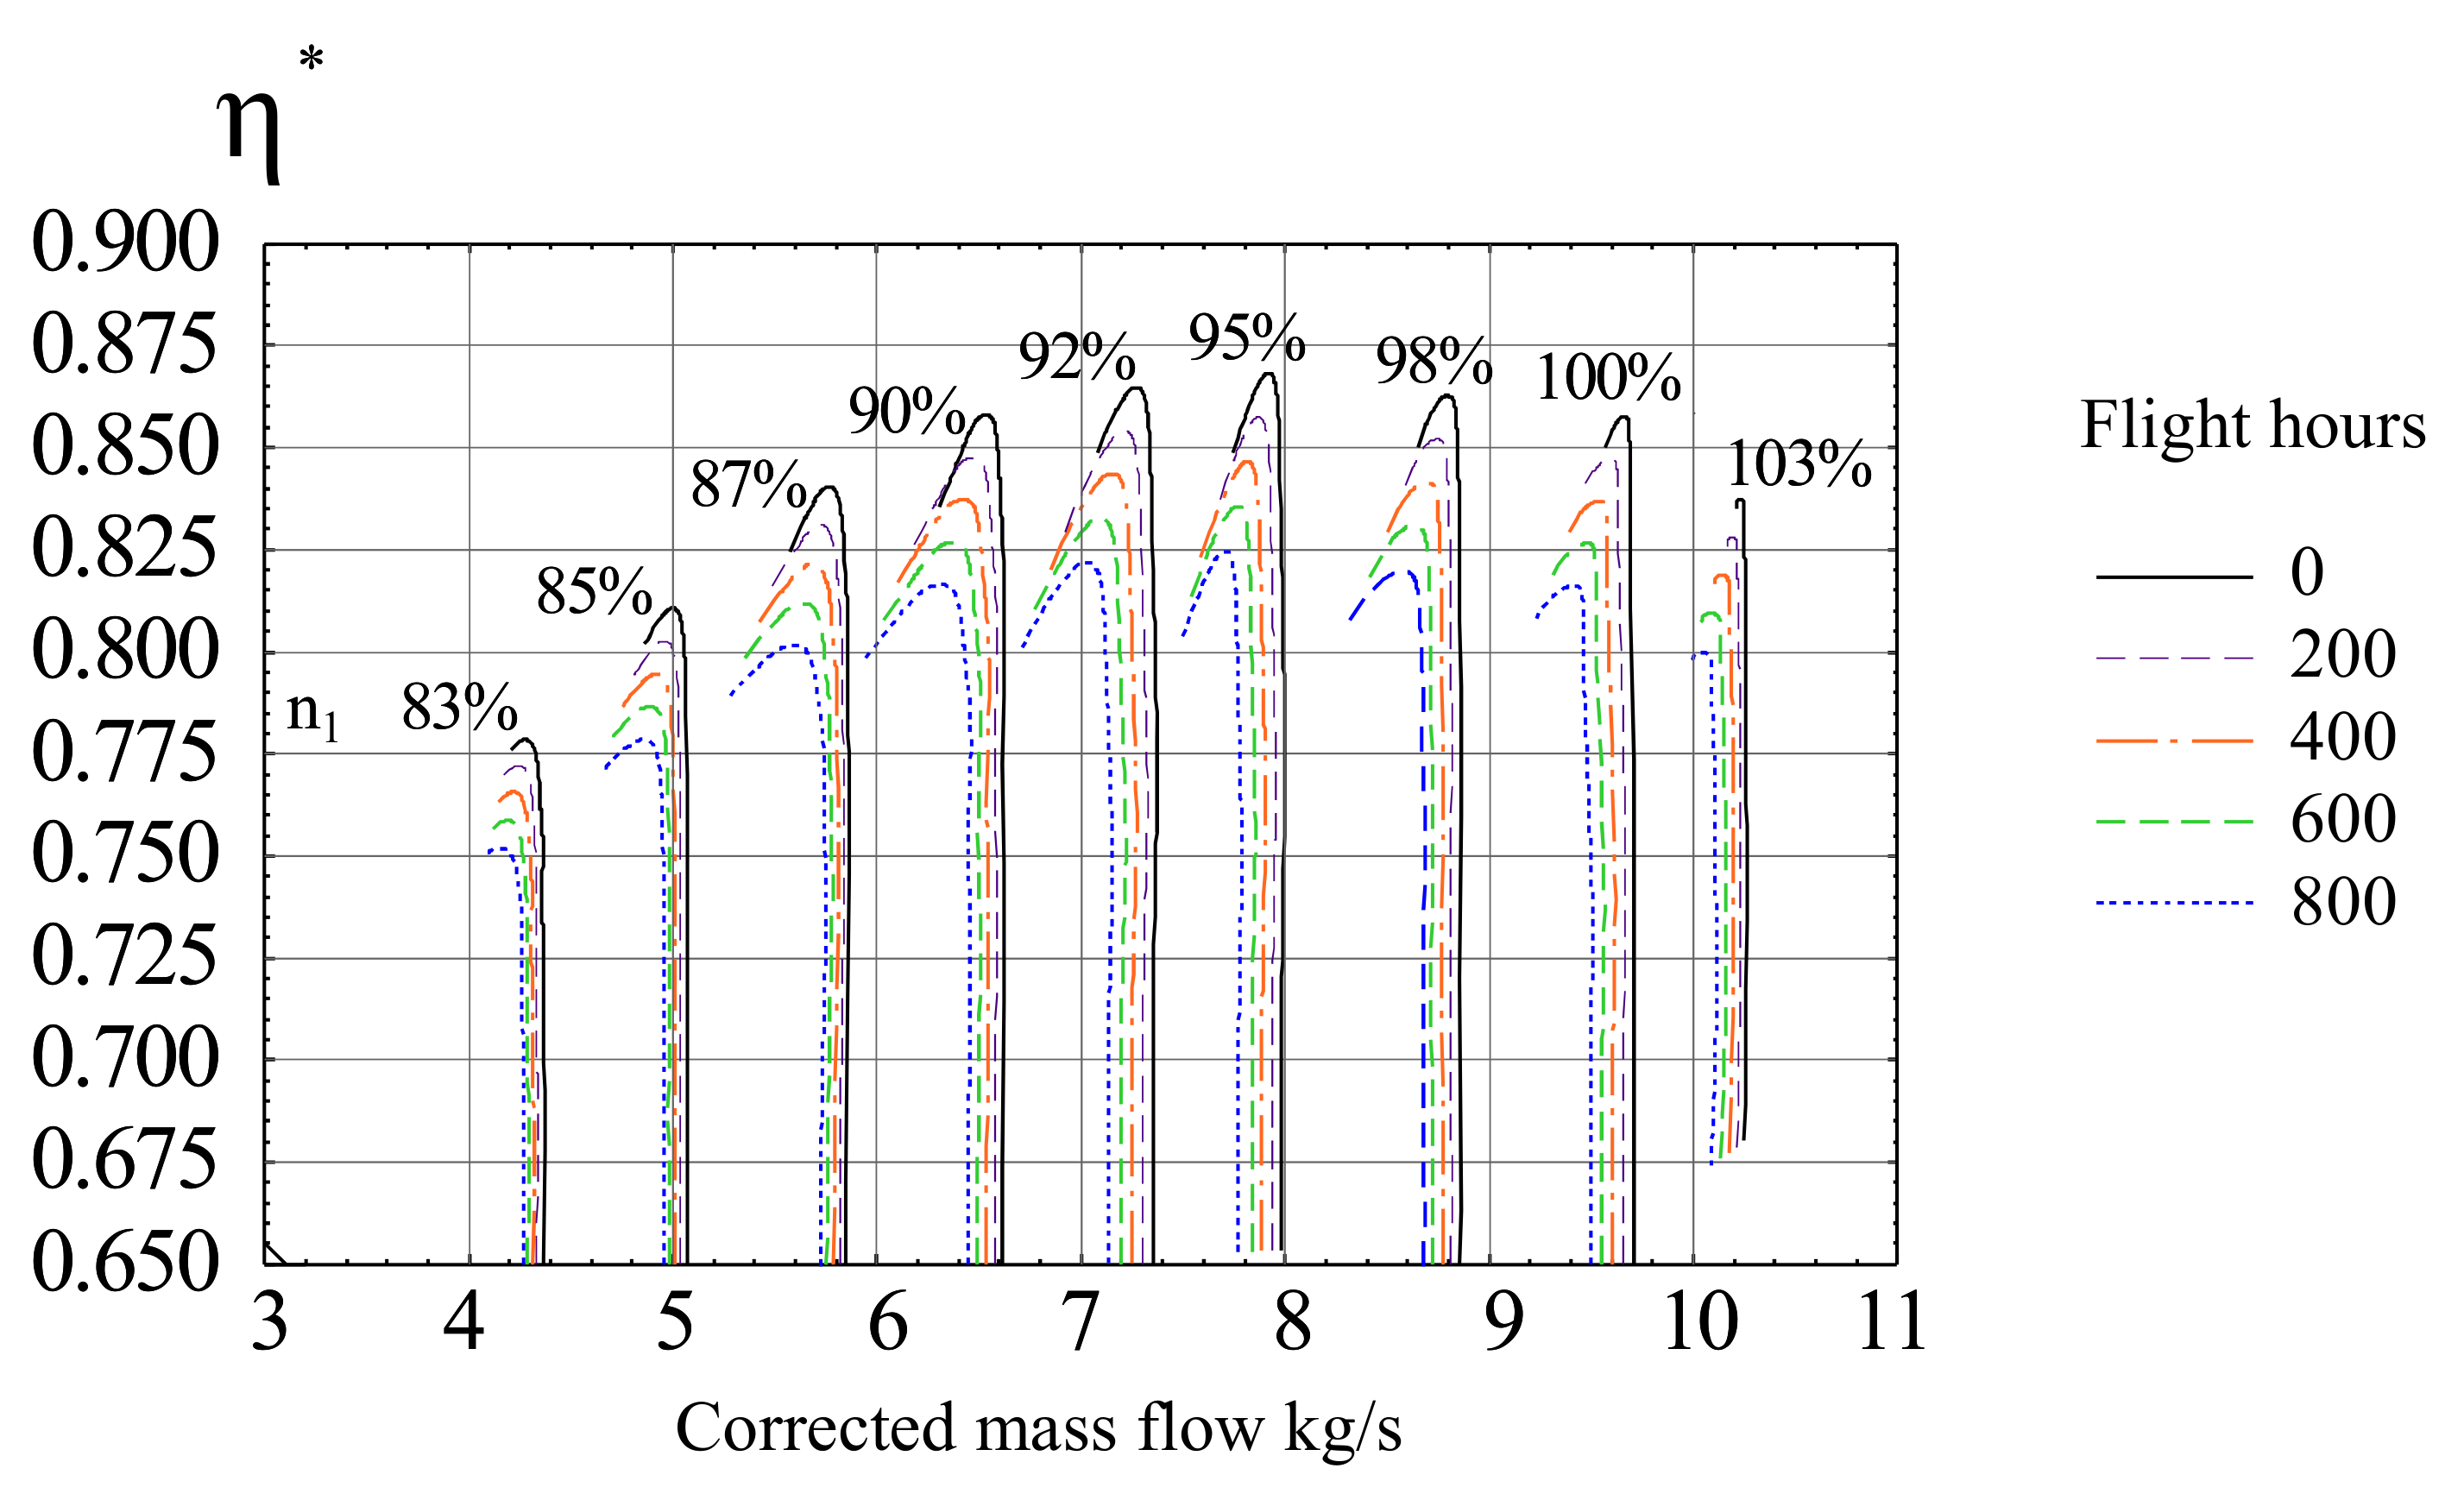
To assess the effect of erosion on the compressor performance, the flow for the nominal (initial) geometry of the blades, as well as the geometry corresponding to the engine operating time of 200, 400, 600, and 800 FH was simulated. Compressor pressure maps (Figure 14) and efficiency maps (Figure 15) were calculated and validated by comparison with available test data from a compressor rig and test cell.
The compressor maps plotted as a function of flight hours show that with increasing intensity of blade wear, the pressure ratio and its efficiency decreases. Consequently, the stall margin (SM) is also reduced (Figure 14). It was calculated using the following formula:
where is the pressure ratio for the stall line, and is the pressure ratio for the steady state line.
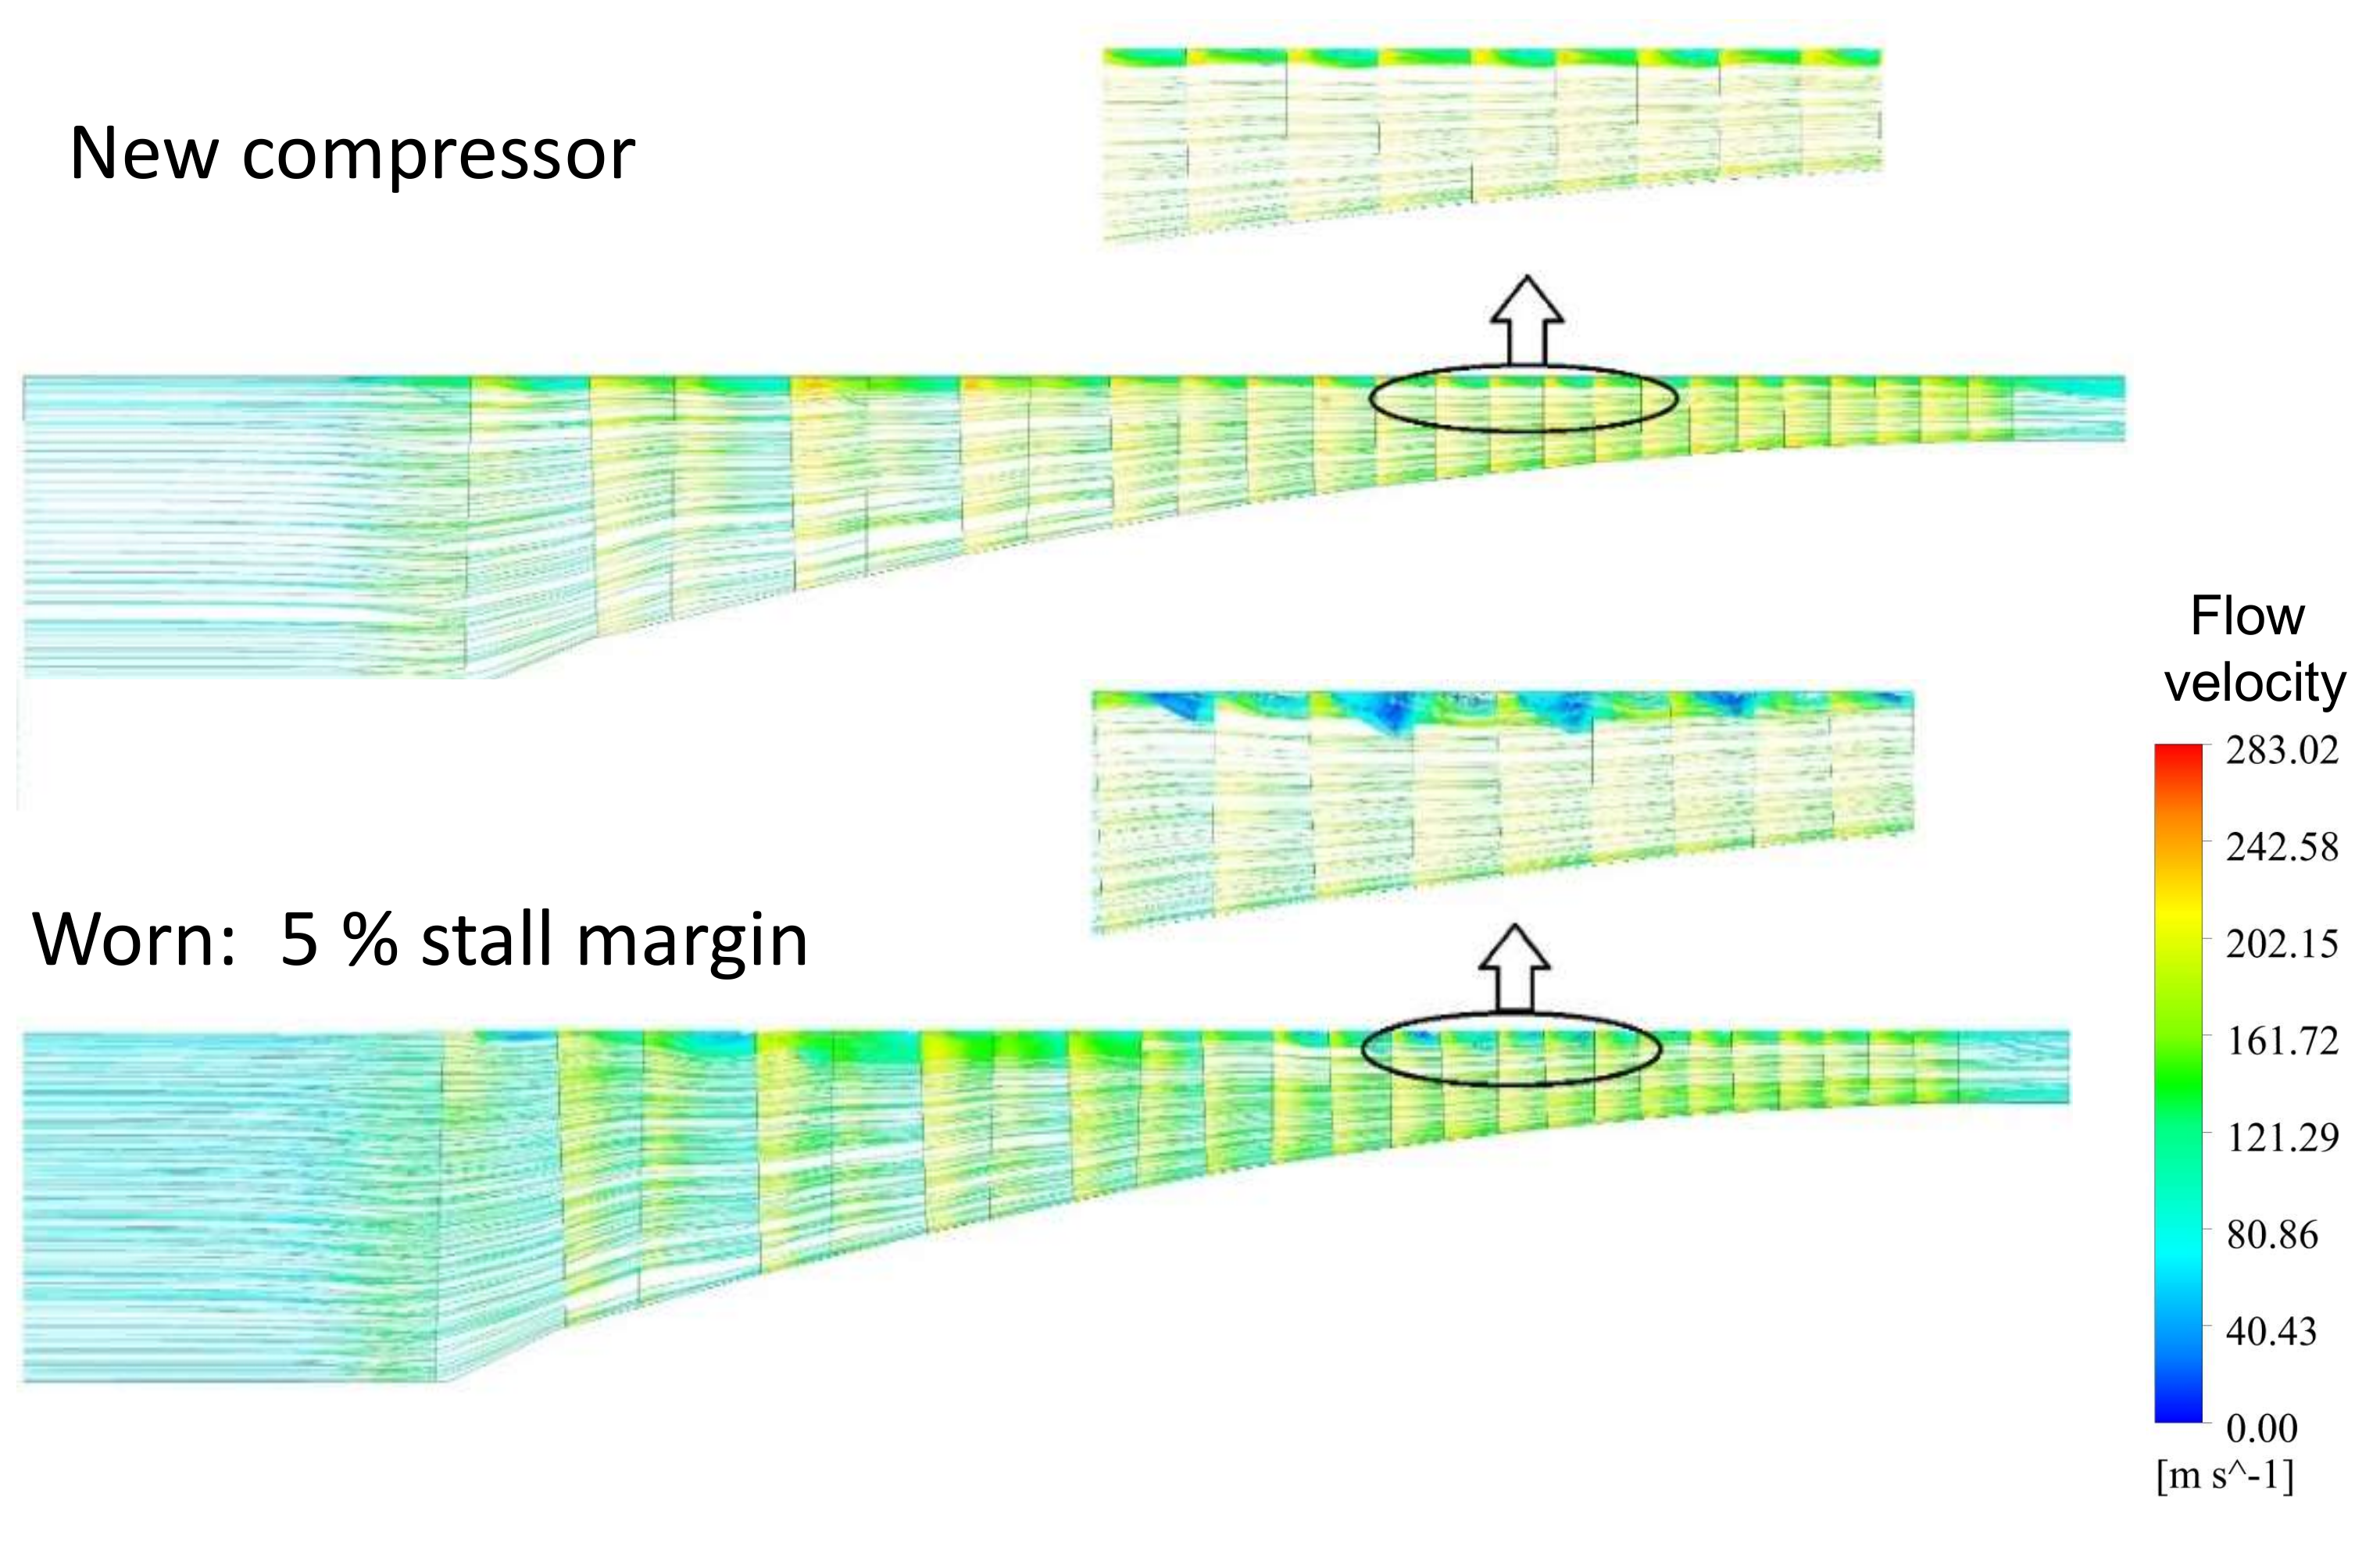
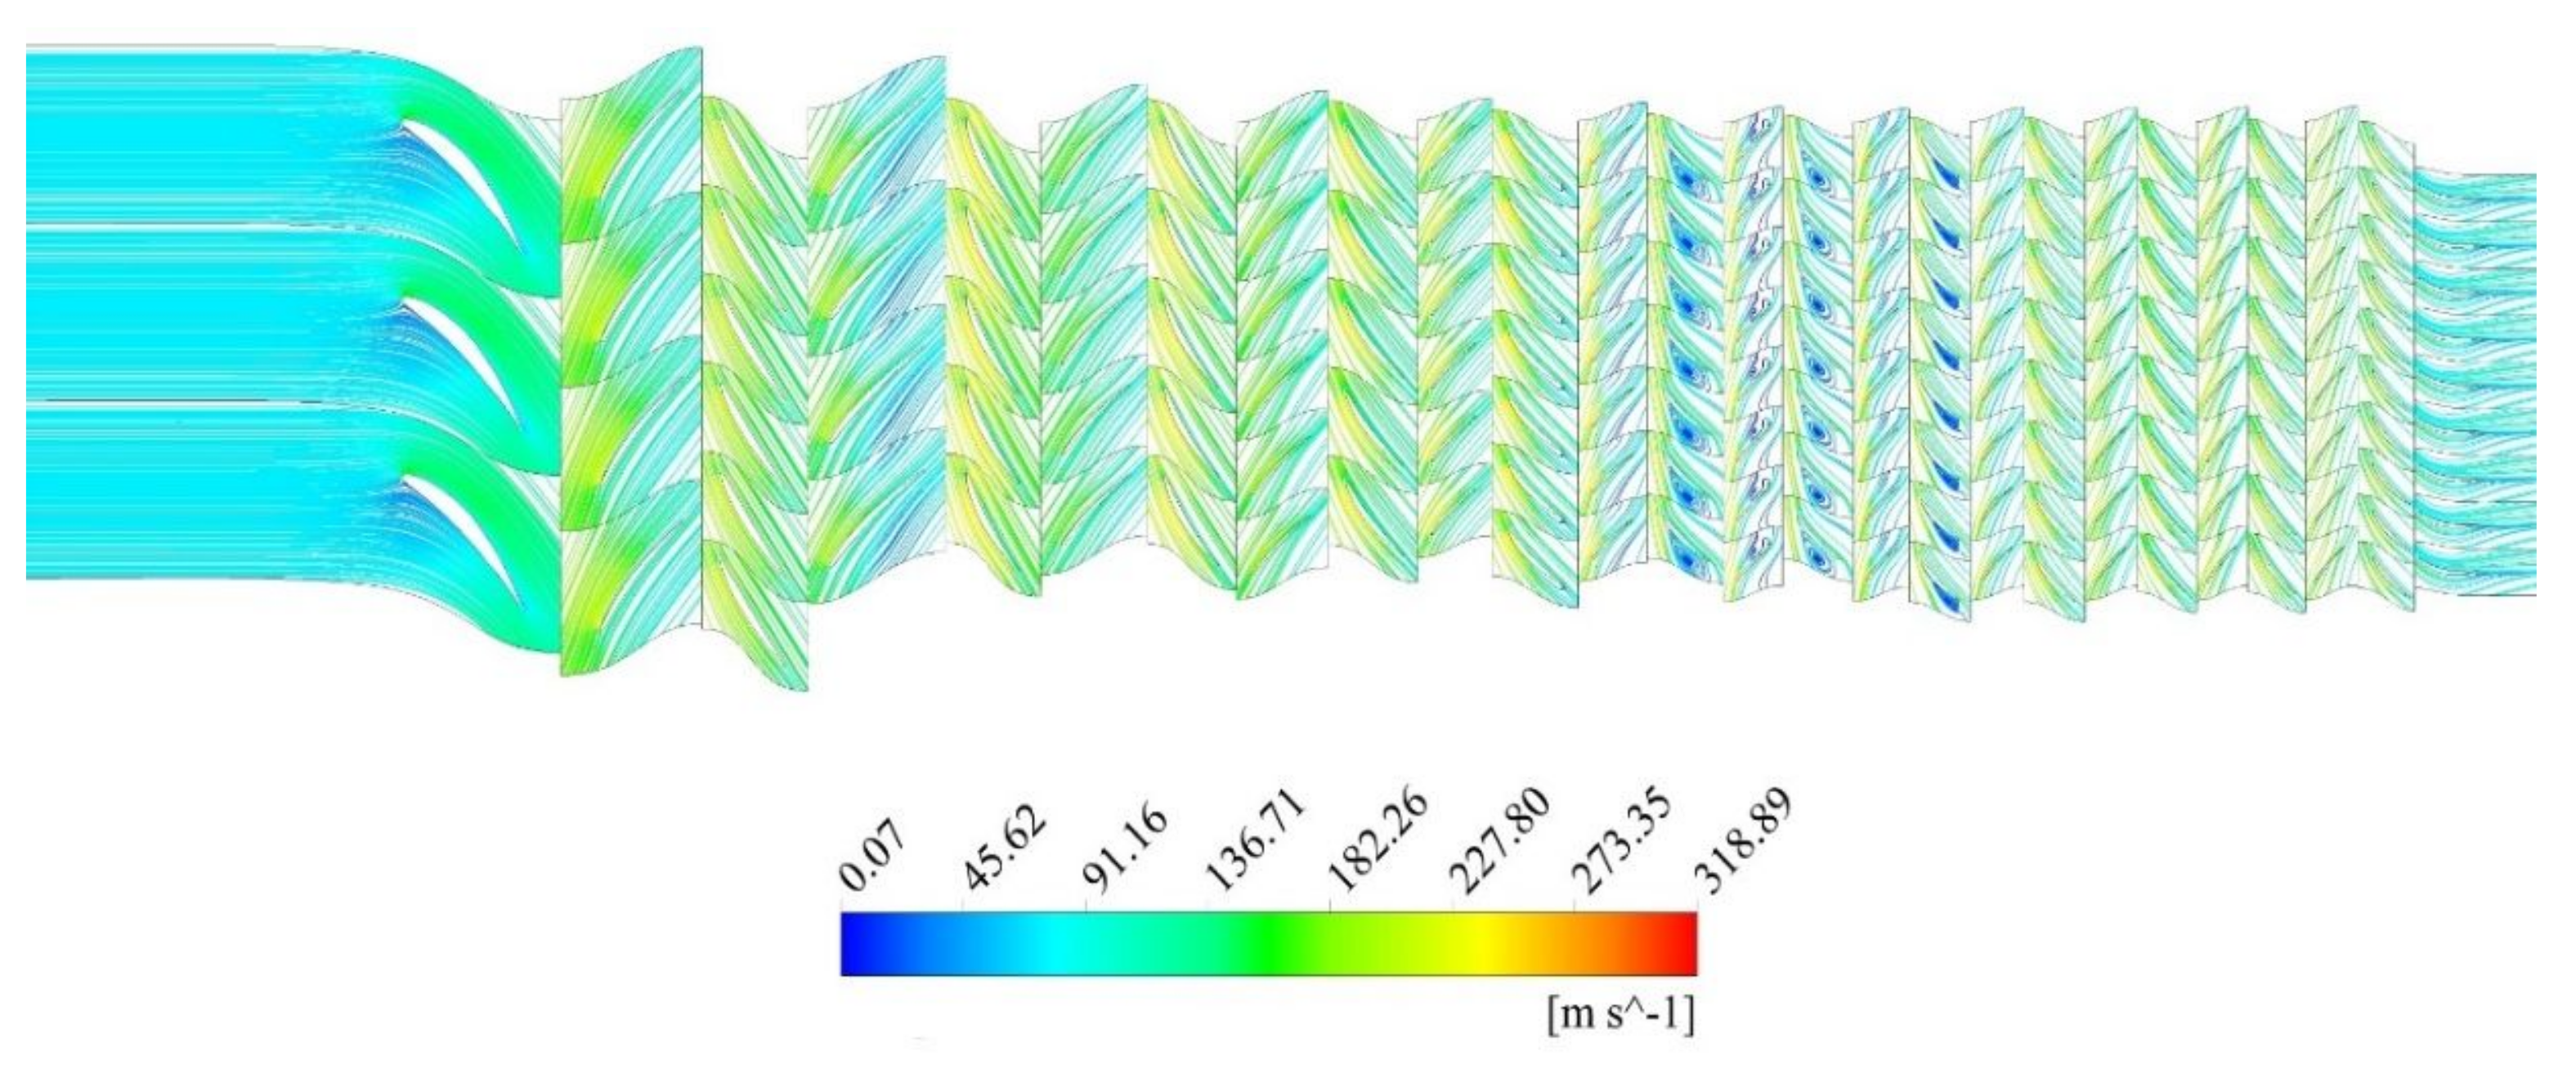
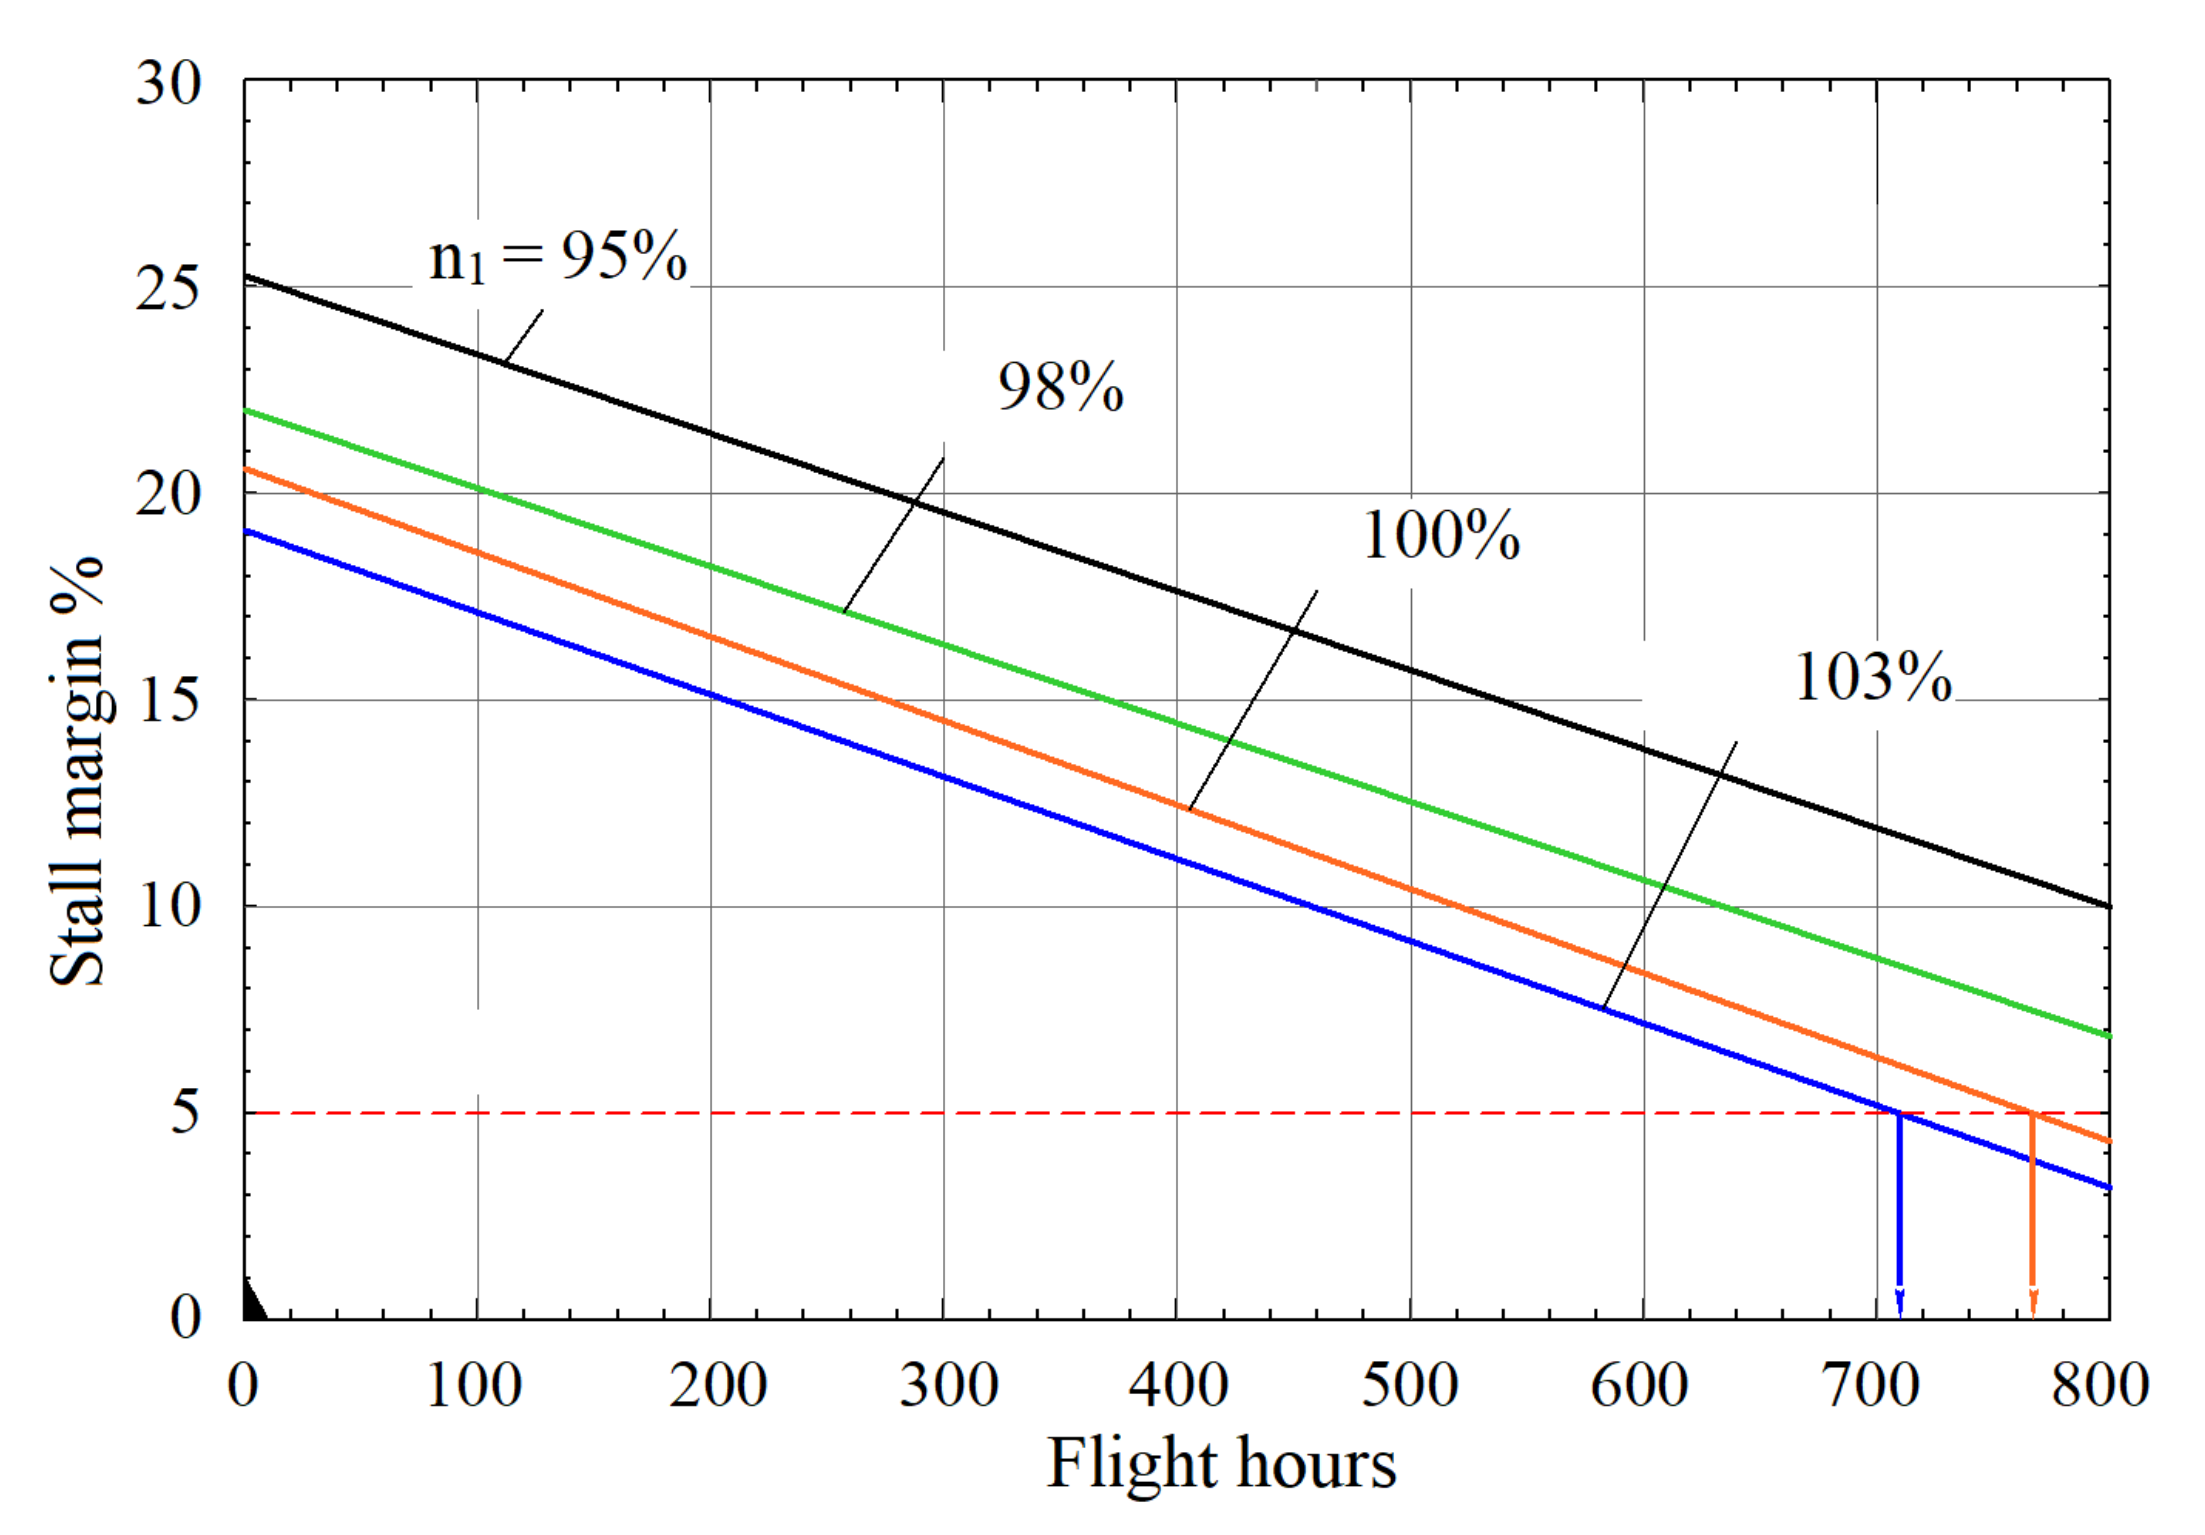
A decrease in the stall margin of the compressor by 15% causes the appearance of a surge during test-cell testing of TV3-117 engines. The analysis of flow through a compressor with blades of varying degrees of wear (Figure 16 and Figure 17) showed that as a result of erosive wear of rotor stages 6–9, the compressor develops a stall in the high speed range, which leads to a surge. The reason for this phenomenon was chord reduction and an increase in the radial clearance. For this reason, the compressor operated in a dusty environment reaches its serviceability limit after 730–750 FH (Figure 18).
4. Conclusions
On the basis of the analysis of the geometry of the compressor blades of the TV3-117 engines operated in a dusty environment, it was found that the wear of the blades in all compressor stages occurs uniformly. When the particle separator is used, the largest chord wear is observed for stages 1–6. As a result of a close correlation of chord wear in stages 2–12, their wear can be related to the sixth stage.
An original methodology was developed to assess the influence of erosive wear of blades on compressor performance by modeling three-dimensional flow for various degrees of wear of all rotor stages. It involves measuring the chord wear of blades, calculating the natural frequencies of vibration whilst taking into account the aerofoil wear, numerical calculation of the compressor flow, and analyzing the onset of stall. This approach in combination with established patterns of chord wear over engine operating time allowed for the assessment of the serviceability limits of the blades.
On the basis of a modal analysis of compressor blades with different operating times, the dependency of blade vibration frequency on the chord wear for all stages was established. It was found that when the chord of the first-stage blades has worn more than 4 mm, M7 EO30 resonance can occur. Similarly, chord wear of the forth-stage blades higher than 5.1 mm causes M8 EO60 vibration. The HCF risk for the remaining stages is negligible.
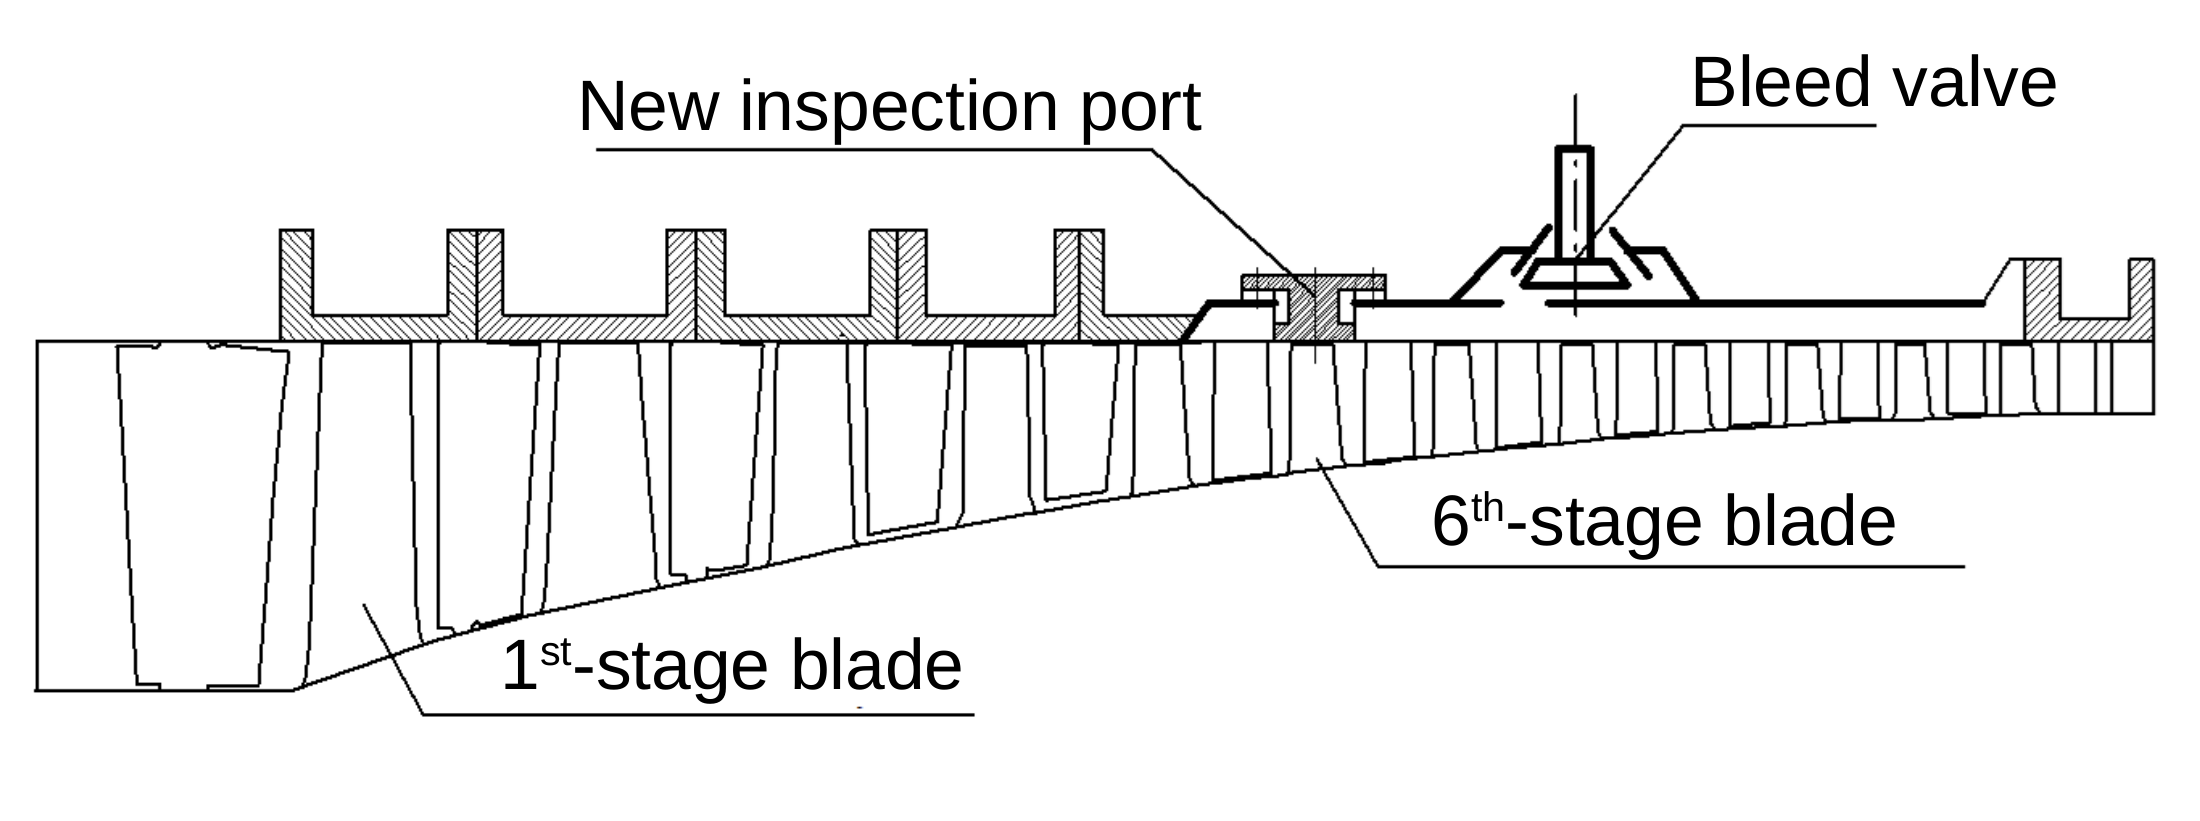
The values of the maximum permissible chord wear of the blades of all stages are determined by the criterion of stall margin of the TV3-117 turboshaft. The chord wear of the sixth-stage blades of 6.19 mm is critical because it is accompanied by a decrease in the stall margin of the compressor by 15–17%, which indicates the appearance of a permanent stall at 770–790 FH. An additional slot for the optical inspection of the sixth stage was designed to allow for field maintenance (Figure 19).
The standards applicable today determine the maximum chord wear of a blade at the level of 2 mm at the tip, regardless of the use of particle separators. The criteria established in terms of natural vibration frequency and the stall margin allow for an increase in the time between overhauls (TBO) by 200 FH. The defined serviceability limits of the blades enable helicopter users to significantly reduce operating costs by extending the RUL of the engines operated in a desert environment.
The presented methodology can be utilized. However, further studies and more field data are needed to estimate the wear rate of compressor blades operated in other environments. For lower dust concentrations or more effective inlet protection, a more sophisticated model will be necessary to describe particle deposition in the compressor as well as the hot section. Large fleets may require machine learning tools to model significant amounts of diverse and variable data.
Author Contributions
Y.D. and D.P. conceived and designed the research; Y.D. processed and analyzed the data; Y.D. and D.P developed FEM and CFD models; D.P. and R.P. verified and evaluated the results. Y.D. and R.P. drew conclusions and produced the paper.
Funding
This research received no external funding.
Acknowledgments
This publication was prepared within the framework of the AERO-UA project, which has received funding from the European Union’s Horizon 2020 research and innovation program under grant agreement No 724034.
Conflicts of Interest
The authors declare no conflict of interest. Motor Sich JSC had no role in the design, execution, interpretation, or writing the study. The views, information, or opinions expressed herein are solely those of the authors and do not necessarily represent the position of any organization.
Abbreviations
The following abbreviations and symbols are used in this manuscript:
| dust concentration | |
| compressor efficiency | |
| pressure ratio | |
| Gas Generator Speed | |
| CFD | Computational Fluid Dynamics |
| EO | Engine Order |
| FEM | Finite Element Method |
| FH | Flight Hours |
| FOD | Foreign Object Damage |
| HCF | High Cycle Fatigue |
| IPS | Inlet Particle Separator |
| ITWL | Air Force Institute of Technology in Warsaw |
| MDPI | Multidisciplinary Digital Publishing Institute |
| MRO | Maintenance, Repair, Overhaul |
| R | Pearson correlation coefficient |
| rpm | revolutions per minute |
| RUL | Remaining Useful Life |
| SM | Stall margin |
| TBO | Time Between Overhauls |
| TIT | Turbine Inlet Temperature |
| VIGV | Variable Inlet Guide Vanes |
References
- Hamed, A.A.; Tabakoff, W.; Rivir, R.B.; Das, K.; Arora, P. Turbine blade surface deterioration by erosion. J. Turbomach. 2005. [Google Scholar] [CrossRef]
- Szczepankowski, A.; Szymczak, J.; Przysowa, R. The Effect of a Dusty Environment upon Performance and Operating Parameters of Aircraft Gas Turbine Engines. In STO-MP-AVT-272 Impact of Volcanic Ash Clouds on Military Operations; The NATO Science and Technology Organization: Vilnius, Lithuania, 15–17 May 2017; pp. 1–13. [Google Scholar] [CrossRef]
- Przysowa, R.; Gawron, B.; Kulaszka, A.; Placha-Hetman, K. Polish experience from the operation of helicopters under harsh conditions. J. KONBIN 2018, 48, 263–300. [Google Scholar] [CrossRef] [Green Version]
- Doring, F.; Staudacher, S.; Koch, C.; Weißschuh, M. Modeling particle deposition effects in aircraft engine compressors. J. Turbomach. 2017, 139. [Google Scholar] [CrossRef]
- Doring, F.; Staudacher, S.; Koch, C. Predicting the Temporal Progression of Aircraft Engine Compressor Performance Deterioration due to Particle Deposition. In Proceedings of the ASME Turbo Expo 2017: Turbomachinery Technical Conference and Exposition, Charlotte, NC, USA, 26–30 June 2017. [Google Scholar] [CrossRef]
- Bojdo, N.; Filippone, A. A Simple Model to Assess the Role of Dust Composition and Size on Deposition in Rotorcraft Engines. Aerospace 2019, 6, 44. [Google Scholar] [CrossRef] [Green Version]
- Abdullin, B.R.; Akmaletdinov, R.G.; Gumerov, X.S.; Nigmatullin, R.R. K issledovaniyu raboty GTD v zapylennoj atmosfere (Research of gas turbine engine operation in dust-filled atmosphere). Vestnik Samarskogo Gosudarstvennogo Aehrokosmicheskogo Universiteta 2014, 5, 95–102. [Google Scholar]
- Kramchenkov, E. Issledovanie Ehrozionnogo Iznashivaniya Materialov (Study of Erosive Wear of Materials). Ph.D. Thesis, Gubkin Russian State University of Oil and Gas, Moscow, Russia, 1995. [Google Scholar]
- Borkova, A.N. Erozionnaya Stojkost Aviacionnyx Materialov pri Soudarenii s Tverdymi (Pylevymi) Chasticami (Erosion Resistance of Aviation Materials in Collision with Solid (Dust) Particles). Ph.D. Thesis, All-Russian Institute Of Aviation Materials, Moscow, Russia, 2006. [Google Scholar]
- Gas Turbine Engine Environmental Particulate Foreign Object Damage [EP-FOD]; The NATO Scientific and Technology Organization: Brussels, Belgium, 2019. [CrossRef]
- Finnie, I.; Stevick, G.R.; Ridgely, J.R. The influence of impingement angle on the erosion of ductile metals by angular abrasive particles. Wear 1992. [Google Scholar] [CrossRef]
- Bitter, J.G. A study of erosion phenomena. Part II. Wear 1963. [Google Scholar] [CrossRef]
- Sheldon, G.L.; Kanhere, A. An investigation of impingement erosion using single particles. Wear 1972. [Google Scholar] [CrossRef]
- Van der Walt, J.P.; Nurick, A. Erosion of Dust-Filtered Helicopter Turbine Engines Part I: Basic Theoretical Considerations. J. Aircr. 1995, 32, 106–111. [Google Scholar] [CrossRef]
- Finnie, I. Some observations on the erosion of ductile metals. Wear 1972. [Google Scholar] [CrossRef]
- Khodak, M.O.; Vishnevskij, O.A. Eksperimentalni viprobuvannya ta prognozuvannya xarakteristik abrazivnoi znosostoijkosti materialiv aviacijnix GTD (Experimental tests and prediction of the abrasion resistance characteristics of materials of aviation gas-turbine engines). Aviacionno-Kosmicheskaya Texnika i Texnologiya 2006, 7, 114–123. [Google Scholar]
- Evstifeev, A.; Kazarinov, N.; Petrov, Y.; Witek, L.; Bednarz, A. Experimental and theoretical analysis of solid particle erosion of a steel compressor blade based on incubation time concept. Eng. Fail. Anal. 2018. [Google Scholar] [CrossRef]
- Batcho, P.F.; Moller, J.C.; Padova, C.; Dunn, M.G. Interpretation of gas turbine response due to dust ingestion. J. Eng. Gas Turbines Power 1987. [Google Scholar] [CrossRef] [Green Version]
- Singh, D.; Hamed, A.L.; Tabakoff, W. Simulation of performance deterioration in eroded compressors. In Proceedings of the ASME 1996 International Gas Turbine and Aeroengine Congress and Exhibition, Birmingham, UK, 10–13 June 1996. [Google Scholar] [CrossRef]
- Koch, C.C.; Smith, L.H. Loss sources and magnitudes in axial-flow compressors. J. Eng. Gas Turbines Power 1976. [Google Scholar] [CrossRef]
- Shpilev, K. Jekspluatacija Letatelnyh Apparatov v Gorno-Pustynnoj Mestnosti [Operation of Aircraft in the Mountain-Desert Area]; Voennoe izdatelstvo: Moscow, Russia, 1991; p. 224. [Google Scholar]
- Tabakoff, W.; Hamed, A.; Wenglarz, R. Particulate flows, turbomachinery erosion and performance deterioration. Von Karman Lect. Ser. 1988, 89, 24–27. [Google Scholar]
- Grigorev, V.; Zrelov, V.; Ignatkin, J.; Kuzmichev, V.; Ponomarev, B.; Shahmatov, E. Vertoletnye Gazoturbinnye Dvigateli [Helicopter Gas Turbine Engines]; Mashinostroenie: Moscow, Russia, 2007; p. 491. [Google Scholar]
- TV3-117VMA-SBM1V Series 4 and 4E Turboshaft Engine (Brochure); Motor Sich JSC: Zaporizhzhia, Ukraine, 2012.
- Pavlenko, D.; Dvirnyk, Y. Zakonomernosti iznashivanija rabochih lopatok kompressora vertoletnyh dvigatelej, jekspluatirujushhihsja v uslovijah zapylennoj atmosfery (The laws of wear of the compressor rotor blades of the helicopter engines that are operated under the dust conditions). Visnik Dvigunobuduvannja 2016, 1, 42–51. [Google Scholar]
- Vorobev, Y.; Romanenko, V. Analiz kolebanij lopatochnogo apparata kompressora GTD (Analysis of vibrations of gas turbine compressor blading). Aviacionno-Kosmicheskaya Tehnika i Tehnologija 2013, 107, 55–59. [Google Scholar]
- Rzadkowski, R.; Gnesin, V.; Kolodyazhnaya, L.; Kubitz, L. Unsteady Forces Acting on the Rotor Blades in the Turbine Stage in 3D Viscous Flow in Nominal and Off-Design Regimes. J. Vib. Eng. Technol. 2014, 2, 3–9. [Google Scholar]
- Witek, L. Crack propagation analysis of mechanically damaged compressor blades subjected to high cycle fatigue. Eng. Fail. Anal. 2011. [Google Scholar] [CrossRef]
- Witek, L. Crack Growth Simulation in the Compressor Blade Subjected to Vibration Using Boundary Element Method. Key Eng. Mater. 2014, 598, 261–268. [Google Scholar] [CrossRef]
- Hamed, A.; Tabakoff, W. Experimental and numerical simulations of the effects of ingested particles in gas turbine engines. In Proceedings of the AGARD Conference Proceedings 558: Erosion, Corrosion and Foreign Object Damage Effects in Gas Turbines, Rotterdam, The Netherlands, 25–28 April 1994. [Google Scholar]
- Itoga, H.; Tokaji, K.; Nakajima, M.; Ko, H.N. Effect of surface roughness on step-wise S-N characteristics in high strength steel. Int. J. Fatigue 2003. [Google Scholar] [CrossRef]
- Murakami, Y.; Tsutsumi, K.; Fujishima, M. Quantitative evaluation of effect of surface roughness on fatigue strength. Nippon Kikai Gakkai Ronbunshu 1996. [Google Scholar] [CrossRef] [Green Version]
- Dyblenko, Y.M.; Selivanov, K.S.; Valiev, R.R.; Skryabin, I.V. Issledovanie gazoabrazivnogo iznosa obrazcov iz titanovogo splava VT-6 s nanostrukturirovannymi zashhitnymi pokrytiyami (Investigation of gas-abrasive wear of VT-6 titanium alloy samples with nanostructured protective coatings). Vestn. Ufim. Gos. Aviac. Texnicheskogo Univ. 2011, 15, 83–86. [Google Scholar]
- Ivchenko, D.; Shtanko, P. Ob ustalostnom mexanizme gazoabrazivnoj erozii detalej gazovozdushnogo trakta vertoletnyx GTD [On the fatigue mechanism of gas-abrasive erosion of parts of the gas-air duct of a helicopter gas turbine engine]. Visnik Dvigunobuduvannya 2009, 2, 12–14. [Google Scholar]
- Batailly, A.; Legrand, M.; Cartraud, P.; Pierre, C. Assessment of reduced models for the detection of modal interaction through rotor stator contacts. J. Sound Vib. 2010, 329, 5546–5562. [Google Scholar] [CrossRef] [Green Version]
- Ma, H.; Wang, D.; Tai, X.; Wen, B. Vibration response analysis of blade-disk dovetail structure under blade tip rubbing condition. J. Vib. Control 2017, 23, 252–271. [Google Scholar] [CrossRef]
- Marakueva, O. Aerodynamic design and optimization of blade configuration in an inlet stage of an aircraft engine compressor. In Proceedings of the 29th Congress of the International Council of the Aeronautical Sciences, St. Petersburg, Russia, 7–12 September 2014. [Google Scholar]
- Dvirnyk, Y.; Pavlenko, D. Zakonomernosti techenija dvuhfaznogo potoka vo vhodnom ustrojstve vertoletnyh GTD (Laws of multiphase flow behavior in the inlet of a helicopter engine). Aviacionno-Kosmicheskaya Tehnika i Tehnologija 2017, 7, 30–37. [Google Scholar]
- Filippone, A.; Bojdo, N. Turboshaft engine air particle separation. Prog. Aerosp. Sci. 2010, 46, 224–245. [Google Scholar] [CrossRef]
Figure 1.
TV3-117 turboshaft [24].
Figure 1.
TV3-117 turboshaft [24].

Figure 2.
Erosive wear of compressor blades.

Figure 3.
CFD model of the compressor.

Figure 4.
Mesh of the flow through the inlet and variable inlet guide vanes.

Figure 5.
CFD mesh for the first-stage blade.

Figure 6.
Mesh in the tip gap.

Figure 7.
Chord wear of the compressor blade in specific cross-sections.

Figure 8.
Average chord wear of compressor stages for an engine operated without inlet particle separator (IPS) or with IPS.
Figure 8.
Average chord wear of compressor stages for an engine operated without inlet particle separator (IPS) or with IPS.

Figure 9.
Chord wear of sixth-stage blades in function of flight hours.

Figure 10.
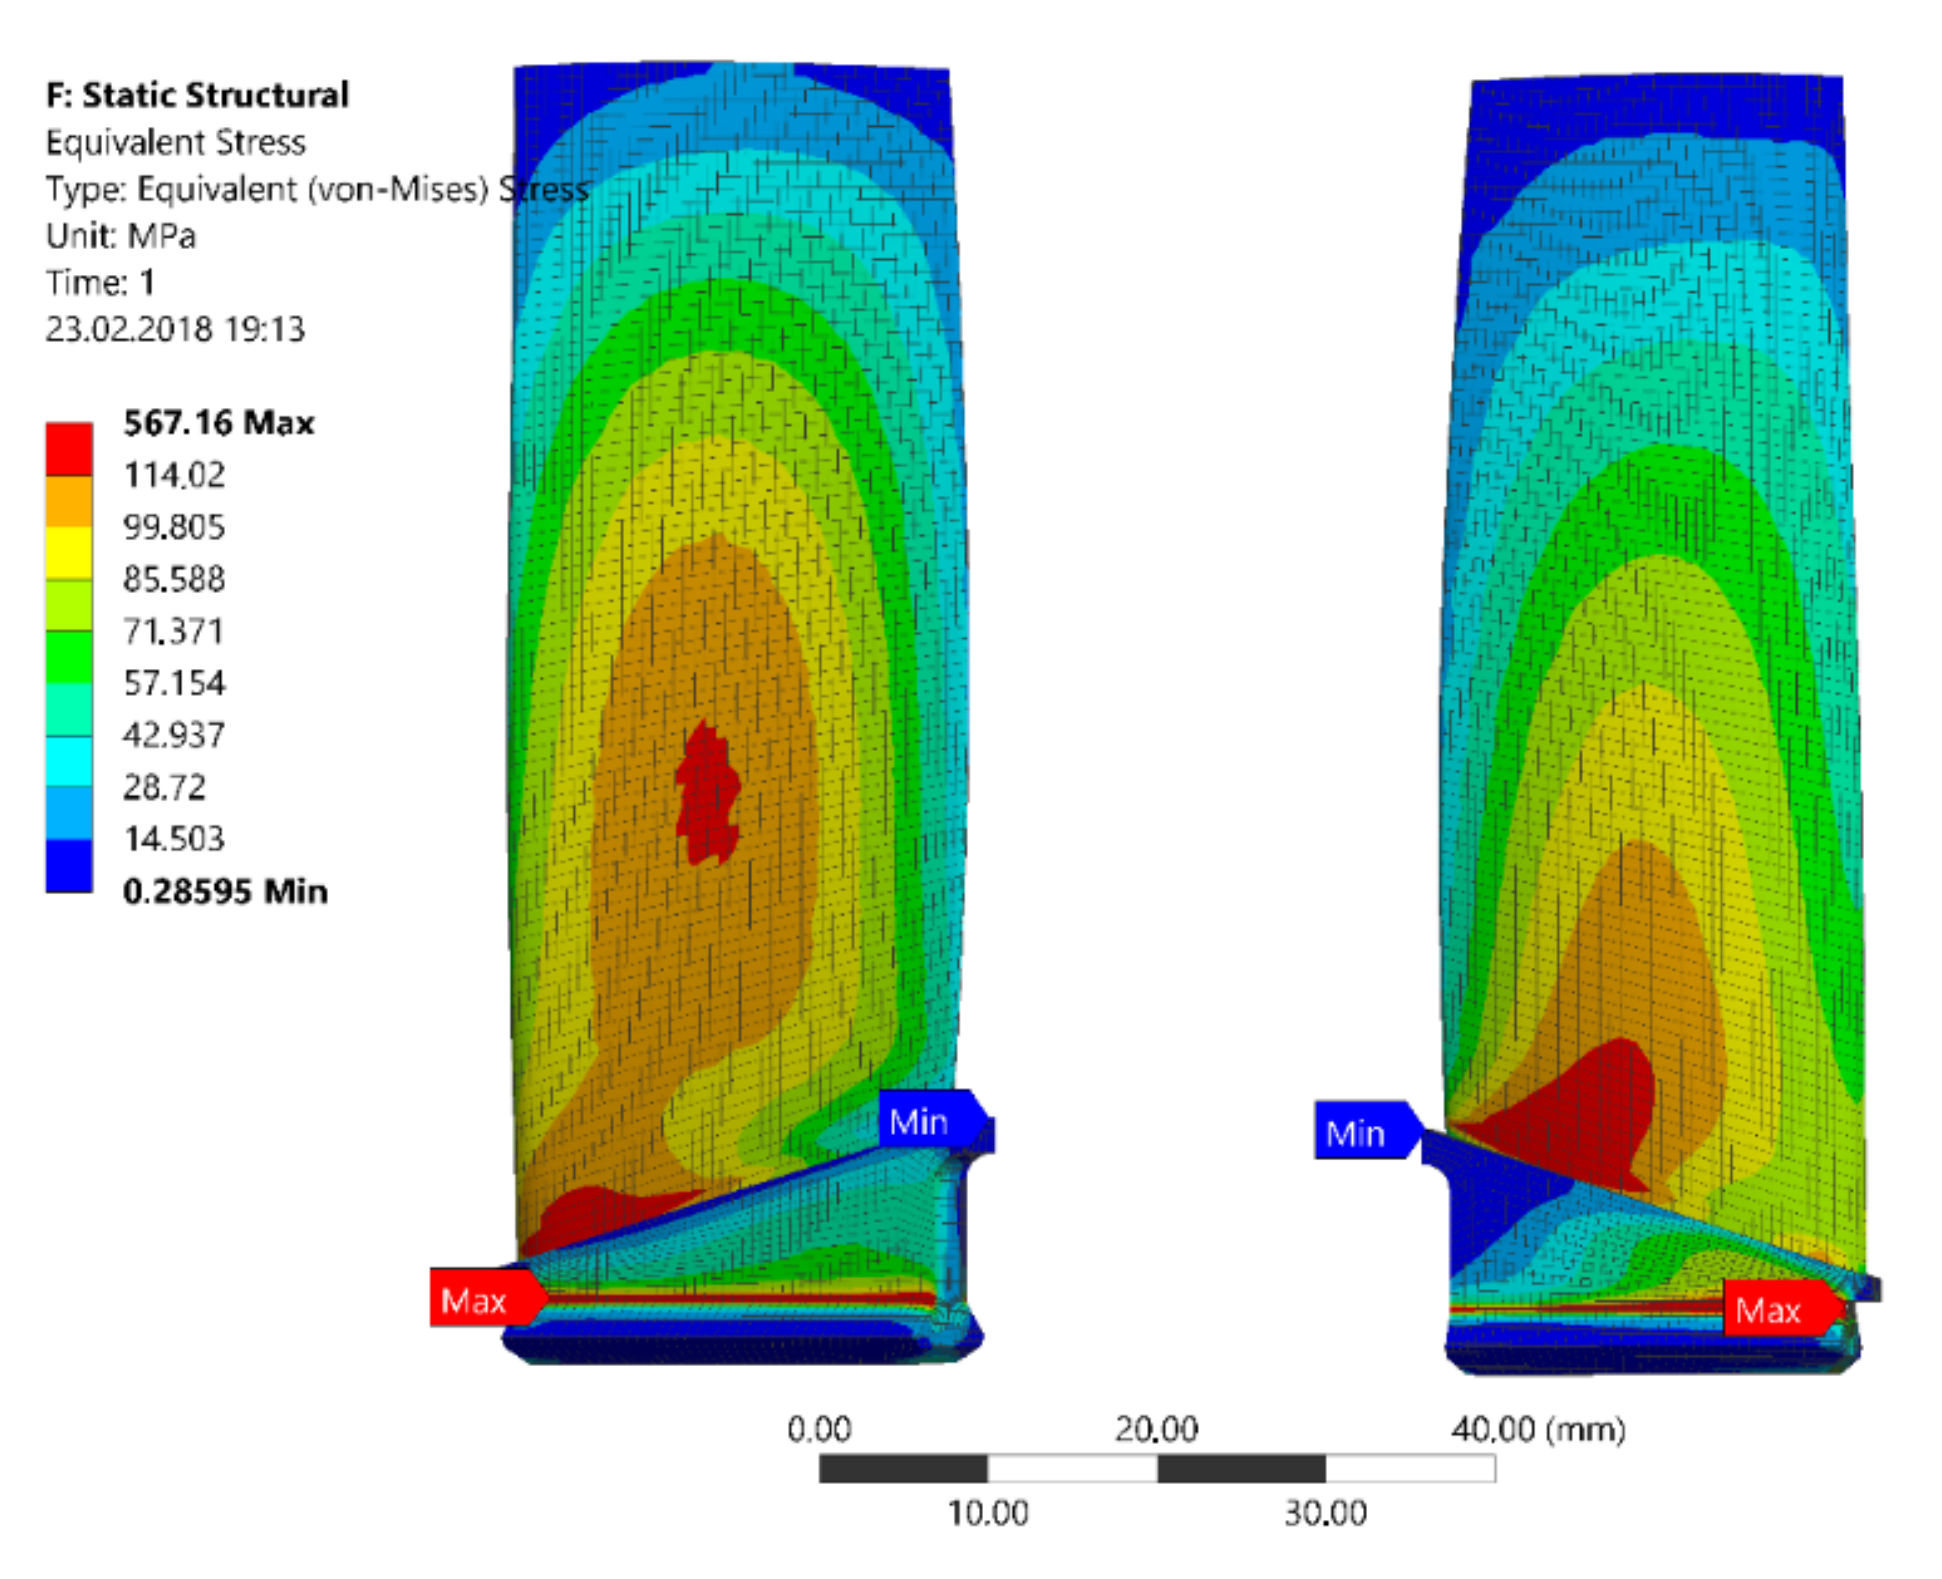
Modal and kinetostatic stresses of the first-stage blade with a nominal (left) and worn aerofoil (right) for .
Figure 10.
Modal and kinetostatic stresses of the first-stage blade with a nominal (left) and worn aerofoil (right) for .

Figure 11.
Impact of erosion on the Campbell diagram for critical modes and stages.

Figure 12.
Velocity and concentration of large particles in the inlet of the turboshaft with IPS; particle size 50–100 m.
Figure 12.
Velocity and concentration of large particles in the inlet of the turboshaft with IPS; particle size 50–100 m.

Figure 13.
Velocity and concentration of small particles in the inlet of the turboshaft with IPS; particle size 10–50 m.
Figure 13.
Velocity and concentration of small particles in the inlet of the turboshaft with IPS; particle size 10–50 m.

Figure 14.
Dependence of pressure compressor maps on the operating time in a dusty environment.

Figure 15.
Compressor efficiency versus operating time in a dusty environment.

Figure 16.
Flow velocity in the new and worn compressor.

Figure 17.
Flow velocity at 90% blade span.

Figure 18.
Stall margin of the compressor versus operating time in a dusty environment.

Figure 19.
New slot designed to inspect the sixth stage.


Table 1.
Computational fluid dynamics (CFD) domain and mesh parameters.
| Domain | Number of Nodes | Number of Elements |
|---|---|---|
| VIGV | 721,686 | 687,199 |
| Rotor 1 | 809,883 | 768,068 |
| Stator 1 | 708,708 | 664,875 |
| Rotor 2 | 807,087 | 768,737 |
| Stator 2 | 695,730 | 646,335 |
| Rotor 3 | 801,327 | 748,912 |
| Stator 3 | 682,752 | 643,632 |
| Rotor 4 | 796,419 | 757,004 |
| Stator 4 | 669,777 | 630,693 |
| Rotor 5 | 791,046 | 739,303 |
| Stator 5 | 656,799 | 612,532 |
| Rotor 6 | 783,924 | 744,989 |
| Stator 6 | 643,821 | 608,066 |
| Rotor 7 | 768,588 | 727,334 |
| Stator 7 | 630,843 | 599,284 |
| Rotor 8 | 765,987 | 724,804 |
| Stator 8 | 617,865 | 573,627 |
| Rotor 9 | 762,795 | 725,798 |
| Stator 9 | 604,887 | 574,900 |
| Rotor 10 | 761,880 | 715,822 |
| Stator 10 | 591,909 | 549,479 |
| Rotor 11 | 754,461 | 703,549 |
| Stator 11 | 578,934 | 543,629 |
| Rotor 12 | 753,300 | 710,338 |
| Deswirl 1 | 565,956 | 536,180 |
| Deswirl 2 | 559,467 | 522,532 |
| Total | 18,285,831 | 17,227,621 |
© 2019 by the authors. Licensee MDPI, Basel, Switzerland. This article is an open access article distributed under the terms and conditions of the Creative Commons Attribution (CC BY) license (http://creativecommons.org/licenses/by/4.0/).
Share and Cite
MDPI and ACS Style
Dvirnyk, Y.; Pavlenko, D.; Przysowa, R. Determination of Serviceability Limits of a Turboshaft Engine by the Criterion of Blade Natural Frequency and Stall Margin. Aerospace 2019, 6, 132. https://doi.org/10.3390/aerospace6120132
AMA Style
Dvirnyk Y, Pavlenko D, Przysowa R. Determination of Serviceability Limits of a Turboshaft Engine by the Criterion of Blade Natural Frequency and Stall Margin. Aerospace. 2019; 6(12):132. https://doi.org/10.3390/aerospace6120132
Chicago/Turabian StyleDvirnyk, Yaroslav, Dmytro Pavlenko, and Radoslaw Przysowa. 2019. "Determination of Serviceability Limits of a Turboshaft Engine by the Criterion of Blade Natural Frequency and Stall Margin" Aerospace 6, no. 12: 132. https://doi.org/10.3390/aerospace6120132
Note that from the first issue of 2016, this journal uses article numbers instead of page numbers. See further details here.