Accurate 2-D Modelling of Transonic Compressor Cascade Aerodynamics


Department of Industrial Engineering, University of Padova, 35131 Padova, Italy
*
Author to whom correspondence should be addressed.
Aerospace 2019, 6(5), 57; https://doi.org/10.3390/aerospace6050057
Submission received: 15 April 2019
/
Revised: 9 May 2019
/
Accepted: 15 May 2019
/
Published: 19 May 2019
(This article belongs to the Special Issue Progress in Jet Engine Technology)
Abstract
:Modern aeronautic fans are characterised by a transonic flow regime near the blade tip. Transonic cascades enable higher pressure ratios by a complex system of shockwaves arising across the blade passage, which has to be correctly reproduced in order to predict the performance and the operative range. In this paper, we present an accurate two-dimensional numerical modelling of the ARL-SL19 transonic compressor cascade. A large series of data from experimental tests in supersonic wind tunnel facilities has been used to validate a computational fluid dynamic model, in which the choice of turbulence closure resulted critical for an accurate reproduction of shockwave-boundary layer interaction. The model has been subsequently employed to carry out a parametric study in order to assess the influence of main flow variables (inlet Mach number, static pressure ratio) and geometric parameters (solidity) on the shockwave pattern and exit status. The main objectives of the present work are to perform a parametric study for investigating the effects of the abovementioned variables on the cascade performance, in terms of total-pressure loss coefficient, and on the shockwave pattern and to provide a quite large series of data useful for a preliminary design of a transonic compressor rotor section. After deriving the relation between inlet and exit quantities, peculiar to transonic compressors, exit Mach number, mean exit flow angle and total-pressure loss coefficient have been examined for a variety of boundary conditions and parametrically linked to inlet variables. Flow visualisation has been used to describe the shock-wave pattern as a function of the static pressure ratio. Finally, the influence of cascade solidity has been examined, showing a potential reduction of total-pressure loss coefficient by employing a higher solidity, due to a significant modification of shockwave system across the cascade.
1. Introduction
The development of modern aircraft compressors aims to increase pressure ratios and to reduce weights at once [1,2]. The advantages resulting from this design approach, which lead to a reduced number of stages and compactness, are a lower fuel consumption and an increased overall performance. To achieve higher pressure ratios, it is necessary to increase the flow velocity relative to the blades up to supersonic. In modern civil and military aircraft engines, the fan and the first stage of the compressor are transonic: the inlet Mach number in the axial direction is subsonic, while the inlet Mach number relative to the rotor-tip section, because of the blade speed, can vary from 1.2 up to 1.7 [2]. At supersonic inlet conditions, the static pressure is increased primarily by the complex system of shock waves arising in the blade passage, whose strength and interaction with boundary layer largely affect the overall performance. Hence, the design of compressors operating at supersonic relative inlet flow conditions requires an accurate knowledge of the flow behavior inside the blade passage.
Parametric studies are a fundamental tool for the analysis of compressor rotors during the first steps of the design process. In fact, they can provide a thorough description of machine performance, showing the influence of the main flow variables and geometric parameters on its behavior. The so-called linear supersonic compressor cascade is the main experimental tool for gaining information about the shock wave pattern and the overall performance of a transonic/supersonic compressor, with less expense in terms of time and resources than the one required to test an entire rotor. A linear cascade can be defined as a two-dimensional array of a certain number of airfoils which are aerodynamically and geometrically equivalent to the compressor blade section and mounted in a wind tunnel. Even if cascade models present clear physical limitations and significant differences compared with the corresponding rotor blade sections, they can provide excellent series of data sets for a large number of operating conditions, useful for the preliminary design. On the other hand, numerical simulations can support the experimental analysis of transonic flows in compressors, focusing on some aspects which cannot be easily investigated in an experimental arrangement. Once the numerical model has been properly validated by using available experimental data, it can provide excellent results when employed for further analysis (e.g., [3,4]).
In these terms, the validation activity is fundamental in the choice of the combination of turbulence model, grid and solver settings that can provide an accurate representation of experimental data. In the simulations of a transonic/supersonic compressor cascade, this statement assumes an even higher importance. In fact, the shock wave pattern through the cascade must be accurately reproduced, since it deeply influences the flow field downstream of the cascade exit plane. Moreover, the operating condition peculiar to supersonic cascades, known as “unique incidence”, and the mixed nature of the flows, which is both subsonic and supersonic, make the numerical simulation of these problems particularly cumbersome.
Computational Fluid Dynamics (CFD) has been widely used for simulating the flow through transonic compressors and cascades. Various studies were carried out in order to investigate a large number of topics related to transonic compressor rotors and cascades. For example, in [3] numerical simulations were performed in order to study the shock-wave/boundary-layer interaction (SWBLI) in a transonic compressor cascade. A two-dimensional Navier–Stokes solver was validated using experimental data obtained in a supersonic cascade facility in order to investigate the influence of inlet Mach number and axial velocity-density ratio (AVDR) on blade performance. In [4], an in-depth parametric study was carried out in order to investigate the influence of the leading-edge radius, cascade solidity, and pre-compression on the aerodynamic performance of a supersonic cascade. In [5], another numerical analysis of SWBLI in transonic/supersonic axial flow compressor cascade was performed, showing the results of various turbulence models. A one-dimensional analytical shock loss model was proposed in [6] for optimizing the shock structure in a supersonic cascade. The analytical prediction model was validated by comparing the results against the experimental data and the shock system of two supersonic cascades, which were subsequently optimized. In [7], a multi-objective design optimization of a 2D S-shaped supersonic compressor cascade, operating at unique incidence condition and an inlet Mach number equal to 1.5, was carried out by using an in-house iterative procedure, in order to minimize the cascade total pressure losses. A method for transonic compressor multi-objective design optimization was developed and applied to the NASA rotor 37 in [8] in order to maximize the isentropic efficiency of the rotor and to maximize its pressure ratio at the design point. In [9], a numerical investigation of the potential improvement on the overall performance of transonic compressors by using tandem rotor blades was carried out. This study aimed to provide basic guidelines for the design of tandem rotor blades and to investigate the flow field through this blade configuration. Another design and optimization study of a tandem cascade for a transonic compressor was carried out in [10]. Lastly, in [11], a three-dimensional CFD analysis of a transonic axial compressor rotor blade was carried out in order to evaluate its performance at various off-design conditions.
In the present work, an accurate 2D simulation of the flow in the ARL-SL19 supersonic compressor cascade and a detailed parametric study for a wide range of operating conditions are presented. In a parametric study, the main independent variables are flow quantities, such as the inlet Mach number, the static pressure ratio, and the AVDR, or geometric parameters, such as the cascade solidity. All of these variables strongly influence the cascade performance, in terms of total-pressure loss coefficient, and the exit flow field, in terms of exit Mach number and mean exit flow angle. Numerical data were obtained over a range of different inlet Mach numbers, static pressure ratios, and solidity values. The first step of the parametric study was the determination of the unique incidence curve peculiar to the cascade. Subsequently, the influence of inlet Mach number, static pressure ratio, and solidity on exit Mach number, exit flow angle, and total-pressure coefficient was investigated. A thorough preliminary validation study of the numerical model was carried out. Three grids with different number of elements and three turbulence models were assessed to find a suitable combination matching experimental data provided in [12] in terms of total-pressure loss coefficient and isentropic Mach number distribution. In the remainder of the paper, the validation of the numerical model is thoroughly reported, followed by the outcome of the parametric study, which can be useful for the preliminary design of a transonic compressor rotor blade section.
2. Numerical Model and Validation
The cascade analysed in this work is known as ARL-SL19 supersonic compressor cascade and derives from a rotor near-tip section of a transonic axial compressor described in [13,14]. As reported in [12], it is the result of a design, fabrication, and testing process conducted at the Detroit Diesel Allison (DDA) Division of the General Motors Corp, which worked under the sponsorship of the Fluid Mechanics Research Laboratory of the Aerospace Research Laboratories (ARL) in Ohio in the 1970s. The experimental investigation carried out in the supersonic wind tunnel at DDA is widely reported in [15]. The cascade has aroused an ever-growing interest because of the excellent performance data obtained from the tests at DDA. Numerous papers providing a quite vast series of experimental data for a large number of operating conditions are available in the literature. For instance, a detailed experimental investigation of the cascade behavior at various operating conditions, conducted in the supersonic cascade wind tunnel facility at the Deutsches Zentrum für Luft- und Raumfahrt e.V. (DLR) in Cologne, former Deutsche Forschungs- und Versuchsanstalt für Luft- und Raumfahrt (DFVLR), is presented in [12]. In particular, the influence of static pressure ratio, inlet Mach number, and AVDR on the blade performance is described. An empirical correlation was used to separate the influence of static pressure ratio and AVDR on the exit variables and the results were collected in curves showing the variations in exit flow angle, exit Mach number, and total-pressure loss coefficient with static pressure ratio and with AVDR, for a fixed value of the AVDR and static pressure ratio, respectively. These curves can be useful for a qualitative comparison with other experimental results or with numerical results. The ARL-SL19 supersonic cascade was also tested in the supersonic wind tunnel facility at the Office National d’Etudes et de Recherches Aérospatiales (ONERA) as reported in [16], with substantial differences in the examined operating conditions and in the testing arrangement compared to the tests carried out at the DFVLR. A summary of the cascade results obtained in the three different supersonic cascade wind tunnels at DFVLR, at DDA, and at ONERA can be found in [17]. Detailed experimental and numerical results are presented in other papers. For example, the experimental results reported in [12] have been used in [6] for the validation of a one-dimensional analytical shock loss model for optimizing the shock structure in a supersonic cascade at various operating conditions.
Because of the quite wide range of available experimental data, the cascade was considered suitable for the scope of this work. It is made up of 5 blades, with pre-compression (S-shape) airfoil, typical of high-Mach axial compressors. The cascade design inlet Mach number, static pressure ratio, and AVDR are 1.612, 2.15, and 1.00, respectively. The geometric parameters adopted in this work are the ones reported in [12] for the tests at the DFVLR.
2.1. Cascade Performance Parameters
The main parameters generally used to describe the performance of a cascade are the axial velocity-density ratio (AVDR), the total-pressure loss coefficient , and the isentropic Mach number .
The AVDR is a parameter used to check if a flow through a cascade is two-dimensional. It is defined as the ratio of the product of axial velocity and density at cascade exit to the product of axial velocity and density at cascade inlet
Generally speaking, the flow through a cascade is two-dimensional when the AVDR is unity. However, in reality, a cascade has a three-dimensional flow behavior because of the presence of secondary flows.
The total-pressure loss coefficient is defined as the ratio of the difference between the total pressure at cascade inlet and the total pressure at cascade exit to the difference between the total pressure and the static pressure at cascade inlet
It is an important performance parameter which gives the loss in total pressure in a non-isentropic flow. In a supersonic compressor cascade, the total pressure losses are due to viscous losses, resulting from the shock wave boundary layer interaction and the related separation of the boundary layer, and to shock losses, caused by the shocks inside the blade passage and the detached bow shock in front of the blade leading-edge.
The isentropic Mach number is often plotted for turbomachinery blades and it is defined as
where is the inlet total pressure, p is the local static pressure, and is .
2.2. Computational Domain and Mesh
The computational domain used for the simulations consisted of a 2D periodic domain around a single blade airfoil with periodicity equal to the pitch spacing. It extended from , where corresponds to the leading edge of the airfoil.
Three multi-block structured grids with quadrilateral elements and one O-grid around the airfoil were used for the validation study and the grid sensitivity analysis. A wall orthogonal extrusion layer around the airfoil was used to resolve the boundary layer using . Enhanced Wall Treatment (EWT) formulation was used for the simulations performed with the k- models in order to ensure the applicability of the models. A coarse mesh of about 100k elements, a medium mesh of about 200k elements, and a fine mesh of about 500k elements were used. The three grids are showed in Figure 1, with grid size increasing from top to bottom.
Grid quality parameters are summarized in Table 1, proving good level of skewness and orthogonal quality, necessary to accurately reconstruct the flow variables during the simulation.
It is important to underline that the choice to simulate a single two-dimensional blade airfoil in a periodic domain does not accurately reflect the experimental set-up, because all the cascade tests were conducted with a three-dimensional geometry, a finite number of blades, and with sidewall boundary layer suction to avoid adverse effects. However, the periodic condition allows simulating the case of a real flow through a rotating axial compressor. Moreover, this conscious simplification makes it possible to simulate a flow not dependent on the AVDR, because the axial velocity-density ratio is always unity for a two-dimensional simulation. Lastly, the presence of secondary flows and non-periodicity effects is avoided. The validation study aimed at obtaining a reliable and accurate numerical model which can be successively used for the parametric analysis.
2.3. Test Cases Data
Three test cases, conducted in the supersonic cascade wind tunnel facility at the DFVLR [12], having an essentially unity AVDR, were selected for the validation of the numerical model and the grid sensitivity analysis. Inlet flow conditions and outlet flows data for each test case are listed in Table 2.
The design operating condition of the cascade was used as a further test case to validate the numerical model. The design data are summarized in Table 3.
2.4. Boundary Conditions, Operating Conditions and Solver Setup
The flow solver employed in this work was ANSYS® Fluent [18]. Boundary conditions were pressure-far-field at inlet and pressure outlet at outlet, with lower and upper sides treated as periodic. Two-dimensional, steady-state simulations were carried out until convergence, which was established when all root mean squared residuals were under 1 × 10 and some variables of interest, such as inlet Mach number and exit Mach number, inlet flow angle, or mass flow rate, remained stable. Reference conditions were a total pressure of 101,325 Pa, a total temperature of 300 K, and a Reynolds number of 1.2 × 10, in agreement with the experimental range reported in [12]. The turbulence intensity for the test cases was measured to be less than 1% [17], and it was accordingly set, whenever required by turbulence closure.
2.5. Specification of the Inlet Flow Conditions
In a cascade with supersonic inlet flows and axial subsonic component, a particular relation between the inlet Mach number and the inlet flow angle exists, known as unique incidence. A rigorous mathematical derivation of the equations governing the unique incidence operating condition for a supersonic compressor cascade and a very detailed explanation can be found in [19,20,21]. In order to respect the inlet flow conditions determined by the unique incidence, in terms of inlet Mach number and inlet flow angle, it is necessary to specify the Riemann invariant at inlet, using the Prandtl-Meyer relation:
However, since depends on the flow solution and on the grid, the computed value might not be equal to the desired one. For that reason, an iterative procedure, such as the one described in [7], can be required to find the pair of values reproducing the unique incidence. In order to identify the correct flow condition for a specified inlet Mach number, the inlet flow angle was manually varied until the difference between the calculated inlet Mach number and the imposed inlet Mach number was below a certain threshold.
2.6. Calculation of the Exit Variables
Calculations of static pressure, total-pressure, exit Mach number, and mean exit flow angle were obtained at an axial distance of 26 mm downstream of the cascade exit plane, exactly where the probe was located during the experiments in the supersonic wind tunnel [12]. The estimated uncertainties for the main exit variables are reported in [12].
2.7. Results of Validation and Grid Sensitivity Analysis
The CFD results for the three test cases, compared with the experimental results, are listed in Table 4. The turbulence models used for the simulations were the Spalart-Allmaras model (S-A) [22], the k- model, in its three available formulations (STD k- [23], RNG k- [24], and Realizable k- [25]), and the Shear-Stress Transport (SST) k- model [26]. For brevity, only the outcomes obtained with the S-A model, the STD k- model, and the SST k- model are reported.
As it can be seen, the variations of cascade performance and exit flow variables as a function of mesh size are almost negligible. This could be due to the fact that the coarse mesh was sufficiently refined to reproduced the flow field through the cascade in a satisfactory manner. A subsequent refinement of the grid around the airfoil did not provide a significant improvement.
As regards the inlet flow angle, the difference between the calculated and the experimental values, whose prediction was overestimated regardless of grid size, was attributed to the turbulence model employed. In the first test case and in the second test case, the S-A and the STD k- had a similar positive error of about compared to the experimental value, with a mean difference of for the third test case. Overall, the STD k- seemed to overestimate the inlet flow angle slightly more.
The exit Mach number, instead, was well predicted regardless of the turbulence model employed and the grid size, in each of the two test cases for which the experimental results are available. Similarly, the prediction of total-pressure loss coefficient was in very good agreement, with small non-uniform variations for the three test cases between S-A and k-. However, the latter model seemed slightly better, giving an error never greater than . The relative percentage error as a function of the grid size for the three test cases is reported in Figure 2, showing a moderate sensitivity to grid size.
The isentropic Mach number distributions calculated with the S-A model and the STD k-, employing the fine mesh for the three test cases, are plotted in Figure 3, Figure 4 and Figure 5. The distribution was not affected by the grid size. However, the calculated isentropic Mach number on the suction side and on the pressure side of the airfoil, as visible in the figures, presented some differences in comparison with the experimental profiles, especially around the peaks representing the location of the shock waves on the blade surfaces. This discrepancy was shown to be dependent on the turbulence model, since even small modifications of boundary layer thickness determine a different wave pattern arising in the passage. Moreover, three-dimensional effects and disturbances, inevitably present during experimental measurements, were not taken into account in the model employed. In addition, the discrepancies between the calculated and the experimental isentropic Mach number distributions could be due to the experimental and measurement setup. In fact, the probes on the suction side and on the pressure side of the profile could not have been dense enough to accurately detect the shock waves on the airfoil surfaces. Finally, the adjustment of inlet flow variables to match unique incidence condition and experimental quantities could produce a slight modification of the wave pattern, but the aim of the validation in this work was to identify the turbulence model giving the results of better consistency with the experimental parameters for a given static pressure ratio and then evaluate the performance of the cascade for different operating conditions. The S-A model seemed to better reproduce the isentropic Mach number distribution on the pressure side and the suction side of the airfoil in all the analysed test cases.
The blade-to-blade wake losses for the second test case and the third test case, calculated with the S-A model and the STD k- model, are depicted in Figure 6. The wake was well reproduced by the S-A model, with the local loss coefficient curves aligned on the peak and on the left concavity, representing viscous losses and shock losses, respectively. The not complete consistency with the experimental results was probably due to mixing phenomena downstream of the cascade, which are unsteady, and to the non-periodicity of the experimental cascade. This is easily visible in the non-periodic experimental blade-to-blade loss profile, because of the finite number of blades in the testing arrangement. The results of the validation were also in good agreement with the ones obtained in [6] for the second test case and third test case.
As regards the numerical simulation of the cascade design operating condition, the S-A model gave the best results, outclassing the other turbulence models employed for the validation. The CFD results obtained at the cascade design operating condition, calculated using the S-A model, are reported in Table 5 and compared with the experimental data.
As it can be seen, the numerical results obtained with the S-A at the cascade design operating condition are in quite total agreement with the experimental data. The calculated flow turning , is well predicted, as well as the total-pressure loss coefficient (the relative percentage error is of 1%). In comparison, the corresponding calculated by using the STD k- model was 0.154, which is clearly overpredicted. The flow field around the airfoil in terms of shock wave pattern was also well reproduced.
As regards the results calculated with the SST k- model in terms of cascade efficiency and exit flow variables, it can be seen that the total-pressure loss coefficient is deeply underestimated in all the test cases. Moreover, the isentropic Mach number distribution on the suction side of the blade showed a drop of the isentropic Mach number around the trailing-edge, due to an overestimation of the boundary layer separation on the blade suction side caused by the interaction with the shock waves, which affected the calculation of the isentropic Mach number and the total-pressure loss coefficient.
Overall, the CFD results obtained with the S-A model and the STD k- model seem to accurately predict the cascade performance, even considering the experimental uncertainties. The validation study and the grid sensitivity analysis suggested that for the purpose of this work the medium grid could be adopted, because it represented the best compromise between accuracy and computational time. In terms of turbulence model, the validation study showed that the S-A model gave more precise results in simulating the flow in the blade passage and across the wake and in reproducing the cascade design operating condition. Even if it slightly underestimated the total-pressure loss coefficient, it was chosen as the reference model for the subsequent simulations, taking into account the quite high experimental uncertainties and its more accurate reproduction of the cascade design operating condition, the wake total-pressure loss profile, and the isentropic Mach number distribution.
Although not reported here, as stated before, it is worth briefly discussing the results obtained with the other turbulence models tested in the validation study. As regards the total-pressure loss coefficient, the mean exit flow angle and the exit Mach number, they were correctly calculated by the Realizable k- model and the RNG k- model. However, the isentropic Mach number distribution and the blade-to-blade losses measured downstream of the cascade were not as well predicted. The isentropic Mach number distribution on the suction side was not accurately replicated by both the turbulence models, especially in the rearmost part near the trailing-edge, as well as the blade-to-blade total-pressure loss coefficient, which resulted deeply underestimated.
3. Parametric Study of the ARL-SL19 Supersonic Cascade
The parametric study was aimed to analyse the influence of the main flow variables and geometric variables on the cascade performance. Numerical data were obtained over a range of different Mach numbers, static pressure ratios, and solidity values, investigating the performance of the cascade at various operating conditions.
The presentation of the results obtained from the parametric study is organized into four sections. The first section is about the numerical determination of the cascade unique incidence curve, which is obtained by points and compared with the theoretical and experimental curves reported in [12]. The other sections are concerned with the parametric study of the cascade: the second section investigates the influence of the inlet Mach number on the maximum static pressure ratio achievable by the cascade and the total-pressure loss coefficient; the third section deals with the variations in exit mach number, mean exit flow angle, and total-pressure loss coefficient with static pressure ratio; in the last section the influence of solidity on the compressor cascade performance is investigated.
3.1. Numerical Determination of the Unique Incidence Curve
The unique incidence curve for the ARL-SL19 cascade was numerically calculated for several inlet Mach numbers and compared to the theoretical curves determined in [12] by using an analytical method. The curves relating inlet variables with and with are plotted in Figure 7. Circles indicate points obtained via CFD, while experimental points are shown with triangular markers and measured design point condition with a diamond. Solid lines correspond to analytical curves including bow shock, which was neglected in dashed lines.
The inlet Mach numbers imposed for determining the numerical unique incidence curve were in the range to . The unique incidence condition was numerically determined with a simple iterative approach. For a fixed inlet Mach number, the inlet flow angle was slightly varied until the difference between the calculated and the imposed inlet Mach number was below a certain threshold. As it can be seen, the agreement among measured, predicted, and calculated values was good. Measured at the design inlet Mach number was , against a predicted theoretical value of . The numerical angle at the same condition was determined to be , with a relative percentage error of 1%. As regards , the measured value was at design, against a calculated value of . The relative percentage error in this case was 2.3%.
3.2. Influence of Inlet Mach Number
The inlet Mach number is one of the most important parameters affecting the performance of a given supersonic compressor cascade, mainly in terms of the maximum achievable static pressure ratio. The relationship between these two parameters was investigated in a series of simulations where maximum pressure ratio was computed for each imposed by increasing until its maximum was reached, i.e., when a quasi-normal shock wave appeared at the passage entrance. The results were graphically compared with the interpolation line of the available experimental data reported in [12]. It is important to underline that in the present work the maximum static pressure ratio achievable by the cascade was found increasing the static backpressure with an AVDR always equal to unity, because of the 2D nature of the simulations. On the other hand, the experiments were conducted increasing the static pressure ratio, but with a concurrent variation of the AVDR which was demonstrated to deeply influence the results.
Figure 8a shows an evident trend according to which an almost linear relationship exists between and maximum , which was satisfactorily reproduced by CFD data. For lower inlet Mach numbers (1.32–1.40), the maximum static pressure ratio was more accurately predicted, while for moderate inlet Mach numbers (1.51) and higher inlet Mach numbers (1.58–1.612) it was slightly overestimated (by around 2%). For high inlet Mach numbers, the mismatch between computed and measured static pressure near the spill point condition could be probably due to the strong shock wave-boundary layer interaction. In this condition, a small variation of the boundary layer size and the adverse pressure gradient deeply influence the wave pattern, producing a passage shock wave downstream of the experimental one. Therefore, the simulated cascade can operate in unique incidence for a pressure ratio just beyond the experimental spill point, leading to an overestimation which is within model tolerance anyway. It can also be noticed that increasing inlet Mach number determines an increase in the range of static pressure ratios at which the cascade can operate.
As regards the influence of the inlet Mach number on the total-pressure loss coefficient, Figure 8b shows, as expected, a positive correlation. In fact, increasing causes a strengthen of the shock waves and a corresponding enlargement of shock losses. Moreover, the stronger interaction between shock waves and the boundary layer causes an increment of viscous losses, due to the separation of the boundary layer. The CFD results correctly replicated this trend, even though at higher the computed loss coefficient was overestimated. This effect could be due primarily to the different value of the AVDR between the experimental and the numerical set-up. Indeed, augmenting the static pressure ratio from moderate to high values causes a corresponding increase of the AVDR, which leads to a reduction in loss. Experimentally, varying the AVDR independently of the static pressure ratio is difficult, because static backpressure and AVDR are closely related to each other. Since the AVDR was unity in the two-dimensional simulations carried out in the present work, as previously specified, the boundary layer separation caused by the strong shock wave-boundary layer interaction, which determines an increase in the viscous losses, was not mitigated by the AVDR effect, which contributes to delay boundary layer separation. Moreover, the large separated regime is challenging to be corrected reproduced by a RANS (Reynolds-Averaged Navier-Stokes equations) approach.
3.3. Influence of the Static Pressure Ratio
Varying the static backpressure at fixed inlet conditions modifies the shock wave pattern inside the cascade passage and the exit flow field, in terms of mean exit flow angle and exit Mach number. It also deeply affects the cascade efficiency in terms of total-pressure loss coefficient. In the following analysis, was gradually increased from low to maximum tolerable values keeping the periodicity and always fulfilling the unique incidence condition. Five nominal inlet Mach numbers, from 1.32 to 1.612, were investigated. In the following, the effect on exit Mach number and flow angle, and total-pressure loss coefficient are presented separately.
3.3.1. Exit Mach Number and Flow Angle
The influence of the static pressure ratio on the exit Mach number is reported in Figure 9a. The numerical results clearly show a linear dependence of on the static pressure ratio and this trend reflects the one reported in [12]. Moreover, it can be noticed that increasing , for a fixed static pressure ratio, corresponds to an increase in , while increasing , for a fixed inlet Mach number, corresponds to a decrease of .
The variations in exit flow angle with static pressure ratio are reported in Figure 9b. The trend of the CFD results substantially reflects the overall behavior for an AVDR equal to unity reported in [12]. For example, increasing the static pressure ratio from low values (1.4) to high values (2.5), for a fixed inlet Mach number, corresponds to an increasing and then a decreasing of the mean exit flow angle, with a net change almost zero. The maximum flow turning was calculated to be at most of 2° and this is experimentally confirmed. The maximum mean exit flow angle is reached at near-sonic exit condition, i.e., when the exit Mach number downstream of the cascade is near unity, which agrees with consideration for flat-plate cascades [20].
3.3.2. Total-Pressure Loss Coefficient
The dependence of the total-pressure loss coefficient on static pressure ratio is plotted in Figure 10. For a fixed inlet Mach number, increasing static pressure ratio from low to moderate values causes an increase in total-pressure loss, which was found to be maximum when a normal shock wave is situated near the exit of the cascade passage, as experimentally confirmed in [12]. On the other hand, for fixed inlet conditions again, varying the static pressure ratio from moderate to high values leads to a reduction of the total-pressure loss coefficient. The general behavior is that increasing the static backpressure from moderate to high values, produces a reduction in shock losses, but, on the other hand, causes an increase in viscous losses due to the strong suction side boundary layer separation. The lambda-shock systems arising in the passage determine a reduction in strength of the shock waves, but cause a considerable thickening of the boundary layer. It was observed that the minimum total-pressure loss point was achieved just before the cascade spill point condition occurs. This fact was experimentally demonstrated in [27], even if for a different cascade of MCA airfoils and at slightly supersonic/transonic inlet Mach numbers, i.e., for an operating condition characterized by weaker shock wave-boundary layer interaction. For relatively low inlet Mach numbers (1.32–1.40) the downward trend of with increasing is kept until the maximum cascade static pressure ratio is reached. On the other hand, for higher inlet Mach numbers (1.51–1.612), the total-pressure loss coefficient reaches its minimum at a certain value of the static pressure ratio and then it raises again. This trend could be due to three main reasons. First of all, the influence of AVDR on total-pressure loss coefficient. The increasing of viscous loss due to the strong boundary layer separation on the suction side can be mitigated only by increasing the AVDR, as was experimentally demonstrated in [12], because SWBLI effect and wake thickness are reduced, increasing flow turning and improving . This loss reduction due to a larger AVDR is more pronounced at higher static pressure ratios, as demonstrated in [12] for the present cascade and in [3] for a similar one. Since all the simulations were carried out with a unity AVDR, the overall behavior of the total-pressure loss coefficient was affected only by the static pressure ratio and not by the AVDR. Hence, the trend of beyond the minimum loss point may be not completely realistic. Secondly, the reliability of turbulence modelling in presence of strong SWBLI and large separation, which can incorrectly estimate viscous loss. Lastly, the fact that the cascade maximum static pressure ratio was slightly overestimated, so that the cascade was operating at static pressure ratios beyond the real spill point, even if the unique incidence condition was still valid.
The static pressure ratio has a large influence on the shock wave pattern and the flow field within the blade passage. In Figure 11 and Figure 12, pictures of the shock wave pattern by means of numerical Schlieren are shown for an inlet Mach number of 1.32 and for the design inlet Mach number, respectively. At low static pressure ratios, an oblique shock system develops from the trailing-edge of the profiles and spreads into the downstream region. The oblique shock waves at the trailing-edge are reflected on the pressure side of the adjacent blade and give rise to a complex interaction with the wake. The reflection of the shock-wave on the pressure side can produce a weak boundary-layer separation with reattachment. Increasing the static backpressure from low to moderate values moves the shock at the trailing-edge forward into the blade passage. The shock wave located at the trailing edge becomes gradually a normal shock wave, forming a lambda-shock structure at the suction side. For lower inlet Mach numbers, the lambda shock near the trailing edge of the airfoil is conspicuously smaller. The resulting shock wave-boundary layer interaction on the suction side causes a boundary-layer separation. In this operating condition, the flow field inside the cascade passage is characterized by a first passage shock near the entrance of the cascade passage and a second passage shock close to passage exit, with one or more reflected shocks. At design inlet conditions, this wave pattern is kept until the design static pressure ratio is achieved. At high static pressure ratios, the oblique shock located at the passage entrance becomes a quasi-normal shock forming a lambda-shock with a related boundary-layer separation, while the second passage shock moves forward in the blade passage. The second passage shock, as it moves inside the passage, reduces its strength until it almost disappears. The width of the wake has considerably increased, affecting all the covered passage and the rearmost portion of the suction side, causing a shrinking of the passage area and an increase in viscous loss. For lower values of inlet Mach number, since the shock wave-boundary layer interaction is weaker, the boundary layer separation on the suction side is smaller and the wake is visibly thinner. The point of minimum total-pressure loss was found to be reached when the first passage shock has become a quasi-normal shock located near the leading-edge. On the other hand, the maximum total-pressure loss coefficient is obtained when a normal shock wave is located near the passage exit.
3.4. Influence of Solidity
Cascade solidity deeply affects the overall performance of a supersonic compressor cascade, as it modifies the passage width and consequently the shock wave pattern. A variation of about 5% with respect to the baseline value of 1.5294 was here considered, with five values in the range 1.47–1.60, obtained by changing the pitch at fixed chord. The influence of solidity was investigated by varying static pressure ratio in the range between the maximum and the minimum total loss point, for the design inlet Mach number of 1.612.
Total-pressure loss coefficient as a function of solidity for a fixed static pressure ratio is depicted in Figure 13a. Static pressure ratio versus total-pressure loss coefficient for a fixed value of solidity is reported in Figure 13b. By comparing calculated at the design static pressure ratio (2.15) and at the minimum loss static pressure ratio, for the maximum and the minimum value of cascade solidity considered, the decrease in total-pressure loss was around 2% and 5%, respectively. These results indicate that increasing cascade solidity corresponds to a reduction of the total-pressure loss coefficient. However, supersonic compressor cascades are quite susceptible to changes in solidity and, for that reason, it cannot be modified above certain limits. As it can be seen, the monotonic decreasing trend of with depends on and on the flow field. In fact, increasing the solidity does not imply a corresponding decrease in . As regards the other exit flow variables, i.e., mean exit flow angle, exit Mach number, and inlet flow angle, which is a dependent variables related to the inlet Mach number by the unique incidence, changes in solidity did not provide significant variations.
4. Conclusions
The present work provides a detailed study of the two-dimensional flow in a linear supersonic compressor cascade for different operating conditions, which may be of support to the preliminary design of a transonic/supersonic compressor cascade, the corresponding rotor blade section, or the stage of a supersonic compressor or fan. The validation study indicated that the turbulence model can have a significant impact on performance estimation, due to the high sensitivity of shock wave pattern to boundary layer development. Although none of the models tested gave a net advantage over the others for the whole operative range, Spalart-Allmaras provided the overall better agreement and was therefore chosen. After the numerical model set-up, a parametric analysis was carried out in order to investigate the influence of the main flow and geometric quantities on the overall cascade performance, highlighting their effects on the main exit flow variables. The cascade was tested over a wide range of inlet Mach numbers, static pressure ratios, and solidity. Integral and local quantities derived via CFD were compared, whenever possible, with experimental data or theoretical considerations, showing that the numerical model provided an accurate solution of the two-dimensional supersonic flow through the ARL-SL19 supersonic cascade and a consistent reproduction of the shock wave pattern in front of and within the blade passage.
The relationship between inlet and exit flow variables represents one of the main constraint in design and simulation of supersonic axial Mach number cascades, since it determines their actual operative range. Numerical curves were in good agreement with theory and experimental data, proving an almost linear dependency between and . Of particular interest is the non-monotonic dependence of total-pressure loss coefficient on static pressure ratio, exhibiting a local maximum when a normal shock wave appears at the passage exit, and then decreasing at higher pressure ratio up to spill point. Finally, the influence of solidity on losses was also highlighted, showing a larger sensitivity at increasing pressure ratio and a possible improvement of efficiency.
One of the main limitation of the current approach, based on two-dimensional simulations, was the inability to take into account 3D effects and in particular the non-unitary AVDR caused by endwall boundary layer development. While test cases for validation were selected to have AVDR close to one, for operating points at high pressure ratio, the AVDR can have a significant role in the determination of total losses and inlet conditions. Future work could be, therefore, related to set-up of quasi-2D or 3D simulations enabling a full inclusion of these effects.
Author Contributions
Conceptualization, E.B.; methodology, T.P., A.M., E.B.; validation, T.P.; formal analysis, T.P.; writing—original draft preparation, T.P., A.M.; writing—review and editing, A.M. and E.B.; supervision, E.B.
Funding
This research received no external funding.
Conflicts of Interest
The authors declare no conflict of interest.
Abbreviations
The following abbreviations are used in this manuscript:
| AVDR | Axial Velocity-Density Ratio |
| CFD | Computational Fluid Dynamics |
| DDA | Detroit Diesel Allison |
| DFVLR | Deutsche Forschungs- und Versuchsanstalt für Luft- und Raumfahrt |
| DLR | Deutsches Zentrum für Luft- und Raumfahrt e.V. |
| MCA | Multiple Circular Arc |
| ONERA | Office National d’Etudes et de Recherches Aérospatiales |
| RANS | Reynolds-Averaged Navier-Stokes equations |
| RNG | Re-Normalisation Group |
| STD | Standard |
| SWBLI | Shock wave-boundary layer interaction |
| Axial chord length | |
| Inlet Mach number | |
| Exit Mach number | |
| Axial inlet Mach number | |
| Isentropic Mach number | |
| Inlet static pressure | |
| Outlet static pressure | |
| Inlet total pressure | |
| Outlet total pressure | |
| Inlet axial velocity | |
| Outlet axial velocity | |
| Inlet flow angle | |
| Exit flow angle | |
| Ratio of specifc heats | |
| Flow turning | |
| Prandtl-Meyer function | |
| Cascade solidity | |
| Inlet density | |
| Outlet density | |
| Total-pressure loss coefficient |
References
- Biollo, R.; Benini, E. Recent Advances in Transonic Axial Compressor Aerodynamics. Prog. Aerosp. Sci. 2013, 56, 1–18. [Google Scholar] [CrossRef]
- Calvert, W.J.; Ginder, R.B. Transonic Fan and Compressor Design. Proc. Inst. Mech. Eng. Part C J. Mech. Eng. Sci. 1999, 213, 419–436. [Google Scholar] [CrossRef]
- Kusters, B.; Schreiber, H.A. Compressor cascade flow with strong shock-wave/boundary-layer interaction. AIAA J. 1998, 36, 2072–2078. [Google Scholar] [CrossRef]
- Cui, C.; Zhenggui, Z.; Jinhuan, Z.; Sheng, T. Influence of Key Geometric Parameters on the Aerodynamic Performance of a Supersonic Compressor Cascade. Proc. Inst. Mech. Eng. Part G J. Aerosp. Eng. 2018, 12, 2338–2348. [Google Scholar] [CrossRef]
- Song, D.J.; Hwang, H.C.; Kim, Y.I. A Numerical Study of Shock Wave/Boundary Layer Interaction in a Supersonic Compressor Cascade. KSME Int. J. 2001, 15, 366–373. [Google Scholar] [CrossRef]
- Liu, B.; Shi, H.; Yu, X. A New Method for Rapid Shock Loss Evaluation and Reduction for the Optimization Design of a Supersonic Compressor Cascade. Proc. Inst. Mech. Eng. Part G J. Aerosp. Eng. 2017, 232, 2458–2476. [Google Scholar] [CrossRef]
- Venturelli, G.; Benini, E. Kriging-assisted Design Optimization of S-shape Supersonic Compressor Cascades. Aerosp. Sci. Technol. 2016, 58, 275–297. [Google Scholar]
- Benini, E. Three-Dimensional Multi-Objective Design Optimization of a Transonic Compressor Rotor. J. Propuls. Power 2004, 20, 559–565. [Google Scholar] [CrossRef]
- Mohsen, M.; Owis, F.M.; Hashim, A.A. The Impact of Tandem Rotor Blades on the Performance of Transonic Axial Compressors. Aerosp. Sci. Technol. 2017, 67, 237–248. [Google Scholar] [CrossRef]
- Yue, S.; Yangang, W.; Haitong, W. Design and Optimization of Tandem Arranged Cascade in a Transonic Compressor. J. Therm. Sci. 2018, 27, 349–358. [Google Scholar] [CrossRef]
- Epsipha, P.; Zuber, M.; Kamarul, A.A. CFD Investigation of Transonic Axial Compressor Rotor Blade at Various Off-design Conditions. Pertanika J. Sci. Technol. 2016, 24, 451–463. [Google Scholar]
- Tweedt, D.L.; Schreiber, H.A.; Starken, H. Experimental Investigation of the Performance of a Supersonic Compressor Cascade. ASME J. Turbomach. 1988, 110, 456–466. [Google Scholar] [CrossRef] [Green Version]
- Wennestrom, A.J. The Design and Evaluation of a High-Through-Flow Transonic Axial Compressor. In Proceedings of the 6th International Symposium on Air Breathing Engines, Paris, France, 6–10 June 1983. [Google Scholar]
- Wennerstrom, A.J.; Frost, G.R. Design of a 1500ft/sec Transonic High-Through-Flow Single-Stage Axial Compressor with Low Hub-Tip Ratio; AFAPL-TR-76-59; Air Force Aero-Propulsion Lab/TB: Wright-Patterson AFB, OH, USA, 1976. [Google Scholar]
- Fleeter, S.; Holtmann, R.L.; McClure, R.B.; Sinnet, G.T. Experimental Investigation of a Supersonic Compressor Cascade; ARL TR 75-0208; Aerospace Research Laboratories: Wright-Patterson AFB, OH, USA, 1975. [Google Scholar]
- Fourmaux, A.; Gaillard, R.; Losfeld, G.; Meauzè, G. Test Results on the ARL 19 Supersonic Blade Cascade. ASME J. Turbomach. 1988, 110, 450–455. [Google Scholar] [CrossRef]
- Serovy, G.K.; Okiishi, T.H. Performance of a Compressor Cascade Configuration with Supersonic Entrance Flow—A Review and Comparison of Experiments in Three Installations. ASME J. Turbomach. 1988, 110, 441–449. [Google Scholar] [CrossRef]
- ANSYS Fluent. Fluent 16.2 User’s Guide; ANSYS Inc.: Canonsburg, PA, USA, 2015. [Google Scholar]
- Levine, P. The Two Dimensional Inflow Conditions for a Supersonic Compressor with Curved Blades. ASME J. Appl. Mech 1957, 24, 165–169. [Google Scholar]
- Lichtfuss, H.J.; Starken, H. Supersonic Cascade Flow. Prog. Aerosp. 1974, 15, 37–149. [Google Scholar] [CrossRef]
- Cumpsty, N.A. Compressor Aerodynamics; Longman Group: London, UK, 1984. [Google Scholar]
- Spalart, P.; Allmaras, S. A One-Equation Turbulence Model for Aerodynamic Flows. AIAA J. 1992, 439. [Google Scholar] [CrossRef]
- Launder, B.E.; Spalding, D.B. The Numerical Computation of Turbulent Flows. Comput. Methods Appl. Mech. Eng. 1974, 3, 269–289. [Google Scholar] [CrossRef]
- Yakhot, V.; Orszag, S.A. Renormalization Group Analysis of Turbulence. I. Basic Theory. J. Sci. Comput. 1986, 1, 3–51. [Google Scholar] [CrossRef]
- Shih, T.H.; Liou, W.W.; Shabbir, A.; Yang, Z.; Zhu, J. A New κ-ϵ Eddy Viscosity Model for High Reynolds Number Turbulent Flows. Comput. Fluids 1995, 24, 227–238. [Google Scholar] [CrossRef]
- Menter, F. Two-Equation Eddy-Viscosity Turbulence Models for Engineering Applications. AIAA J. 1994, 32, 1598–1605. [Google Scholar] [CrossRef]
- Schreiber, H.A.; Starken, H. Experimental Cascade Analysis of a Transonic Compressor Rotor Blade Section. J. Eng. Gas Turbines Power 1984, 106, 288–294. [Google Scholar] [CrossRef]
Figure 1.
Grids employed for the validation, with grid size increasing from top to bottom: (a) a close-up of the leading-edge; (b) a close-up of the trailing-edge; (c) overall view of the mesh.
Figure 1.
Grids employed for the validation, with grid size increasing from top to bottom: (a) a close-up of the leading-edge; (b) a close-up of the trailing-edge; (c) overall view of the mesh.
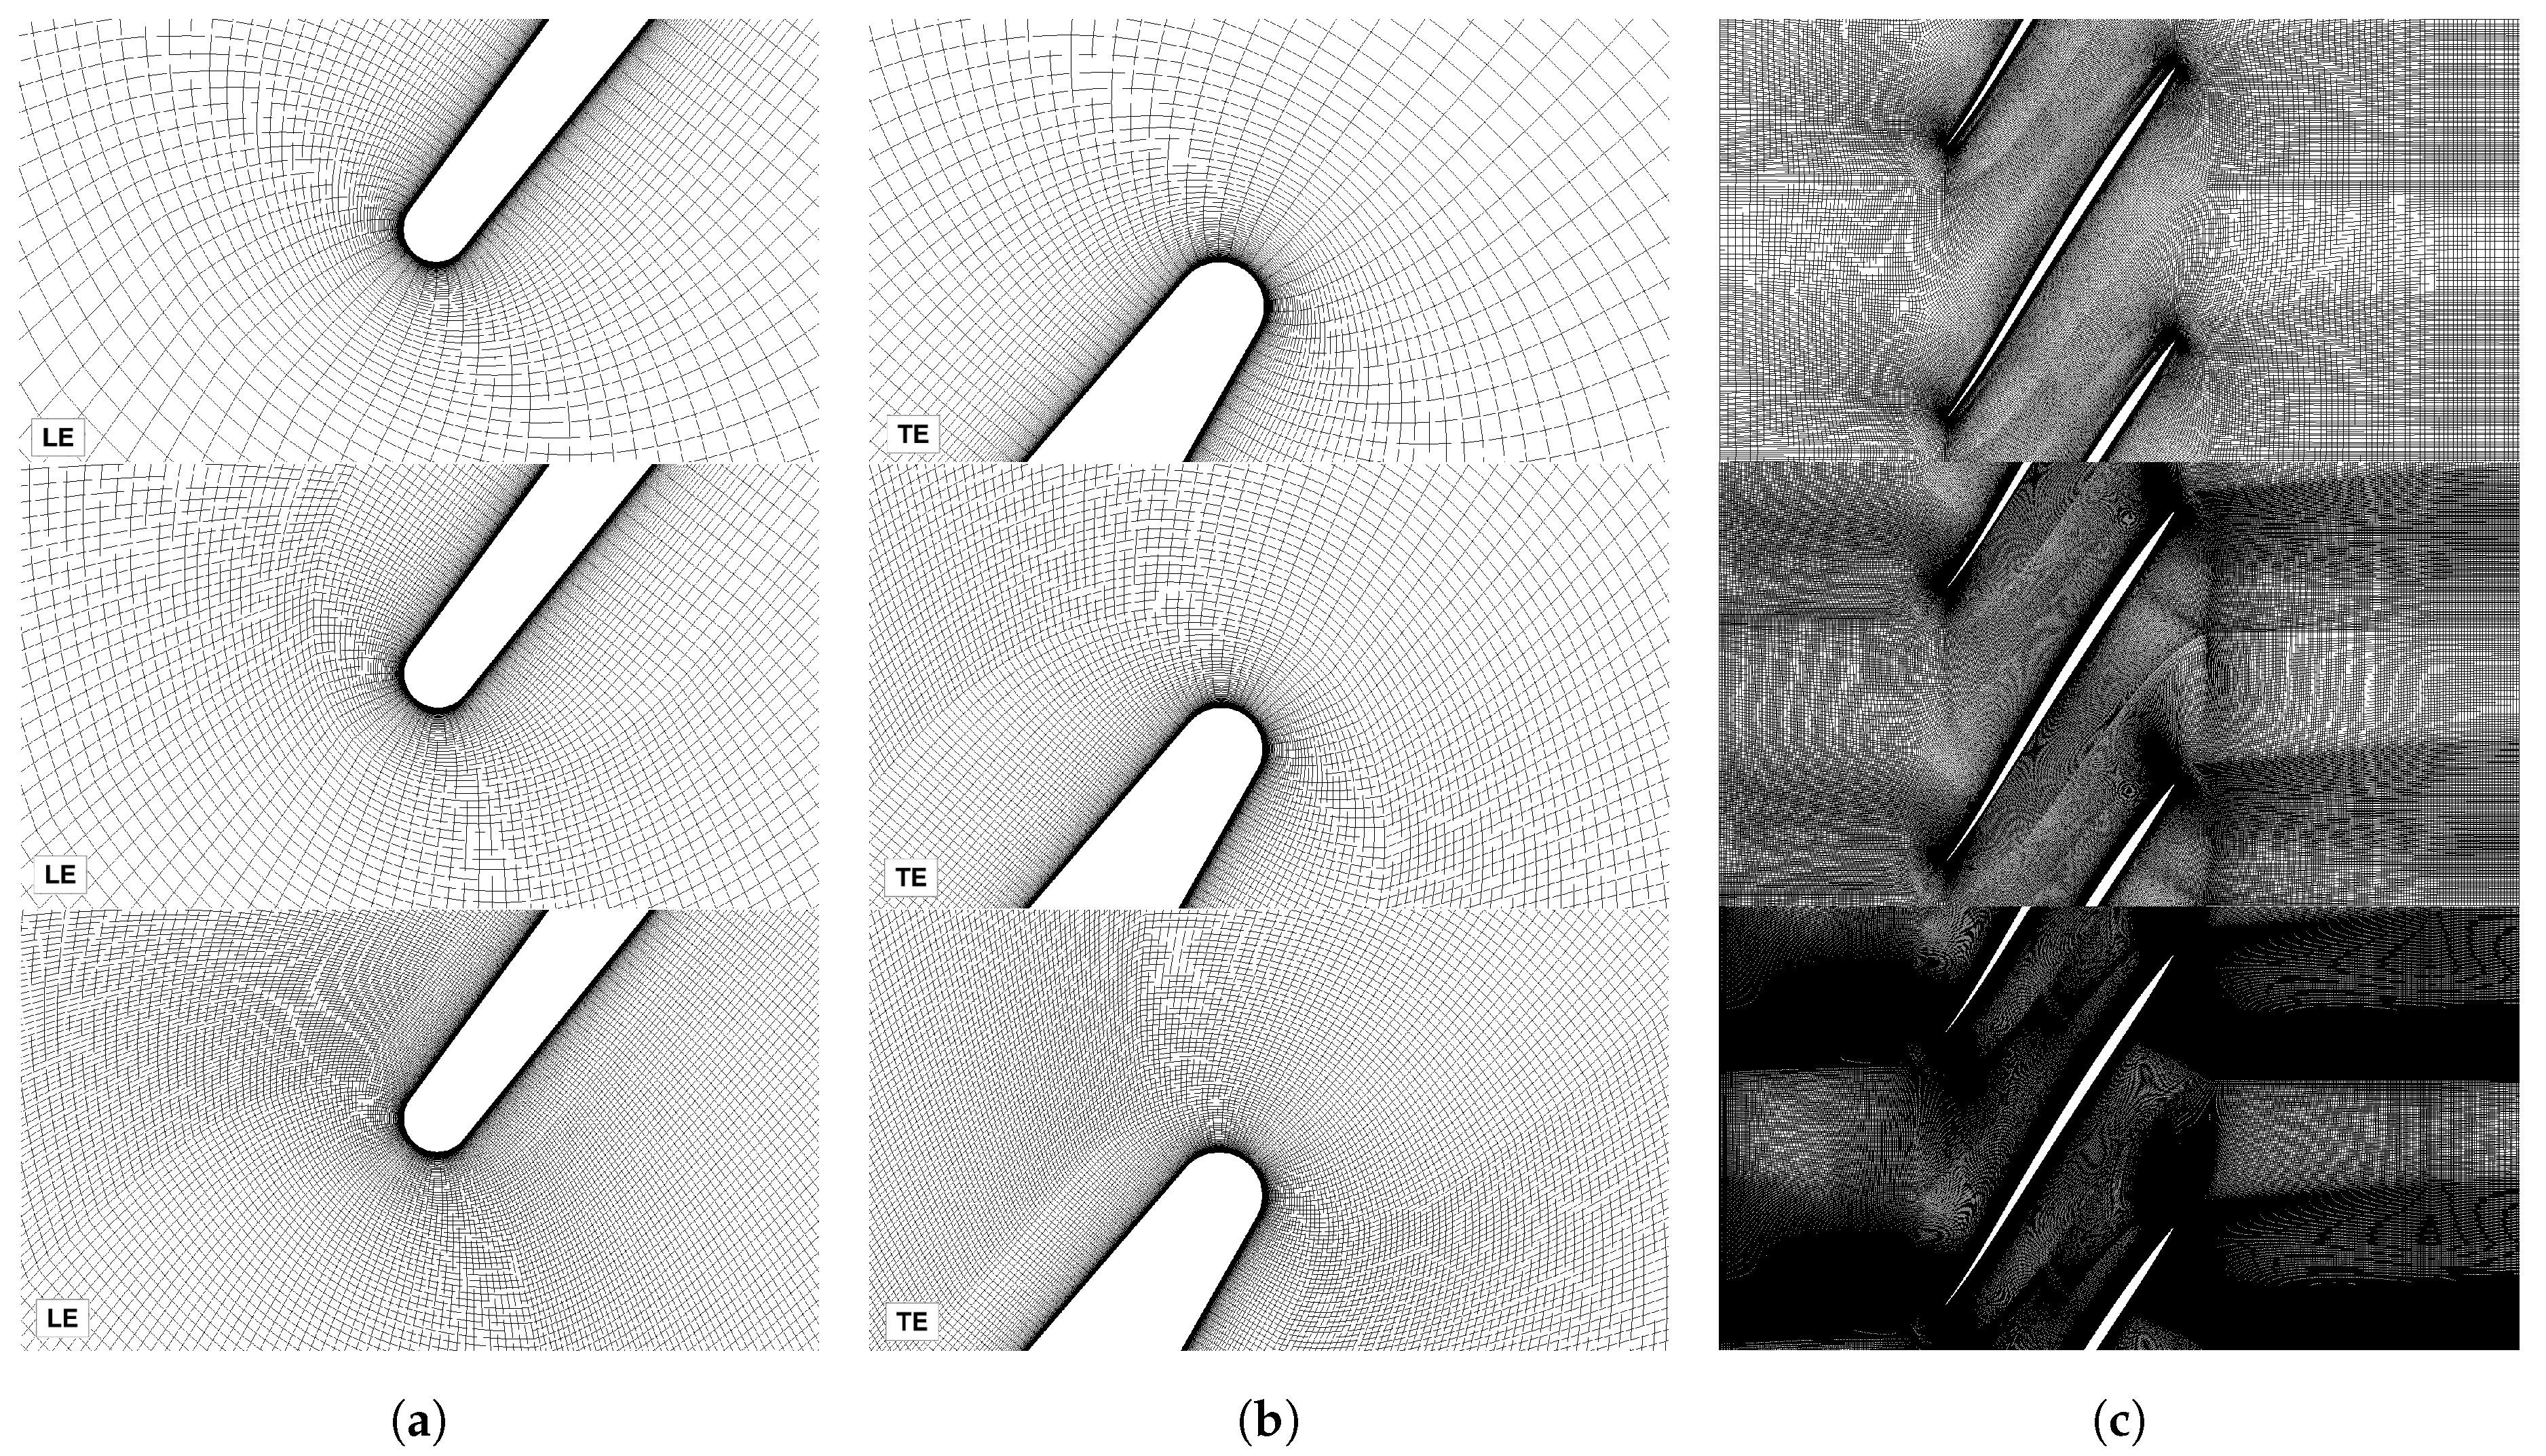
Figure 2.
Relative percentage error for the total-pressure loss coefficient as a function of grid size for the three test cases.
Figure 2.
Relative percentage error for the total-pressure loss coefficient as a function of grid size for the three test cases.

Figure 3.
Distribution of isentropic Mach number calculated for Test case 1: (a) S-A model; (b) STD k- model.
Figure 3.
Distribution of isentropic Mach number calculated for Test case 1: (a) S-A model; (b) STD k- model.

Figure 4.
Distribution of isentropic Mach number calculated for Test case 2: (a) S-A model; (b) STD k- model.
Figure 4.
Distribution of isentropic Mach number calculated for Test case 2: (a) S-A model; (b) STD k- model.

Figure 5.
Distribution of isentropic Mach number calculated for Test case 3: (a) S-A model; (b) STD k- model.
Figure 5.
Distribution of isentropic Mach number calculated for Test case 3: (a) S-A model; (b) STD k- model.

Figure 6.
Wake total pressure loss profile: (a) Test case 2; (b) Test case 3.

Figure 7.
(a) Unique incidence curves and (b) inlet axial Mach number curves of ARL-SL19 supersonic compressor cascade.
Figure 7.
(a) Unique incidence curves and (b) inlet axial Mach number curves of ARL-SL19 supersonic compressor cascade.

Figure 8.
Influence of inlet Mach number on: (a) maximum pressure ratio; (b) total-pressure loss coefficient.
Figure 8.
Influence of inlet Mach number on: (a) maximum pressure ratio; (b) total-pressure loss coefficient.

Figure 9.
Influence of inlet Mach number on: (a) exit Mach number ; (b) flow turning .

Figure 10.
Influence of static pressure ratio on total-pressure loss coefficient.

Figure 11.
Shock wave pattern () for increasing static pressure ratio: (a) ; (b) ; (c) .

Figure 12.
Shock wave pattern () for increasing static pressure ratio: (a) ; (b) ; (c) .

Figure 13.
(a) Influence of cascade solidity on total-pressure loss coefficient for a fixed static pressure ratio; (b) Influence of static pressure ratio on total-pressure loss coefficient for a fixed value of solidity.
Figure 13.
(a) Influence of cascade solidity on total-pressure loss coefficient for a fixed static pressure ratio; (b) Influence of static pressure ratio on total-pressure loss coefficient for a fixed value of solidity.


Table 1.
Grid dimension and grid quality parameters.
| Parameter | Coarse Mesh | Medium Mesh | Fine Mesh |
|---|---|---|---|
| Total elements | 100k | 200k | 500k |
| Minimum Orthogonal Quality | 0.79 | 0.78 | 0.77 |
| Maximum Ortho Skew | 0.21 | 0.22 | 0.23 |
Table 2.
Test cases data used for the validation.
| Parameter | Test Case 1 | Test Case 2 | Test Case 3 | |
|---|---|---|---|---|
| Input | ||||
| inlet Mach number | 1.58 | 1.58 | 1.59 | |
| inlet flow angle | 57.9° | 57.9° | 57.9° | |
| static pressure ratio | 2.16 | 2.12 | 2.21 | |
| axial velocity-density ratio | AVDR | 1.00 | 0.99 | 1.02 |
| Output | ||||
| exit Mach number | 0.91 | 0.93 | - | |
| exit flow angle | 60.8° | 61.2° | 60.2° | |
| total-pressure loss coefficient | 0.143 | 0.144 | 0.150 |
Table 3.
Design data of ARL-SL19 supersonic cascade.
| Input | Output | ||
|---|---|---|---|
| 1.612 | 0.87 | ||
| / | 2.15 | 0.143 | |
| 57.6° | 61.0° | ||
| AVDR | 1.00 | −3.4° | |
Table 4.
CFD results for the three test cases.
| AVDR = 1.00 | ||||||||||
| Mesh Coarse 100k | Mesh Medium 200k | Mesh Fine 500k | ||||||||
| Exp. | S-A | STD - | SST - | S-A | STD - | SST - | S-A | STD - | SST - | |
| 57.9 | 58.4 | 58.6 | 58.3 | 58.4 | 58.6 | 58.3 | 58.4 | 58.6 | 58.3 | |
| 0.91 | 0.91 | 0.90 | 0.91 | 0.91 | 0.90 | 0.92 | 0.91 | 0.90 | 0.92 | |
| 60.8 | 61.1 | 60.9 | 61.3 | 61.1 | 60.8 | 61.3 | 61.1 | 60.8 | 61.3 | |
| 0.143 | 0.138 | 0.149 | 0.128 | 0.135 | 0.146 | 0.123 | 0.135 | 0.145 | 0.123 | |
| AVDR = 0.99 | ||||||||||
| Mesh Coarse 100k | Mesh Medium 200k | Mesh Fine 500k | ||||||||
| Exp. | S-A | STD - | SST - | S-A | STD - | SST - | S-A | STD - | SST - | |
| 57.9 | 58.4 | 58.6 | 58.3 | 58.4 | 58.6 | 58.3 | 58.4 | 58.6 | 58.3 | |
| 0.93 | 0.92 | 0.91 | 0.93 | 0.92 | 0.91 | 0.93 | 0.92 | 0.91 | 0.93 | |
| 61.2 | 61.2 | 60.9 | 61.3 | 61.2 | 60.9 | 61.3 | 61.2 | 60.9 | 61.3 | |
| 0.144 | 0.140 | 0.151 | 0.132 | 0.137 | 0.148 | 0.128 | 0.137 | 0.148 | 0.128 | |
| AVDR = 1.02 | ||||||||||
| Mesh Coarse 100k | Mesh Medium 200k | Mesh Fine 500k | ||||||||
| Exp. | S-A | STD - | SST - | S-A | STD - | SST - | S-A | STD - | SST - | |
| 57.9 | 58.3 | 58.5 | 58.2 | 58.3 | 58.5 | 58.3 | 58.3 | 58.5 | 58.3 | |
| - | 0.90 | 0.89 | 0.91 | 0.90 | 0.89 | 0.91 | 0.90 | 0.89 | 0.91 | |
| 60.2 | 61.2 | 60.9 | 61.3 | 61.2 | 60.9 | 61.3 | 61.2 | 60.9 | 61.3 | |
| 0.150 | 0.136 | 0.149 | 0.124 | 0.133 | 0.147 | 0.120 | 0.133 | 0.147 | 0.120 | |
Table 5.
CFD results at cascade design operating condition calculated with S-A.
| Parameter | Exp. | Calculation |
|---|---|---|
| 57.6° | 58.2° | |
| 61.0° | 61.6° | |
| −3.4° | −3.4° | |
| 0.143 | 0.142 | |
| 0.87 | 0.85 |
© 2019 by the authors. Licensee MDPI, Basel, Switzerland. This article is an open access article distributed under the terms and conditions of the Creative Commons Attribution (CC BY) license (http://creativecommons.org/licenses/by/4.0/).
Share and Cite
MDPI and ACS Style
Piovesan, T.; Magrini, A.; Benini, E. Accurate 2-D Modelling of Transonic Compressor Cascade Aerodynamics. Aerospace 2019, 6, 57. https://doi.org/10.3390/aerospace6050057
AMA Style
Piovesan T, Magrini A, Benini E. Accurate 2-D Modelling of Transonic Compressor Cascade Aerodynamics. Aerospace. 2019; 6(5):57. https://doi.org/10.3390/aerospace6050057
Chicago/Turabian StylePiovesan, Tommaso, Andrea Magrini, and Ernesto Benini. 2019. "Accurate 2-D Modelling of Transonic Compressor Cascade Aerodynamics" Aerospace 6, no. 5: 57. https://doi.org/10.3390/aerospace6050057
Note that from the first issue of 2016, this journal uses article numbers instead of page numbers. See further details here.