A Test-Bed For Measuring UAS Servo Reliability


1
B. Thomas Golisano College of Computing and Information Sciences, Rochester Institute of Technology, Rochester, NY 14623, USA
2
Department of Aviation, John D. Odegard School of Aerospace Sciences, University of North Dakota, Grand Forks, ND 58202, USA
3
Department of Electrical Engineering & Computer Science, College of Engineering and Mines, University of North Dakota, Grand Forks, ND 58202, USA
*
Author to whom correspondence should be addressed.
Aerospace 2019, 6(9), 96; https://doi.org/10.3390/aerospace6090096
Submission received: 22 July 2019
/
Revised: 13 August 2019
/
Accepted: 27 August 2019
/
Published: 3 September 2019
Abstract
:Extant literature suggests minimal research on the reliability of Commercial off-the-shelf (COTS) components used in fabricating non-military Unmanned Aerial System (UAS). Stochastic failures of components during operational cycles over time poses a safety hazard to flight operations. The purpose of the study was to critically assess the operational performance standards (reliability) of a laboratory designed UAS component test-bed operated using real-world data collected from a Boeing Scan Eagle® UAS aileron servo unit via a flight data recorder. The study hypothesized that the test-bed’s reliability, in terms of a measured encoder output of commanded servo positions, will not be significantly different after double and triple periods of time for continuous operations compared to a base-line mean position. Results suggested that test-bed operated within reliability criteria for a baseline period but there were significant differences in the mean of the reliability after the operational cycles were doubled and tripled in time. This study adds to paucity of extant research on UAS COTS reliability and recommends further studies on reliability of other small UAS components within periods of time.
1. Introduction
The seemingly rapid evolution of Unmanned Aerial Systems (UAS), also known as Unmanned Air Vehicles (UAV), in contemporary times have shifted the operational paradigms in aviation and has also brought contemporary challenges related to the development of safer and efficient UAS within National Airspaces (NAS) globally. Despite the obvious proliferation in the use of UAS in various operational activities both civil and military, one of the numerous challenges faced in the design and fabrication of UAS has been a means of assessing the reliability of systems components over varying operational cycles to determine critical failure characteristics with time. Of most concerns have been the proliferation of commercial-off-the-shelf (COTS) components used in the building of small UAS (55 lbs. and below), and used mostly for recreational and civil-related activities [1,2,3,4,5,6,7,8].
According to the Federal Aviation Administration (FAA) Aerospace Forecast (2019–2039) for UAS, the non-model UAS (non-hobby) registration reached 277,000 in the fourth quarter of 2018, while the model UAS (hobby) registration reached 903,588 in the same quarter. Wargo et al. [9] forecast that UAS’ future is to have a market annual demand of about 70,000 for state-use, and 170,000 for the commercial sector, by the year 2035 in the United States. One of the pillars of the success of UAS technology is the availability and cost-effectiveness of its components or sub-systems; most UAS systems and components are within the reach of any interested organization or individual. This means that most of these subsystems are COTS that are ready to use after fabrication, which makes it convenient to design and construct a fully functioning UAS that meets many real-life applications.
However, COTS convenience often comes with a reliability price: they are usually sold with no-liability or limited-liability to its manufacturers even though in the US, technical standards for aircraft are covered under 14 CFR Part 25, which requires a rigorous safety risk analysis and quality control assessment for all components used in the assembly of aircraft. The American National Safety Institute (ANSI) formed a UAS Standardization Committee (UASSC) in September 2017 to develop a Standardization Roadmap for Unmanned Aircraft Systems. The committee released the outcome of a thorough Gap Analysis in 2018 which determined that although there are numerous published quality standards applicable to aviation/aerospace systems (primarily manned), there was only one published quality standard (ASTM F3003-14, Standard Specification for Quality Assurance of a Small Unmanned Aircraft System (sUAS)) that is specific to UAS. There was also only one quality standard in development for manufacturers of aircraft systems (ASTM WK51467, New Specification for Quality Assurance for Manufacturers of Aircraft Systems) and was not UAS-specific.
The European Union (EU) requires that UAS from third-countries entering the EU market comply with the requirements of Part 7. Para.3 of the COMMISSION DELEGATED REGULATION (EU) 2019/945 of 12 March 2019 on UAS if they are intended to be operated in the ‘open’ category. In particular, it should be ensured that manufacturers carry out appropriate conformity assessment procedures. Provision should therefore be made for importers to make sure that the UAS they place on the market comply with the requirements of this regulation. The EU provisions also require importers to make sure that the conformity assessment procedures have been carried out and that the technical documentation drawn up by the manufacturers is available for inspection by the competent national authorities.
The challenge, however, may be the broad-reaching effect on sub-systems and components acquired COTS and used to assembly UAS by general aviation enthusiast who will then operate it in the national airspace. This serious problem plagues the fledgling UAS original equipment manufacturing (OEM) industry and potentially affects progress towards technological and economic maturity for these stakeholders and jeopardizes its path to maturity. Unlike manned aviation systems, UAS’s sub-systems lack the exhaustive reliability tests in general and destructive tests in particular, especially in the US and precipitates the need for a concerted effort by academia, industry and regulators for comprehensive research and development in the area of COTS components reliability and performance standards for UAS [10].
Another important aspect of design and certification standards for UAS especially the small and mini-categories may be the variability in the certification processes. This means that with these categories of UAS using COTS components, the certification basis will probably accept non-aerospace reliability standards. In other words, the reliability requirements (for example on flight controls) could be verified with standards that lead to a high variability of failure rate evaluation methods adopted by the following functional safety standards to achieve tolerable risks [11]. Some authors emphasize the importance of the reliability of on-board systems by projecting the operations of UAS into air spaces that are integrated with those used by the civil aviation [12,13].
To highlight some of the challenges posed by certification and design standards for COTS components used in UAS, Logan et al. [6] conducted a study of the “technology challenges in small UAS development” at the NASA Langley Research Center. After conducting a test of more than 30 combinations of different vendor UAS COTS components, including servos, they found that ‘over 60% of the configurations tested had some form of problem consisting of either erratic behavior, jitter, control reset, overheating, or system instability over time’. The study concluded that ‘improvements in avionics reliability, stability, and compatibility are a clear need, particularly in low-cost applications’. Therefore, in most cases, there are concerns regarding the safety and operational capabilities of UAS to perform Beyond Visual Line of Sight (BVLOS) missions, where the aircraft is controlled, either autonomously, or remotely from no-visual-contact distance range.
As part of a contemporary push for more data-driven research and improvements in operational capabilities of UAS, a collaborative effort by the University of North Dakota and the State of North Dakota yielded a certificate of authorization (COA) for the conduct of BVLOS flights by UAS within a specified corridor of airspace in North Dakota, USA [14]. This COA may have been granted by the FAA due to the high fidelity of data collected over numerous research and suggest that with increasing reliability of components used in UAS fabrications, such feats are possible and regulators can give exemptions once performance-based navigational criteria are met.
One of the essential components to fixed-wing UAS flight-control, to maintain a safe flight, is the device which actuates its control surfaces. Electro servo motors are the most convenient choice to act as this actuating system in small UAS in that it is relatively cheap, compact in size, precise, controllable, and light-weight [15]. Though servos have all these advantages, they still dominantly suffer from limited information about reliability studies and examinations for reasons which relate to commercial competition and/or cost. Accordingly, this study focused on the design and implementation of a destructive testing platform to measure operational performance reliability and ultimately time to failure (TFF) of the electric servo prototype typically used in small UAS control (throttling, control surfaces, etc.).
In terms of the method for this research, a case-study approach was used to obtain the data of an operating servo for the study and then a quantitative analysis was conducted on the outputs of operational servo’s real-time actuating angles to determine the frequencies of the controlled surface movements. After that, the force conditions that servos normally operates in were calculated to simulate those on the proposed test-bed which was designed. Finally, a test-bed and its control system were designed and built for the experimental portion of the study, which aims at collecting servo’s commanded position data and actual measured servo movements (using a digital optical rotation encoder) through various time periods.
It was hypothesized that with high operational performance reliability, system components such as the servo (using test-bed) operating under varying simulated flight conditions will not have significant differences in the mean outputs of an encoder recorded position for similar commanded inputs (angles) over the simulated period of time.
There are many variations in the definition of reliability in safety science and reliability engineering but an accepted form is as follows: “Reliability is the probability of a device performing its purpose adequately for the period of time intended under the operating conditions encountered” [16]. In this paper and to define the scope of the study, UAS component operational performance reliability is defined as the probability that a UAS component will function effectively without significant variations in operational performance standards relative to a baseline measure over periodic cycles given that the component was fully functional at time (t = 0), as well as during pre-experimental test.
2. Related Work
Generically, studies related to reliability are essential in the aviation and aerospace industry. However, empirical studies related to reliability of UAS components and sub-components have been mostly limited as compared to manned aircraft [17,18]. With the recent proliferation in the operations of UAS and attendant safety concerns raised by regulators and researchers, it is important for a much broader focus to be placed on system and operational-performance reliability, especially in the COTS UAS market.
Casewell and Dodd [19] suggested that 25% of UAS operational failures can be attributed to electronic components failures. Such undesired states are subject to increase due to the use of less redundancies in electronic systems as a result of improvements in control softwares. Their study also mentions that the commercial-grade UAS components have a failure rate of two to three times more than their military-grade counterparts. The commercial components reliability criteria the study mentioned relied on Telcordia SR332, which is a standard used as a reference based on the components manufacturing entities.
Dermentzoudis [17] developed methods for the collection of data used in evaluating UAS reliability. The study was based on aggregated military UAS data collected from large fleets which may not be necessarily available for commercial application. Even though the study may indicate a more holistic nature due to the large data collected, it focused on statistical concerns about the whole UAS systems rather than individual sub-systems and how long they can remain functionally effective.
Uhlig et al. [20] studied COTS as a cause of failure in UAS systems. The study investigated the integration of the specific sub-systems and added some redundancy to the components used to see its influence on the reliability of the UAS. The study, however, did not offer statistical measures.
Bhamidipati et al. [18] undertook an important study on COTS used in UAS and their reliability. Though the study was intensive, the experiments were done on a single UAS and its engine, fuel throttling, and burning system. A follow up to the study could be the collection of data from several UAS and engines of the same model for analysis and cross-validation of the results.
Petritoli et al. [21,22] derived a model that can be used to perform an overall evaluation of the reliability of the UAS systems to improve the logistics of UAS maintenance plans. Their work was very well represented but there was no mention of a consistent tool to collect the data necessary to evaluate the system’s reliability and availability.
Tan et al. [23], as part of a study, suggested a reliability model for UAS that considers the human factor. Even though the results focused on a reliability model for UAS with some elements of human factors, there was not much emphasis on the hardware components of UAS and how their reliability state could affect the human operator’s performance.
Pan [24] investigated the use of hybrid data collection to detect anomalies which influence UAS reliability. The data collected was general performance data for the UAS systems like throttle, thrust, autopilot mode, altitude, static pressure, and other flight parameters. The mixture of data along with data from command switches were exploited to filter out unusual behavior in the UAS system as a whole. The study’s contribution is an anomaly detection model rather than a direct reliability study for the UAS systems.
It is therefore essential for comprehensive assessments of the reliability of components and sub-systems related to UAS. According to the FAA Handbook on Safety Risk Analysis [25]. An effective tool for proactively assessing the reliability and inherent safety risk posed by failure of components in a system is the Failure Mode, Effect and Criticality Analysis (FMECA). FMECA is designed to analyze all sorts of potential failure in each component, and by analyzing and computing criticality, FMECA may provide valuable information of imminent failures and its effect on system integrity and mission success. It helps the operator to conduct effective safety risk analysis and proactively bolster existing safety defences and counter-measures required to ensure safe operations of equipment [25].
FMECA as a safety risk analysis tool finds application in reliability assessment for aircraft systems and for improving operational reliability based on criticality index attributed to failures over operational period of time. A study that validates such assertions was conducted by LiJun and Xu [26] on aviation components reliability using mathematical models and the average of operational time predicted based on calculating failure probability of all electrical components. According to the process of reliability theory under-pinning FMECA, all kinds of failure mode, reasons, effects and criticality of the products could be determined completely. The results indicate that application of FMECA method assisted in analyzing reliability in detail and improved operational reliability of the test equipment. Their study provided theoretical bases and concrete measures for maintenance of the products to improve operational reliability.
According to Moubray [27], there are basically six unique failure patterns of components and equipment in aviation. The “bathtub curve” Failure Pattern has a high probability of failure when the equipment is new, followed by a low level of random failures, and followed by a sharp increase in failures at the end of its life. This pattern accounts for approximately 4% of failures. The “wear out curve” failure pattern consists of a low level of random failures, followed by a sharp increase in failures at the end of its life. The pattern accounts for approximately 2% of failures.
The “fatigue curve” is characterized by a gradually increasing level of failures over the course of the equipment’s life. This pattern accounts for approximately 5% of failures. The “initial break in curve” starts off with a very low level of failure followed by a sharp rise to a constant level. This pattern accounts for approximately 7% of failures. The “random pattern” failure is a consistent level of random failures over the life of the equipment with no pronounced increases or decreased related to the life of the equipment. This pattern accounts for approximately 11% of failures. Finally, the “the infant mortality curve” shows a high initial failure rate followed by a random level of failures. This pattern accounts for 68% of failures.
The investigation of Long et al. [28] provides considerable insight regarding potential impact of Mean Time Between Failures (MBTF) analysis on reliability and reduction in direct operational cost for UAS operations. Using the Predator and Global Hawk platforms, they assessed increases in MTBF over time as a metric for reliability, growth, and improvement. The study suggested that increasing MTBF was generally associated with increasing reliability, if failures are exponentially distributed—that is, if failures are random and do not impact one another.
Interestingly, Long et al., also carefully untangled all of the program costs and were able to determine the dollars devoted just to improvements in reliability over the time. They found that for Global Hawk, system failure rate was reduced by 42% from 2001 to 2006 and life cycle support costs were reduced by 23%. This finding allowed them to calculate a return on reliability dollar investment (RORI) of 5:1. For Predator, the figures were even more impressive. Between 1998 and 2006, improvements in platform reliability reduced failure rates by more than 48% and reduced life cycle support costs by 61%. The RORI in this case was 23:1.
There have been some studies using laboratory test-bed of UAS and associated sub-systems for evaluating various operational and safety parameters. Such studies are insightful and provides guidance for this study. Boggero et al. [29] designed a test-bench simulator to test a parallel hybrid propulsion architecture for aeronautical application. A dynamic relationship expressing the transmission of torque between the components, and the method of down-sizing the power delivered were highlighted. An application of the proposed methodology was then presented through the simulation of the take-off phase, and the torque time histories, angular velocities and powers generated on the virtual test-bench were used to verify the corresponding time histories expected in the real system.
Ali, Wang, and Masroor [30] also developed a novel Model Reference Adaptive Control (MRAC)-based hybrid control algorithm for the trajectory tracking of a tri-rotor Unmanned Aerial Vehicle (UAV) using a mathematical model of the tri-rotor is based on the Newton—Euler formula, whereas the MRAC-based hybrid controller consists of Fuzzy Proportional Integral Derivative (F-PID) and Fuzzy Proportional Derivative (F-PD) controllers. The proposed control algorithm was tested and verified using computer simulations for the trajectory tracking of the desired path as an input. The effectiveness of their proposed algorithm was compared with F-PID and the Fuzzy Logic Controller (FLC). They found out that the proposed controller exhibits much less steady state error, quick error convergence in the presence of disturbance or noise, and model uncertainties.
A comprehensive literature review will not be adequate without a mention of related standards for quality control and assurances for UAS within a global perspective. As stated earlier, the EU recently outlined provisions for UAS assembled or manufactured in the EU (Part 7. Para. 3 of the COMMISSION DELEGATED REGULATION (EU) 2019/945 of 12 March 2019 on Unmanned Aircraft Systems) that is very timely and relevant especially for the COTS UAS application. Under the new legislation, “The manufacturer shall take all measures necessary so that the manufacturing process and its monitoring ensure compliance of the manufactured product with the technical documentation referred to in point 2 of this Part and with the requirements set out in Parts 1, 5 or 6 which apply to them”.
Finally, conformity standards should be as per Part 9. Para. 1 which states that “ Conformity based on full quality assurance is the conformity assessment procedure whereby the manufacturer fulfills the obligations set out in points 2 and 5 and ensures and declares on his sole responsibility that the product concerned satisfies the applicable requirements set out in Parts 1 to 6”. These are all geared towards ensuring safety and reliability of UAS components. Despite the timeliness of these new EU provisions, there may be challenges related to adequate data for assessing the broad-reaching effects of these regulations on COTS sub-systems and components used to assemble small UAS by general aviation enthusiast who also operate in the national airspace [31].
In the US, the operational standards for UAS are prescribed in 14 CFR Part 107 and the design and technical standards for aircraft are covered by 14 CFR Part 25, which requires a rigorous safety risk analysis and quality control assessment for all components used in the assembly of aircraft.
As stated in the introduction, the ANSI-formed UAS Standardization Committee (UASS) Gap-Analysis report of 2018 also found out that as the size of UAS scales down, airborne equipment and components designed to existing control standards were too heavy, large, and/or power hungry and made it imperative for new standards to achieve an acceptable level of performance for smaller, lighter, more efficient, more economical systems. Finally, the report found out that many UAS introduce new capabilities which may not be mature (not statistically proven or widely used) and/or they may be proprietary, therefore industry standards do not exist yet. The report recommended new standards that will enable entirely new capabilities through a collaboration between academia, industry and regulatory bodies such as International Civil Aviation Organization (ICAO), American Society for Testing and Materials (ASTM), Society of Automotive Engineers (SAE) and FAA [32,33,34,35,36].
3. Methods and Materials Section
3.1. Case Study
The objective of this part of the study was to investigate the effectiveness of the experimental test-bed using data obtained from the deployments of the aileron servo of a Boeing Insitu ScanEagle®, which was recorded on the UAS’s Flight Data Recorder (FDR). This is a small (3.9 feet long, 10.2 feet wingspan, 39.7 lbs) and long-endurance (20+ h) UAS that can fly in BVLOS operations with a speed of 55–80 mph and a ceiling altitude of 16,000 feet. The UAS is equipped by a 3W [37] 2-stroke piston engine; 1.5 horsepower [38].
A pre-statistical analysis was performed on the data to define the ailerons’ most frequent positions as well as outliers in these positions, which are possible errors in read signals. The 7854 entries obtained from the FDR file were used to calculate the frequencies of the servo commanded positions. These frequencies were then normalized and used to repeat these positions in the experiments in proportion to the frequencies. Taking the maximum aileron deployment angle in cruise (Table 1) as a reference, the range was adopted as the sound range for the readings recorded in the FDR log files. Therefore, values which are outside this range were considered outliers. This decision was backed by examining the aileron deployment angles’ histogram.
3.2. Forces Calculation
Using the specification of the UAS’s aileron shown in Table 1, The aerodynamic forces exerted on the aileron control surface when deployed were calculated. Taking the air density to be the ICAO standard sea-level density: = 1.225 kg/m, the forces were calculated using Equation (1)
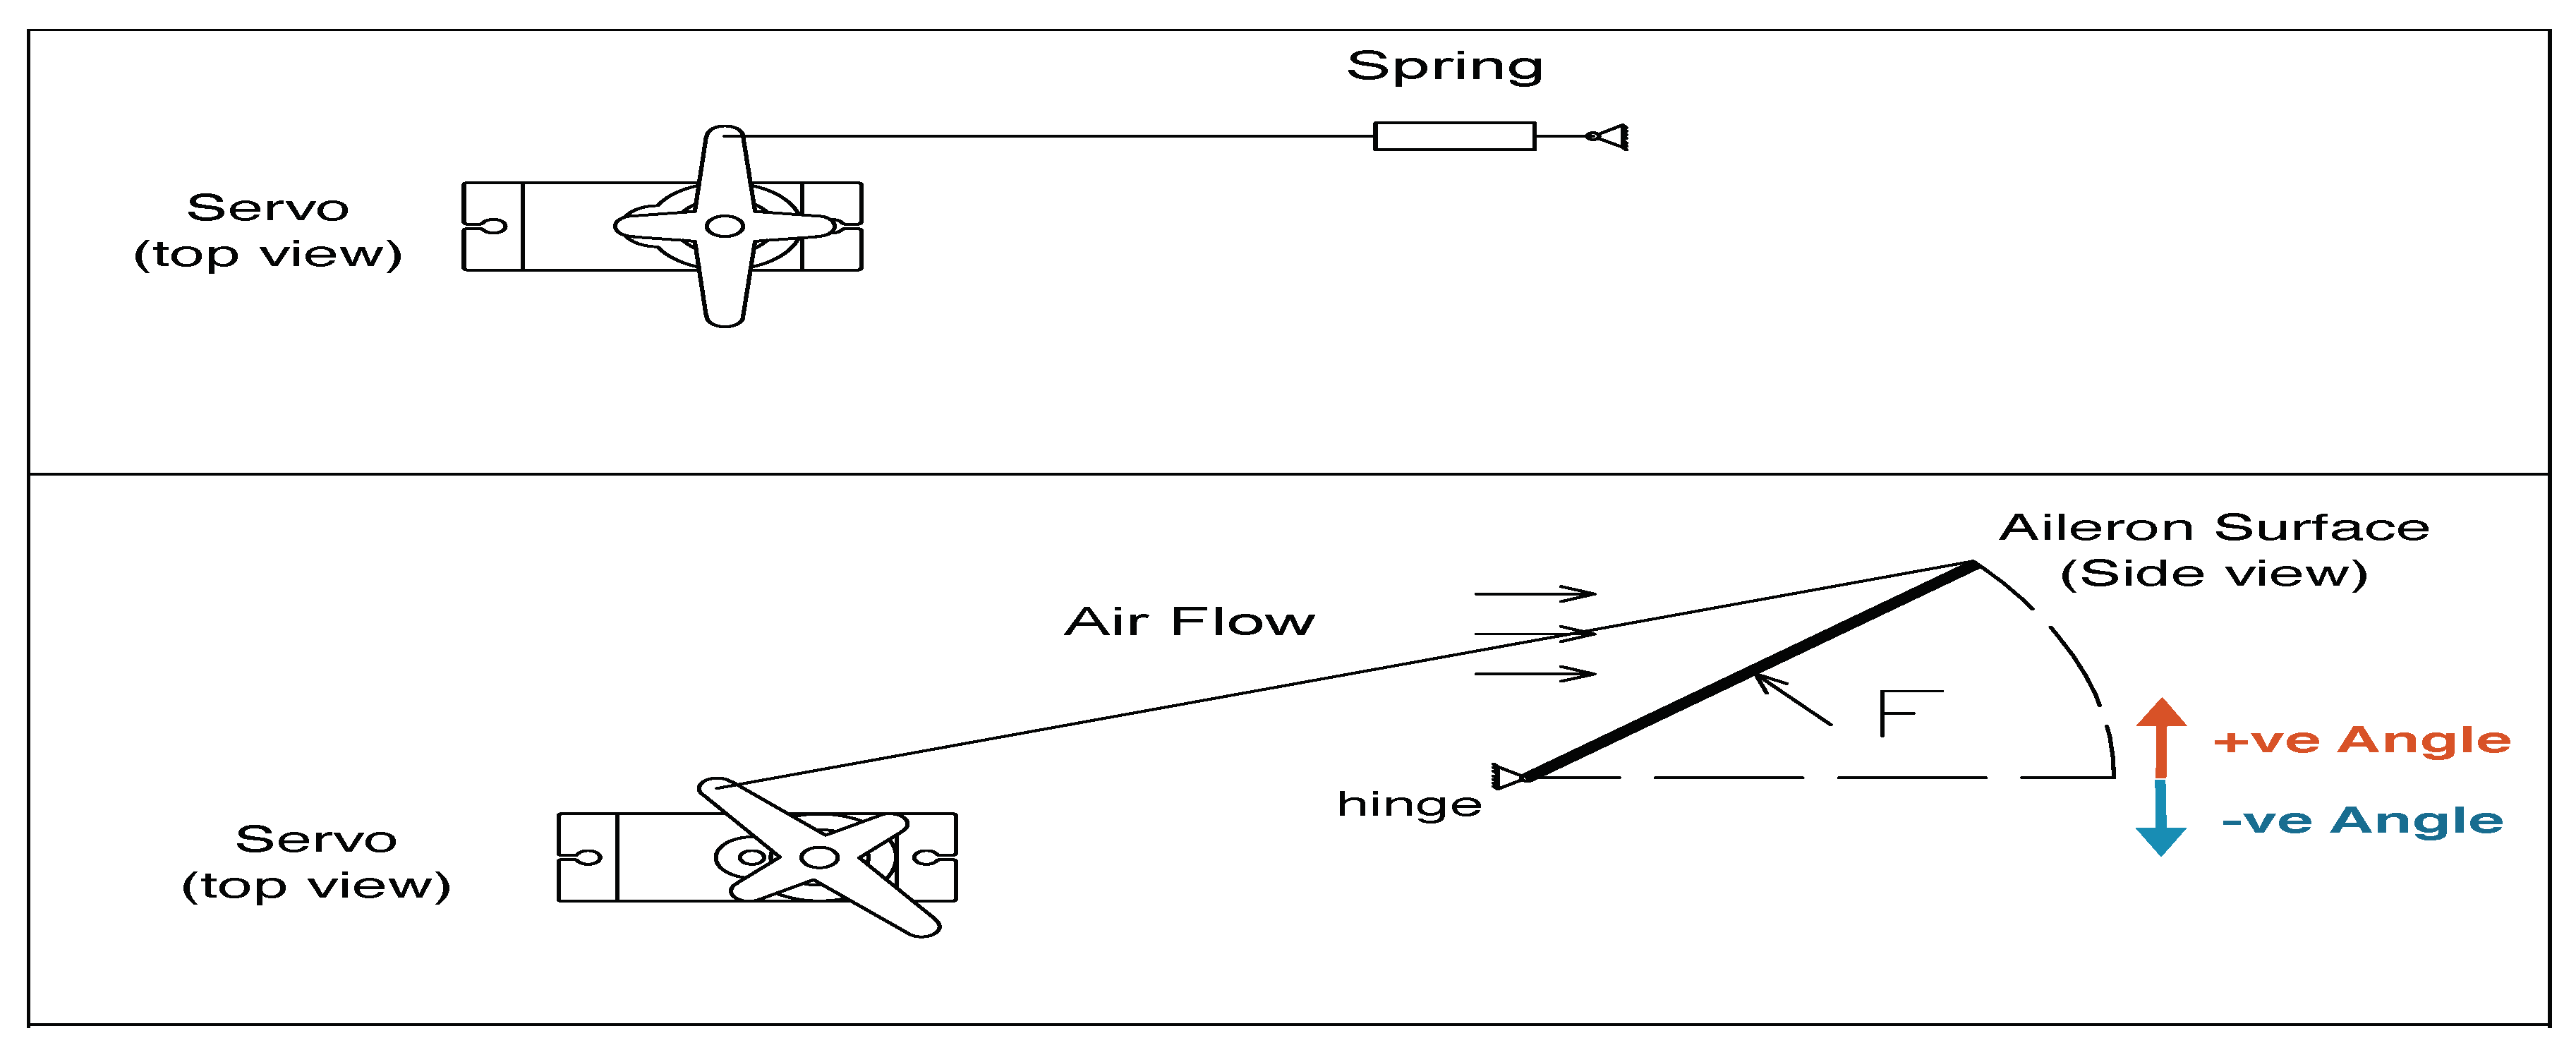
where F is the normal force acting on the control surface, is the air density, v is the aircraft speed, is the angle of the control surface to the horizontal, and A is the aileron surface area. The moment acting on the servo is derived from the force translated through the link between the servo and the control surface (F) given that the link length is fixed.
3.3. Forces Simulation
To simulate the force acting on the control-surface, and consequently on the servo, an extension constant force mechanical spring (force relates linearly to spring extension) was used (Figure 1). The force which acts on the control-surface changes as the angle of the control-surface changes. The spring was picked so that its resistance is linear and obeys Hooks law (Equation (2)). The maximum force acting on the control surface (at the maximum deploying angle) should be covered in the maximum extension of the spring.
where F: spring’s resistance, k: spring’s stiffness, and x: is the length of the extension of the spring.
3.4. Data Preparation
Boeing Insitu ScanEagle® is equipped with a Horizon MicroPilot® [39] flight controller. Flight data was downloaded after each flight using a MicroPilot software product called Logviewer® using a computer.
The study’s used data file is 7854 entries representing data points collected from a point-to-point flight. The UAS’s autopilot samples data at the rate of 5 samples per seconds. This means that the data covers about 26.2 min flight. The maximum altitude reached in the recorded flight was 2267 feet. The FDR saves the aileron servo position in measurement units called ‘fine servo units’. These units range between −32,767 and +32,767 and had to be converted to rotational degrees given that the servo rotation range is .
An FDR log file was used to statistically study the positions of the servo during flight. The negative positions () had a mean angular displacement of −11.60 degrees and standard deviation of 9.485. The positive positions () had a mean angular displacement of 16.27 degrees and standard deviation of 10.597. Table 2 and Table 3 highlights the details of the descriptive statistics respectfully. As depicted, the number of positive aileron positions exceed the number of negative positions, which is expected because negative position acts as an aid for the positive position on the opposite side aileron in severe maneuvers [40,41].
A list of positions (positive and negative) was prepared based on FDR data output to reflect the angles that the servo operate in real life and their frequencies. This list took into consideration the real-life servo operation and represented this in the number of times each position appear in the list. Table 4 depicts a sample of the prepared list based on the FDR file.
4. Implementation
The main concept with the test-bed was to let the servo operate in all the positions that were collected from the statistical study performed on the FDR file. The design of the test-bed platform exploited a digital rotary encoder to log the output position of the servo when it reached its commanded input position. The operations considered the frequency of the position such that the servo on the test bed runs more on the positions that occurred in the real-life operations, to get a more realistic result. The servo kept operating and its actual positions were recorded along with their corresponding commanded positions, meaning the inputs and outputs of the servo were logged. The logged data were compared to determine if there were any significant differences in the mean values of the input and output of servo displacement over the simulated period until the servo failed or became functionally ineffective.
4.1. Hardware
4.1.1. Computer-Aided Design (CAD) Design
After calculating the forces acting on the servo and choosing the spring to simulate these forces, a CAD was used to build a 3-D design for the platform. One of the major points which was considered in this step of the study was the alignment of the servo shaft and the encoder shaft. This is particularly important because any misalignment between the two shafts would result in additional shear forces, which would be added to the ones actually acting on the servo and considered in the design.
Figure 2a shows the CAD 3-D drawing for the platform and its internal composition. Figure 2b shows the CAD 3-D realistic drawing for the platform.
The platform consisted of a Fixed-base for the servo which can move on the X-Y horizontal plane (Figure 3a). A magnet was fixed at the bottom of the base to let it move in the X-Y plane on a gallivanted steel sheet. This 2-D movement allows for adjustment of the servo position to the encoder position. The fixed base has a moving base above it where the servo is attached. The Servo-base is allowed to move in the Z-direction to further adjust the servo position with respect to the encoder position (Figure 3b). The Servo-base is fixed to the Fixed-base by a bolt which screws into the nut fixed inside the Fixed-base. After the servo is in the right position, the Servo-base is tightened using another nut to restrict it from moving up and down during the test. The Right-arm and the Left-arm (Figure 3c) are used to hinge the load springs from one side. The Encoder-base houses the optical-digital encoder and it purely fixed to the gallivanted steel sheet (Figure 3d).
The designed test-bed for this research did not induce significant vibration levels given that the servo motors used are not reciprocating type. In addition, the experiments were designed so that the servos operate in steps (one degree at a step), which would alleviate the vibrations induced by the dynamic forces generated while unloading the springs.
4.1.2. Microcontrollers and Computer
The study used two Arduino UNO® controlling chips. Each chip has a ATmega328 microcontroller with 32 Kb flash memory, 2 kb SRAM and a 20 MHz oscillator. The first one was used to receive input commanded servo positions (one at a time) from a computer and command the servo position by sending to the servo one position at a time. The second microcontroller was used to read the position output by the rotary encoder and send it back to the computer for logging. The two controllers have a 16 MHz clock speed. Serial ports were used to communicate with the controllers.
4.1.3. Optical Rotary Encoder
An optical rotary encoder with 1024 PPR (Pulse Per Revolution) was used to sense the actual positions of the servo as it moves to the commanded positions (Figure 4). The encoder reads the changes in angles (positions) as steps and those steps are later translated to positions (or change in positions). There are a variety of rotary encoders and the optical has higher precision [43,44].
4.2. Embedded System
The first microcontroller was programmed to send the commanded servo positions to the servo and to maintain a uniform speed in servo motion to obtain accurate readings from the rotary encoder. To keep the speed uniform, the servo positions were sent in steps of degrees to the servo in 232 milliseconds time units. When a position was successfully commanded to servo, the microcontroller sends a signal to the computer to affirm the completion of the command and the position commanded. Algorithm 1 is a snippet of the code.
| Algorithm 1 Servo Controller |
| 1: procedure Servo_Control 2: 3: 4: 5: 6: 7: 8: 9: loop: 10: for do 11: if then 12: 13: else 14: 15: 16: 17: 18: goto loop. |
The program embedded in the second microcontroller reads the steps recorded by the rotary encoder and sends it to the computer. When the first microcontroller reports the completion of the command of a position, the computer records the steps counted by the encoder’s microcontroller with the commanded position reported by the servo’s microcontroller. Algorithm 2 is a snippet of the code.
| Algorithm 2 Encoder Controller |
| 1: procedure Encoder_Control 2: 3: 4: 5: loop 6: 7: if then 8: if then 9: 10: else 11: -1 12: 13: 14: goto loop. |
4.3. Translating and Calibrating The Encoder’s Signals
The rotary encoder measures the rotation using optical signals captured as the encoder’s shaft rotates [45]. These measurements are dependent on the rotation speed of the shaft. To maintain sound readings from the encoder, the speed of the servo is maintained uniform by controlling it from the servo’s microcontroller. In addition, the actual readings of the encoder are steps (pulses) and not angles. Therefore, the readings were translated to angles by referring to the first round of logging. For example, if the first set of commanded positions were and its corresponding encoder reading were encoder pulses in the positive direction, then these encoder readings are fixed for these angles and later encoder readings for positions changing rounds are compared to these encoder readings.
5. Methodology
The main concept underlying this experimental design was to determine the effect of time or periodic cycles on the reliability of a UAS aileron servo operated in various actuator positions continuously using real-time FDR data-derived positions. The objective of the research was to use a laboratory test-bed to assess the level of variations in operational performance standards and possible failure of a servo continuously operated at various actuated angles over periods of time. Specifically, the test-bed will be run at various commanded positions simulating real-life flight conditions and the actual output of the control surface actuated by the servo will be measured and compared (input commanded positions and actual position will be logged using a digital rotary encoder). The set-up will be kept running over several cycles in time to determine when the system will fail or there will be significant variations in operational performance standards as compared to a standard established for the baseline period. It is hypothesized that with high fidelity (in terms of the design of the test-bed) and reliability of the servo motor, the mean value of the encoder recorded position for the baseline period will not vary with increasing time and subsequent cycles. The implication is that the test-bed servo will continue to perform its function effectively over the period of the experiment without significant variations in operational performance standards relative to the baseline measure. Significant variations in terms of the recorded values for the encoder recorded position compared to the commanded servo positions will suggest undesired reliability state and potential failure of the system within time period. Thus, the hypotheses were as follows:
- Null Hypothesis:
- Alternative Hypothesis:
Procedure
After almost 360 h of continuous operations (approximately 15 days), the data was extracted from a digital recorder which was part of the simulated set-up [Using a secured digital (SD) card]. The data was recorded in a Comma Separated Values (CSV) file format. A descriptive statistics summary showing the total cycles over the experimental periods for commanded positions of the servo and corresponding positions logged by optical encoder over time period are shown in Table 5. Figure 5 and Figure 6 show the histogram with normal curve for the total data set of the servo position and encoder recordings respectively.
The dataset of valid total sample size used for analysis for both variables was further split into three periods based on cycles within a time frame (first 130,000; second 130,000; third 130,000). Out of each cache of data, random samples of 5000 were drawn using IBM SPSS® 25 “select dataset random” function. The frequencies of various commanded positions of servo (−30 to +40) were determined and the mean value of their output in the form of encoder recordings were also determined. The process was repeated for the other two datasets.
Three datasets, each with sample size (n = 48) were obtained and since they were derived from the same servo-unit of the test-bed, a one-way repeated-measure ANOVA design analysis was conducted to determine the levels of variability among the means of the outcome encoder readings for the three datasets. The objective was to determine if there were significant variations in encoder readings for commanded servo positions between the baseline (first 130,000 cycles) and subsequent periods (second and third) till the end of of the experimental period. Table 6 shows the descriptive statistics of the encoder readings for the random samples of commanded positions of the servo.
6. Results and Discussion
The study sought to evaluate the reliability of a designed-test bed simulating a UAS aileron servo-unit by using an optical encoder recorder to log the actual position of the test-unit derived from an input command servo position. The study hypothesized that there will be no significant differences in the mean positions recorded by the optical encoder for the entire spectrum of commanded servo positions within time period [baseline (130,000 cycles), period two (260,000 cycles) and period three (390,000 cycles).
The rationale for the study hypothesis was that if the designed test-bed has consistent operational performance standards then there will be no significant variations in the means of the servo position recorded by the optical encoder as a result of an input commanded servo position for the three cyclic periods of the study.
A one-way repeated measures ANOVA was performed. The mean values of encoder recordings of input commands for the servo positions (−30 to +40) was derived from a random sample of 5000 drawn from the three periods. The derived dataset () for each three periods were used for the analysis. The sample size was large enough for the assumptions of multivariate normality to be satisfied. The Mauchly test was performed to assess possible violation of the sphericity assumption; this was significant: Mauchly’s , , ; suggesting a possible violation of sphericity assumption [46]. The Greenhouse-Geisser value of was not close to , and correction was made to the degrees of freedom used to evaluate the significance of the F ratio. The overall F for differences in mean encoder recordings across the three cyclic periods was statistically significant: , ; the corresponding effect size was a partial of . In other words, after stable individual differences in various commanded servo positions are considered, about of the variance in encoder position recorded was related to time. Please note that when the correction factor was applied to the degrees of freedom for F, the obtained value of F for differences in mean encoder recording among levels of commanded servo positions remained statistically significant.
Planned contrasts were obtained to compare mean encoder recorded values for each of the two time periods with the mean encoder recording during baseline = 54.33; SE = 6.468; 95%CI, 41.32–67.35). Mean encoder recordings during the second period = 59.93; SE = 7.261; 95%CI, 45.32–74.54) was significantly higher than baseline encoder recorded value = 27.49, p = 0.000. Mean encoder recorded value for the third period = 66.69; SE = 7.958; 95%CI, 50.68–82.70) was significantly higher than the baseline and second period = 9.79, p = 0.003. Due to the possible violations of sphericity and corrections for the F using Greenhouse-Geisser estimate of sphericity, a further multivariate analysis was conducted, and all three test statistics were significant (using = 0.05 as the criterion). The encoder recorded values for commanded servo positions were significantly affected by time, Pillai’s Trace V = 0.479, = 21.15, p = 0.000. The corresponding effect size of indicated a strong effect.
To highlight the variations graphically, Figure 7 shows a simple bar (mean) of encoder recordings at various period (cycles) for commanded servo positions. Figure 8 depicts a clustered bar (mean) of encoder recordings with servo directions (negative and positive) and Figure 9 shows a simple scatter with fit line of encoder recordings against commanded servo positions. The scatter plot suggests a significant variation in encoder recording during the third period especially for commanded servo position range of to . The scatter also suggests that there are minimal variations in the negative commanded positions of the servo across all spans of the periods studied as shown by Figure 8. Though this was not anticipated, a reason behind this could be that the servo used in the experiment may have had a manufacturing defect with the hardware. Another explanation might be that the negative aileron angles do not have high values and are not frequent compared to the positive ones (Figure 5).
Comparing the current findings with that of Long et al. [28], it is essential that the reliability analysis based on periodic analysis should be a focus not only in the more formal military UAS applications, but the varied and more common COTS manufactured components. The findings in both studies suggest that when reliability or operational performance standards become a focus of management, it can be improved significantly even for systems developed and transitioned under accelerated circumstances when quality and reliability have to take second place behind other priorities. With more studies and research data on the current focus of study, it is envisaged that COTS manufactured UAS component’s reliability will improve over time. This is because such studies will produce knowledge and experience with the technology gained both in the production plant and in the field by users. This is very important in building a veritable body of knowledge.
This study underpins Casewell and Dodd’s earlier findings [19] that commercial grade UAS components are more prone to failures than military-grade components. It is suggested that non-sensitive and non-classified data on reliability of UAS components in military application be shared with academia and civil industry players so that technological synergy and spin-offs can improve COTS UAS component reliability. Even though this study did not operate the test-bed to complete failure, the significant variation in operational performance standards over time buttresses the need for such research as recommended by the UASSC Gap-Analysis and the new EU UAS standards. This study also adds a quantitative and statistical dimensions to earlier findings of Uhlig [18]. who studied COTS as a cause of failure in UAS systems. Their study investigated the integration of the specific sub-systems and added some redundancy to the components used to see its influence on the reliability of the UAS.
The study also underpins the importance of using significant variations in components and sub-systems operational performance standards to predict potential failure states and its effect on the entire system as done in FMECA. Such significant variations in operational performance standards can affect how criticality index is assigned over time in FMECA [47]. Even though a complete FMECA was not applied in this study, the current study attempted to establish a relationship between time/cycles and reliability using the time cycle components of FMECA as recommended by LiJun and Xu [26] who predicted the mean time to failure of electrical components in UAS using mathematical models and failure probability. It is envisaged that time to failure and significant variations in operational performance standards will become an essential metric for COTS standards as suggested in this study. The result indicates that the application of FMECA theory or any of the time/cyclic relationship to reliability approach can provide useful theoretical bases for practical assessments of COTS products in the UAS industry.
Much effort was put in the design of the test-bed to minimize confounds due to uncontrolled operational mechanical degrees of freedom but because it was a typical laboratory setting, it may not replicate the real-world environment where air density, non-standard temperature and other maneuver irregularities can be captured and controlled for. It was assumed that any extraneous factors that could confound the encoder recordings leading to possible position error distribution were systematic across all spectrum of cycles. As stated earlier in the methodology, outliers in the data set that were not realistic were culled.
In follow up studies, where such UAS components will be tested under realistic field conditions, possible confounds due to the variables listed earlier will be considered and controlled using both experimental and statistical means to further improve the ecological validity.
7. Conclusions and Future Work
The researchers assessed the reliability of a laboratory designed UAS component test-bed operated using real-world data collected from a Boeing Scan Eagle® UAS aileron servo unit via a flight data recorder. The study hypothesized that a test-bed unit replicating a UAS aileron servo motor’s reliability in terms of a base-line measured encoder output of commanded servo position’s will not be significantly different after double and triple periods of cycle time. The aerodynamic forces acting on the test-bed servo were simulated using linearly-increasing-force extension mechanical springs. The hardware structures were CAD designed, taking into consideration the freedom of movement to align the servo shaft with the rotary encoder shaft, to alleviate any additional forces. Later, the code used to control the system and collect the data was developed, deployed, and tested. The discrepancy between commanded output position for a servo-commanded input position was recorded using an optical digital encoder.
The results showed interesting variability in the servo’s operational performance standards (reliability) through time periods/cycles. A repeated-methods ANOVA was used to determine if there existed statistical significance in the mean values of the commanded output positions in the three cyclic periods (operational performance standards). Results suggest a statistically significant difference in terms of the mean value for operational performance standards (reliability) over time period. Though the servo did not completely fail, significant variations in operational performance standards with time can be indicative of potential failures of such COTS components used in UAS which can have dire consequences from a safety risk perspective and affect operational capability.
For future work, some hardware would be enhanced. In the fabrication of the experimental set-up, copper wires were used to attach the servo to the springs, which is not ideal as copper might be more malleable than desired causing extensions in the attaching links and that can affect the designed acting force of the muscle springs. Therefore, a stiffer material like stainless steel wires or aluminum thin rods would be considered as a replacement. Also, the test-bed servo base fixation design can be further improved to enhance the accessibility and experimental setup. For instance, an additional mechanism can be added to the design to easily fix and unfix the servos on the Servo-base to facilitate the replacement of servos on the test-bed.
Subsequent studies will also focus on a collection of COTS aileron servos of the type used in this study. Reliability in terms of failure rates based on TTF and MTBF will be calculated and analyzed. Comparative analysis will be done to determine if there exist significant differences in the TTF and MTBF for the various servos tested. Such studies can fill an essential gap in extant literature on UAS components reliability and also provide data-driven benchmarks for aviation regulators during UAS components certification processes. It is also envisaged that future work will focus on a comprehensive predictive safety risk assessment of other vital system components apart from aileron servos. Data from such studies will help to understand failure modes and effects and determine criticality indices for COTS components as a function of operational cycles/time in small UAS operations. It will also provide further insight into the categorization of failures according to Moubray’s failure patterns such as the “bath tub” and others.
Ultimately the outcome of this future work could provide definitive safety assurance and reliability data required to trigger regulatory reforms by various national and multi-national regulators to allow BVLOS operations by small UAS fabricated with COTS components.
Author Contributions
All authors contributed meaningfully to this article but special mention to A.E. and D.A., who contributed significantly to the development of the empirical concept, research design, data analysis, draft preparations/editing/revisions.
Funding
This research received no external funding
Conflicts of Interest
The authors declare no conflict of interest.
References
- Rodriguez Salazar, L.; Cobano, J.; Ollero, A. Small uas-based wind feature identification system part 1: Integration and validation. Sensors 2017, 17, 8. [Google Scholar] [CrossRef]
- Jang, J.S.; Liccardo, D. Small UAV Automation Using MEMS. IEEE Aerosp. Electron. Syst. Mag. 2007, 22, 30–34. [Google Scholar] [CrossRef]
- Hague, D.; Kung, H.T.; Suter, B. Field experimentation of cots-based UAV networking. In Proceedings of the MILCOM 2006–2006 IEEE Military Communications Conference, Washington, DC, USA, 23–25 October 2006; pp. 1–7. [Google Scholar] [CrossRef]
- Murch, A.M.; Paw, Y.C.; Pandita, R.; Li, Z.; Balas, G.J. A Low Cost Small UAV Flight Research Facility. In Advances in Aerospace Guidance, Navigation and Control; Springer: Berlin, Germany, 2011; pp. 29–40. [Google Scholar]
- Bernard, E.; Friedt, J.M.; Tolle, F.; Marlin, C.; Griselin, M. Using a small COTS UAV to quantify moraine dynamics induced by climate shift in Arctic environments. Int. J. Remote Sens. 2017, 38, 2480–2494. [Google Scholar] [CrossRef]
- Logan, M.; Vranas, T.; Motter, M.; Shams, Q.; Pollock, D. Technology Challenges in Small UAV Development. In Proceedings of the Infotech@Aerospace, Arlington, VA, USA, 26–29 September 2005. [Google Scholar]
- Rangel, R.K.; Kienitz, K.H.; Brandao, M.P. Development of a complete UAV system using COTS equipment. In Proceedings of the 2009 IEEE Aerospace Conference, Big Sky, MT, USA, 7–14 March 2009; pp. 1–11. [Google Scholar] [CrossRef]
- Morris, S.; Jones, H. Examples of Commercial Applications Using Small UAVs. In Proceedings of the AIAA 3rd “Unmanned Unlimited” Technical Conference, Workshop and Exhibit, Chicago, IL, USA, 20–23 September 2004. [Google Scholar] [CrossRef]
- Wargo, C.A.; Church, G.C.; Glaneueski, J.; Strout, M. Unmanned Aircraft Systems (UAS) research and future analysis. In Proceedings of the 2014 IEEE Aerospace Conference, Big Sky, MT, USA, 1–8 March 2014; pp. 1–16. [Google Scholar] [CrossRef]
- Freeman, P.; Balas, G.J. Actuation failure modes and effects analysis for a small UAV. In Proceedings of the 2014 American Control Conference, Portland, OR, USA, 4–6 June 2014; pp. 1292–1297. [Google Scholar] [CrossRef]
- Rosa, F.D.; Cesoni, R.; Genta, S.; Maggiore, P. Failure rate evaluation method for HW architecture derived from functional safety standards (ISO 19014, ISO 25119, IEC 61508). Reliab. Eng. Syst. Saf. 2017, 165, 124–133. [Google Scholar] [CrossRef]
- Bonfante, F.; Dalla Vedova, M.D.L.; Maggiore, P. Evaluations on adequacy and utility of Failure Modes and Effects and Criticality Analysis and Fault Tree Analysis methodologies applied to civil RPAS systems. In Proceedings of the MATEC Web of Conferences, Glasgow, UK, 4–7 September 2018; Volume 233. [Google Scholar] [CrossRef]
- Grimaccia, F.; Bonfante, F.; Battipede, M.; Maggiore, P.; Filippone, E. Risk Analysis of the Future Implementation of a Safety Management System for Multiple RPAS Based on First Demonstration Flights. Electronics 2017, 6, 50. [Google Scholar] [CrossRef]
- UND Today (Official News of UND). 2019. Available online: http://blogs.und.edu/und-today/2019/05/command-and-control/ (accessed on 16 July 2019).
- Ohanian, O.; Hickling, C.; Stiltner, B.; Karni, E.; Kochersberger, K.; Probst, T.; Gelhausen, P.; Blain, A. Piezoelectric Morphing versus Servo-Actuated MAV Control Surfaces. In Proceedings of the 53rd AIAA/ASME/ASCE/AHS/ASC Structures, Structural Dynamics and Materials Conference, Honolulu, HI, USA, 23–26 April 2012. [Google Scholar] [CrossRef]
- Dodson, B.; Nolan, D. Reliability Engineering Handbook; Quality and Reliability; Taylor & Francis: New York, NY, USA, 1999. [Google Scholar]
- Dermentzoudis, M. Establishment of Models and Data Tracking for Small UAV Reliability; Technical Report; Naval Postgraduate School: Monterey, CA, USA, 2004. [Google Scholar]
- Neogi, N.; Bhamidipati, K.; Uhlig, D.; Ortiz, A.; Krauss, J. Engineering Safety and Reliability into UAV Systems: Mitigating the Ground Impact Hazard. In Proceedings of the AIAA Guidance, Navigation and Control Conference and Exhibit, Hilton Head, SC, USA, 15–18 October 2006. [Google Scholar] [CrossRef]
- Caswell, G.; Dodd, E. Improving UAV Reliability. DFR Solutions 2014, 301, 7. [Google Scholar]
- Uhlig, D.; Bhamidipati, K.; Neogi, N. Safety and Reliability Within UAV Construction. In Proceedings of the 2006 IEEE/AIAA 25th Digital Avionics Systems Conference, Portland, OR, USA, 15–18 October 2006; pp. 1–9. [Google Scholar] [CrossRef]
- Petritoli, E.; Leccese, F.; Ciani, L. Reliability and Maintenance Analysis of Unmanned Aerial Vehicles. Sensors 2018, 18, 3171. [Google Scholar] [CrossRef] [PubMed]
- Petritoli, E.; Leccese, F.; Ciani, L. Reliability Degradation, Preventive and Corrective Maintenance of UAV Systems. In Proceedings of the 2018 5th IEEE International Workshop on Metrology for AeroSpace (MetroAeroSpace), Rome, Italy, 20–22 June 2018; pp. 430–434. [Google Scholar] [CrossRef]
- Tan, Y.; Feng, D.; Shen, H. Research for Unmanned Aerial Vehicle components reliability evaluation model considering the influences of human factors. In Proceedings of the MATEC Web Conference, Chengdu, China, 16–17 December 2017; Volume 139. [Google Scholar] [CrossRef]
- Pan, D. Hybrid data-driven anomaly detection method to improve UAV operating reliability. In Proceedings of the 2017 Prognostics and System Health Management Conference (PHM-Harbin), Harbin, China, 9–12 July 2017; pp. 1–4. [Google Scholar] [CrossRef]
- FAA System Safety Handbook, Chapter 9: Analysis Techniques. 2000. Available online: https://www.faa.gov/regulations_policies/handbooks_manuals/aviation/risk_management/ss_handbook/media/Chap9_1200.pdf (accessed on 28 August 2019).
- Jun, L.; Huibin, X. Reliability Analysis of Aircraft Equipment Based on FMECA Method. Phys. Proc. 2012, 25, 1816–1822. [Google Scholar] [CrossRef] [Green Version]
- Moubray, J. Reliability-Centered Maintenance; Industrial Press Inc.: New York, NY, USA, 2001. [Google Scholar]
- Long, E.A.; Forbes, J.; Hees, J.; Stouffer, V. Empirical Relationships between Reliability Investments and Life-Cycle Support Costs; LMI Report SA701T1; LMI Government Consulting: Washington, DC, USA, 2007. [Google Scholar]
- Boggero, L.; Corpino, S.; De Martin, A.; Evangelista, G.; Fioriti, M.; Sorli, M. A Virtual Test Bench of a Parallel Hybrid Propulsion System for UAVs. Aerospace 2019, 6, 77. [Google Scholar] [CrossRef]
- Ali, Z.A.; Wang, D.; Aamir, M.; Masroor, S. Trajectory Tracking of a Tri-Rotor Aerial Vehicle Using an MRAC-Based Robust Hybrid Control Algorithm. Aerospace 2017, 4, 3. [Google Scholar] [CrossRef]
- Unmanned Aircraft Systems and on Third-Country Operators of Unmanned Aircraft. 12 March 2019. Available online: https://eur-lex.europa.eu/legal-content/EN/TXT/PDF/?uri=CELEX:32019R0945 (accessed on 28 August 2019).
- Standardization Roadmap For Unmanned Aircraft Systems, Version 1.0. December 2018. Available online: https://eur-lex.europa.eu/legal-content/EN/TXT/PDF/?uri=CELEX:32019R0945 (accessed on 28 August 2019).
- PART 107—SMALL UNMANNED AIRCRAFT SYSTEMS: Inspection, Testing, and Demonstration of Compliance. Available online: https://www.ecfr.gov/cgi-bin/text-idx?mc=true&node=pt14.2.107&rgn=div5#se14.2.107_17 (accessed on 28 August 2019).
- PART 25—AIRWORTHINESS STANDARDS: TRANSPORT CATEGORY AIRPLANES. Available online: https://www.ecfr.gov/cgi-bin/text-idx?mc=true&node=pt14.2.107&rgn=div5#se14.2.107_17 (accessed on 28 August 2019).
- ASTM F3003-14, Standard Specification for Quality Assurance of a Small Unmanned Aircraft System (sUAS). Available online: https://www.astm.org/Standards/F3003.htm (accessed on 28 August 2019).
- ASTM WK51467, New Specification for Quality Assurance for Manufacturers of Aircraft Systems. Available online: https://www.astm.org/DATABASE.CART/WORKITEMS/WK51467.htm (accessed on 28 August 2019).
- 3W Engine. Available online: http://3w-international.com (accessed on 28 August 2019).
- Scan Eagle. Available online: https://www.af.mil/About-Us/Fact-Sheets/Display/Article/104532/scan-eagle (accessed on 28 August 2019).
- MicroPilot. Available online: https://www.micropilot.com (accessed on 28 August 2019).
- Anderson, J. Fundamentals of Aerodynamics; McGraw-Hill Education: New York, NY, USA, 2016. [Google Scholar]
- Anderson, J. A History of Aerodynamics: And Its Impact on Flying Machines; Cambridge Aerospace Series; Cambridge University Press: Cambridge, UK, 1999. [Google Scholar]
- ElSaid, A. Test-bed Sample Video. 2019. Available online: https://www.youtube.com/watch?v=OtsnsTmVvNw (accessed on 28 August 2019).
- Deshmukh, A. Microcontrollers: Theory and Applications; Computer Engineering Series; Tata McGraw-Hill: New Delhi, India, 2005. [Google Scholar]
- Sclater, N.; Chironis, N. Mechanisms and Mechanical Devices Sourcebook, Fourth Edition; Mcgraw-Hill: New York, NY, USA, 2006. [Google Scholar]
- Considine, D.M. Process Instruments and Controls Handbook; McGraw-Hill: New York, NY, USA, 1957. [Google Scholar]
- Field, A. Discovering Statistics Using IBM SPSS Statistics: North American Edition; SAGE Publications: Thousand Oaks, CA, USA, 2017. [Google Scholar]
- Anderson, R. Reliability Design Handbook; IIT Research Institute: Chicago, IL, USA, 1979. [Google Scholar]
Figure 1.
Servo/Control-Surface System (self-designed).

Figure 2.
3-D Design (Design implemented as part of the study).

Figure 3.
3-D Printed Parts (Authors).

Figure 4.
Schematic of a typical optical encoder (Authors’ sketch).

Figure 5.
Histogram of commanded servo positions for entire dataset.

Figure 6.
Histogram of encoder recordings for entire dataset.

Figure 7.
Simple bar (mean) of encoder recordings at various period cycles.

Figure 8.
Clustered bar (mean) of encoder recordings with servo directions.

Figure 9.
Simple scatter with fit line of encoder recordings against commanded servo positions.


Table 1.
Aircraft Specifications.
| Operational Parameters | Operational Parameter Values |
|---|---|
| Aileron Width | 0.428 m |
| Aileron Height | 0.048 m |
| Aileron Surface Area | 0.021 m |
| Max. Cruise Speed | 50 m/h |
| Min. Cruise Speed | 40 m/h |
| Arg. Cruise Speed | 45 m/h |
| Max. Aileron Deployment Angle (cruise) | 40 |
Table 2.
Negative Positions.
| Descriptive Statistics | Sample Value | Descriptive Statistics Values |
|---|---|---|
| N | Valid | 1095 |
| Missing | 0 | |
| Mean | −11.6022 | |
| Std. Error of Mean | 0.28664 | |
| Median | −11.2503 | |
| Std. Deviation | 9.48505 | |
| Variance | 89.966 | |
| Skewness | −2.701 | |
| Std. Error of Skewness | 0.074 | |
| Kurtosis | 10.336 | |
| Std. Error of Kurtosis | 0.148 | |
| Range | 73.13 | |
| Minimum | −74.53 | |
| Maximum | −1.41 | |
| Percentiles | 25 | −11.2503 |
| 50 | −11.2503 | |
| 75 | −5.6252 |
Table 3.
Positive Positions.
| Descriptive Statistics | Sample Value | Descriptive Statistics Values |
|---|---|---|
| N | Valid | 6557 |
| Missing | 0 | |
| Mean | 16.2681 | |
| Std. Error of Mean | 0.13087 | |
| Median | 14.0629 | |
| Std. Deviation | 10.59699 | |
| Variance | 112.296 | |
| Skewness | 1.912 | |
| Std. Error of Skewness | 0.030 | |
| Kurtosis | 5.957 | |
| Std. Error of Kurtosis | 0.060 | |
| Range | 87.19 | |
| Minimum | 1.41 | |
| Maximum | 88.60 | |
| Percentiles | 25 | 9.8441 |
| 50 | 14.0629 | |
| 75 | 19.6881 |
Table 4.
Aileron Servo Commanded Positions.
| 4 | −11 | 13 | −11 | 32 | 15 | 7 | 17 | 23 | 14 |
| 3 | 11 | 11 | 11 | 10 | 17 | −1 | −11 | 18 | 6 |
| 25 | −10 | 25 | 20 | 11 | 10 | 7 | −24 | 7 | 37 |
| 8 | 14 | −18 | −14 | 10 | 11 | −4 | 17 | 35 | 6 |
| 3 | 14 | 28 | 17 | 34 | −6 | 11 | −30 | 4 | 13 |
| 17 | 21 | 11 | 15 | −20 | −1 | 24 | 20 | 6 | −11 |
| 14 | 13 | 24 | −25 | 21 | 8 | −13 | 23 | 14 | −15 |
| 3 | 14 | 17 | 30 | 31 | 15 | −28 | 14 | −11 | 15 |
| 1 | 27 | 13 | −8 | 8 | −3 | −7 | 10 | 8 | 10 |
| 7 | 18 | 27 | 14 | 20 | 8 | 4 | 13 | 15 | −17 |
| 23 | −11 | −3 | 18 | 8 | 20 | 13 | −21 | 6 | −27 |
| −23 | 21 | 15 | 13 | 10 | 13 | 28 | 15 | 7 |
Table 5.
Descriptive Statistics of Study Variables Dataset.
| N | Max | Min | Mean | Std. Dev. | |
|---|---|---|---|---|---|
| Statistic | Statistic | Statistic | Statistic | Statistic | |
| Encoder Recordings | 393,313 | 0.00 | 205.00 | 68.0345 | 44.08557 |
| Commanded Servo Positions | 393,313 | −30 | 37 | 8.22 | 14.601 |
Table 6.
Descriptive Statistics of Study Variables Dataset
| Mean | Std. Dev. | n | |
|---|---|---|---|
| 54.3347 | 44.81194 | 48 | |
| 59.9299 | 50.30706 | 48 | |
| 66.6863 | 55.13150 | 48 |
© 2019 by the authors. Licensee MDPI, Basel, Switzerland. This article is an open access article distributed under the terms and conditions of the Creative Commons Attribution (CC BY) license (http://creativecommons.org/licenses/by/4.0/).
Share and Cite
MDPI and ACS Style
ElSaid, A.; Adjekum, D.; Nordlie, J.; El Jamiy, F. A Test-Bed For Measuring UAS Servo Reliability. Aerospace 2019, 6, 96. https://doi.org/10.3390/aerospace6090096
AMA Style
ElSaid A, Adjekum D, Nordlie J, El Jamiy F. A Test-Bed For Measuring UAS Servo Reliability. Aerospace. 2019; 6(9):96. https://doi.org/10.3390/aerospace6090096
Chicago/Turabian StyleElSaid, AbdElRahman, Daniel Adjekum, John Nordlie, and Fatima El Jamiy. 2019. "A Test-Bed For Measuring UAS Servo Reliability" Aerospace 6, no. 9: 96. https://doi.org/10.3390/aerospace6090096
Note that from the first issue of 2016, this journal uses article numbers instead of page numbers. See further details here.