Hybrid System Combining Ice-Phobic Coating and Electrothermal Heating for Wing Ice Protection


1
Safety Technology Research Team, Next Generation Aeronautical Innovation Hub Center, Japan Aerospace Exploration Agency, Chofu, Tokyo 182-8522, Japan
2
Functional Chemicals Div., Nippon Paint Surf Chemicals Co., Ltd., Shinagawa, Tokyo 140-8675, Japan
3
Department of Mechanical Engineering, Kanagawa Institute of Technology, Atsugi, Kanagawa 243-0292, Japan
4
Department of Aerospace and Mechanical Engineering, University of Notre Dame, Notre Dame, IN 46556, USA
*
Author to whom correspondence should be addressed.
Aerospace 2020, 7(8), 102; https://doi.org/10.3390/aerospace7080102
Submission received: 28 June 2020
/
Revised: 15 July 2020
/
Accepted: 16 July 2020
/
Published: 22 July 2020
(This article belongs to the Special Issue Deicing and Anti-Icing of Aircraft)
Abstract
:In-flight icing for aircraft is a large concern for all those involved in aircraft operations. Generally, an electric heater has been used to prevent in-flight icing. A hybrid anti-icing system combining ice-phobic coating and electrothermal heating (ICE-WIPS) has been proposed by the Japan Aerospace Exploration Agency (JAXA) to reduce the power consumption in the heating unit. In order to validate the effectiveness of ICE-WIPS, validation and demonstration tests are conducted using icing wind tunnels at the Kanagawa Institute of Technology (KAIT) and at the Icing Research Tunnel in the NASA Glenn Research Center. Using a NACA0012 airfoil as a test model, ICE-WIPS demonstrates substantial reduction in power consumption as compared to the existing heating system. The reduction depends on the in-flight icing conditions; more than a 70% reduction is achieved at a liquid-water content (LWC) of 0.6 g/m3 and a median-volume diameter (MVD) of 15 μm at 75 m/s with zero angle of attack. In wet-icing conditions, more than a 30% reduction in power is achieved.
1. Introduction: Hybrid Ice-Phobic Coating and Electrothermal Heating Wing Ice Protection System (ICE-WIPS)
In-flight icing is of great concern as it causes icing on aircraft wings, which results in hazardous conditions due to lift degradation and increases in drag. Continuous efforts geared toward ice prevention led to the development of several kinds of Ice Protection Systems (IPS), which enable aircrafts to fly safely even in icing environments. Many of the current IPS, especially for large commercial aircraft, utilize a thermal method which provides heat to an aircraft surface so as to prevent icing. Hot-air anti-icing systems, often called bleed air systems, supply compressed, high temperature air from the engines to the leading edge of a wing through a tube distributed inside the wing [1,2,3]. With advances in technology, an electrical heater mat embedded underneath the leading edge of the wing was also adopted into aircrafts such as the Boeing787 [4,5]. Although the potential risk of in-flight icing is limited to take-off and landing, the huge energy consumption of thermal IPS is still a major challenge in the design of aircraft.
Recently, a physicochemical method has also been under consideration as a passive ice prevention method [6,7,8]. In this method, the properties of a surface are changed through surface processing or the application of an ice-phobic coating in order to reduce ice adhesion. Because it is generally easier to apply an ice-phobic coating to an aircraft, there is a greater focus on these coatings than on surface treatments [9,10,11]. Super hydrophobic coatings are often treated as representative of ice-phobic coatings. Many reports insist that ice adhesion is reduced on ice-phobic coatings, which means that accreted ice on the airfoil detaches in smaller pieces as opposed to forming large structures [12,13,14,15]. However, even a thin layer of ice can lead to large degradations in aerodynamic performance. Further improvement of ice-phobic coatings is still required.
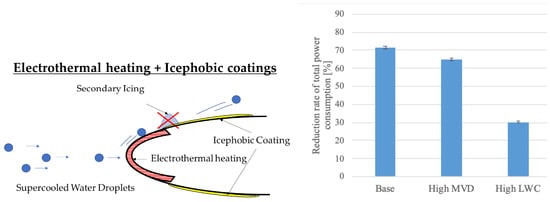
Taking those circumstances into account, a hybrid system of combining an anti-icing system and electro-thermal heating is proposed, named ICE-WIPS (Hybrid Ice-phobic Coating and Electrothermal Heating Wing Ice Protection System). Figure 1 schematically describes the system. Supercooled water droplets impact the leading-edge region which forms ice. An electrothermal heating unit at the leading-edge region melts accreted ice. Only the contact surface between the accreted ice and the wing is melted. This ice and/or water film moves downstream due to the local airflow around the wing. In combination with the local airflow, an ice-phobic coating supports the shedding of the ice and/or a water film from the surface. Because the main heated region is limited to the leading-edge, the energy consumption of the proposed system is reduced. Secondary icing such as runback ice occurs on the unheated surface following the heated area. However, an anti-icing coating based on a super hydrophobic surface would reduce secondary icing by detaching water films and droplets before they freeze. When it comes to the development of ice-phobic coatings, durability has always been problematic, especially in icing conditions. The impingement of water droplets causes serious erosion of ice-phobic coatings [16,17], which necessitates frequent coating repairs. The ICE-WIPS avoids an application of an ice-phobic coating on the leading-edge region to prevent such erosion. Instead, a polyurethane coating, which is commonly used as an aircraft paint, covers the leading-edge region.
Herein, a validation study of ICE-WIPS is given. The icing wind tunnel at the Kanagawa Institute of Technology (KAIT) was used for the validation study. ICE-WIPS was applied to a NACA0012 airfoil which was 500 mm in chord and 90 mm in span. ICE-WIPS was then applied to an airfoil in a large-scale icing wind tunnel at the NASA Glenn Research Center. The ICE-WIPS applied model was scaled up to 1200 mm in chord and 300 mm in span to demonstrate the use of ICE-WIPS under flight conditions.
2. Icing Wind Tunnel and Test Models
2.1. ICE-WIPS Validation at KAIT Icing Wind Tunnel
The KAIT Icing Wind Tunnel is an Eiffel type tunnel housed inside a temperature-controlled room (Figure 2a,b). The test section is 300 mm in height, 100 mm in width, and 1000 mm in length. It can achieve flow speeds of 90 m/s. The temperature inside the wind tunnel can be decreased down to −30 °C. Water droplets are injected using a spraying system installed upstream of the test section.
The validation model is a NACA0012 made of an aluminum alloy (Figure 3a). In total, 5 electrical heater mats (Minco Products Inc.) were embedded underneath the model surface as shown in Figure 3b. Three different heater sections were used and denoted as percentages of chord length. One heater section covered the leading-edge area, which ranged from 0 to 5% of the chord. It is denoted as HLE. Two heater mats were applied adjacent to HLE from 5 to 10% of the chord. This section is denoted as H0510. The location aft of H0510 is denoted as H1015, which covered 10 to 15% of the chord. The power density of the heaters was 12 W/cm2.
2.2. ICE-WIPS Demonstration at Icing Research Tunnel
The Icing Research Tunnel (IRT) at NASA Glenn Research Center [18] is a closed-loop wind tunnel. The test section is 1828 mm in height, 2743 mm in width, and 6096 mm in length. The speed in the tunnel ranges from approximately 26 to 174 m/s. The temperature in the test section can be controlled between −35 and +5 °C, and a variety of parameters such as LWC (liquid water content) and MVD (median volume diameter) can be controlled.
The demonstration model of the NACA0012 airfoil was 1200 mm in chord and 300 mm in span. Five heater mats (Watlow, Tokyo, Japan) were applied along the inner surface of the leading-edge region. These were installed from the leading edge to 15% of the chord length in the same manner as with the validation model (Figure 4). The heater mats are labeled in the same way as with the validation model. The power density was fixed as 12 W/cm2, which was also the same as in the validation test.
For the demonstration test, two NACA0012 models were tested simultaneously. All electric cables from the heaters were guided from inside the model strut to the outside of the test section. Due to the need for cable access in the test section, the models were mounted vertically in the test section. One model was a reference without ICE-WIPS and the other was the ICE-WIPS model. These models were mounted 370 mm from the test-section ceiling, and 350 mm from the test-section bottom to reduce 3-D effects (Figure 5). The sides of the models were covered by fairings, which were also equipped with heater mats in order to prevent ice from forming on them and growing toward the surface of the model.
2.3. ICE-WIPS Model
Ice-phobic coatings, as one component of the ICE-WIPS, require super hydrophobicity in order to minimize contact area between water droplets and the airfoil surface. An ice-phobic coating was developed by Morita et al. by using polytetrafluoroethylene (PTFE) particles in a sprayable coating (Figure 6) [19]. This ice-phobic coating, as demonstrated in previous studies, maintains super hydrophobicity due to its chemical properties and the microstructure created by the component particles. The contact and sliding angles of the ice-phobic coating were 150° and 8°, respectively. This coating was applied on the surface of the airfoil from 5% to 40% of the chord length. A polyurethane coating (SKY-HULLO, Nihon Tokushu Toryo Co., Ltd., Tokyo, Japan) was applied to the airfoil from the leading edge to 5% of the chord length to avoid erosion of the ice-phobic coating. Electrothermal heaters were mounted underneath the NACA0012 model surface. The specifications of the heaters are described in Section 2.1 and Section 2.2. As a comparison, a reference model was used. The reference model was also an NACA0012 model and had the same heater configuration but was not coated with the ice-phobic coating. The reference model surface was painted entirely with the polyurethane coating (SKY-HULLO, Nihon Tokushu Toryo Co., Ltd., Tokyo, Japan).
2.4. Power Consumption Estimation
The procedure of the icing tests is described in Figure 7. After setting parameters for the designated icing condition as well as the heater temperature, the wind-tunnel fan started the flow without supercooled water droplets. When the surface temperature of the airfoil was stabilized, the spraying system was activated. The heater temperature was then increased by 5 °C until no ice accreted on the heated area of the airfoil, from the leading edge to 15% of chord. If ice did not accrete at the initial temperature, the temperature of the heated area was decreased by 5 °C until ice began to emerge. The minimum required temperature for the anti-icing system was determined as the lowest heater temperature when ice did not accrete on the heated area. The power consumption of both the ICE-WIPS and the reference models at the determined heater temperature was measured for 10 min.
Once the power consumption per unit area at each heater mat was measured, the total power consumption per unit area of all heaters was calculated using the following equation:
where , , are the overall power consumption per unit area, the power consumption of each heater n, and the area of each heater, respectively. The reduction in the power consumption, R, was then calculated by the following equation:
where and refer the power consumption of the reference and ICE-WIPS models, respectively. The value R gives the reduction in power consumption by ICE-WIPS under the same icing flow conditions. This is a measure of the efficiency of ICE-WIPS.
3. Validation Test at KAIT Icing Wind Tunnel
3.1. Test Conditions
ICE-WIPS was validated at the KAIT Icing Wind Tunnel. For comparison, the reference model was tested separately. Due to limitations in the size of the test section, the ICE-WIPS and reference models could not be tested simultaneously, and so the icing flow conditions were held equivalent for both models. The test conditions are summarized in Table 1. The validation test consisted of two different cases: “Base” and “High MVD.” Both conditions appear in Code of Federal Regulation, Title 14 Appendix C, and are representative of icing conditions in stratiform and cumuliform clouds [20]. The first was the representative case where the liquid water content, LWC, was 0.6 g/m3 and the median volume diameter, MVD, was 16 μm. The freestream temperature was held between −10 and −8 °C. For the large-droplet case (High MVD), the MVD was increased by 30%. To achieve this MVD, the LWC needed to be set at 0.4 g/m3. The temperature range was set to be approximately that of the Base case. For both cases, the angle-of-attack, A.O.A., was zero. Both cases had a flow speed of 75 m/s.
3.2. Reduction in Power Consumption by ICE-WIPS
The minimum heater temperature for the reference model was 40 °C where the freestream temperature was −8.5 °C. Under the same flow conditions, the ICE-WIPS model succeeded in preventing ice accretion with a heater temperature of 5 °C. The power consumption per unit area of each heater was normalized by that of HLE for the reference model (Figure 8). Error bars were calculated based on the accuracy of the power meter (WT1800, Yokogawa Electric Corporation, Tokyo, Japan). According to the Ref [21], the accuracy of power measurement is defined as follows.
where , , and are the accuracy of the power meter, the measured power consumption, and the measurement range respectively. Here, (W) was used for the validation tests. Since the power consumption per unit area was normalized by that of HLE, the value for the error was obtained as follows:
where , , , and are the power consumption per unit area of the designated heater, the accuracy of the normalized power consumption per unit area of the designated heater, the power consumption per unit area at HLE, and the accuracy of , respectively. One can see that ICE-WIPS greatly reduced the power consumption per unit area compared to that of the reference model at all heating sections. At HLE, the model surface was exposed to the icing flow which required high power consumption. As the icing flow moved downstream to H0510, the melted ice was shed by the local flow around the reference model, which resulted in a decrease in the power consumption per unit area. For the ICE-WIPS model, the ice-phobic coating assisted in shedding the melted ice, which led to further reduction in the power consumption per unit area. The H1015 section is located next to a non-heated section. It is believed that the heat transfer from H1015 to the non-heated section occurred, which resulted in an increase in the power consumption per unit area for the reference model. Because the ice-phobic coating was applied up to 40% of the chord, the heat to melt accreted ice was reduced at H1015, which resulted in a decrease in the power consumption per unit area. It is also believed that the heat transfer to the non-heating section occurred at H1015 for the ICE-WIPS model as well.
For the “High MVD” case, the reference model required a heater temperature of 50 °C when the freestream temperature was −8.0 °C. Under the same flow conditions, the ICE-WIPS model required a heater temperature of 10 °C. Figure 9 shows the normalized power consumption per unit area at each heating section. The error bars were estimated based on Equation (4). Compared to the “Base” case, the trend in the distribution was the same but the relative values for the ICE-WIPS model were slightly higher. The number of the supercooled-water particles was one order of magnitude less in High MVD than in the Base case, which would reduce the amount of heat removed from the models. However, the 30% increase in the MVD meant that the volume of the supercooled-water droplets increased by a factor of 2.2 from the Base case. This would increase the amount of heat removed from the models. As a result of these competing effects, there is little change in the resultant power consumption per unit area from the Base case. Table 2 summarizes the normalized power consumption per unit area of each heating area for all validation-test cases.
Figure 10 shows the reduction in the power consumption, R, calculated by Equation (2). The rate shows how much power consumption was reduced for the ICE-WIPS models. Under the Base and High MVD cases, ICE-WIPS showed over a 70% reduction in power consumption compared to the reference model which only used an electrothermal system. As described in Section 2.4, the heater temperature was determined as the temperature at which there was no ice accretion on the heated area of the airfoil model. The heated area extended from the leading edge of the airfoil to 15% of the chord. If ice began to accrete, the heater temperature was increased. For the ICE-WIPS model, the ice-phobic coating allowed to heaters to run at lower temperatures with no ice accretion. This in turn reduced power consumption.
4. Demonstration Test at Large-Scale Icing Wing Tunnel
4.1. Test Condition
Based on the validation tests in the previous section, a large-scale icing wind tunnel test was performed at the Icing Research Tunnel (IRT), NASA Glenn Research Center. The aim of this test was to demonstrate the feasibility of the ICE-WIPS for in-flight icing conditions. Because the size of the droplets relative to aerodynamic geometry is a key factor in in-flight icing, a large-scale icing wind tunnel is needed to experimentally simulate in-flight icing conditions. Three test cases were performed in the large-scale icing wind tunnel (Table 3) to augment the data collected in the validation tests. The first two cases were set to match the Base and High MVD cases in the validation tests (Table 1). The High LWC case was based on the High MVD case but with more than twice the LWC. All cases were run with a wind speed of 75 m/s which was the same speed used in the validation test. The A.O.A. was set at zero which was also consistent with the validation tests. Using a chord length of 1200 mm, the Reynolds number was 7.0 × 10⁶.
4.2. Demonstration Results
Under the Base condition, the minimum heater temperature of the reference model was 40 °C and that of the ICE-WIPS model was 5 °C. Overall power consumption in each heating area was lower than in the validation test. While heater mats were implemented on the outer surface of the airfoil underneath the coating on the validation model, those in the demonstration model were installed inside the leading-edge plate. In addition, the side panels at the leading edge of the demonstration model were also equipped with heater mats to prevent ice from growing toward the front surface of the airfoil. A one-to-one comparison between the validation and the demonstration tests is not appropriate because the heater mat configurations were not identical; the additional heaters around the heater mats for which data were collected would have contributed to a lower power consumption. Just as in the validation test, the power consumption at HLE was higher than the power consumption at H0510 due to the frequent droplet impingement. The total power consumption per unit area was greatly reduced for the ICE-WIPS model (Figure 11). These results indicate that the ICE-WIPS scheme was effective for the larger scale model under the Base conditions.
For the High MVD case, the minimum heater temperature of the reference model was 50 °C while that of the ICE-WIPS model was 10 °C. Compared to the Base case, the power consumption at H1015 was increased, especially on the reference model (Figure 12). Relative to the reference model, the power consumption per unit area for the ICE-WIPS was increased as compared to the Base case.
In the demonstration test, the effectiveness of the ICE-WIPS model was also investigated against the high LWC, which simulated “wet” conditions. The heater temperature was increased for both models: at 60 °C on the refence model and at 30 °C on the ICE-WIPS model. Compared to previous cases, the LWC was more than doubled, and this led to an increase in the number of water droplets impinging on the airfoil. Those circumstances resulted in increased power consumption per unit area on both models (Figure 13). The trend in the power consumption per unit area at each heating section was the same: high at HLE and the lowest at H0510. The overall level of the power consumption for ICE-WIPS relative to the reference model at each section was higher than that in both the Base and High MVD cases. Table 4 summarizes the normalized power consumption per unit area of each heating area for all demonstration-test cases.
Figure 14 shows the reduction in the power consumption, R, calculated by Equation (2). The ICE-WIPS clearly exhibits a reduction in power consumption for ice prevention. Power consumption was reduced by more than 70% in the Base case and more than 60% in the High MVD case. Power reduction in the High LWC case was lower due to effects inherent to high LWC or “wet” conditions. This indicated that power reduction rate varies with flight conditions. In comparing Figure 10 and Figure 14, it can be seen that the reduction rates for the validation and demonstration tests were similar for the Base and High MVD cases. Because the heat produced by the electrothermal system was able to flow outside of the droplet impingement areas, additional heating factors such as a heat transfer to a non-heated section were included in the estimation of the power consumption. This led to a difference between the validation and demonstration tests in power consumption estimations. The difference in the power reduction would also be influenced by a potential degradation of the ice-phobic coating because the coating was not re-applied in every test. If such degradation existed, the power reduction would be lessened due to reduced effectiveness of the ice-phobic coating. Even if such coating degradation was present, the results from both figures show that the ICE-WIPS provides superior ice prevention compared to the electrothermal heating system.
5. Conclusions
A hybrid anti-icing system combining an ice-phobic coating and electrothermal heating (ICE-WIPS) has been developed to reduce the power consumption for wing ice protection. In order to validate its effectiveness, experiments were conducted first in a small scale icing wind tunnel at the Kanagawa Institute of Technology (KAIT) as a validation test, and then at the Icing Research Tunnel in NASA Glenn Research Center (GRC) as a demonstration test. NACA0012 airfoils with a chord of 500 mm for the KAIT model and 1200 mm for the GRC model were selected. Both the reference and ICE-WIPS models were equipped with internal electrical heaters from the leading edge up to 15% of chord length. While the reference model was entirely coated with polyurethane, the surface from 5 to 40% chord of the ICE-WIPS model was covered with an ice-phobic coating. It was shown that ICE-WIPS reduced power consumption by 30 to 70% as compared to the reference model depending on in-flight icing conditions. Based on the validation and demonstration tests, ICE-WIPS showed its capability of reducing the power consumption under icing conditions.
Author Contributions
Conceptualization, K.M. and H.S.; methodology, K.M., S.K., and H.S.; validation, K.M., S.K. and H.S.; formal analysis, H.S.; resources, K.M.; data curation, K.M.; writing—original draft preparation, K.M.; writing—review and editing, H.S.; project administration, K.M.; funding acquisition, K.M. All authors have read and agreed to the published version of the manuscript.
Funding
This research received no external funding.
Acknowledgments
Authors acknowledge Masafumi Yamazaki for helping us in technical discussions. Authors would also like to acknowledge those who provided technical support at KAIT, JAXA, the University of Notre Dame, and the NASA Glenn Research Center. They are Masafumi Yamazaki, Tetsuro Maeda, Takahito Saruhashi (KAIT), Hiroshi Isokawa, Ryuya Furusawa, Yoshimi Iijima (JAXA), Mitsugu Hasegawa, Daiki Kurihara, Wesley Patterson, Tatsunori Hayashi, Steven Claucherty, Joseph Gonzales (Notre Dame), and Jack Oldenburg and Seth Sederholm (NASA Glenn Research Center).
Conflicts of Interest
The authors declare no conflict of interest.
References
- Papadakis, M.; Wong, S.H.; Yeong, H.W.; Wong, S.C.; Vu, G. Icing Tests of a Wing Model with a Hot-Air Ice Protection System. In Proceedings of the AIAA Atmospheric and Space Environments Conference, Toronto, ON, Canada, 2−5 August 2010. [Google Scholar]
- Pellissier, M.P.C.; Habashi, W.G.; Pueyo, A. Optimization via FENSAP-ICE of Aircraft Hot-Air Anti-Icing Systems. J. Aircr. 2011, 48, 265–276. [Google Scholar] [CrossRef]
- Addy Jr, H.E.; Orchard, D.; Wright, W.B.; Oleskiw, M. Altitude Effects on Thermal Ice Protection System performance; A Study of an Alternative Approach; NASA/TM: Washington, DC, USA, 2016; p. 219081. [Google Scholar]
- Pourbagian, M.; Habashi, W.G. CFD-Based Optimization of Electro-Thermal Wing Ice Protection Systems in De-Icing Mode. In Proceedings of the 51st AIAA Aerospace Sciences Meeting Including the New Horizons Forum and Aerospace Exposition, Grapevine, TX, USA, 7−10 January 2013. [Google Scholar]
- Mohseni, M.; Amirfazli, A. A novel electro-thermal anti-icing system for fiber-reinforced polymer composite airfoils. Cold Reg. Sci. Technol. 2013, 87, 47–58. [Google Scholar] [CrossRef]
- Guo, P.; Zheng, Y.; Wen, M.; Song, C.; Lin, Y.; Jiang, L. Icephobic/Anti-Icing Properties of Micro/Nanostructured Surfaces. Adv. Mater. 2012, 24, 2642–2648. [Google Scholar] [CrossRef] [PubMed]
- Ruan, M.; Li, W.; Wang, B.; Deng, B.; Ma, F.; Yu, Z. Preparation and Anti-icing Behavior of Superhydrophobic Surfaces on Aluminum Alloy Substrates. Langmuir 2013, 29, 8482–8491. [Google Scholar] [CrossRef] [PubMed]
- Ganne, A.; Lebed, V.O.; Gavrilov, A.I. Combined wet chemical etching and anodic oxidation for obtaining the superhydrophobic meshes with anti-icing performance. Colloids Surf. A Physicochem. Eng. Asp. 2016, 499, 150–155. [Google Scholar] [CrossRef]
- Zhan, X.; Yan, T.; Zhang, Q.; Chen, F. A novel superhydrophobic hybrid nanocomposite material prepared by surface-initiated AGET ATRP and its anti-icing properties. J. Mater. Chem. A 2014, 2, 9390–9399. [Google Scholar] [CrossRef]
- Menini, R.; Farzaneh, M. Elaboration of Al2O3/PTFE icephobic coatings for protecting aluminum surfaces. Surf. Coat. Technol. 2009, 203, 1941–1946. [Google Scholar] [CrossRef]
- Boinovich, L.B.; Emelyanenko, A.M.; Ivanov, V.K.; Pashinin, A.S. Durable Icephobic Coating for Stainless Steel. ACS Appl. Mater. Interfaces 2013, 5, 2549–2554. [Google Scholar] [CrossRef] [PubMed]
- Menini, R.; Farzaneh, M. Advanced Icephobic Coatings. J. Adhes. Sci. Technol. 2011, 25, 971–992. [Google Scholar] [CrossRef]
- Laforte, C.; Beisswenger, A. Icephobic Material Centrifuge Adhesion Test. In Proceedings of the International Workshop on Atmospheric Icing of Structures (IWAIS), Montreal, Canada, 12−16 June 2005. [Google Scholar]
- Susoff, M.; Siegmann, K.; Pfaffenroth, C.; Hirayama, M. Evaluation of icephobic coatings—Screening of different coatings and influence of roughness. Cold Reg. Sci. Technol. 2013, 282, 870–879. [Google Scholar] [CrossRef] [Green Version]
- Dotan, A.; Dodiuk, H.; Laforte, C.; Kenig, S. The Relationship between Water Wetting and Ice Adhesion. J. Adhes. Sci. Technol. 2009, 23, 1907–1915. [Google Scholar]
- Minsk, L.D. How are Ice phobic coatings. In Proceedings of the First International Workshop, Atmospheric Icing of Structures, Cold Regions Research & Engineering Laboratory, Hanover, NH, USA, 1−3 June 1982; pp. 93–95. [Google Scholar]
- Fortin, G. Considerations on the Use of Hydrophobic, Superhydrophobic or Icephobic Coatings as a Part of the Aircraft Ice Protection System; SAE Technical Paper 2013-01-2018: Warrendale, PA, USA, 2013. [Google Scholar]
- Papadakis, M.; Hung, K.E.; Vu, G.T.; Yeong, H.W.; Bidwell, C.S.; Breer, M.D.; Bencic, T.J. Experimental Investigation of Water Droplet Impingement on Airfoils, Finite Wings, and an S-Duct Engine Inlet; NASA/TM: Washington, DC, USA, 2002, 211700. [Google Scholar]
- Morita, K.; Gonzales, J.; Sakaue, H. Effect of PTFE Particle Size on Superhydrophobic Coating for Supercooled Water Prevention. Coatings 2018, 8, 426. [Google Scholar] [CrossRef] [Green Version]
- Federal Aviation Administration. Code of Federal Regulations; Federal Aviation Administration: Washington, DC, USA, 2014. [Google Scholar]
- Yokogawa Test & Measurement Corporation. WT1800 Precision Power Analyzer Getting Started Guide; Yokogawa Test & Measurement Corporation: Tokyo, Japan, 2011. [Google Scholar]
Figure 1.
Scheme of the ICE-WIPS (Hybrid Ice-phobic Coating and Electrothermal Heating Wing Ice Protection System).
Figure 1.
Scheme of the ICE-WIPS (Hybrid Ice-phobic Coating and Electrothermal Heating Wing Ice Protection System).

Figure 2.
KAIT Icing Wind Tunnel: (a) overview from downstream and (b) test section.

Figure 3.
(a) Validation model and (b) heating areas at leading edge region of the NACA0012 model for the validation test.
Figure 3.
(a) Validation model and (b) heating areas at leading edge region of the NACA0012 model for the validation test.

Figure 4.
Schematic of NACA0012 model for the demonstration test.

Figure 5.
Schematic of the demonstration models in the test section.

Figure 6.
A photograph of an interface between the ice-phobic coating and a water droplet.

Figure 7.
Validation test procedure.

Figure 8.
Normalized power consumption per unit area of each heating area for Base case.

Figure 9.
Normalized power consumption per unit area of each heating area for High MVD case.

Figure 10.
The reduction in the power consumption calculated by Equation (2) by the ICE-WIPS for the validation tests.
Figure 10.
The reduction in the power consumption calculated by Equation (2) by the ICE-WIPS for the validation tests.

Figure 11.
Normalized power consumption per unit area of each heating area for Base case.

Figure 12.
Normalized power consumption per unit area of each heating area for High MVD case.

Figure 13.
Normalized power consumption per unit area of each heating area for High LWC case.

Figure 14.
The reduction in the power consumption calculated by Equation (2) by the ICE-WIPS for the demonstration tests.
Figure 14.
The reduction in the power consumption calculated by Equation (2) by the ICE-WIPS for the demonstration tests.


Table 1.
Validation Test Condition.
| Case | Base | High LWC |
|---|---|---|
| LWC [g/m3] | 0.6 | 0.4 |
| MVD [µm] | 16.0 | 21.4 |
| Temperature [°C] | −8.5~−8.0 | −10.0~−8.0 |
| A.O.A. [deg.] | 0 | 0 |
| Wind Speed [m/s] | 75 | 75 |
Table 2.
Summary of normalized power consumption per unit area in validation test.
| Case | Base | High MVD | ||||
|---|---|---|---|---|---|---|
| Heating Area | HLE | H0510 | H1015 | HLE | H0510 | H1015 |
| Reference | 1.000 ± 0.007 | 0.551 ± 0.006 | 1.146 ± 0.009 | 1.000 ± 0.005 | 0.427 ± 0.005 | 1.006 ± 0.007 |
| ICE-WIPS | 0.180 ± 0.002 | 0.126 ± 0.005 | 0.232 ± 0.005 | 0.239 ± 0.002 | 0.168 ± 0.004 | 0.255 ± 0.005 |
Table 3.
Demonstration Test Conditions.
| Case | Base | High MVD | High LWC |
|---|---|---|---|
| LWC [g/m3] | 0.6 | 0.5 | 1.3 |
| MVD [µm] | 15.0 | 21.3 | 21.0 |
| Temperature [°C] | −5.0 | −5.0 | −5.0 |
| A.O.A. [deg.] | 0 | 0 | 0 |
| Wind Speed [m/s] | 75 | 75 | 75 |
Table 4.
Summary of normalized power consumption per unit area in demonstration test.
| Heating Area | HLE | H0510 | H1015 | |||
|---|---|---|---|---|---|---|
| Model | Reference | ICE-WIPS | Reference | ICE-WIPS | Reference | ICE-WIPS |
| Base | 1.000 ± 0.007 | 0.180 ± 0.002 | 0.551 ± 0.006 | 0.126 ± 0.005 | 1.146 ± 0.009 | 0.232 ± 0.005 |
| High MVD | 1.000 ± 0.005 | 0.239 ± 0.002 | 0.427 ± 0.005 | 0.168 ± 0.006 | 1.006 ± 0.007 | 0.255 ± 0.005 |
| High LWC | 1.000 ± 0.005 | 0.880 ± 0.004 | 0.912 ± 0.005 | 0.583 ± 0.004 | 1.148 ± 0.006 | 0.653 ± 0.004 |
© 2020 by the authors. Licensee MDPI, Basel, Switzerland. This article is an open access article distributed under the terms and conditions of the Creative Commons Attribution (CC BY) license (http://creativecommons.org/licenses/by/4.0/).
Share and Cite
MDPI and ACS Style
Morita, K.; Kimura, S.; Sakaue, H. Hybrid System Combining Ice-Phobic Coating and Electrothermal Heating for Wing Ice Protection. Aerospace 2020, 7, 102. https://doi.org/10.3390/aerospace7080102
AMA Style
Morita K, Kimura S, Sakaue H. Hybrid System Combining Ice-Phobic Coating and Electrothermal Heating for Wing Ice Protection. Aerospace. 2020; 7(8):102. https://doi.org/10.3390/aerospace7080102
Chicago/Turabian StyleMorita, Katsuaki, Shigeo Kimura, and Hirotaka Sakaue. 2020. "Hybrid System Combining Ice-Phobic Coating and Electrothermal Heating for Wing Ice Protection" Aerospace 7, no. 8: 102. https://doi.org/10.3390/aerospace7080102
Note that from the first issue of 2016, this journal uses article numbers instead of page numbers. See further details here.