Article

Comparative Analysis and Optimization of Technical and Weight Parameters of Turbo-Electric Propulsion Systems

1
Rolls Royce Ltd. GmbH & Co. KG, 81739 München, Germany
2
Siemens Mobility GmbH, 90441 Nürnberg, Germany
3
Karlsruhe Institute of Technology, Institute of Technical Physics, 76432 Karlsruhe, Germany
4
Airbus Electric Aircraft Systems, 82024 Taufkirchen, Germany
*
Author to whom correspondence should be addressed.
Aerospace 2020, 7(8), 107; https://doi.org/10.3390/aerospace7080107
Submission received: 10 June 2020 / Revised: 22 July 2020 / Accepted: 23 July 2020 / Published: 27 July 2020
(This article belongs to the Special Issue Hybrid-Electric Distributed-Propulsion Aircraft)

Abstract

:
According to Flightpath 2050, the aviation industry is aiming to substantially reduce emissions over the coming decades. One possible solution to meet these ambitious goals is by moving to hybrid-electric drivetrain architectures which require the electric components to be extremely lightweight and efficient at the same time. It has been claimed in several publications that cryogenic and in particular superconducting components can help to fulfill such requirements that potentially cannot be achieved with non-cryogenic components. The purpose of this work was to make a fair comparison between a cryogenic turbo-electric propulsion system (CEPS) and a non-cryogenic turbo-electric propulsion system (TEPS) on a quantitative level. The results on the CEPS were presented in detail in a previous publication. The focus of this publication is to present the study on the TEPS, which in conclusion allows a direct comparison. For both systems the same top-level aircraft requirements were used that were derived within the project TELOS based on an exemplary mission profile and the physical measures of a 220-passenger aircraft. Our study concludes that a CEPS could be 10% to 40% lighter than a TEPS. Furthermore, a CEPS could have a total efficiency gain of up to 18% compared to a similar TEPS.

1. Introduction

Until March 2020, the number of passengers traveling by aircraft was constantly rising with an annual rate of roughly four percent. The Corona epidemic has led to a sharp decline in flight numbers and therefore associated emissions. Although the long-term effects are not clear yet, one can reasonably assume that on the time scale of Flightpath 2050 international flight travel will be back to pre-corona levels. Therefore, this short-term emission reduction may not be sufficient on the long-term to achieve the goal of reducing the absolute CO 2 emissions of the aviation sector by 50% until 2050 [1]. Consequently, increasing fuel efficiency of aircraft and its drivetrain is a central goal for aircraft and turbine manufacturers. One disruptive technological approach that could help to achieve this ambitious goal is to substitute gas turbines by hybrid-electric drive trains [2,3,4].
The largest share of aircraft is operating within the short and mid-range distance, covering distances about 1000 to 3000 nautical miles ( nm ) and up to 240 passengers (PAX) [5]. A fuel-burn advantage by applying hybrid-electric propulsion systems for such aircraft can be gained only if the masses of the electric propulsion components are very low but efficiencies are very high at the same time [6]. These mass and efficiency requirements appear to be very challenging compared to the state-of-the-art [7] of electric drivetrain technology. Potentially, superconducting and cryogenic-cooled components could overcome these limitations. Thus, it was investigated in detail what masses and efficiencies are achievable with fully cryogenic turbo-electric drivetrain architecture [8]. In [8] and consequently in this publication, a turbo-electric propulsion system instead of a hybrid-electric configuration (i.e., a turbo-electric configuration including batteries) was chosen, in order to focus on the electric components whose design is mainly affected by the cryogenic temperature, i.e., electric machines, inverters and cables. The study was based on a hypothetically hybridized 220 PAX aircraft with a mission range of 2500 nm .
However, also non-cryogenic TEPS configurations could allow for better masses and efficiencies than today if designed specifically for that purpose. The particular aim of this work is two-fold: First, it should demonstrate a methodology for the sizing of turbo-electric drive trains regarding mass, efficiency and dimensions on a system level. The presented approach could be part of a full hybrid-electric aircraft sizing procedure in the future. Secondly, we use this methodology to make a fair, quantitative comparison between CEPS and TEPS regarding mass and efficiency on a system level. Similarly, to the previous study on CEPS, also this study does not aim at finding a better propulsion system architecture or aircraft architecture that would allow the achievement of a lower specific fuel consumption. Rather, it is the goal of the study to find out which are the lowest masses and highest efficiencies that can be achieved for the electric propulsion components on a multi-MW power level by optimizing them together as system to their physical limits. To come to meaningful requirements, the approach was taken to derive them from an existing short-range aircraft, namely the A321XLR. The system architecture presented below, i.e., a hypothetical replacement of the state-of-the-art turbofan by a turbo-electric drive train, is to be understood as a thought experiment. It allows derivation of power levels, rotation speeds etc. for the electric propulsion components. The idea behind it is not to propose a 1-to-1 replacement of the existing propulsion solution by a TEPS for an existing A321XLR but demonstrating the methodology based on an existing aircraft. As pointed out in the conclusions, without modifying the aircraft architecture, a turbo-electric drive train will be heavier than the state-of-the-art turbofan; hence strongly reducing the allowable payload.
As the details for the CEPS study were already published previously [8], this paper focuses on a system design study for a TEPS with identical top-level requirements. The paper follows a similar methodological approach as [8], i.e., physics-driven analytical models are used to describe each component precisely, so that many parameter combinations can be studied to find the best system configuration for the given requirements. Also, the paper’s structure is similar, where first the requirements and methodological approach are presented. Then, the results for single components and the TEPS are discussed. In the end, the CEPS/TEPS systems are compared in the discussion and next steps are proposed in the conclusions.

2. System Architecture

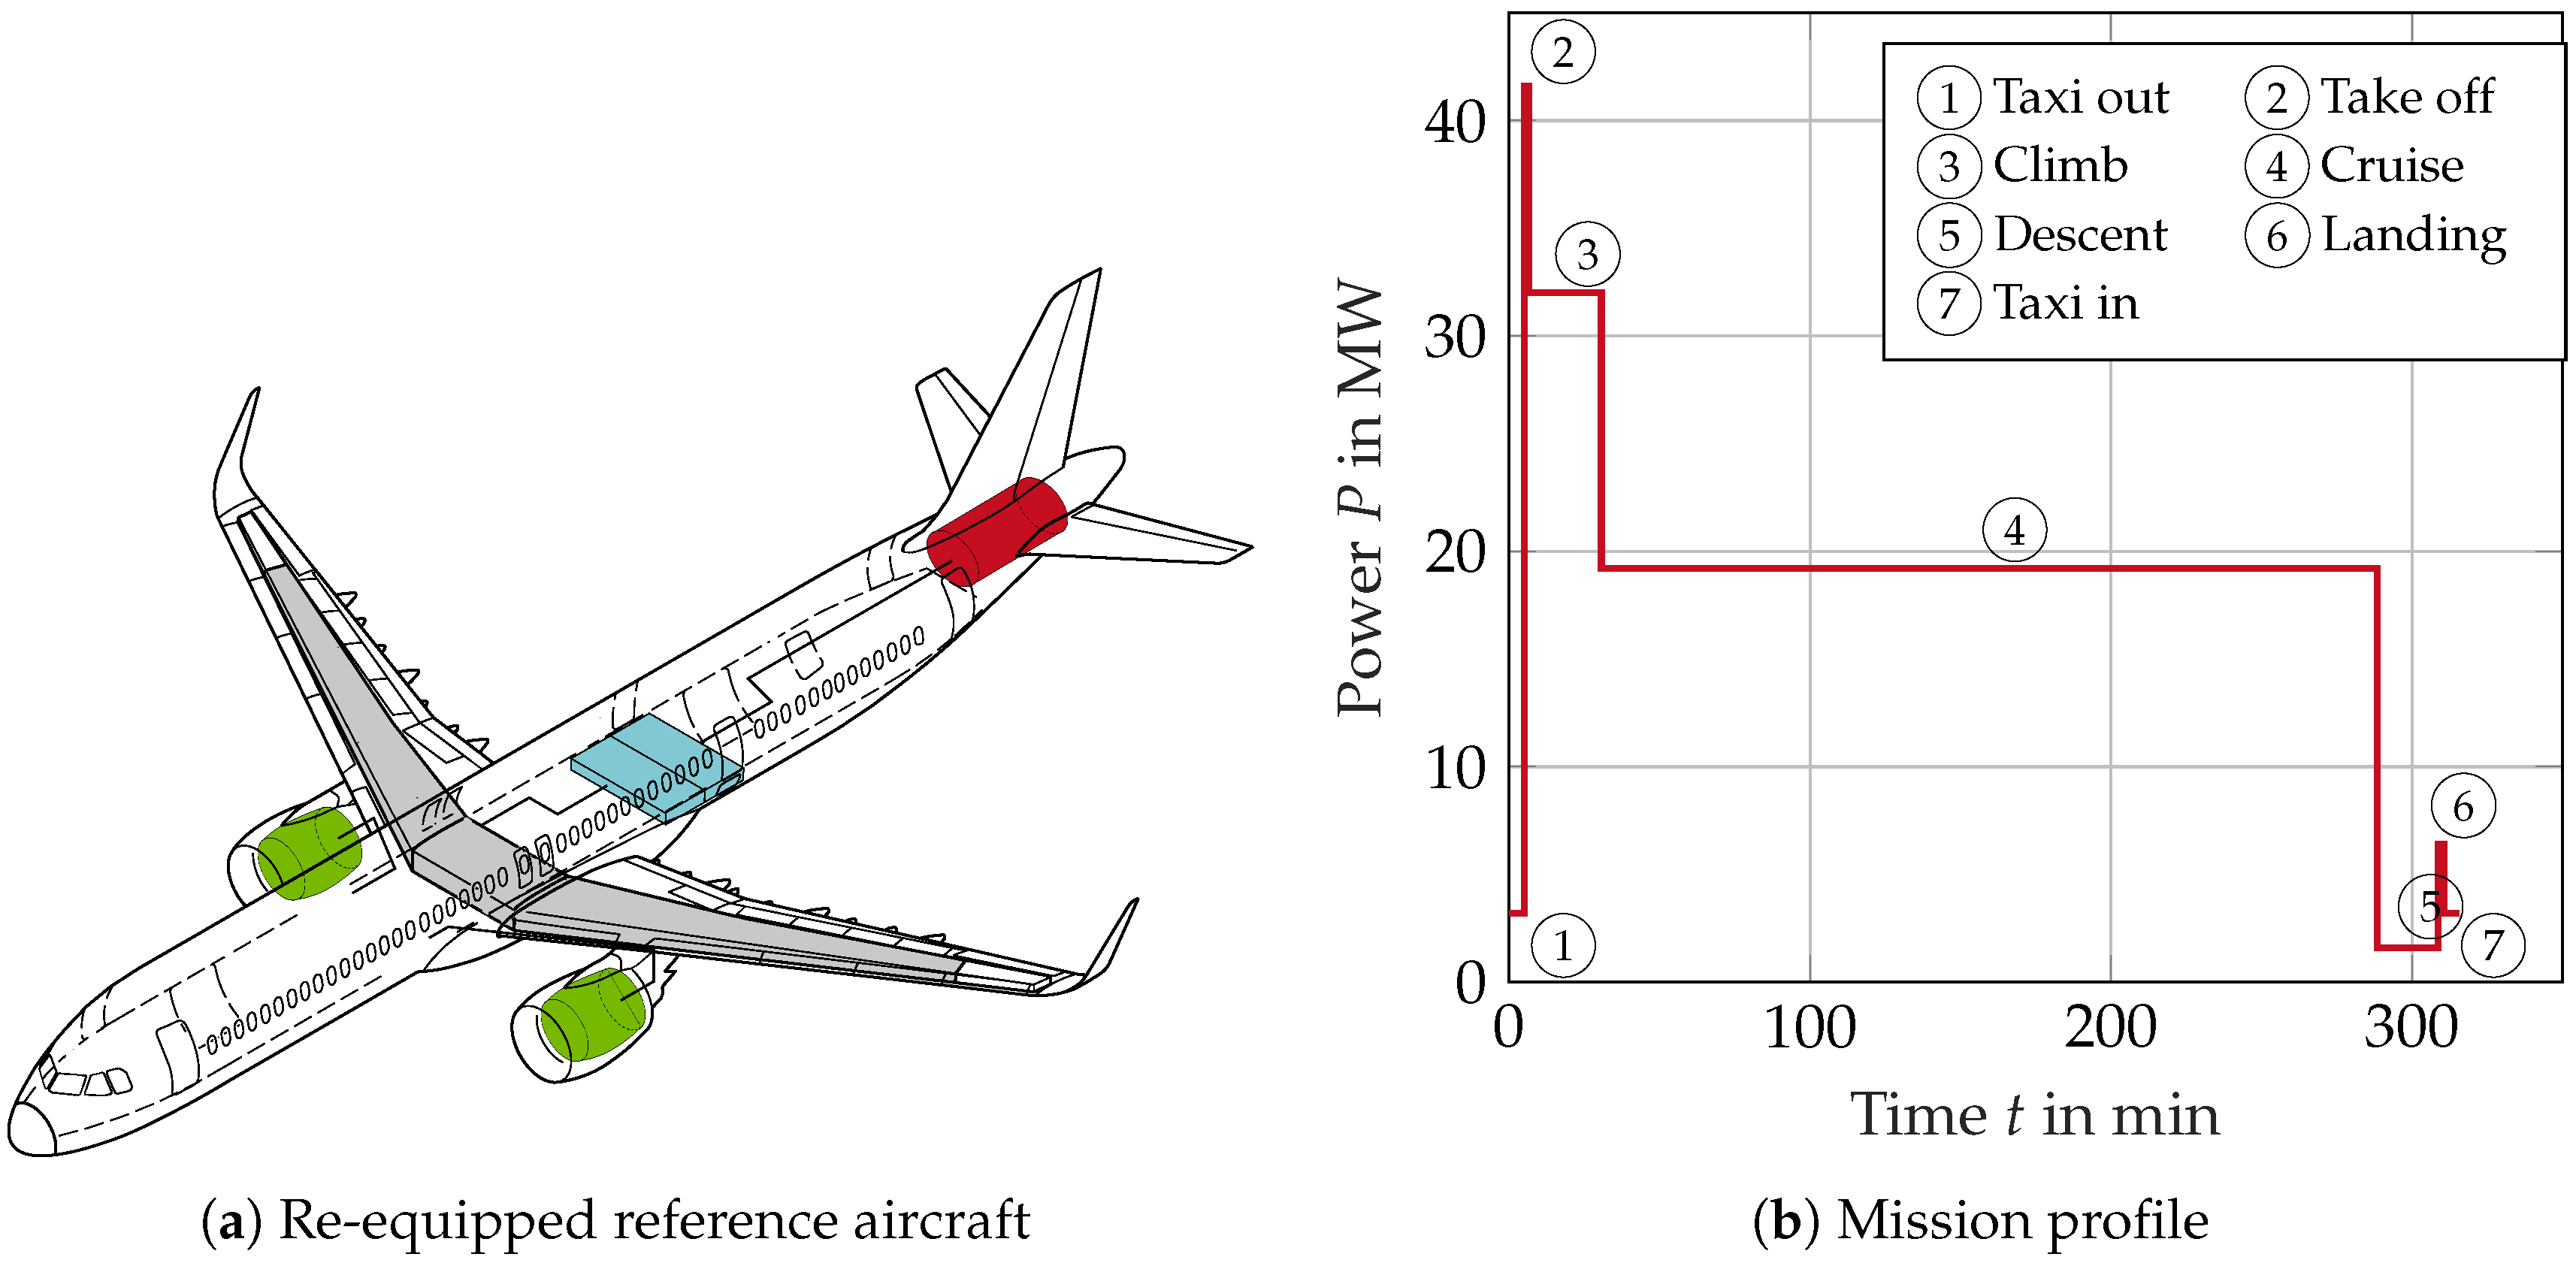
2.1. Re-Equipped Reference Aircraft
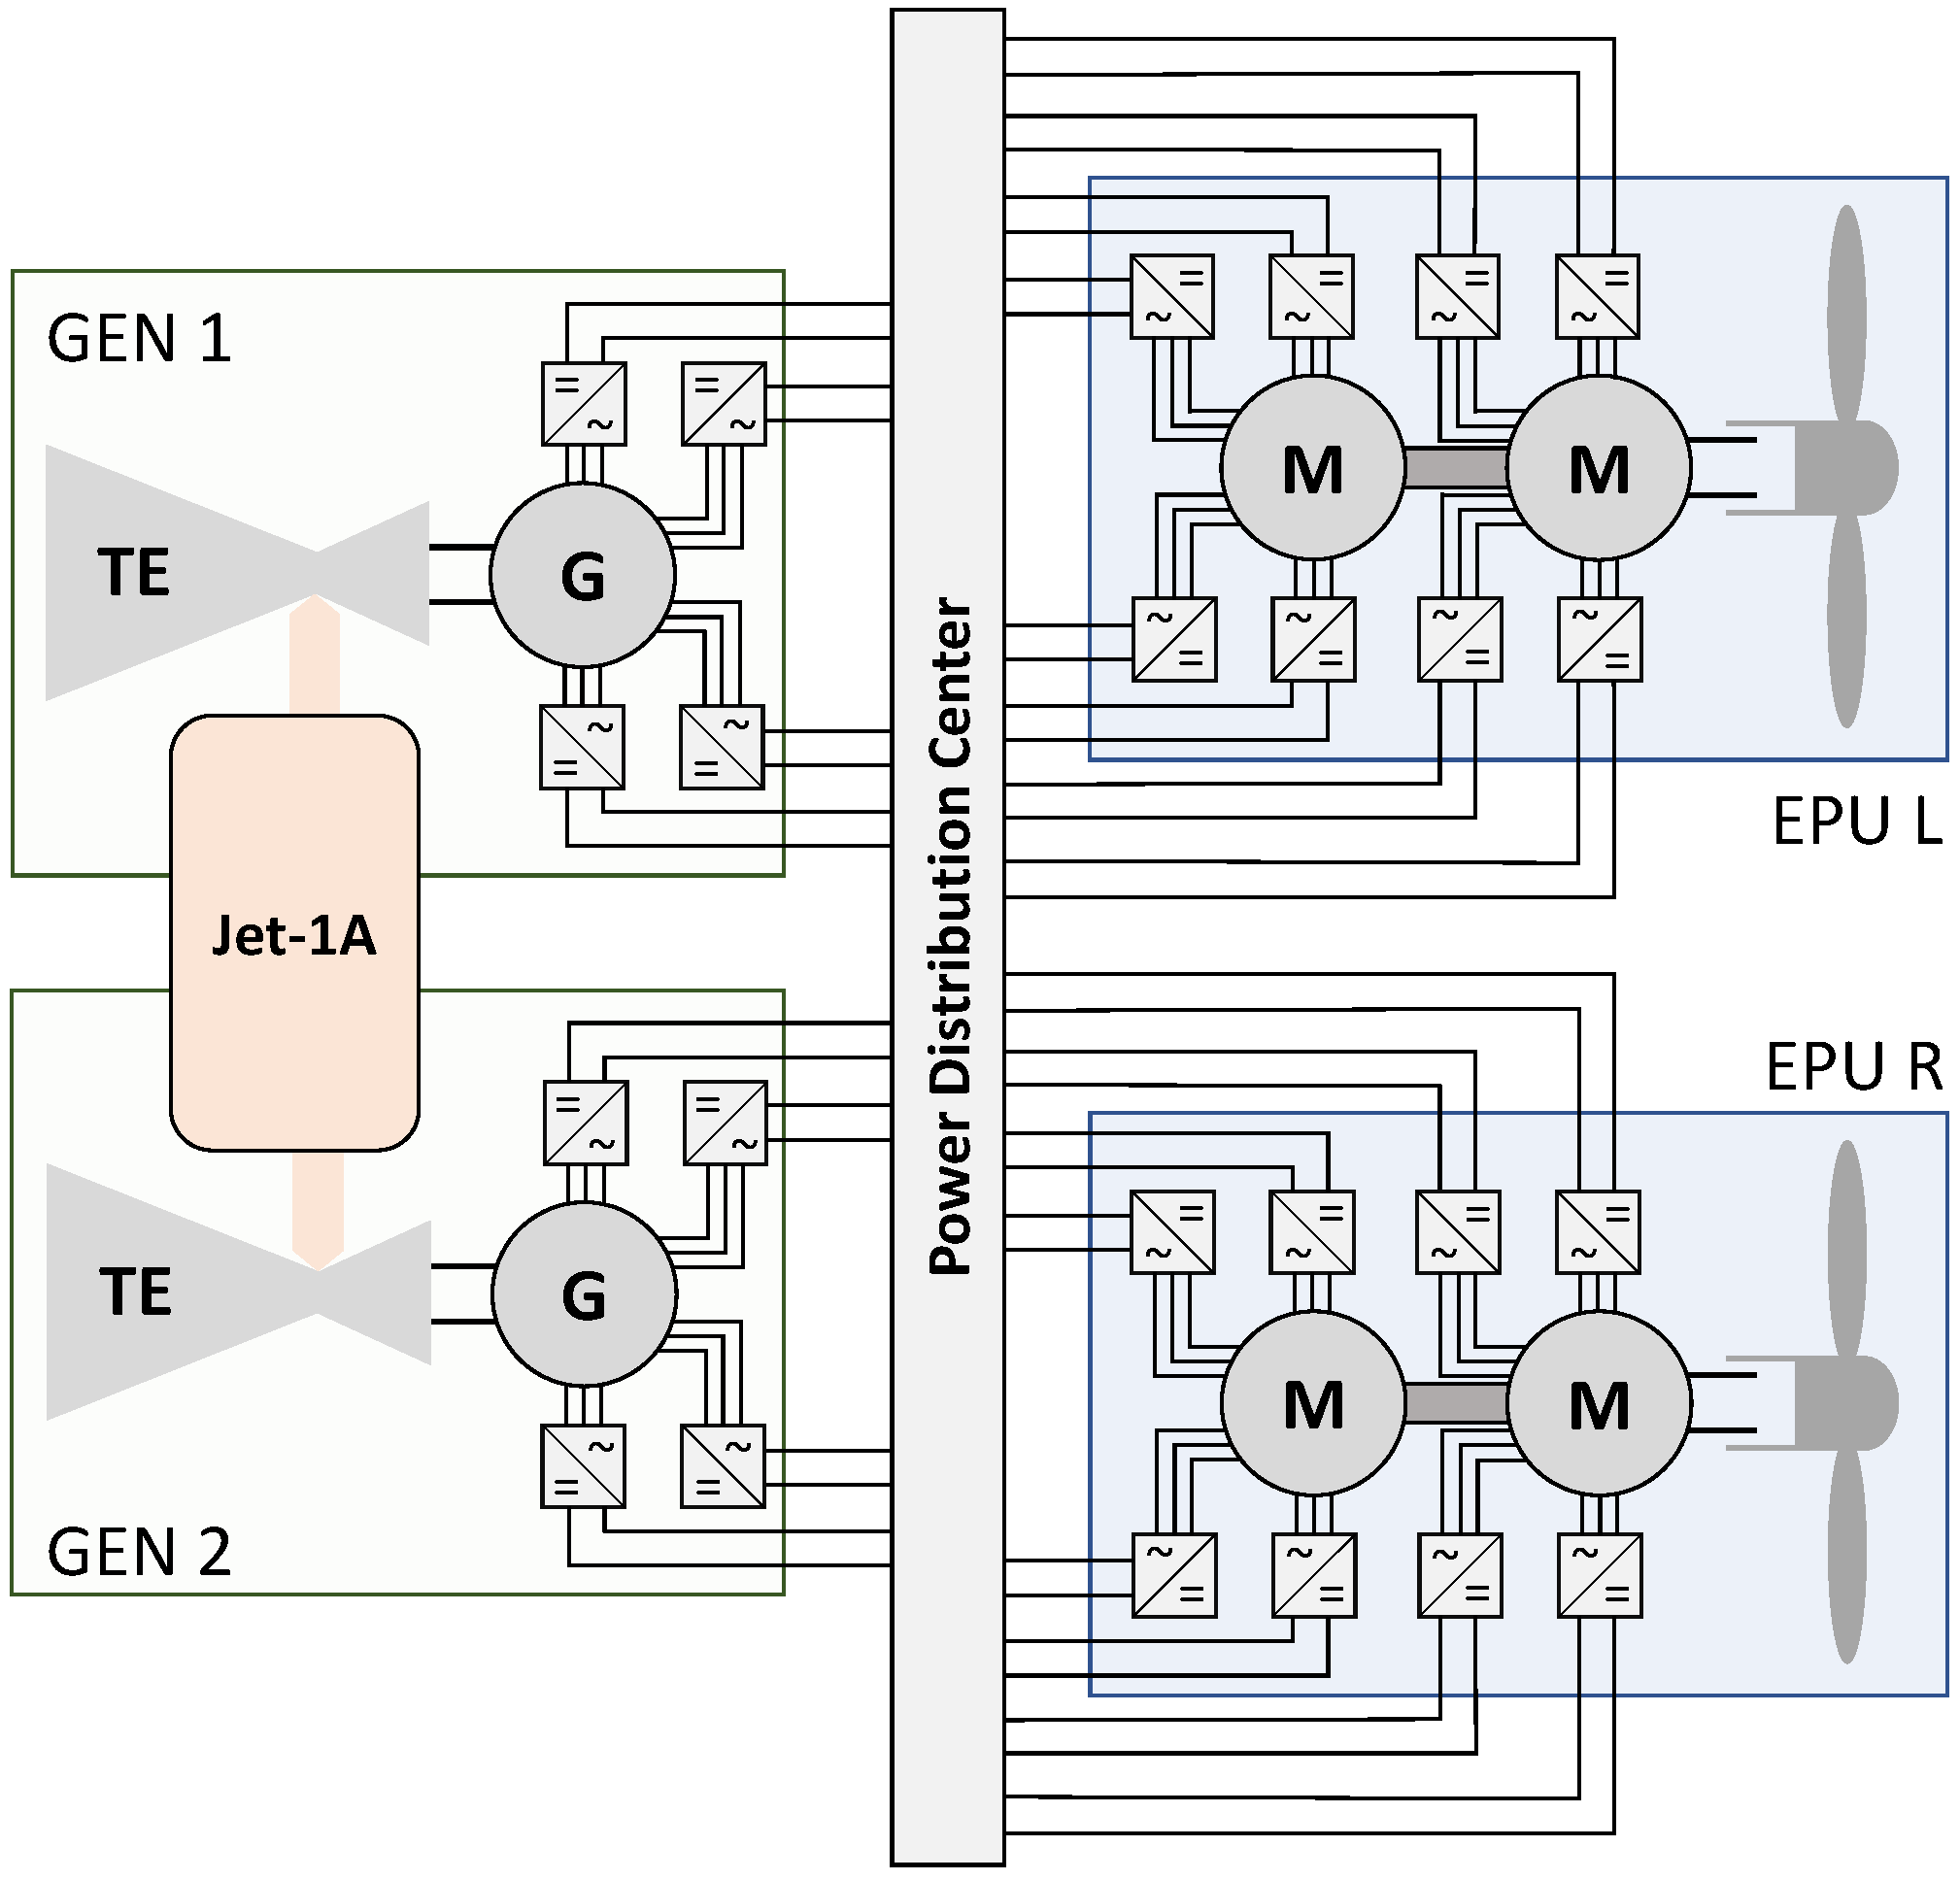
The analyzed propulsion system of the aircraft is considered to be fully turbo-electric. A general scheme that illustrates the relative dimensions of the reference aircraft and the positioning of the electric propulsion components is shown in Figure 1a. The original aircraft has an overall length of roughly 44.5 m and a maximum take-off weight of 101 tons . The two electric propulsion units that drive the fans which provide thrust to the aircraft remain at the same position as the propulsion units in the original aircraft. They are connected with two DC power lines to the power distribution center. The generation units that are placed at the back end of the aircraft fuselage provide the electric power for the aircraft propulsion. The generation units are also connected with DC power lines to the power distribution center. The TEPS can be modified to a hybrid-electric system, by a battery unit that could be added to the system and placed in the front of the aircraft fuselage. The battery is not considered in this study as the focus of the study lies on the sizing of the electric propulsion components. The fuel tanks in the wings of the original aircraft remain as they are. All positions, distances, and measures are referenced to the operation manual of the commercially operated A321XLR [9].

2.2. Architecture

The basic architecture of the hybrid-electric drive train is shown in Figure 2. The required thrust is delivered by two electric propulsion units (EPU L and EPU R). Each EPU contains a fan driven by two stacked electric machines mounted on a single shaft. The machines are driven by individual inverter units. For redundancy, each machine has four individual winding systems each fed by an individual inverter of 2.5 MW. The inverters are voltage-fed including a DC-capacitor. These units convert the DC power that is provided by DC transmission lines into AC current feeding the machines. Optionally, gearboxes that transmit the mechanical rotation speed of the machines to the fans can be included. The use of a gearbox allows optimizing the fan and the electric machine independently, i.e., reaching high circumferential speeds by increasing the mechanical rotation speed of the machine while keeping machine size within installation space limitations. Only the characteristics of the machines are varied whereas the fan remains untouched. The machine is designed so that it can drive the fan with the specifications of the reference aircraft. The fan has a diameter of d f a n = 2.06 m and a maximal rotation speed of n f a n = 3500 min 1 , producing a thrust of roughly 140 kN during take-off [10].
Both EPUs are connected to the electric power distribution center that is placed at the position where the wings are connected to the fuselage. Here, the four power transmission lines of the EPUs are fed with the electric power of the two power generation units GEN 1 and GEN 2. Each inverter of the electric machines in the EPU is connected to a separate 2.5 MW power line. To facilitate balancing of the thrust in case of a power generation unit failure, one generation unit powers one machine of the EPU R and another of the EPU L, respectively. Both power generation units are placed at the back of the fuselage containing two high-speed generators that are driven by turboshaft engines. These engines are assumed to be similar to the ones that are currently installed in the reference aircraft, thus with a shaft rotation speed of n T E = 10,000 min 1 [10]. This represents a simplification that is acceptable within the scope of the study. In fact, the fan only produces only about 80% to 90% of the thrust, wherefore slightly more powerful fans, motors and therefore turboshaft engines would be required for a TEPS configuration. In consequence, this would require slightly higher power levels of about 22 MW at the generator instead of 20 MW, (s. Figure 1b) thus not strongly affecting the power density and efficiency and therefore an acceptable simplification for this study. The generators are considered to have four separate winding systems each connected to an individual inverter. All electric machines and inverters are connected to corresponding heat exchangers for cooling.
For comparison: The cryogenic drivetrain system architecture that was analyzed in [8] consisted of similar electric components (and a gearbox); however instead of heat exchangers liquid hydrogen (and the corresponding tanks) were considered for cryogenic cooling.

2.3. Requirements

The power requirements of the electric propulsion and the generation units are deduced from the power requirements during take-off (Figure 1b) and the architecture of the propulsion chain 2. Using the latter and the size of aircraft fuselage [9], the lengths of the power distribution cables l c a b l e are derived. The maximum accessible diameter d m a x , E M and the maximum length l m a x , E M of the electric machines behind the fan were constraint assuming that they have to stay within the measures of the core engine in the turbofan [10] that powers the reference aircraft [9] in order to maintain the propulsor efficiency. All measures of the generation unit are deduced from the size of the aircraft fuselage [9] and the characteristics of state-of-the-art turboshaft engines [11]. The maximum flight level (FL), the operational ambient temperature range T a and the maximum ambient pressure p a , m a x are acquired from the European certification specifications document for large aircraft (CS 25) [12].
The electric frequencies were limited to 4 kHz as AC losses (in the electric machines) and switching losses (in the power electronics) become very dominant with higher frequencies. Although these frequencies are about two times higher than the current state-of-the-art, we wanted to let it open in the study if it makes sense to push this boundary further or not. The DC-link voltage, which is usually considered to be a requirement, is considered to be an optimization parameter that affects all components. It is chosen between 1 kV and 4 kV to have comparability with the CEPS study. The fixed system requirements, the derived component constraints and the variation parameters on system level are shown in Table 1.

3. Modeling

In this section, the modeling approach for every component and the overall system optimization are described. In general, terms, the modeling follows a quantitative model-based systems engineering approach: Every component is represented by an analytical performance model. This model calculates for a given set of requirements, e.g., shaft power and rotation speed, the relevant KPIs such as mass, losses, efficiency etc. Furthermore, outputs that serve as input to another component are calculated: For example, the electric frequency is an output of the electric machine and an input to the inverter. Furthermore, each component has its “inner degrees of freedom” (iDoF) that also must be specified as inputs for the performance model. Inner degrees of freedom can be the stator or rotor geometry in the case of an electric machine, or the inverter topology. Such inner degrees are regarded as optimization variables later. The input- and outputs which are propagated between the component models to compose and calculate the TEPS are shown in Figure 3.
For a unique set of constraints and iDoF the system is sized by the system performance model at the power requirements during take-off of the aircraft. The sizing process is controlled by a genetic optimization algorithm that controls the iDoF of each component with the goal of simultaneously increasing power density and efficiency. In this study, the voltage level V D C is an optimization parameter on system level, while e.g., the electric frequency f e l (which is discretized to f e l , E M by the mechanical rotation speed of the electric machine n E M and its possible numbers of pole pairs) is an optimization parameter between the electric machine and the inverter. For all components, the main KPIs (mass, efficiency and required cooling power) are computed. The cooling power is fed into the heat-exchanger model to compute the heat-exchanger mass. For the sizing of the generator and corresponding inverter, an additional loop is inserted as the electric machine and inverter models do compute only one way. Thus, an initial guess for the required mechanical power at the generator’s shaft is made according to the power required at the cables P D C , c a b l e . After the calculation, the delivered power at the cables is compared to the required power and the mechanical power adjusted if necessary. Analytical models were chosen, as they can be computed very quickly on state-of-the-art hardware: For example, on one core of an Intel Xeon E5-2690 CPU the analytical computation for an electric machine takes between 0.1 s and 10 s, while with FE numerical methods, the same computation will require several minutes. This allows optimization of systems within a large design space that could not be accessed within reasonable calculation time with e.g., FEA models. Normally, analytical models cannot provide the same level of accuracy as detailed 3D FEA models or transient electric circuit calculations. Nevertheless, a general comparison between analytical models and FEA (or PLECS) shows that accuracies within 5% are achievable [13,14] which is sufficient for the system trade-off studies as presented here. Furthermore, our approach has the advantage that for all components the relevant physics that have an effect on the component sizing can be taken into account. Consequently, the complex trade-offs that occur already between two components can be leveraged to a system level.
A good example for such a trade-off is the choice of pole number of an electric machine: With higher pole number, the electric frequency rises and both electric machine and inverter can be built lighter. However, with higher electric frequencies, the losses of both components grow and therefore a larger heat-exchanger is required. Further trade-offs are the choice of rotation speed between the gearbox and the electric motor, the power factor between the electric machines and the power electronics and the choice of DC-link voltage on system level. They are discussed in detail in the results section.
In the following subsection the modeling of each component is summarized. To check the accuracy of these models, their results were compared against component designs that were designed, built and tested in-house. These comparisons revealed an accuracy of 2% to 5% for our analytical models depending on component and power level. As the modeling is similar to some of our previous work, text parts from [8,15] were re-used for the following description.

3.1. Electric Machines

Several machine types have been studied extensively for electric aircraft [16]. Surface-mounted, permanent magnet synchronous machines (PMSM) have been identified as the most promising technology. More exotic topologies such as dual rotor topologies, switch flux machines, transversal flux machines or axial flux machines were not considered. In principle they can provide higher torque (and power densities) for particular low speed applications and/or low power applications. However, their particular design aspects do not allow the scaling of them freely along a wide range of power and rotation speed [17].
The power density of an electric machine depends on many parameters [18]:
P M = 1 1 + K Φ m m 1 π 2 K e K f K p λ 0 2 Geometry Parameters · B g A n r o t η E M
The underbraced part of the equation represents the geometry of the electric machine, e.g., the geometrical details of the teeth (e.g., width and height), of the rotor, the winding geometry etc. η E M is the machine’s efficiency and A the electric current loading in the stator, which depends on the cooling of the stator; and hence on the thermal design and the insulation of the stator. B g is the magnetic field density in the airgap that can be approximated in first order as
B g = B r 1 1 + d g a p h m a g ,
where B r is the remnant magnetic field density of the permanent magnet, d g a p the magnetic airgap and h m a g the height of the magnets. According to Equation (2), B g increases with lower magnetic airgap. However, according to Equation (1) power density increases also with higher rotation speed at shaft n r o t . This requires a thicker retention sleeve for the magnets and thus a larger airgap, wherefore structure mechanical aspects play an important role in the design process, too; and must be balanced against electromagnetic aspects.
Thus, the iterative design process of the electric machine includes five disciplines. It starts with a defined set of requirements that the final design must fulfill. In a first step the geometrical layout of the machine is determined. Afterwards, the electromagnetic design includes the sizing of the magnetic circuit under no-load and load conditions with a non-linear lumped parameter model [13], adjusting phase currents to reach the required shaft torque T E M , s h a f t as well as the configuration of the winding layout. The electromagnetic calculation is done with Simcenter SPEED 13.06 [19].
The structural mechanics section covers the sizing of the retention sleeve for the magnets for different load cases as well as the oil retention sleeve. The thickness calculation is based on an analytical press-fit model which evaluates the tangential stresses with respect to the radial over-closure of the fit [20,21]. The oil retention sleeve is dimensioned considering the buckling of cylinders under pressure [22] as the critical design case. Passive structural masses of the machine include the rotor shaft, bearings, the housing, and terminal box. Their masses are hard to calculate as they strongly depend on the actual design as well as installation issues. According to a benchmark of several lightweight motors [17], a factor of two was used to account for the passive masses. This is a valid assumption when the power and rotational speed of the machine are fixed and thus the dimensioning torque for all designs is identical.
Furthermore, an important part in the machine design is insulation coordination based on IEC 60664 [23] to ensure secure operation at high voltage. To conclude the design process, a thermal analysis of the motor is performed to ensure that waste heat can be dissipated, which especially dimensions the cooling channels. The allowable conductor current density depends on the heat transfer into the cooling medium which in turn is a function of the thickness of the insulation hindering heat flux and thus limiting the allowable conductor current density.
After those design steps, the result is checked against the requirements. If they are not fulfilled, the design process enters a further loop, otherwise the design is valid and the specifications are extracted, e.g., to serve as input for a further component such as the DC/AC inverter. The inner degrees of freedom (and therefore optimization parameters) of the electric machine model are the number of poles and slots, the rotor radius, the diameter-length-ratio of the rotor D r o t /L r o t , the stator electric current density J r m s and the geometry of the stator (yoke thickness, teeth height and teeth width).
As permanent magnets NeFeB magnets were chosen as they provide the highest magnetic flux densities [24]. For the stator commercially available copper wires were considered [25] for the winding and CoFe steel as the soft-magnetic material for teeth and yoke. For the liquid cooling, synthetic oils such as described in [26] were chosen.

3.2. Gearbox

The mass and efficiency of the gearboxes were computed with an analytical tool that controls the commercially available software KISSSoft [27] via an interface. Depending on the required power, the rotation speed of the fan and the machine, gears, shafts, bearings and housing are designed for two different gear topologies: spur and planetary gearboxes. A more detailed description of the gearbox model can be found in [28]. Based on this reference, planetary gears were selected due to their lower mass and higher efficiencies for power and speed ranges that were taken into account in this particular study. With dry masses of about m g e a r = 200 kg and maximum efficiencies up to η g e a r = 0.996 the gearbox characteristics are in the same range as state-of-the-art gearboxes in a geared turbofan [10]. The inner degrees of freedom are the geometry parameters of the gears and shafts.

3.3. Power Electronics

DC/AC inverters can be realized in different topologies, differing in the height of the single-step output voltage and the total harmonic distortion (THD). Our model considers two-level (2L-), three-level flying capacitor (3LFC-), three-level neutral point clamped (3LNPC-), three-level T-type neutral point clamped (3LTNPC-) and five-level stacked multicell (5LSMC-) DC/AC voltage source inverters. The choice of 3L topologies is based on a literature review, where it was concluded that the NPC- and TNPC-topologies are most promising for high power-to-weight designs. The advantage of the 3LFC- and 5LSMC-topologies is a smoother current waveform, which reduces harmonic losses in the electric machine and therefore can provide a higher total system efficiency.
Most parts of our design process are based on the extensive work described in [14]. First, the voltage configuration of switches and diodes for the given operation point is determined. To do this, a database with semiconductor modules and their properties was set up. A scalable semiconductor characteristic is established from the data which is then used to perform a coupled calculation of electric and thermal performance. The maximum bias voltage is limited to 50 % of the rated blocking voltage to retain low failure rates in the presence of cosmic radiation effects at the flight level of 40,000 ft [29]. Based on the operation point the losses of the semiconductor modules are calculated. The semiconductor modules, as well as the heat sink, e.g., an aluminum cooling plate, are sized such that the chip temperature increase due to the losses at the calculated operating point is below a certain limit and that the waste heat can be removed via the cooling plate. The cooling plate carries the flow of a water-glycol mixture.
Furthermore, the DC-link capacity is calculated based on the expected current ripple calculated analytically using a method provided by Krug [14,30]. Again, a database of commercially available capacitors is used. The sizing process also includes a mass estimation of the gate driver units and a simple housing but misses a calculation of electromagnetic interference (EMI) filters on AC and DC side. To account for the additional mass of the filters, a factor of two is applied.
For each topology we computed inverters in the range of V D C and f e l , E M according to Table 1. The switching frequency is kept constant ten times the electric output frequency f e l , E M . The operation temperature of the chip is assumed to be 75 °C over the coolant inlet temperature at the cooling plate which is varied between 65 °C and 95 °C as an optimization parameter in the system. Furthermore, inner degrees of freedom include the choice of the inverter topology, choice of module and geometric dimensions regarding the cooling plate. In our study, mainly the following modules were considered to be building blocks for the inverter: Infineon FS and FZ families, rated from 600 V to 6.5 kV (IGBTs); Wolfspeed CCS and CAS family, rated for 1.2 kV and 1.7 kV, Wolfspeed XHV family rated for 3.3 kV and 6.5 V and Siemens slimline V2C/V2 modules rated for 3.3 V and 6.5 V (SiC-MOSFETs).

3.4. DC Cables

The geometrical design of the DC transmission cable consists of a circular conductor material, i.e., copper or aluminum, and a concentric layer of insulation material, as electromagnetic field effects and thus shielding can be neglected. The cable sizing process is based on a coupled model of electrical and thermal analysis as well as insulation coordination. The electrical domain covers the calculation of electrical parameters such as voltage levels, currents and resistances as well as the ohmic losses in the conductor considering the conductor material. Insulation coordination determines the necessary thickness of insulation to avoid arcing according to IEC 60664 [23]. A thermal analysis determines the size of the conductor by iteratively solving a one-dimensional, cylindrically symmetrical heat equation [31]. The size of the conductor is chosen such that the losses can be dissipated via natural convection and radiation at given ambient temperature T a m b ( 55 °C), and the maximum admissible conductor temperature T c o n d ( 180 °C) at the insulation interface is not exceeded. As all dimensions are fixed by this procedure, the only inner degree of freedom for the cable is the choice of the conductor material (copper or aluminum).

3.5. Heat Exchanger

As our focus was on sizing of the electric components, the heat exchanger was taken into account mainly through one quantity, namely the weight-to-power ratio γ H X , i.e., how much weight has to be added to the system for each kW of heat that has to be dissipated into the environment. A survey on state-of-the-art lightweight heat exchangers (such as used for super sportscars) reveals that this number is in the range of γ H X = 1.0 kg/kW to γ H X = 3.0 kg/kW and potentially could go down to γ H X = 0.5 kg/kW if optimized to the requirements of the particular flight specification [32]. Consequently, the heat exchanger adds a penalty factor for designs with low efficiencies.

3.6. System Optimization

For the system optimization a pareto-based multi-dimensional genetic algorithm following the ideas of [33,34,35] was elaborated. The optimization target is to identify pareto-optimal system configurations with respect to the specified KPIs, i.e., system mass m s y s and efficiency η s y s , for the given requirement sets x , such that
min x ( { m s y s ( x ) , ( 1 η s y s ( x ) ) } ) ,
where m s y s = i m i and η s y s = i η i . Pareto-optimality is chosen as a criterion to enable an evaluation of designs with concurring KPIs. The optimization workflow was performed as follows:
For the system, i.e., for each component the following variables are fixed: DC-link voltage V D C and ambient temperature T a .
For each component the boundary conditions (e.g., maximum allowable diameter) and the limits on inner degrees of freedom are fixed (e.g., the D r o t /L r o t -ratio of the motor can be varied between 0.3 and 3). Furthermore, the sample size for each degree of freedom is fixed. After fixing the sample sized we had roughly 10 4 to 10 5 variants for the gearbox, 10 5 to 10 6 variants for each electric machine, 100 variants for each inverter and 2 variants for the cable. All variants are stored as the initial gene-pool of each component where every inner degree of freedom represents one gene. The gene-pool for each component is the set of allowable parameter values that can be used by the optimizer.
As the sample size is quite large and many parameter combinations do not yield meaningful designs, the gene-pool for each component is further refined by finding feasible solutions for each component. At first, Latin hypercube sampling is used to cover a uniform subspace of options for each component. Then, for each component the optimization algorithm is performed in the same way as for the system. The results of this optimization serve as the final gene-pool for each component during the system optimization.
The initial system population is created by choosing N i = 2400 random configurations from the gene-pool for each component.
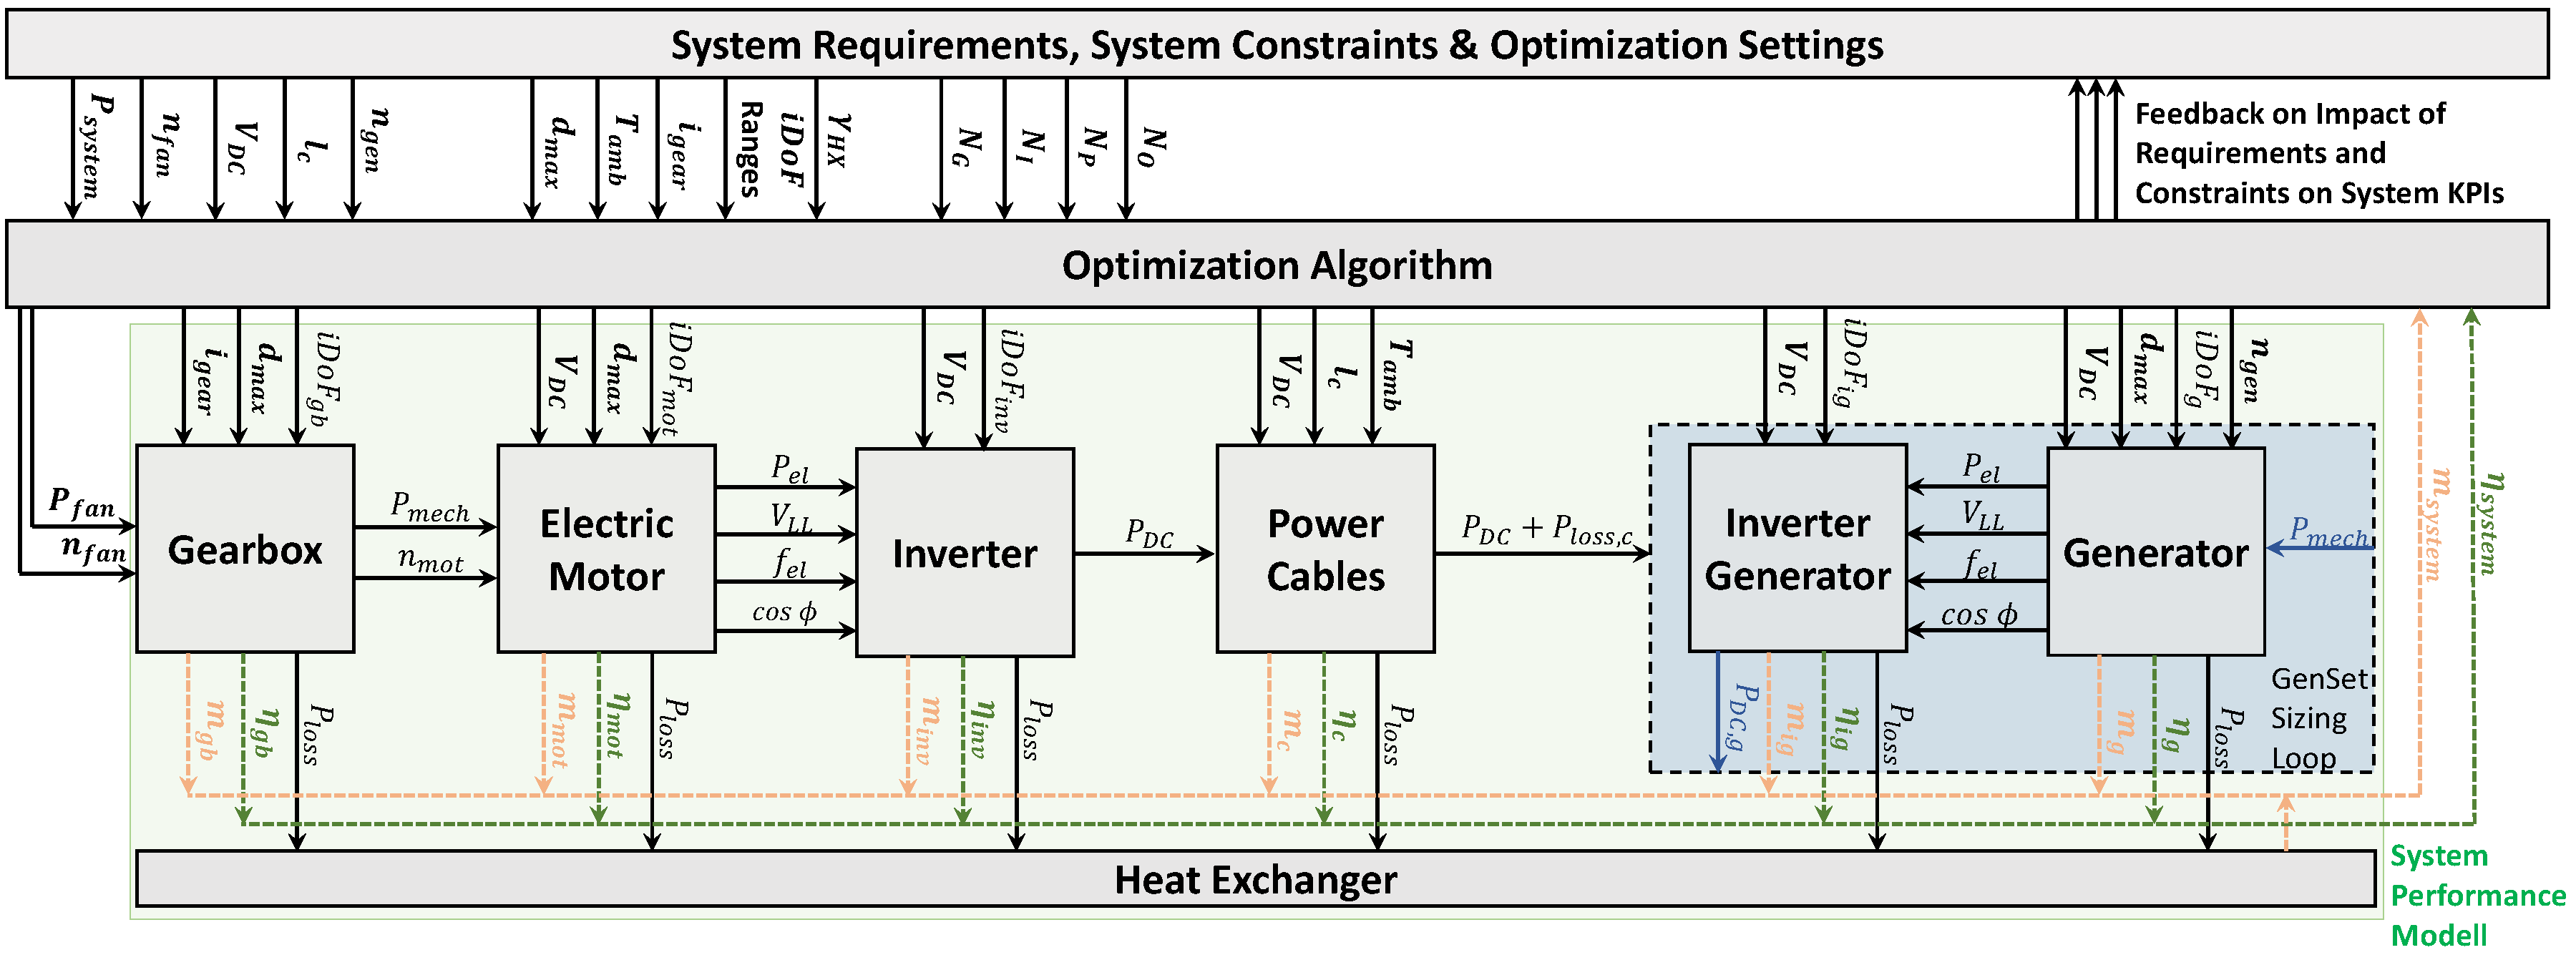
For each configuration of the system, mass and efficiency are calculated according the design process demonstrated in Figure 3.
For all calculated configurations, pareto-fronts are calculated and each configuration is assigned a rank according to the pareto-front that it belongs to.
Parent configurations for the breeding of the next-generation offsprings are selected according to their rank. The parents belonging to one rank were not sorted (according to mass or efficiency) but the parents are chosen randomly for cross-over. N p = 800 parent configurations were selected for cross-over.
N o = 600 offspring configurations were created by cross-over from the parent configurations according to the following rule: Gearbox configuration and gear ratio was inherited from parent configuration 1; geometry parameters of electric machines (motor and generator) were inherited from parent configuration 1, while number of pole pairs, number of slots and stator current density J r m s were inherited from parent configuration 2; inverter topology was inherited from parent configuration 1, while the coolant inlet temperature T i n l e t was inherited from parent 2; cable material was inherited from parent configuration 1.
N m = 60 mutations are performed on the offspring configurations that are chosen randomly. For each component one gene is chosen randomly to be mutated and then the new value of the gene is selected randomly from the gene-pool of the component that was generated in step 3.
Steps 5 to 8 are repeated N g = 10 times. The calculations are always performed only for the offsprings but not for the parents that remained in the population, while the selection of parents (step 5) is performed for all configurations (i.e., parents and offspring).
The optimization of single components was performed similarly to the system optimization where single components are regarded as minimal systems (i.e., systems where all the other component masses and efficiencies are basically 0 and 1, respectively). The constraints of the optimization were
  • The maximum allowable diameter for the propulsion motor d E M , m a x < 0.6 m.
  • The maximum allowable length for the propulsion motor l E M , m a x < 0.9 m.
  • The maximum allowable rotation speed at the shaft of the propulsion motor n E M , m a x < 21,000 min 1 .
  • The maximum allowable diameter for the generator d G e n , m a x < 0.5 m.
  • The maximum allowable length for the generator l G e n , m a x < 2 m.
  • The maximum allowable electric frequency for electric machines and inverters f e l , m a x < 4 kHz.
  • The maximum allowable temperature for the conductors in the stator of the electric machines T w i r e , m a x < 180 °C.
  • The maximum allowable temperature for the inverter power modules T P M , m a x < 170 °C.
  • The maximum allowable temperature in the center of the cable conductor T C , m a x < 180 °C.

4. Results

Before the results on a system level are presented, the optimization results for each component are shown. This allows understanding of the sensitivity of mass and efficiency of the single components on the most relevant parameters, such as the DC-link voltage V D C , the electric frequency f e l , i , the rotation speed at shaft n r o t etc. It was decided to give an insight into the model sensitivities this way, since they can hardly be captured by a set of analytical equations because for every component multiple domains have to be considered during the optimization process that mutually influence each other.

4.1. Optimization

First, the functionality of the optimizer is illustrated. In Figure 4a a typical mass over efficiency diagram is shown for electric machines with P m o t = 10 MW, n m o t = 3500 min 1 , J r m s 25 A/mm 2 and V D C = 3 kV. The initial population was N i = 2000 designs. N p = 600 parents and N o = 600 offspring are selected for each consecutive generation. The evolution of the designs towards lower masses and better efficiencies is well visible. Although improvements are seen until the seventh generation, it appears to be saturated for further generations. A similar behavior was observed also with other input values (for power, rotation speed, etc.). Thus, the optimization process for single components was stopped at the seventh generation. A similar behavior can be observed if the whole system is optimized. This can be seen in Figure 4b. The plot shows an optimization run for a system with a DC-link voltage V D C = 4 kV without heat-exchanger. The total time required for the optimization of the system for one fixed set of requirements and constraints was roughly 2 days, running on 40 cores in parallel. Roughly half of this time is used for the single component pre-design.

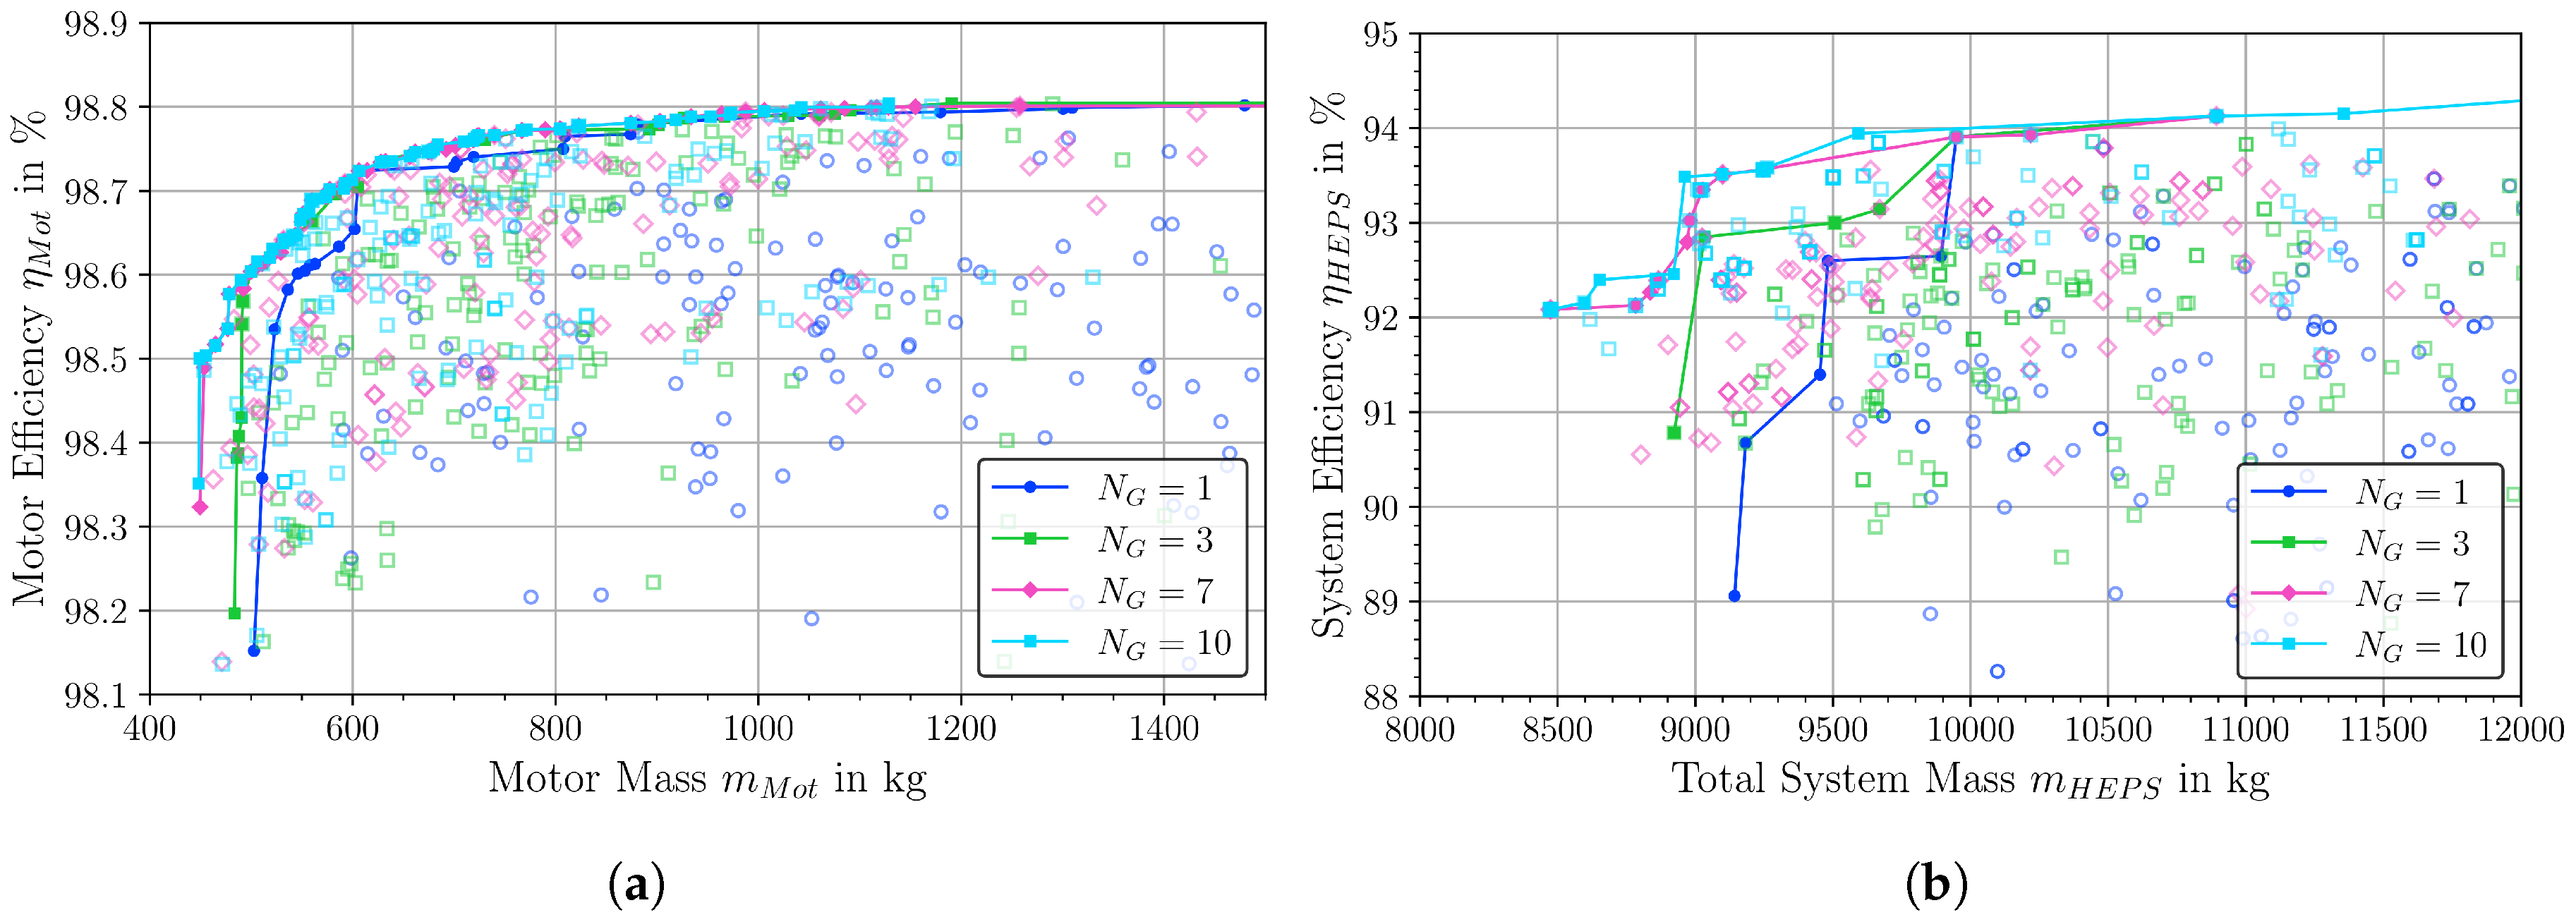
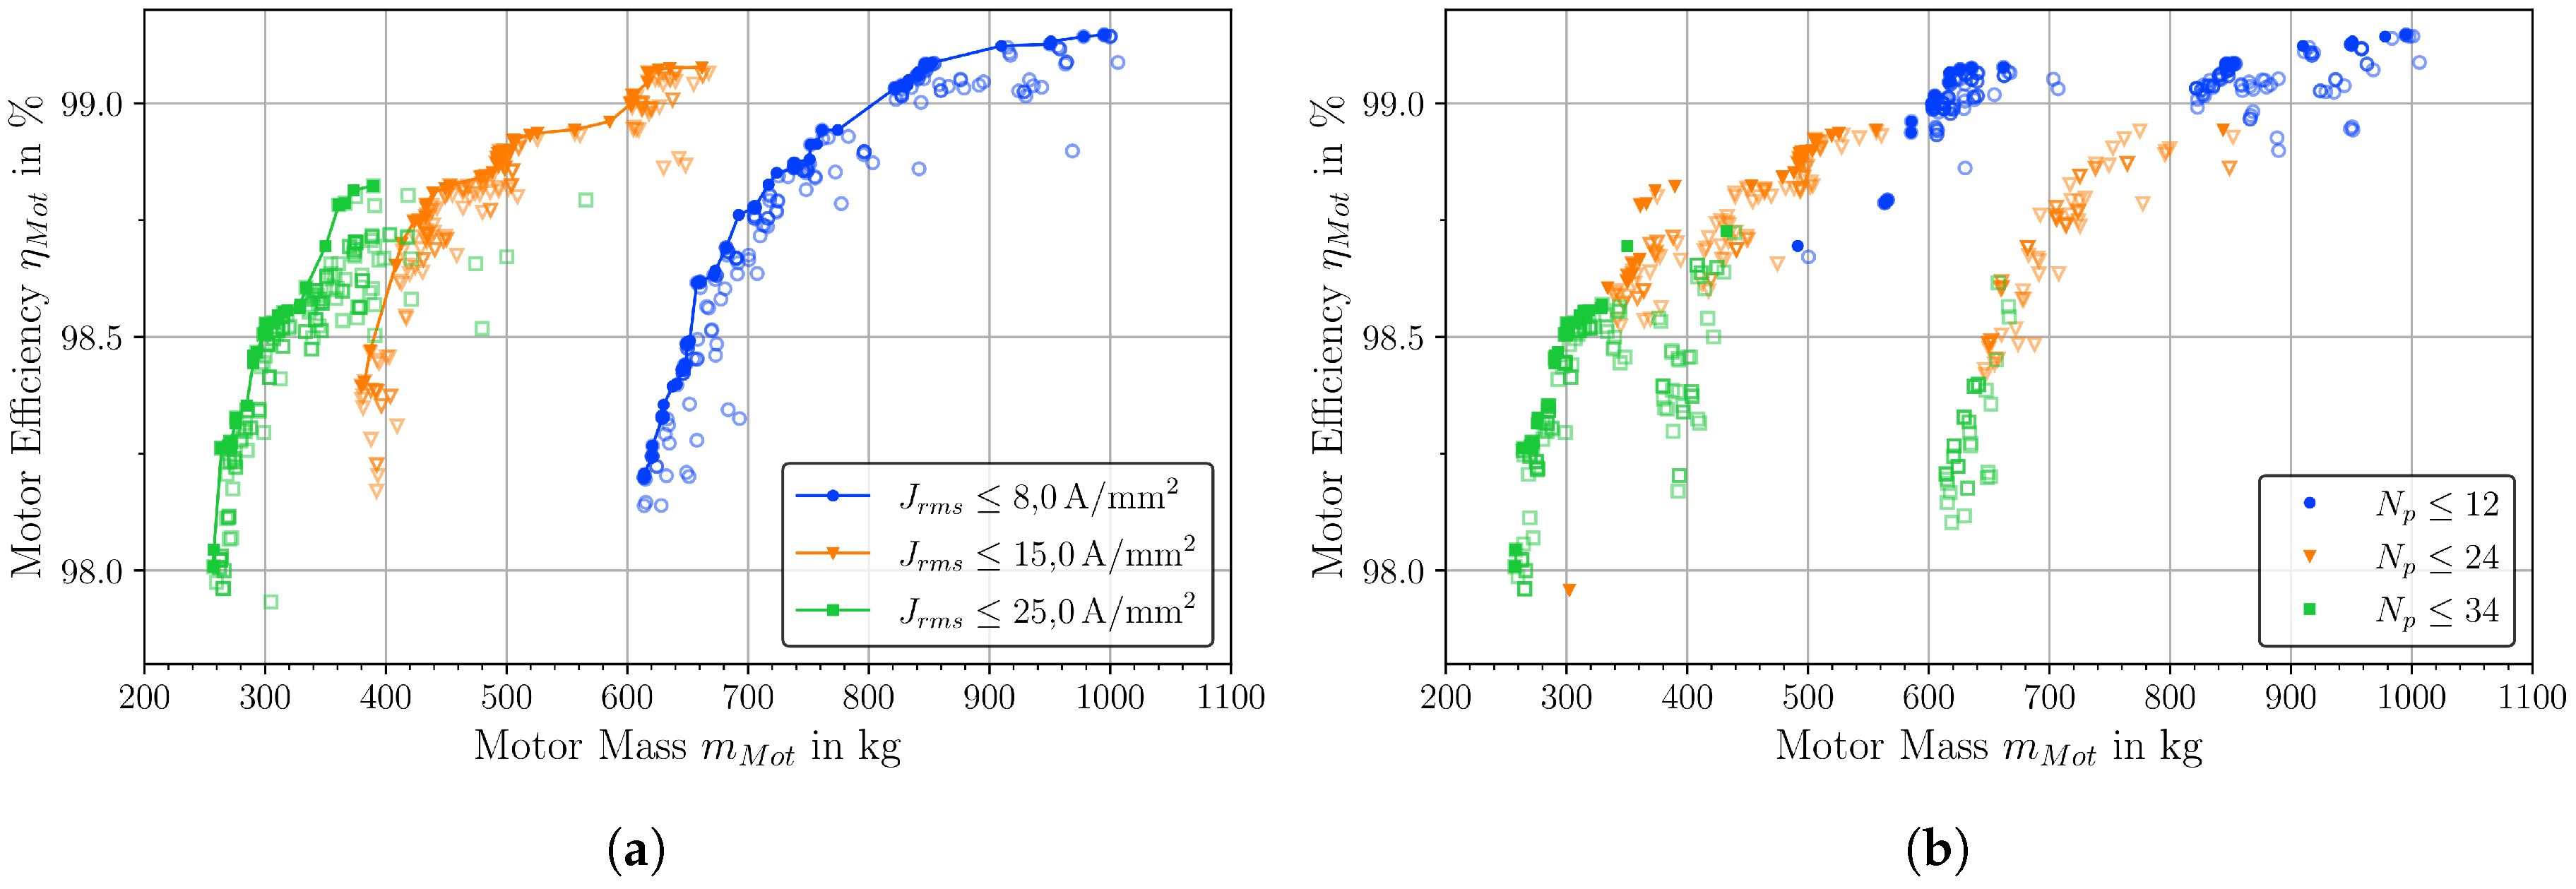
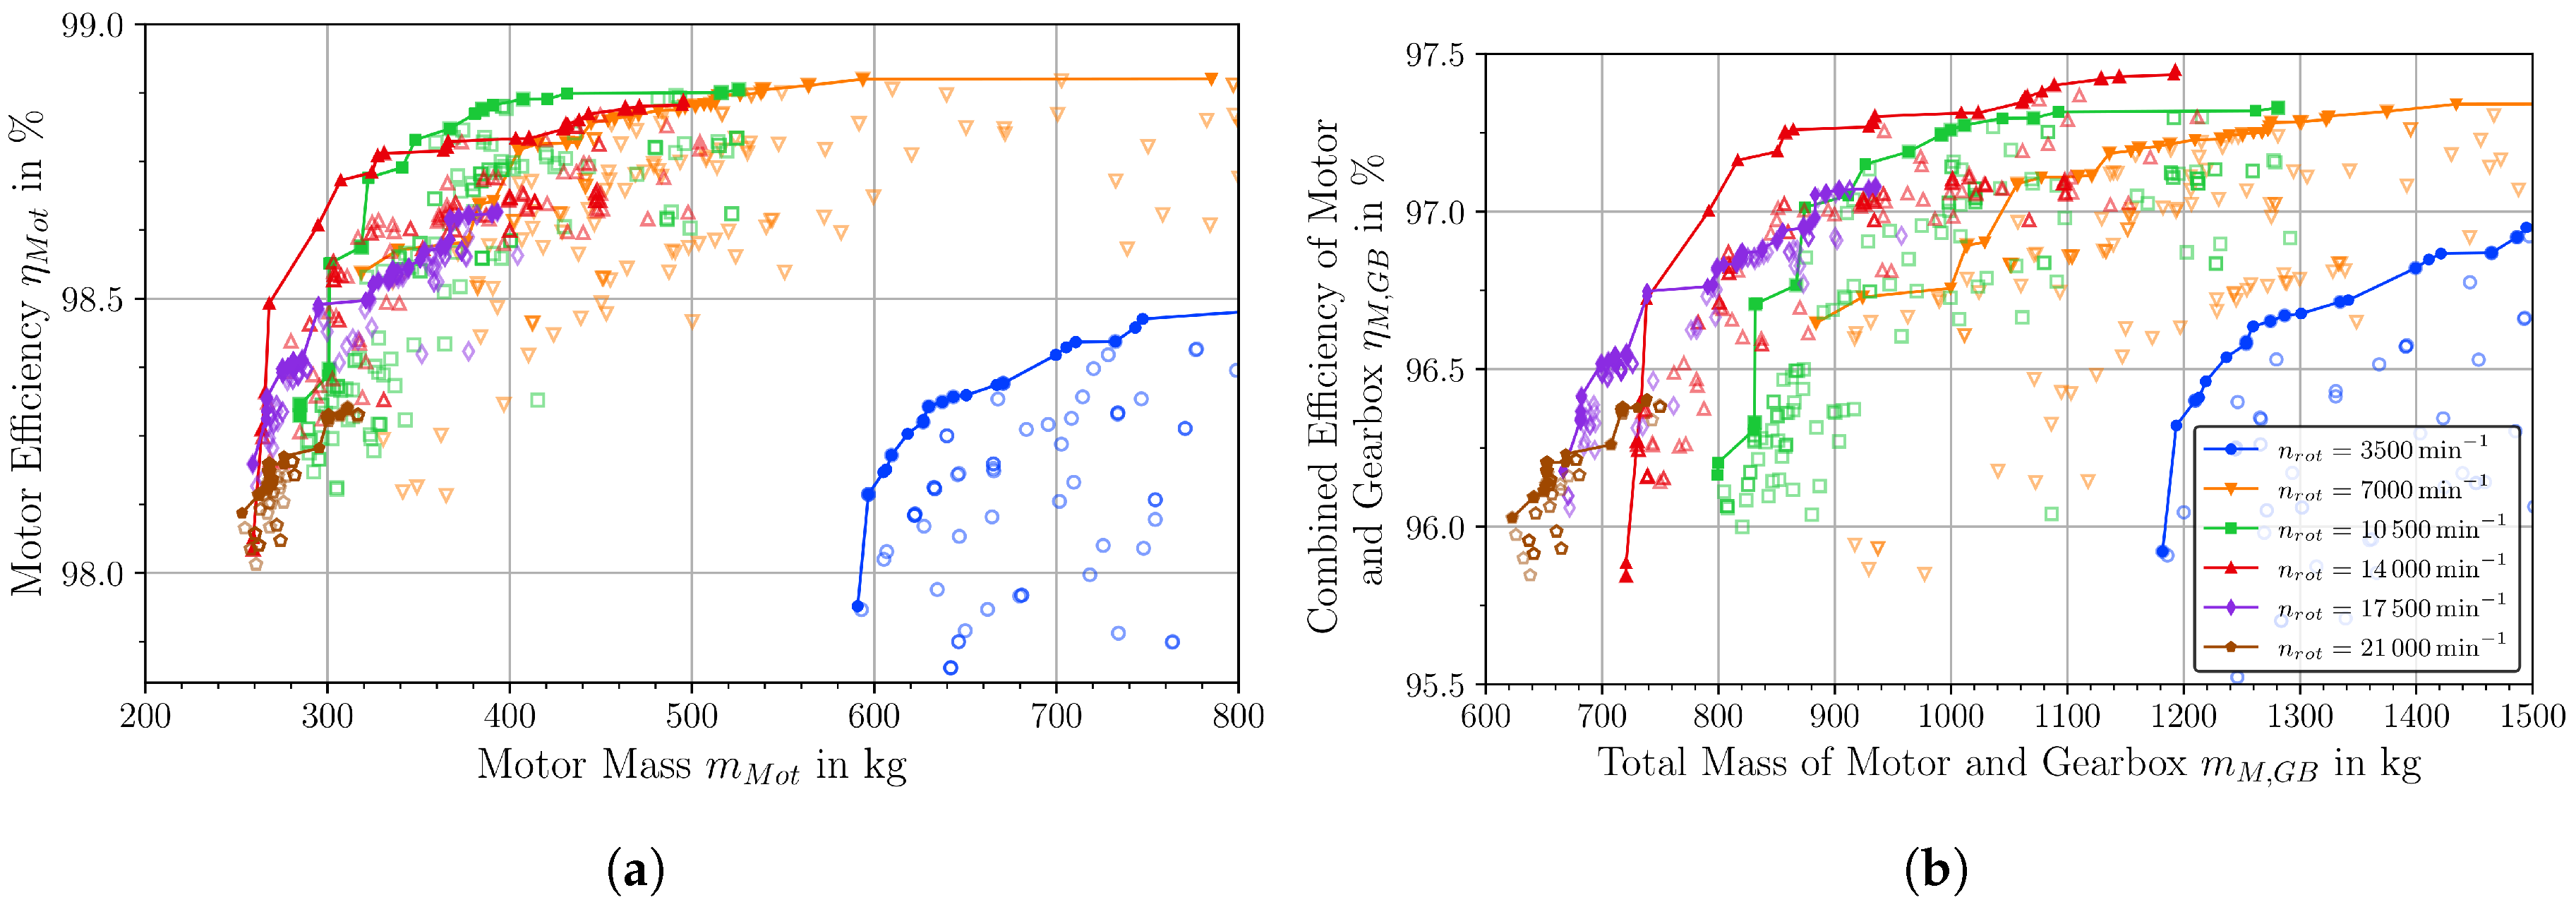
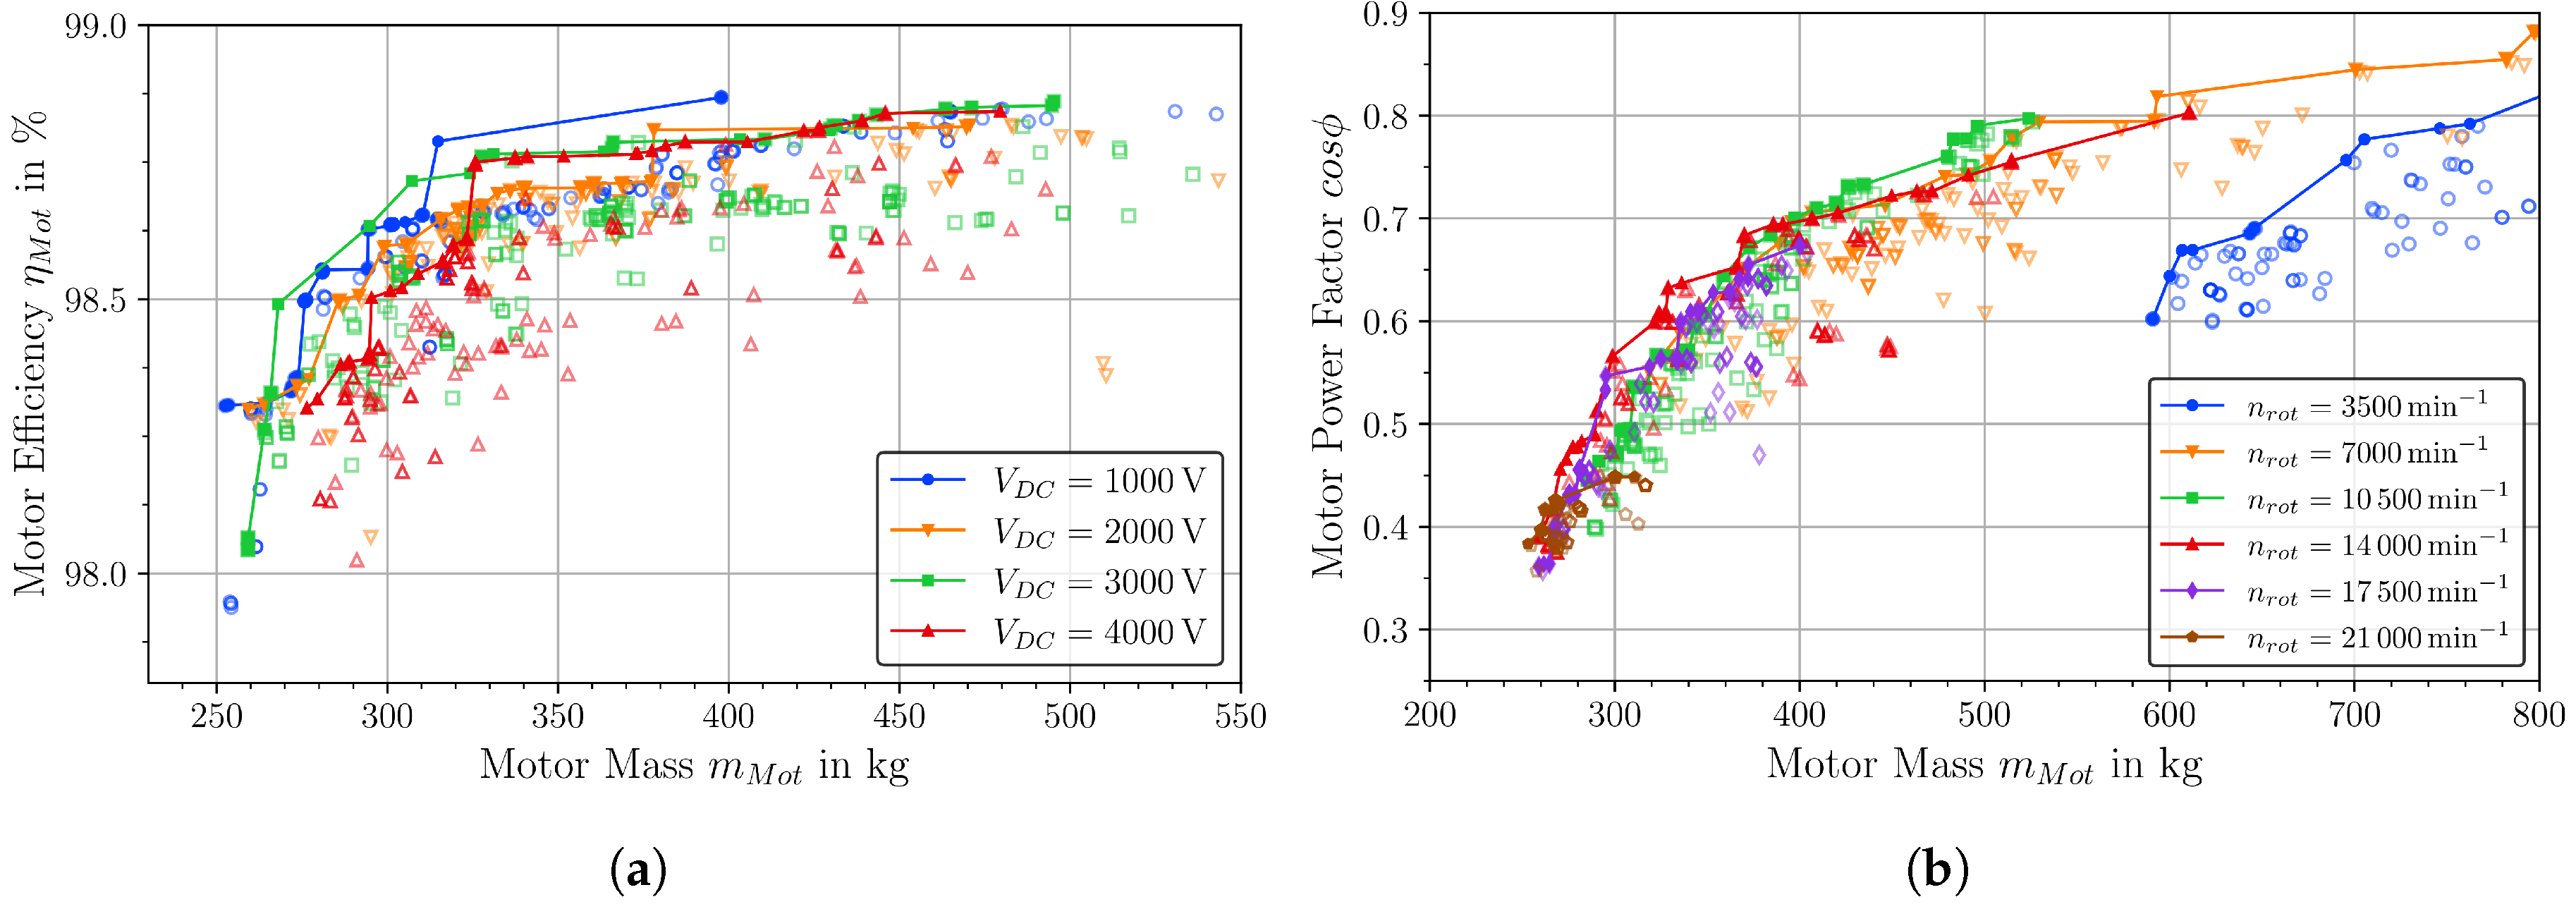
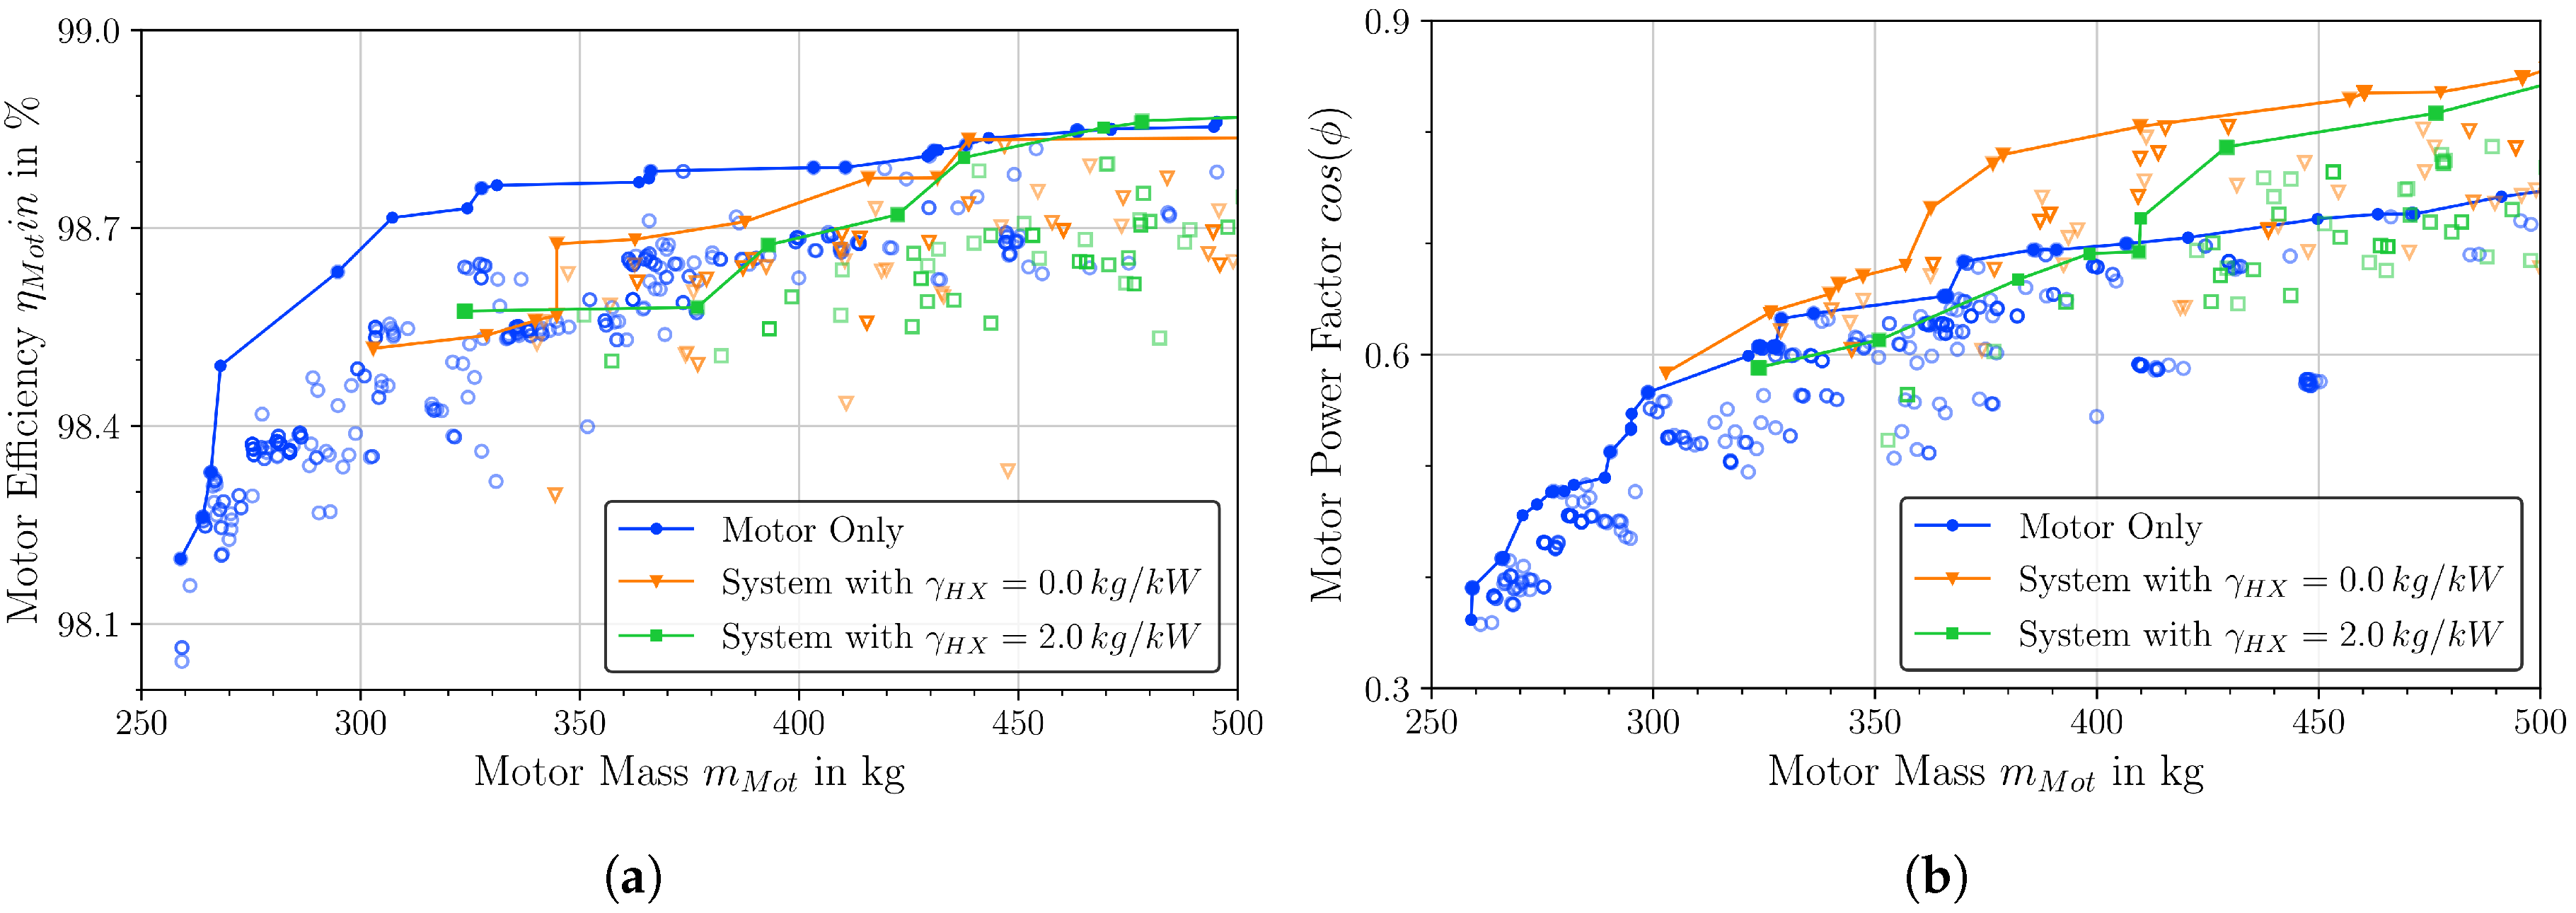
4.2. Electric Machines and Gearbox

Electric machines that fulfill the requirements and constraints of Table 1 were modeled. A configuration with a high mechanical rotation speed (n m o t = 14,000 min 1 ) was chosen as an example to illustrate the influence of the stator current density on the motor weight as shown in Figure 5a for one propulsion motor (P m o t = 10 MW). A configuration with relatively high rotation speed was depicted to exemplify the effects of different parameters on the machine mass and efficiencies since for configurations with lower speeds, most designs with low current density would not fulfill the maximum diameter constraint. Clearly, machines with intense cooling are significantly lighter but also less efficient as the ohmic losses increase with higher current density. Machines are considered to be air-cooled for J r m s 8 A/mm 2 , water-jacked cooled for J r m s 15 A/mm 2 or direct liquid-cooled if J r m s 25 A/mm 2 (This classification relates solely to the stator cooling concept.). The best power densities for air, water-jacked and direct liquid-cooled machine are around 16 kW/kg, 25 kW/kg and 40 kW/kg, respectively. They are achieved at power factors of about cos( ϕ ) ≈ 0.75.
Compared to other publications [17] and latest state-of-the-art review of electric machines [36], these values may appear high. This has multiple reasons: On the one hand, our model does not take into account details of mechanical design such as installation and structural loads due to gyroscopic forces. This would add further mass to the real design. Therefore, the values presented here should be understood as a “physical achievable limit”. On the hand, the result can be attributed to the high rotation speed of the machine resulting in very high electric frequencies: The same designs as in Figure 5a are shown in Figure 5b; however in this plot the number of poles is denoted by the color. N p o l e s = 12 poles correspond to an electric frequency of f e l , E M = 1.4 kHz and N p o l e s = 34 poles to f e l , E M = 3.9 kHz. Designs with higher electric frequencies are significantly lighter but also less efficient due to higher AC losses. In previous publications the electric frequency was normally restricted f e l , E M 1.5 kHz. Hence, solutions with very high power densities were rejected. If we put a similar constraint on the electric frequencies, the highest power densities would be limited to roughly 20 kW/kg.
The effect of the heat exchanger on the machine mass is demonstrated in Figure 6a. The same machine configurations (n m o t = 14,000 min 1 , J r m s 8 A/mm 2 , 15 A/mm 2 and 25 A/mm 2 ) are shown assuming heat exchangers with γ H X = 0.5 kg/kW, γ H X = 1.0 kg/kW and γ H X = 2.0 kg/kW, respectively. The mass of the heat-exchanger is added to the machine mass. As for current densities J e f f 8 A/mm 2 , machine are considered to be air-cooled, no heat-exchanger mass was added on-top of the machine mass in this case. The impact of the heat exchanger is drastic. Even with the assumption of light heat exchangers ( γ H X = 0.5 kg/kW) the combined mass is 30% to 40% higher than of the motor alone. With heavier heat exchangers ( γ H X = 2.0 kg/kW) that are comparable the state-of-the-art commercial components, the additional heat-exchanger mass could even consume almost all weight advantage of the direct liquid-cooled designs.
In Figure 7a the mass of one 10 MW motor and in Figure 7b the combined mass of two axially stacked electric motors of P m o t = 10 MW with a corresponding gearbox are shown on the x-axis, and their corresponding efficiency on the y-axis. For the direct drive solution n m o t = 3500 min 1 no gearbox mass was added. The current density was fixed to J r m s 25 A/mm 2 as for n m o t = 3500 min 1 and n m o t = 7000 min 1 almost no designs fulfilled the maximum diameter constraint with J r m s 15 A/mm 2 . The calculated gearbox masses (120 kg to 230 kg) are comparable to what is known from state-of-the-art geared turbofans [10].
Designs with higher rotation speeds and gearbox outperform the direct drive solution. An interesting observation is that without constraints also for the direct drive solution much better masses and efficiencies (around 420 kg) could be possible as shown in Figure 4a. However, these designs have diameters of 800 mm to 900 mm and therefore are sorted out due to the maximum diameter constraint. For speeds above n m o t 7000 min 1 the gains in motor mass saturate while the gearbox mass still decreases with higher transmission ratio. Thus, the high-speed n m o t = 21,000 min 1 designs have the lowest mass as can be seen in Figure 6b. However, these designs also have lower efficiencies. Thus, taking the heat-exchanger into account, the designs with lowest mass can be found for n m o t = 17,500 min 1 assuming γ H X = 2.0 kg/kW.
Furthermore, in Figure 8b the power factor cos ( ϕ ) is plotted against the mass for feasible designs. One can see that higher power factors correlate with higher mass. As lower power factors lead to an increased mass of the inverter and the concurrent system components behind the inverter, on a system level this will be another central trade-off between motor (and gearbox) mass and the mass of the other components. Although the direct drive solution does not seem meaningful in the system context, it is not straightforward to say which is the best high-speed geared drive from the system’s point of view.
The influence of the voltage on mass and efficiency is shown in Figure 8a for n m o t = 14,000 min 1 , J e f f 25 A/mm 2 and V D C = 1 kV, 2 kV, 3 kV and 4 kV. The dependence is visible but rather low and considerably lower than the influence of current density or rotation speed. The difference in mass between the lightest designs at V D C = 1 kV and V D C = 4 kV is only about 30 kg (≈10%).
The sizing of the generator shows a similar behavior as sizing of the motors for the propulsion unit wherefore we omitted explicit plots. The pareto-optimal configurations have power densities of about 19 kW/kg and are achieved at power factors of roughly cos( ϕ ) ≈ 0.75–0.8, electric frequencies of f e l 1 kHz to 2 kHz and current densities of J e f f 25 A/mm 2 . The power densities for the generator are lower than for the electric motor (at the fan) due to the dimension constraints. A similar setup as for the EPU (two machines at one shaft) could be also adopted to the generator. However, we did not adopt it here, to maintain comparability to the cryogenic version.
For comparison: In the cryogenic case, the best power densities of about 40 kW/kg were achieved with a direct drive at efficiencies of about 99.8% and frequencies of f e l , E M = 350 Hz.

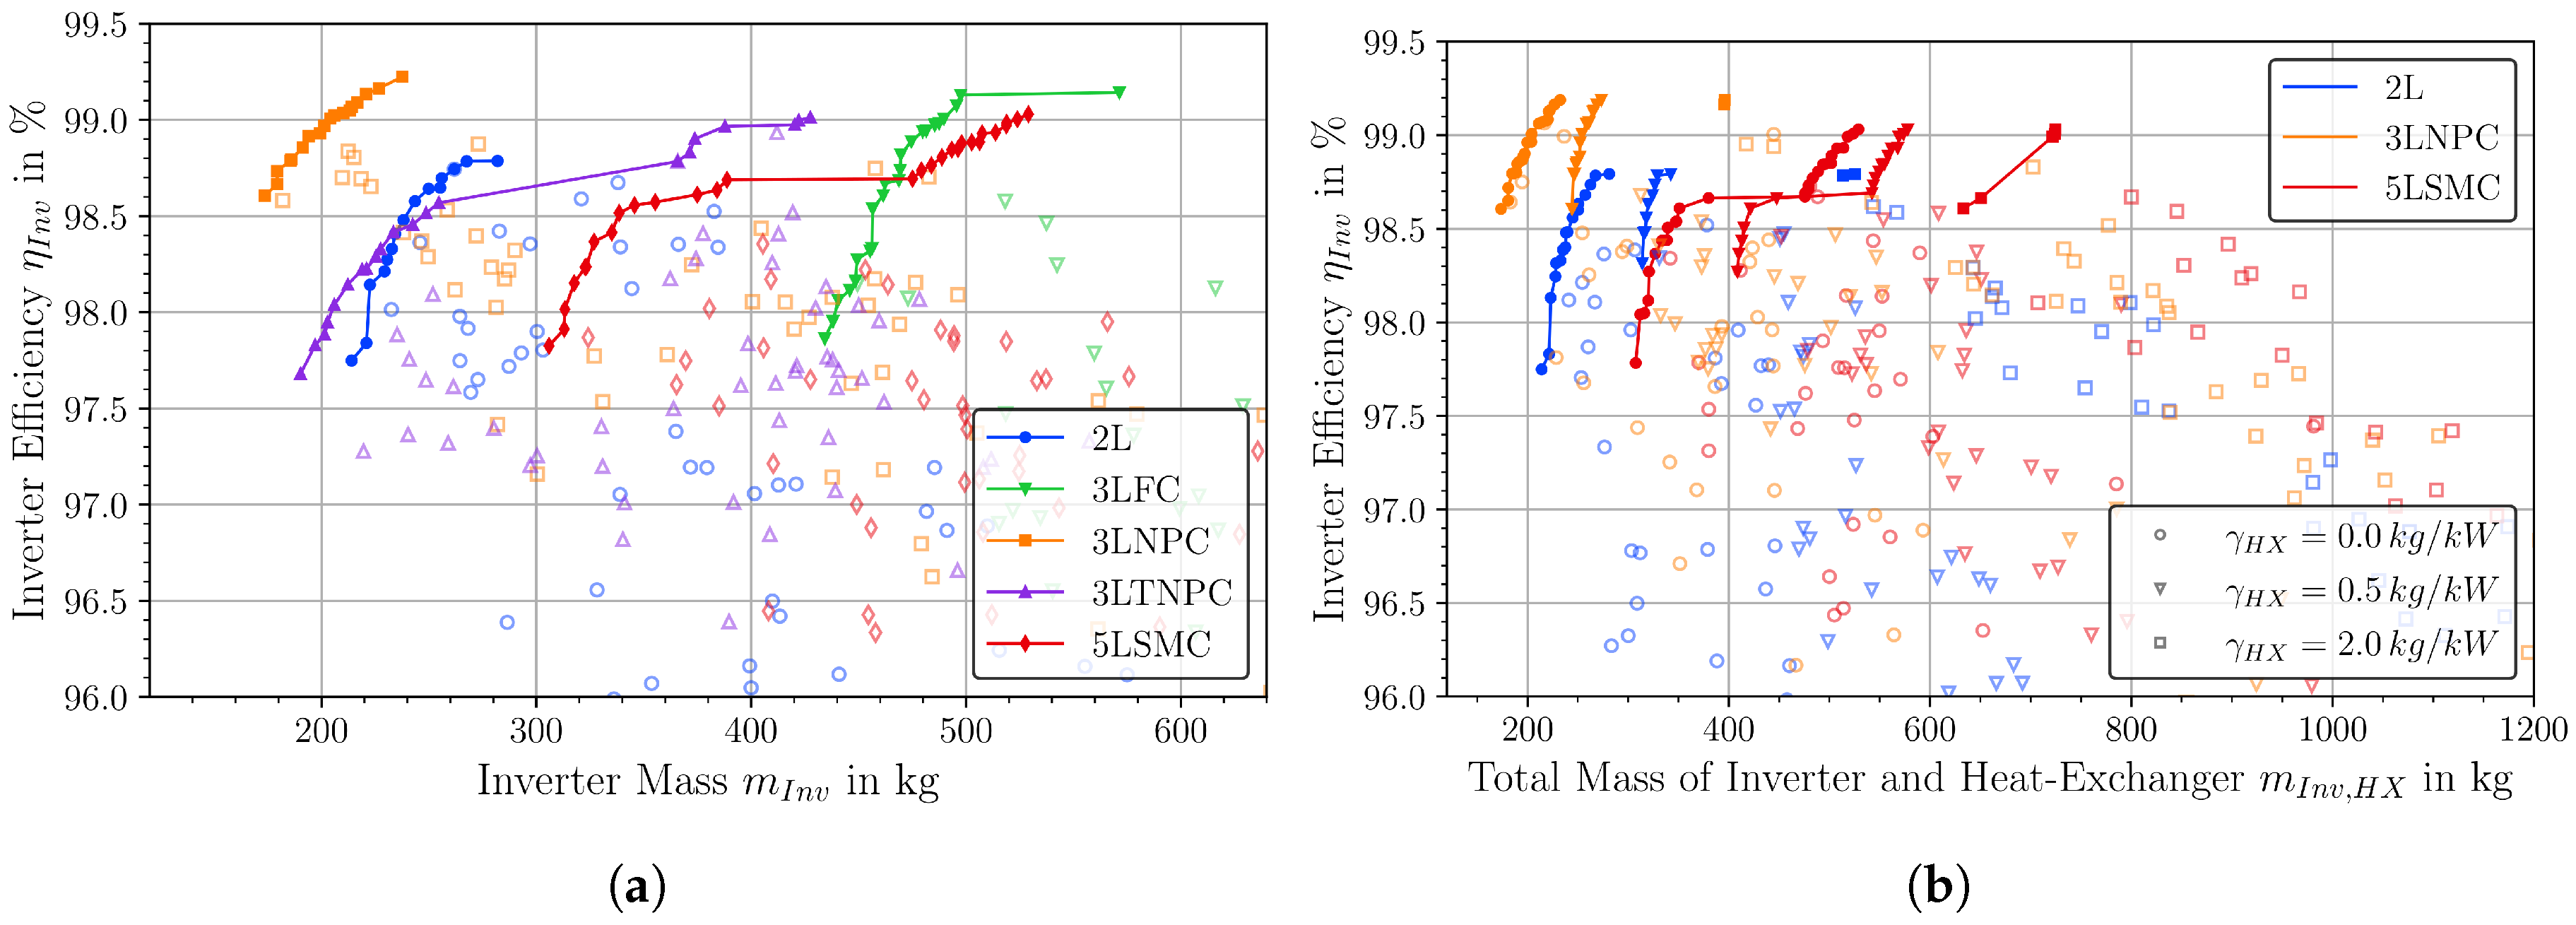
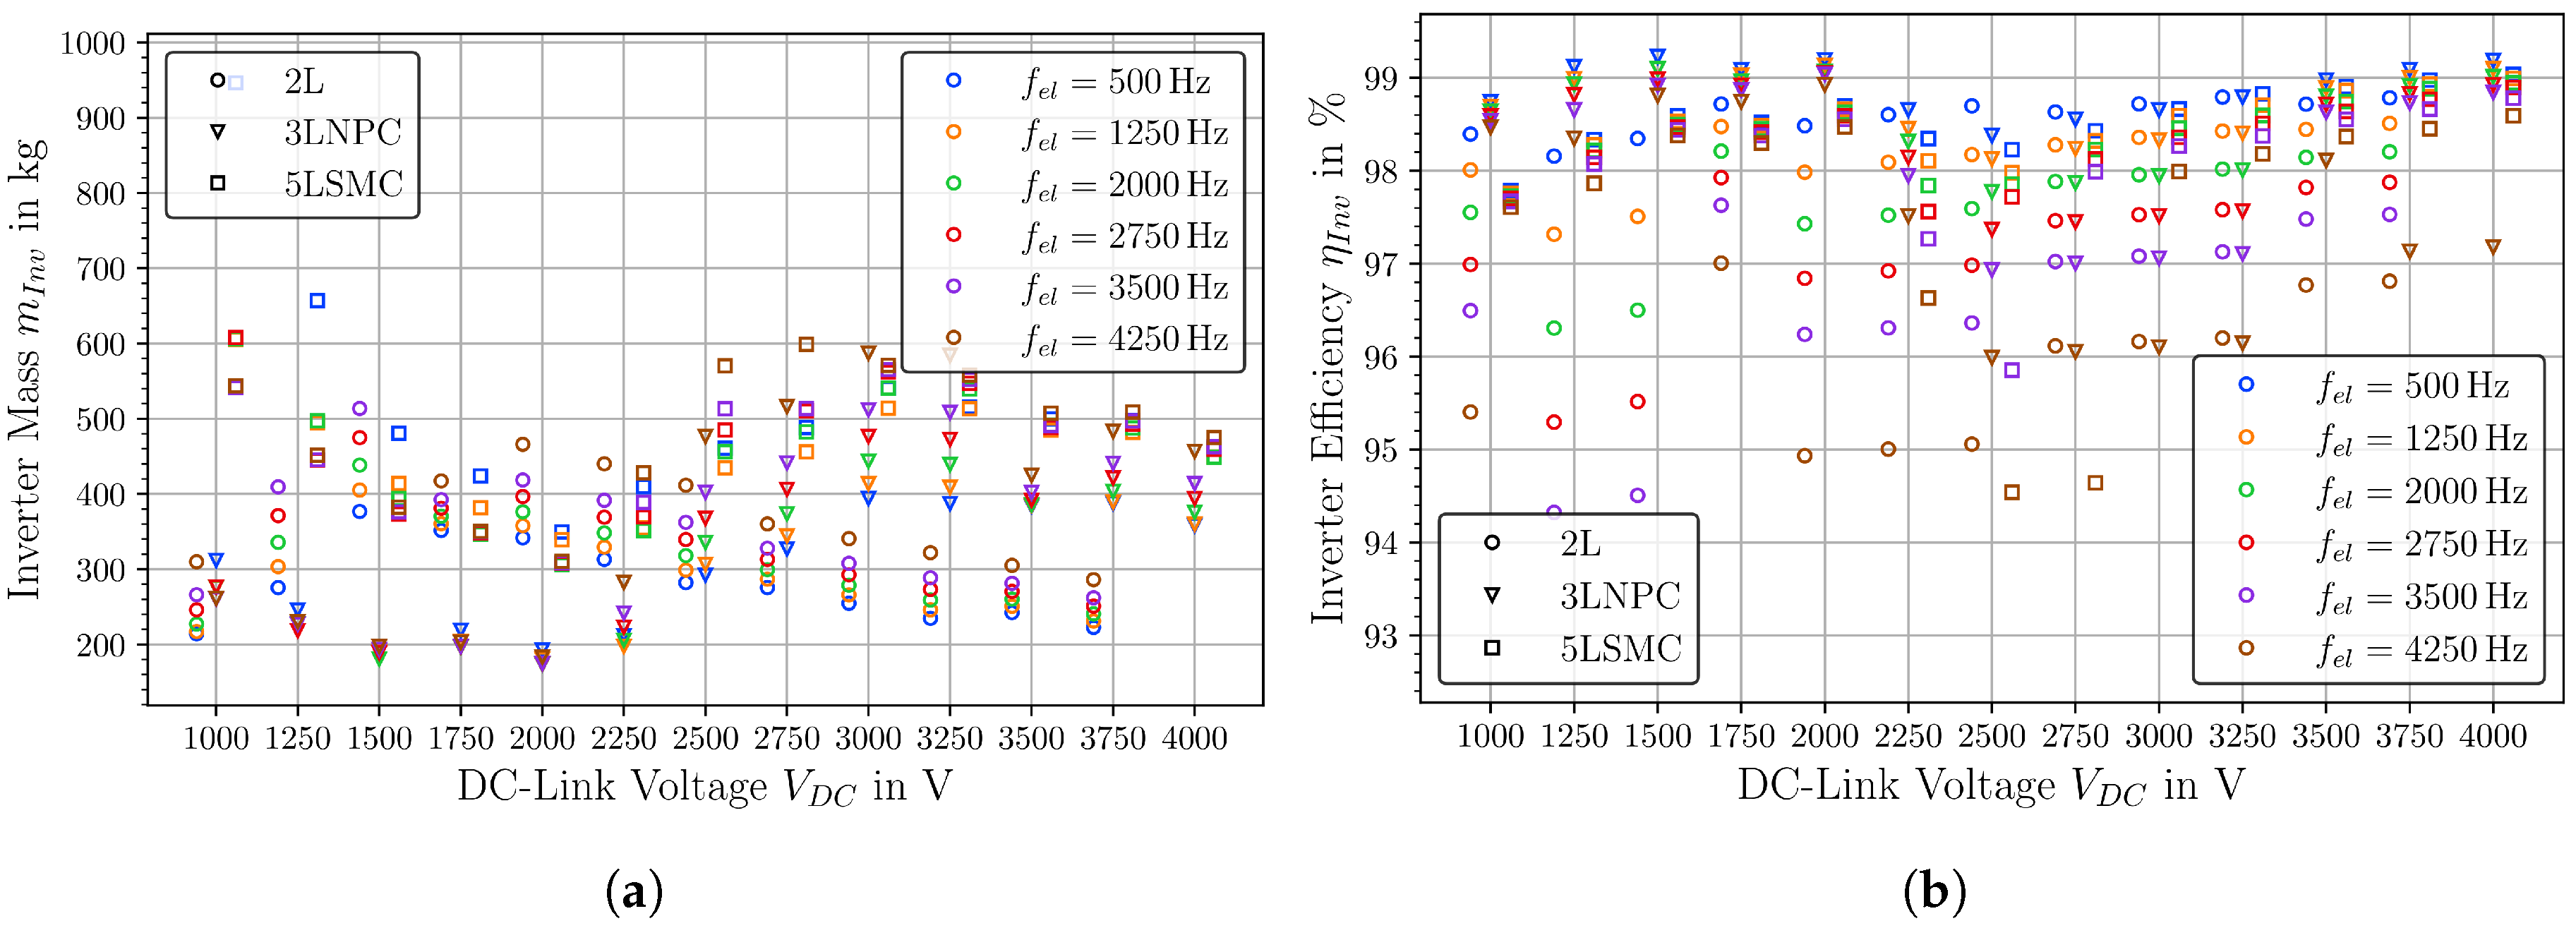
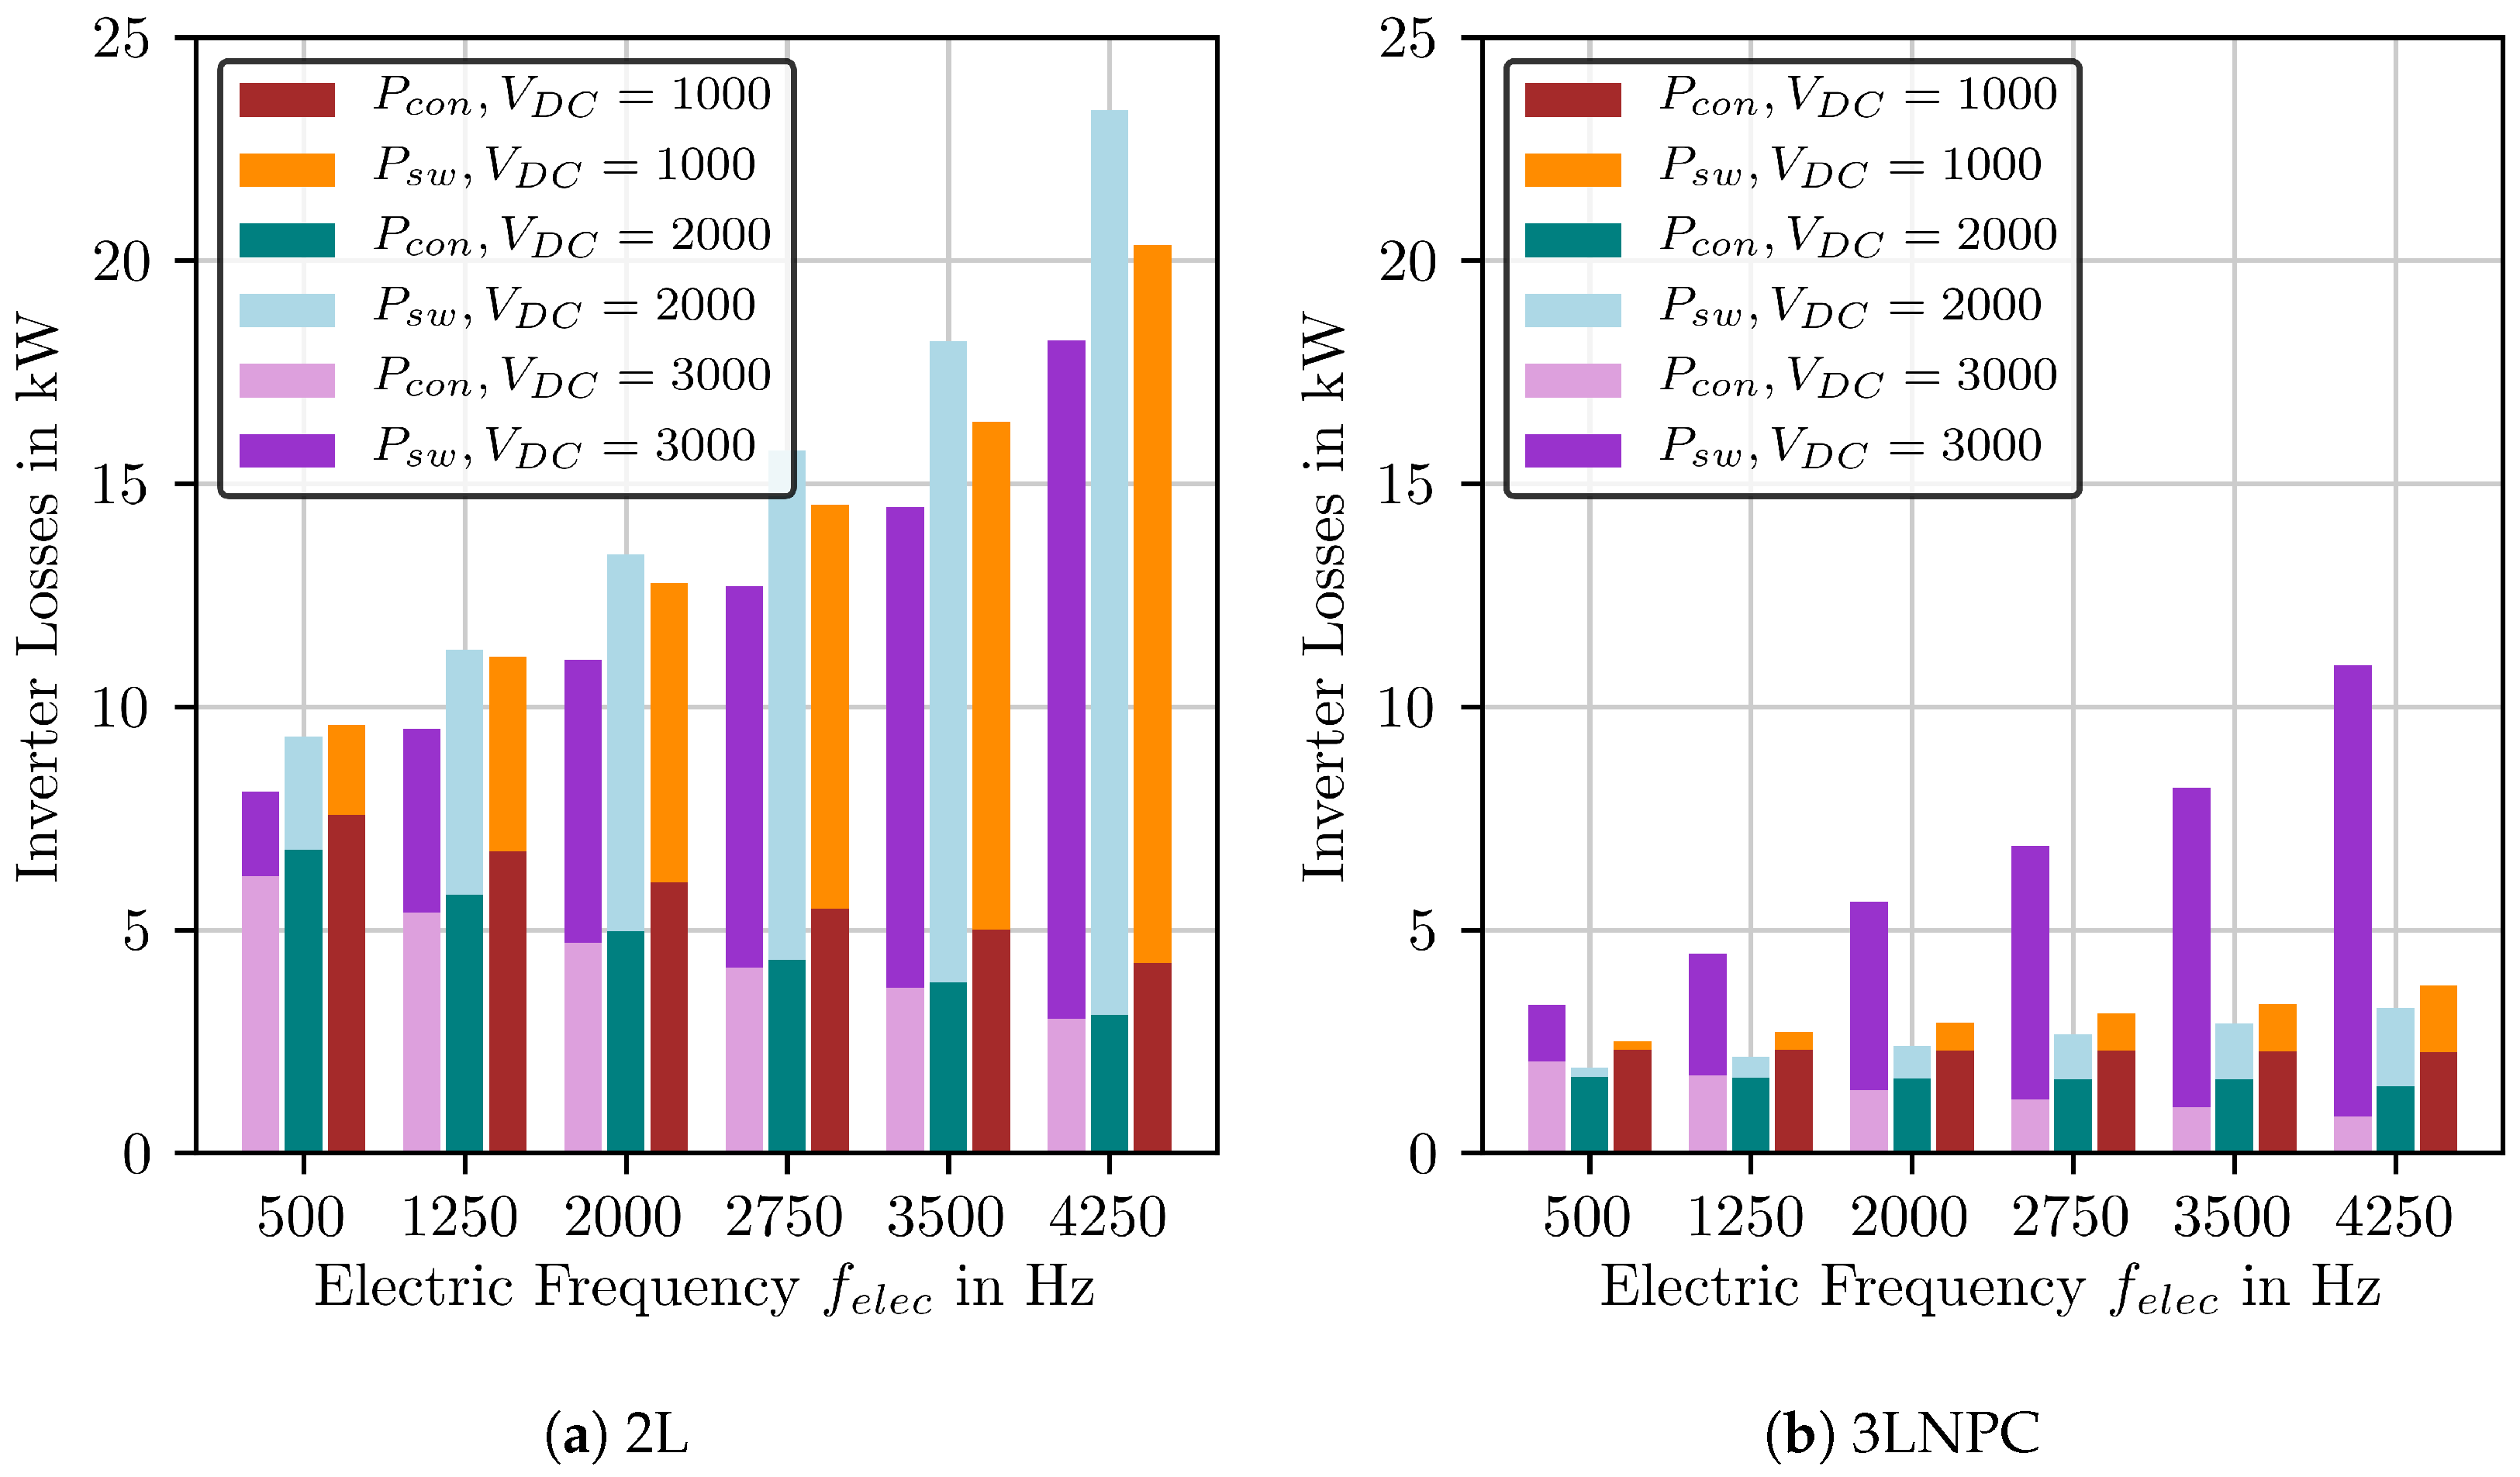
4.3. Power Electronics

In Figure 9a the combined mass and efficiency for four 2.5 MW inverters for different topologies are shown for a voltage of V D C = 3 kV. A power factor of cos( ϕ ) ≈ 0.75 was assumed as this is roughly the power factor that can be found for the best machine designs. The best power densities of about 60 kVA/kg at efficiencies of 99% could be realized with 3LNPC designs that dominate the 2L and other multi-level topologies. However, one has to keep in mind that particular advantages of the other 3L topologies and the 5LSMC topology such as low current ripple (low THD) and the reduction of passive elements are not considered in our model which potentially could reduce the gap in power density.
Adding the corresponding heat exchanger with γ = 0.5 kg/kW (▼) and 2.0 kg/kW (■), respectively, gives the results in Figure 9b. In this figure only the 2L (blue), 3LNPC (orange) and 5LSMC (red) topologies are shown. The effect is similar for all topologies: Designs with lower efficiencies are penalized, wherefore they are shifted to higher masses (i.e., to the right on the x-axis). This leads to a breakdown of the initial pareto-fronts and one design (essentially the most efficient) become the distinct, best design as the heat exchanger largely outweighs the inverter.
The influence of the voltage on mass and efficiency of the inverter is shown in Figure 10a,b, respectively. Each point in the plot represents the best achievable mass or efficiency at the given topology and electric frequency (Important remark: If you look, for instance, at the designs with V D C = 1 kV, the 2L- and 5LSMC inverters were not designed at slightly lower and higher voltages but the points are just slightly offset for better visibility.). Several things can be observed:
First, different topologies are advantageous for different voltage levels. Although 3LNPC designs are the lightest for voltages below roughly V D C = 2.3 kV, 2L designs are advantageous for higher voltages. This is visible not only for the mass but in particular for the efficiency. This behavior can be attributed to the choice of modules in the design: Due to the topology, 2L designs require modules with a higher blocking voltage. At the required blocking voltage Si-IGBTs have a higher current rating compared to SiC-MOSFETs (due to higher maturity of the technology). Thus, only Si-IGBT modules can be used to realize a 2L design at the required power level. Meanwhile, the 3LNPC-topology-based designs are realized with SiC-MOSFETs that are lighter and more efficient. At higher voltages also 3LNPC designs require Si-IGBT modules so that in this case the simplicity of the 2L topology gives these designs a weight advantage. This can also be observed for the efficiencies which are better for 3LNPC designs that have more efficient modules.
Secondly, the electric frequency plays an important role for the weight but even more so for the efficiency. For designs with 3LNPC- and 5LSMC-topology, designs with lower frequencies are not necessary lighter for voltages V D C < 2.3 kV (like in the case of 2L designs). For voltages V D C > 2.3 kV all designs see the same correlation between frequency and mass (higher frequency leads to higher mass). This correlation is in particular true for the efficiency: Higher frequencies lead to lower efficiency which can be attributed to higher switching losses in the power modules as shown in Figure 11 for 2L and 3LNPC designs for different voltages.
Consequently, adding the heat exchanger into the picture, results in a dramatic weight increase for designs with high frequencies as can be in Figure 12a,b for the 2L- and 3LNPC topologies, respectively. Depending on the heat-exchanger, it can outweigh the inverter itself easily by a factor of three to ten. In particular, for the 3LNPC topology the influence of the voltage is huge once the heat-exchanger is taken into account as with the change of modules the efficiency is reduced and therefore the weight penalty by the heat-exchanger mass drastically increases. Also, the negative effect on mass for higher frequencies is increased.
Consequently, on system level two interesting trade-offs arise: First, a trade-off concerning the electric frequency between the electric machine and the inverter. The electric machine prefers higher frequencies for being lightweight while for the inverter the opposite holds true. Secondly, a trade-off concerning the DC-link voltage between the inverter and the DC power cable. The lightest inverter designs (i.e., designs based on 3LNPC topology) see a sharp increase in weight for V D C > 2.3 kV.
As the power electronics for motor and generator have similar boundary conditions, the results given above apply for both the inverters of the EPU and the rectifier for the GenSet.
For comparison: In the cryogenic case, the lightest inverter designs were achieved with 2L-topologies at power densities of about 100 kVA/kg and efficiencies of 99.3%. However, the most efficient designs were realized with the 3LNPC-topology with efficiencies of up to 99.8% however at much lower power densities of about 20 kVA/kg.

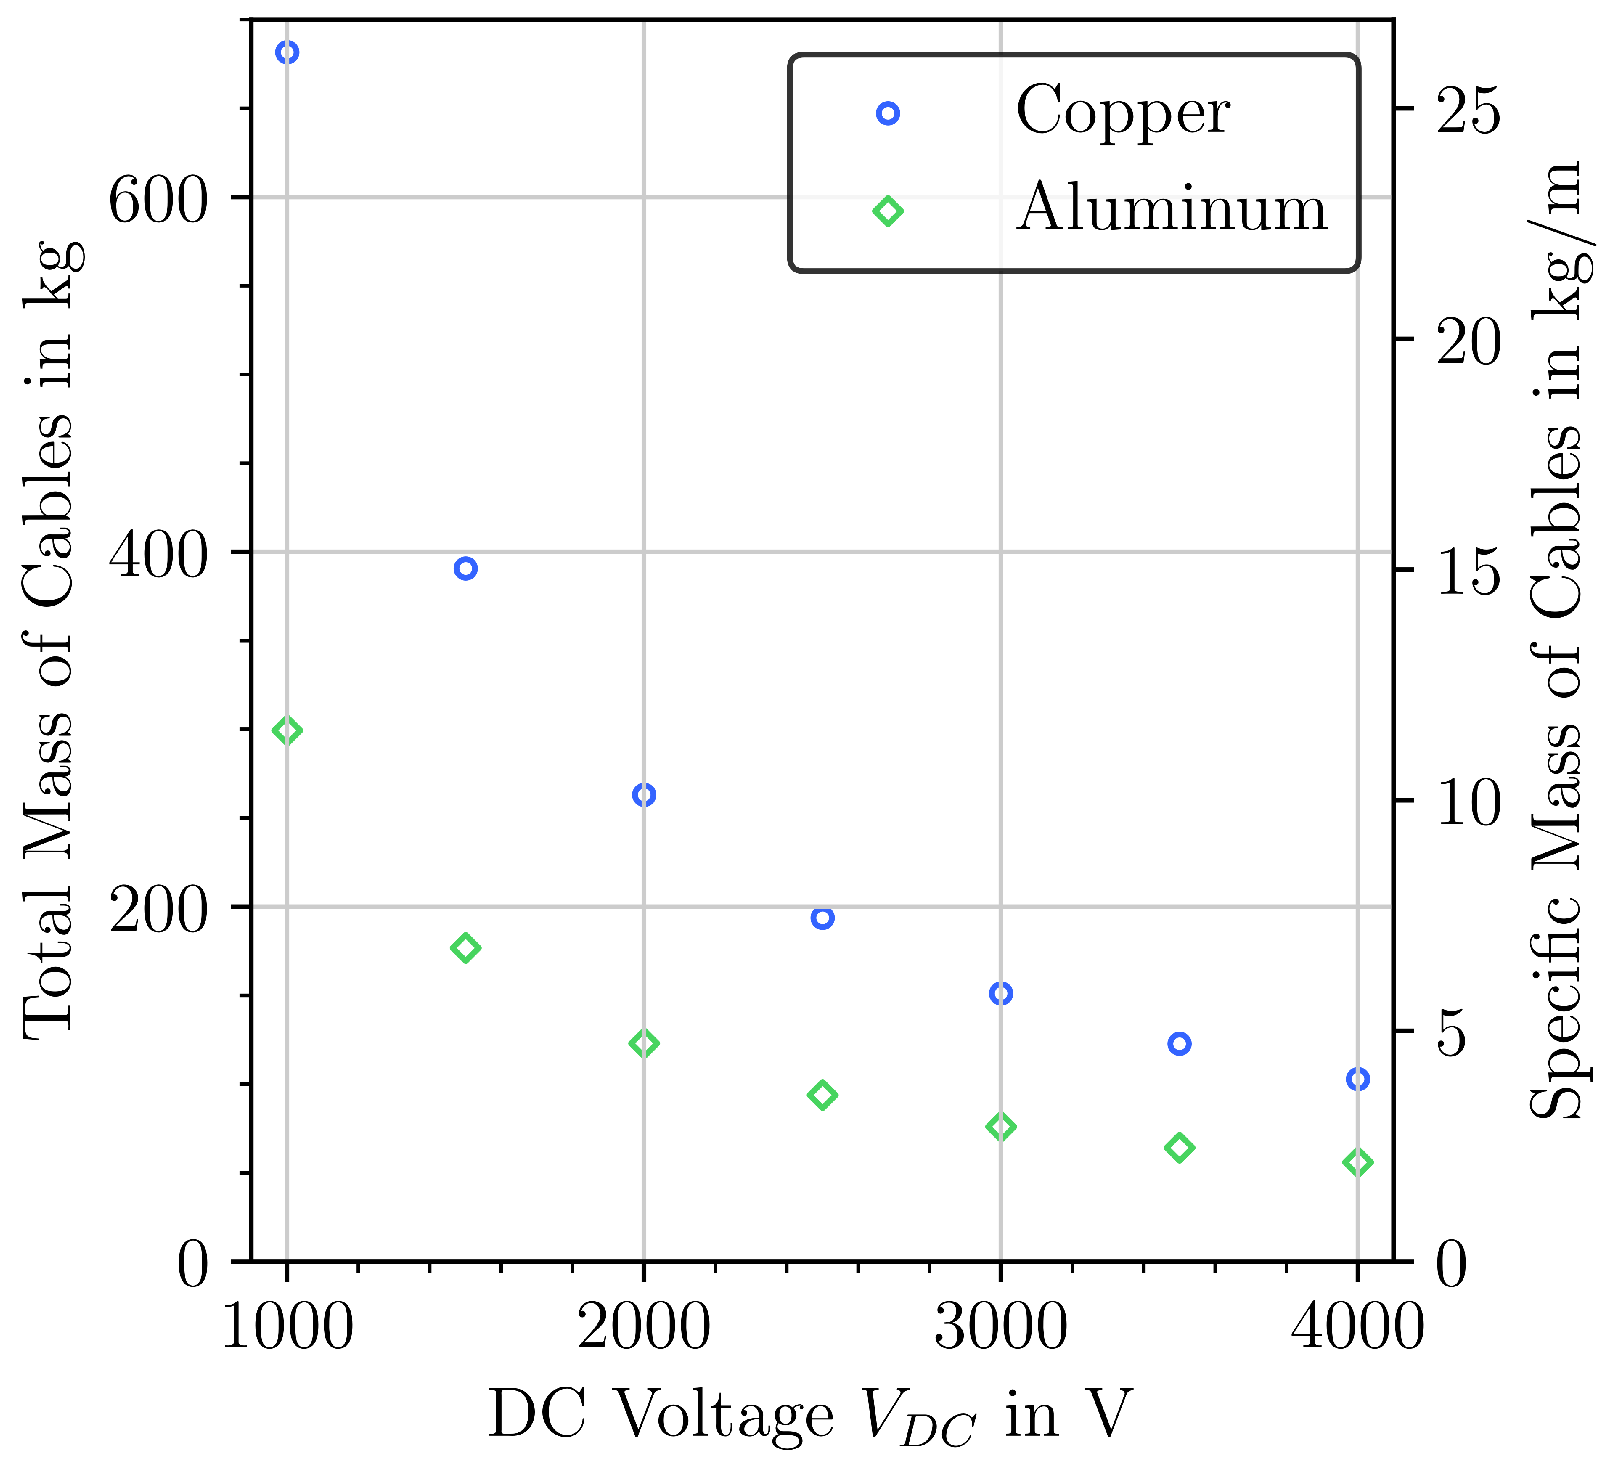
4.4. DC Power Cables

The specific mass (weight per length) and the total mass for DC power cables as a function of the DC voltage is shown in Figure 13 for both copper and aluminum cables. The plot is generated for a cable with a power of P = 10 MW divided into four lanes of 2.5 MW each and a length of l c a b l e = 26 m. The cable has the strongest mass-voltage dependence which leads to trade-offs, for instance, with the inverter as discussed previously. A mass advantage can be recognized in the case of aluminum cables for all voltages. Aluminum has a three times lower density than copper, but the electric conductivity is only slightly worse. Thus, the lower electric conductivity is overcompensated by the lower density. In addition, the lower electrical conductivity of aluminum requires larger cable cross sections to conduct the same current at the same ohmic losses. Consequently, aluminum cables have the disadvantage of lower volumetric current densities. In contrast, the resulting larger surface of the cable allows better cooling of the aluminum cables. Since installation effects are not considered in this study, only aluminum cables are regarded for the optimization of the entire electric system. Furthermore, the cable installation periphery (for example cable holders or hermetic encapsulation) is not included in the mass. This would add further mass to the weight of the cable as proposed in [37].
The best values for the specific mass (i.e., at 4 kV), which are around 3 kg/m, appear to be comparable to what is achievable with superconducting cables. Since this might sound astonishing, a closer look at the relevant quantities makes it more plausible. Dividing the 10 MW lane into 4 parallel lanes gives a power of 2.5 MW per lane. With a voltage of 4 kV the current is roughly 620 A. According to the model, at a maximum allowable temperature of 180 °C at the conductor center, the conductor has a diameter of 16 mm and the insulation a thickness of 2 mm. This gives a current density of roughly 5.0 A/mm 2 through the conductor which is well-established for air-cooled cables [37]. This effect can mainly be attributed to the large temperature spread between the cable environment (55 °C) and the conductor (180 °C); hence allowing for good cooling.

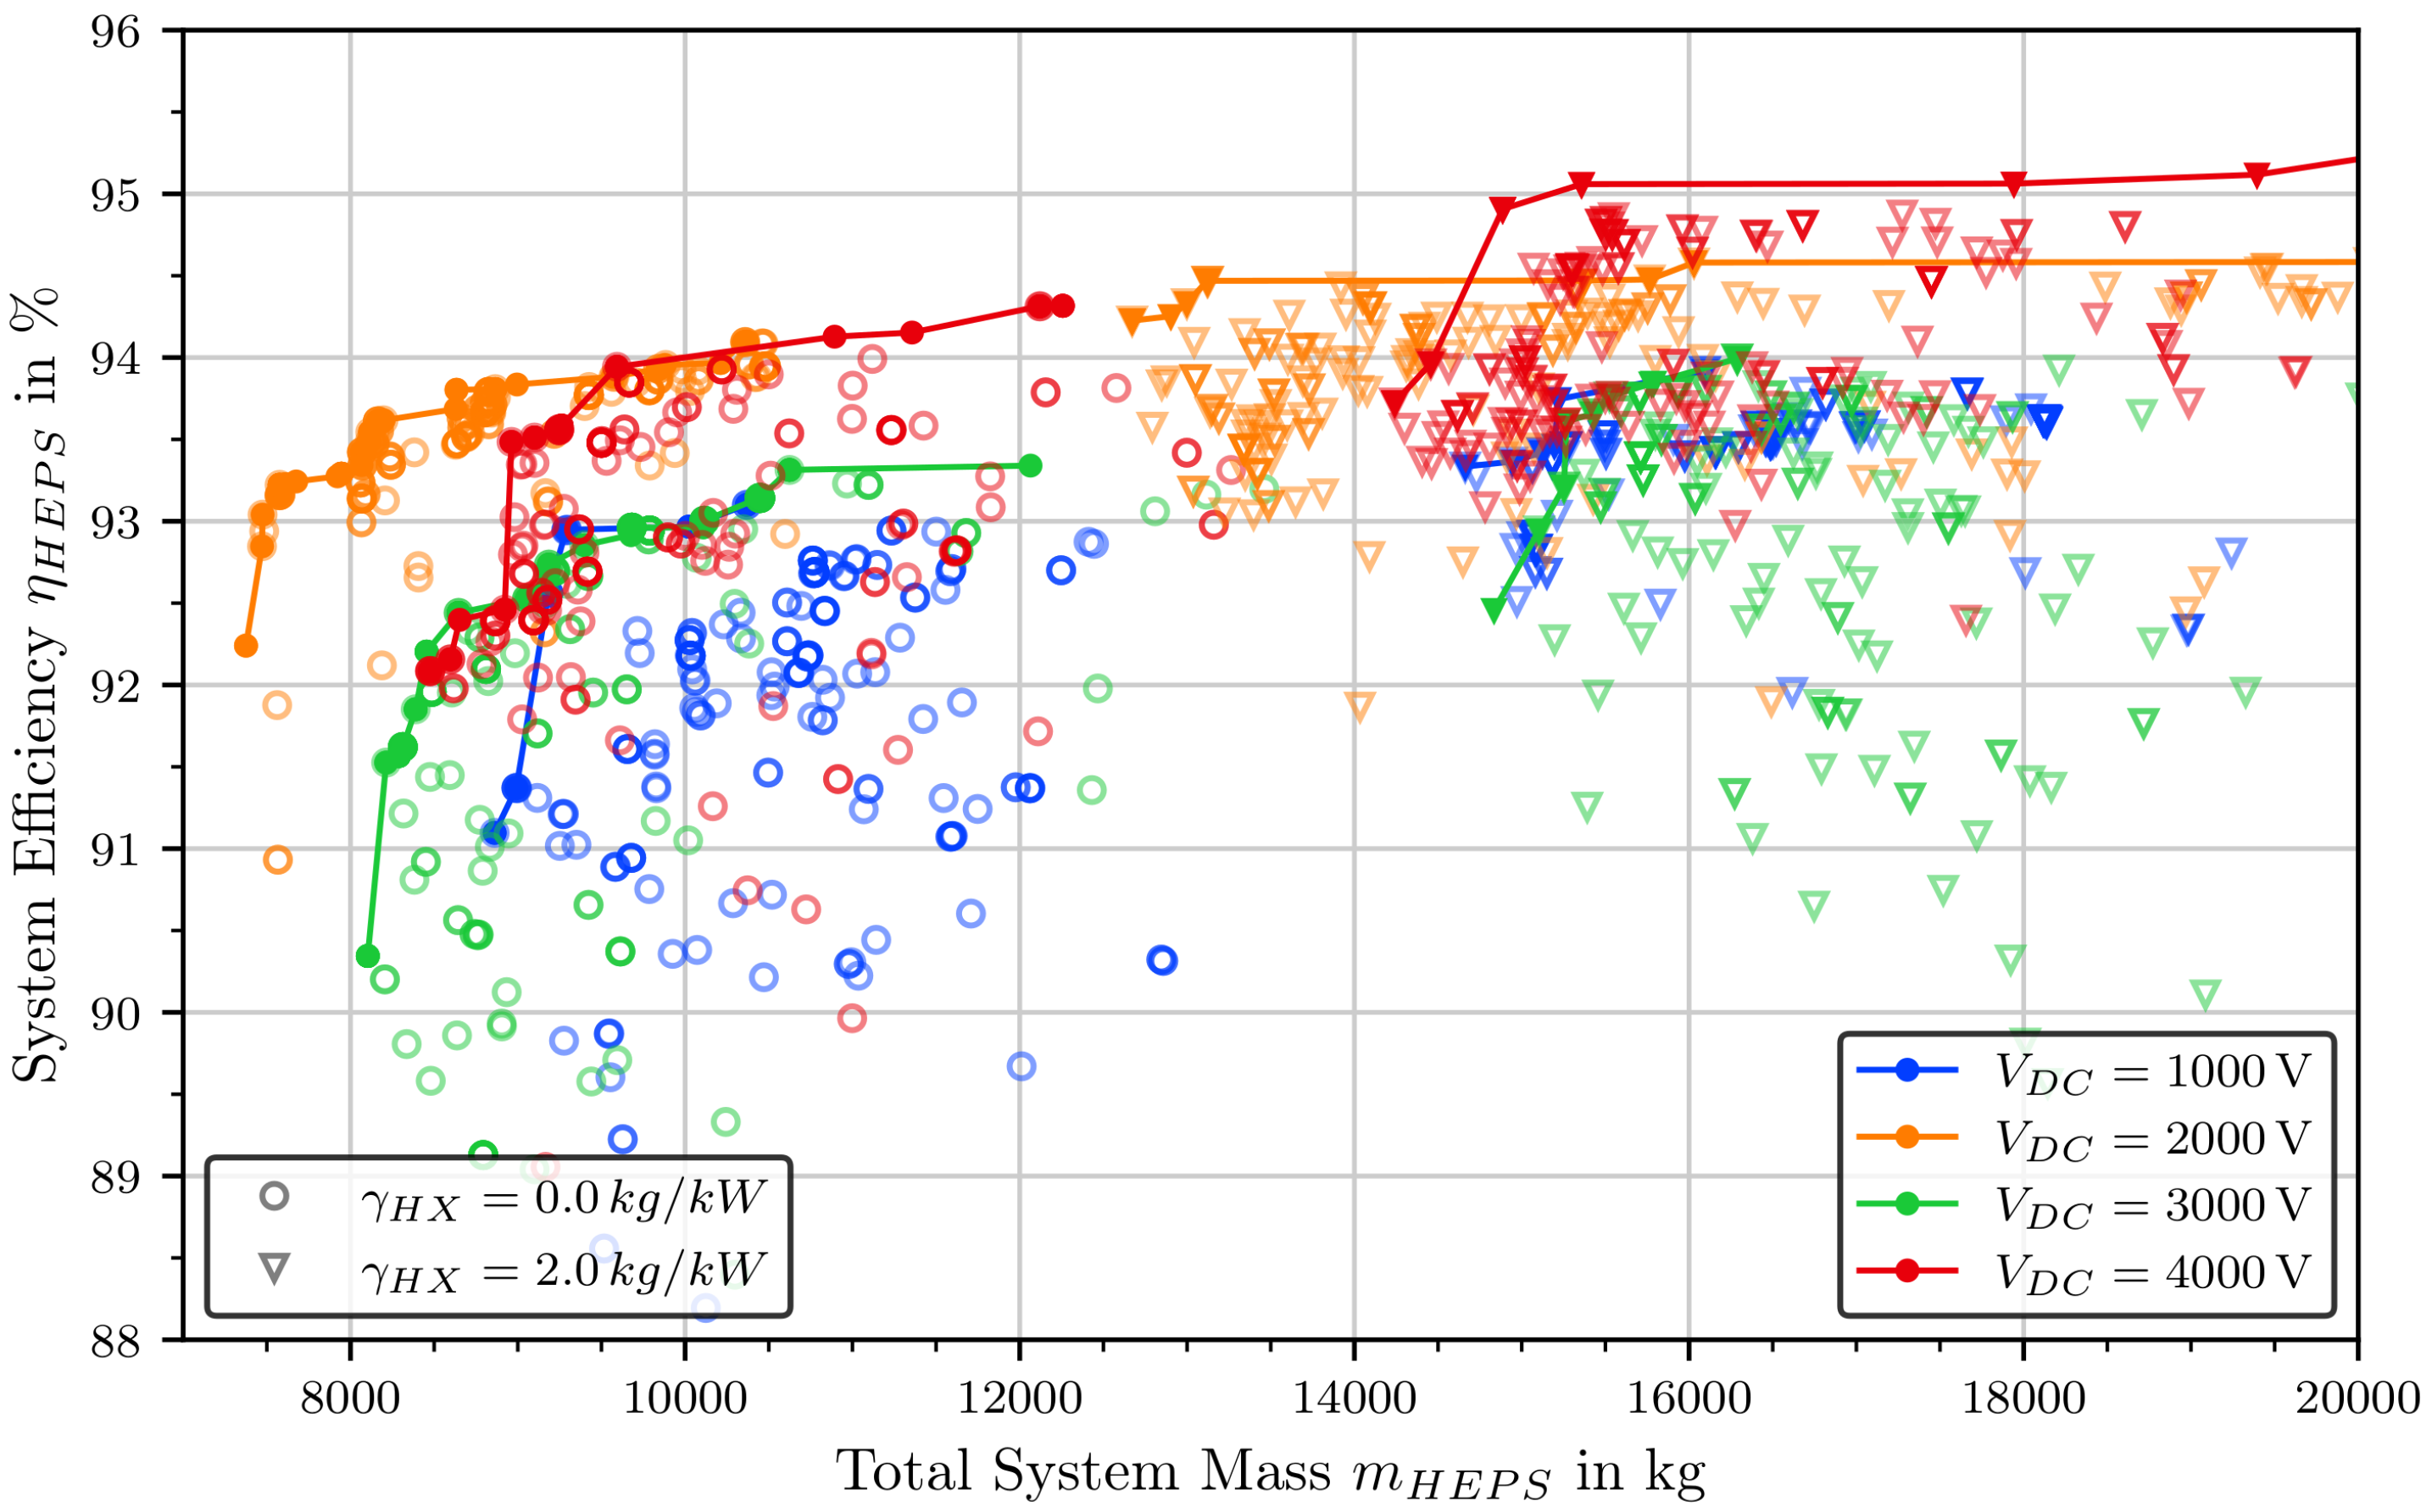
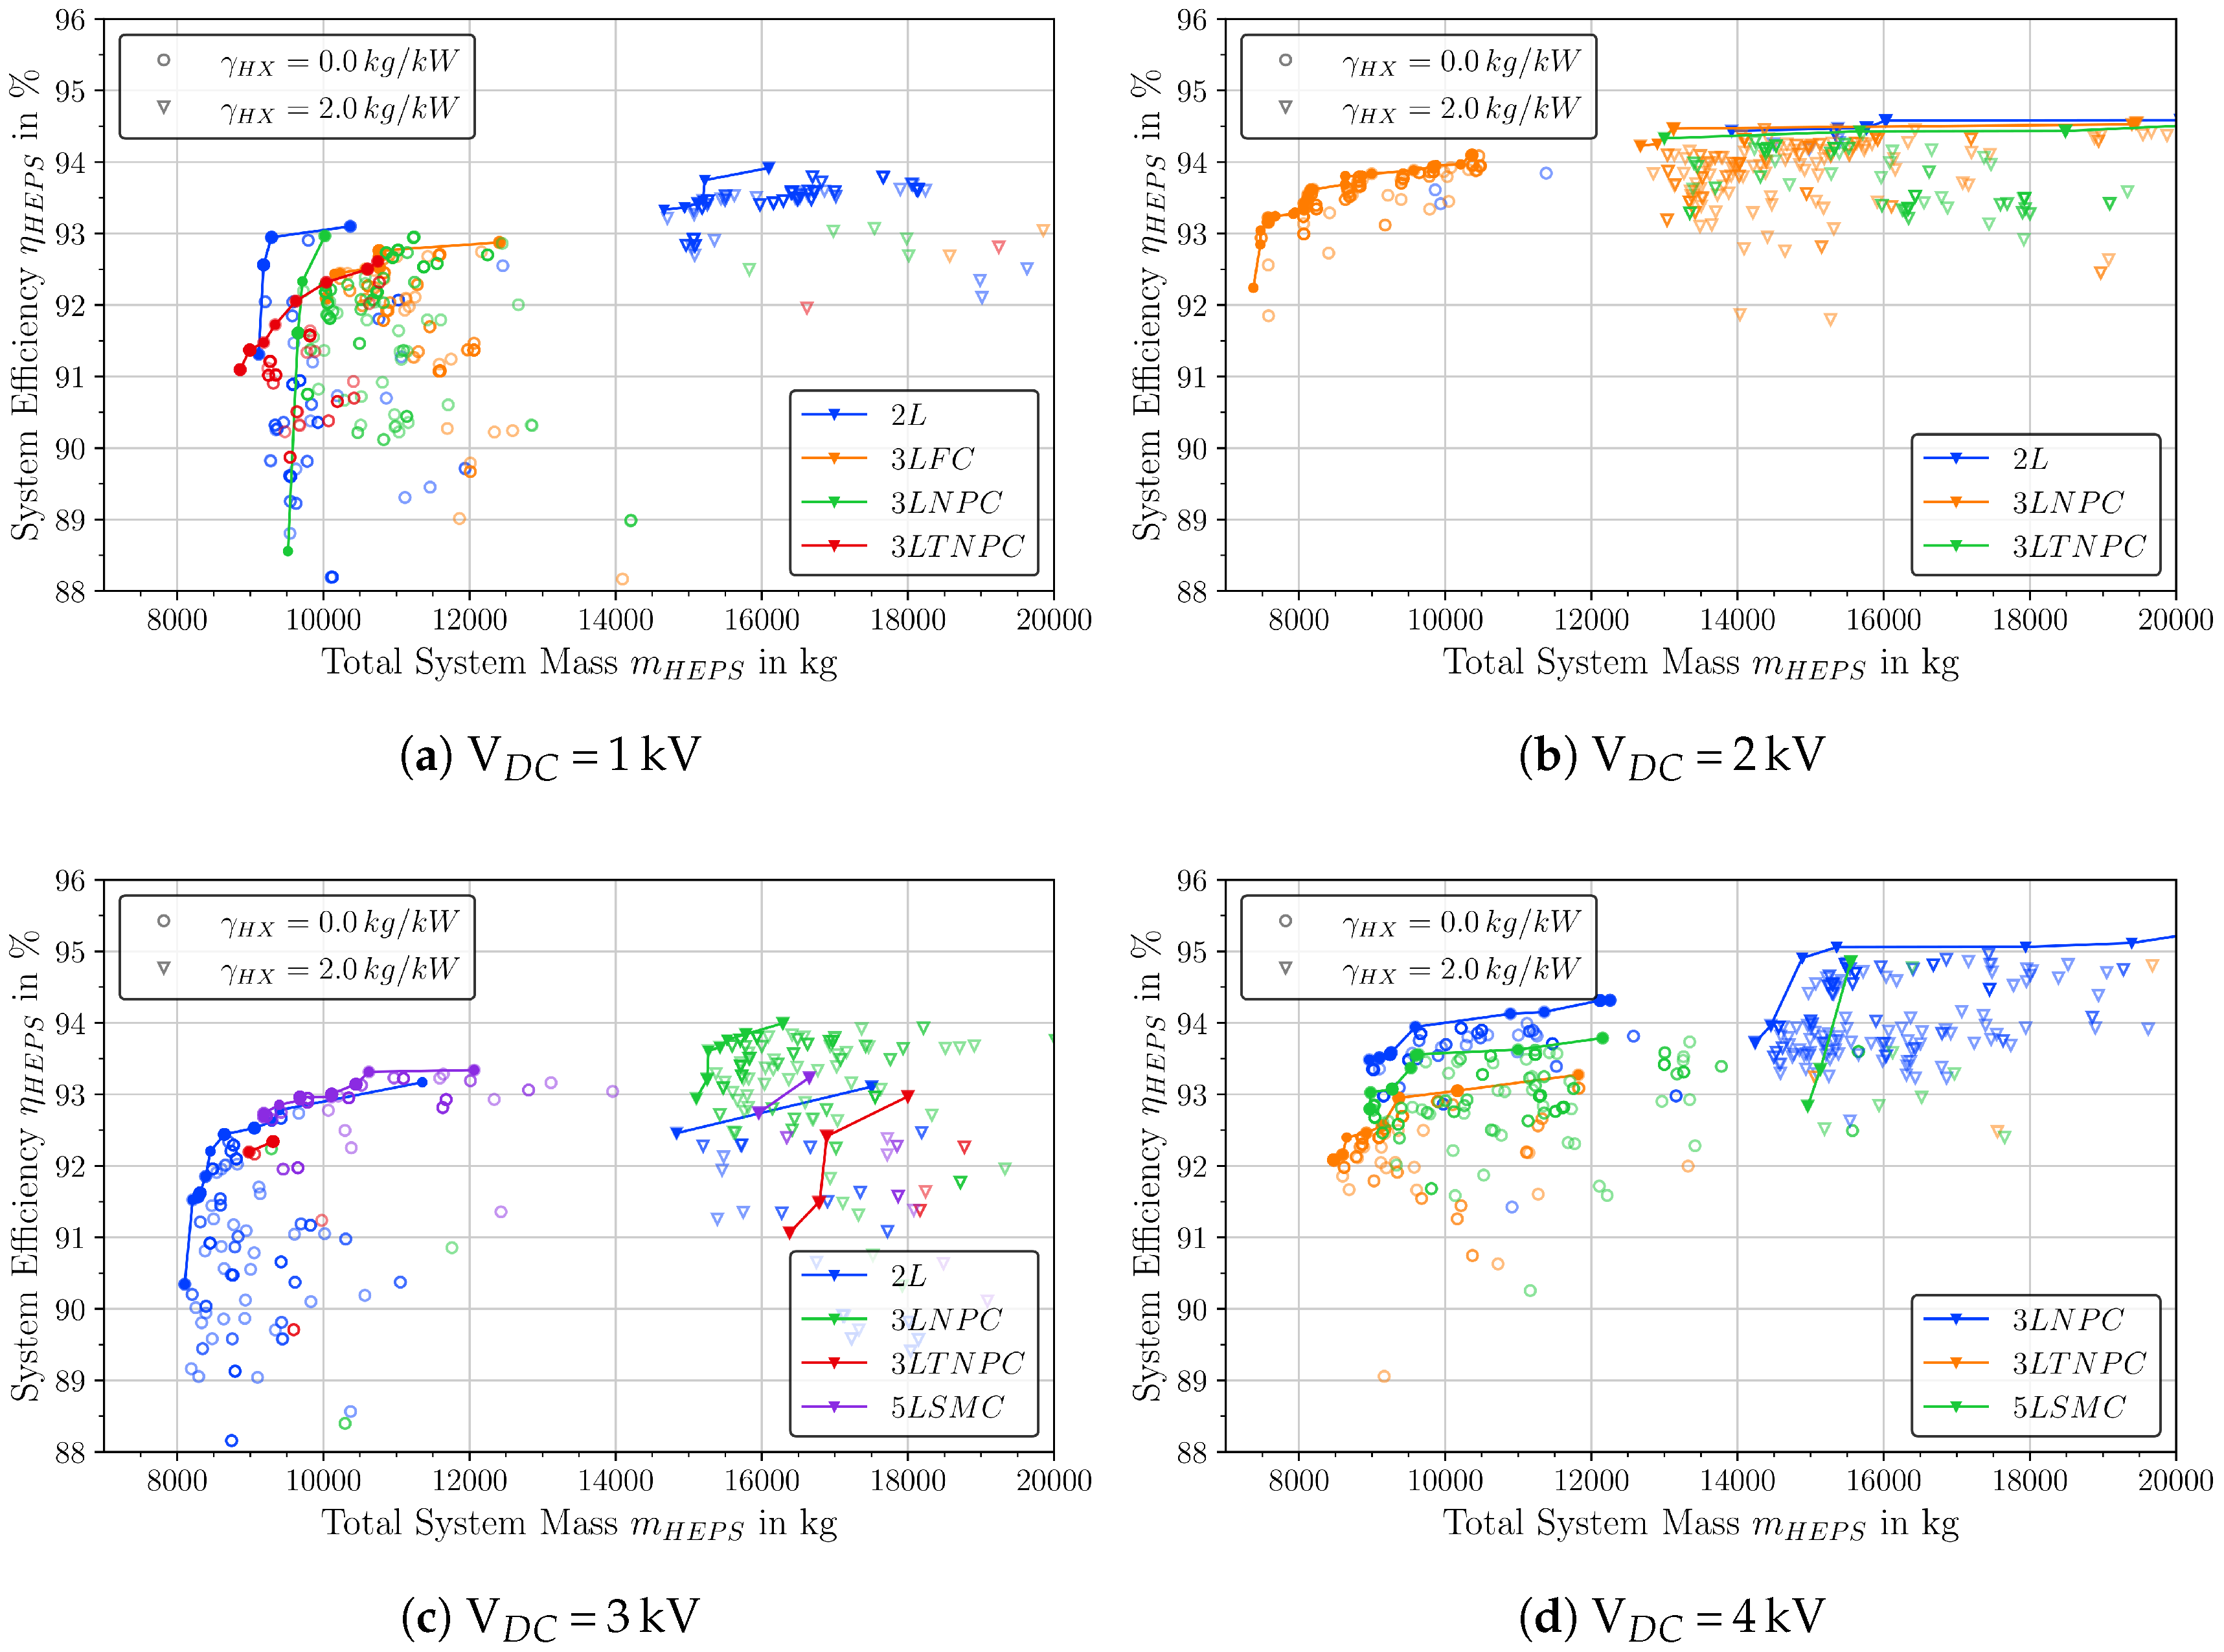
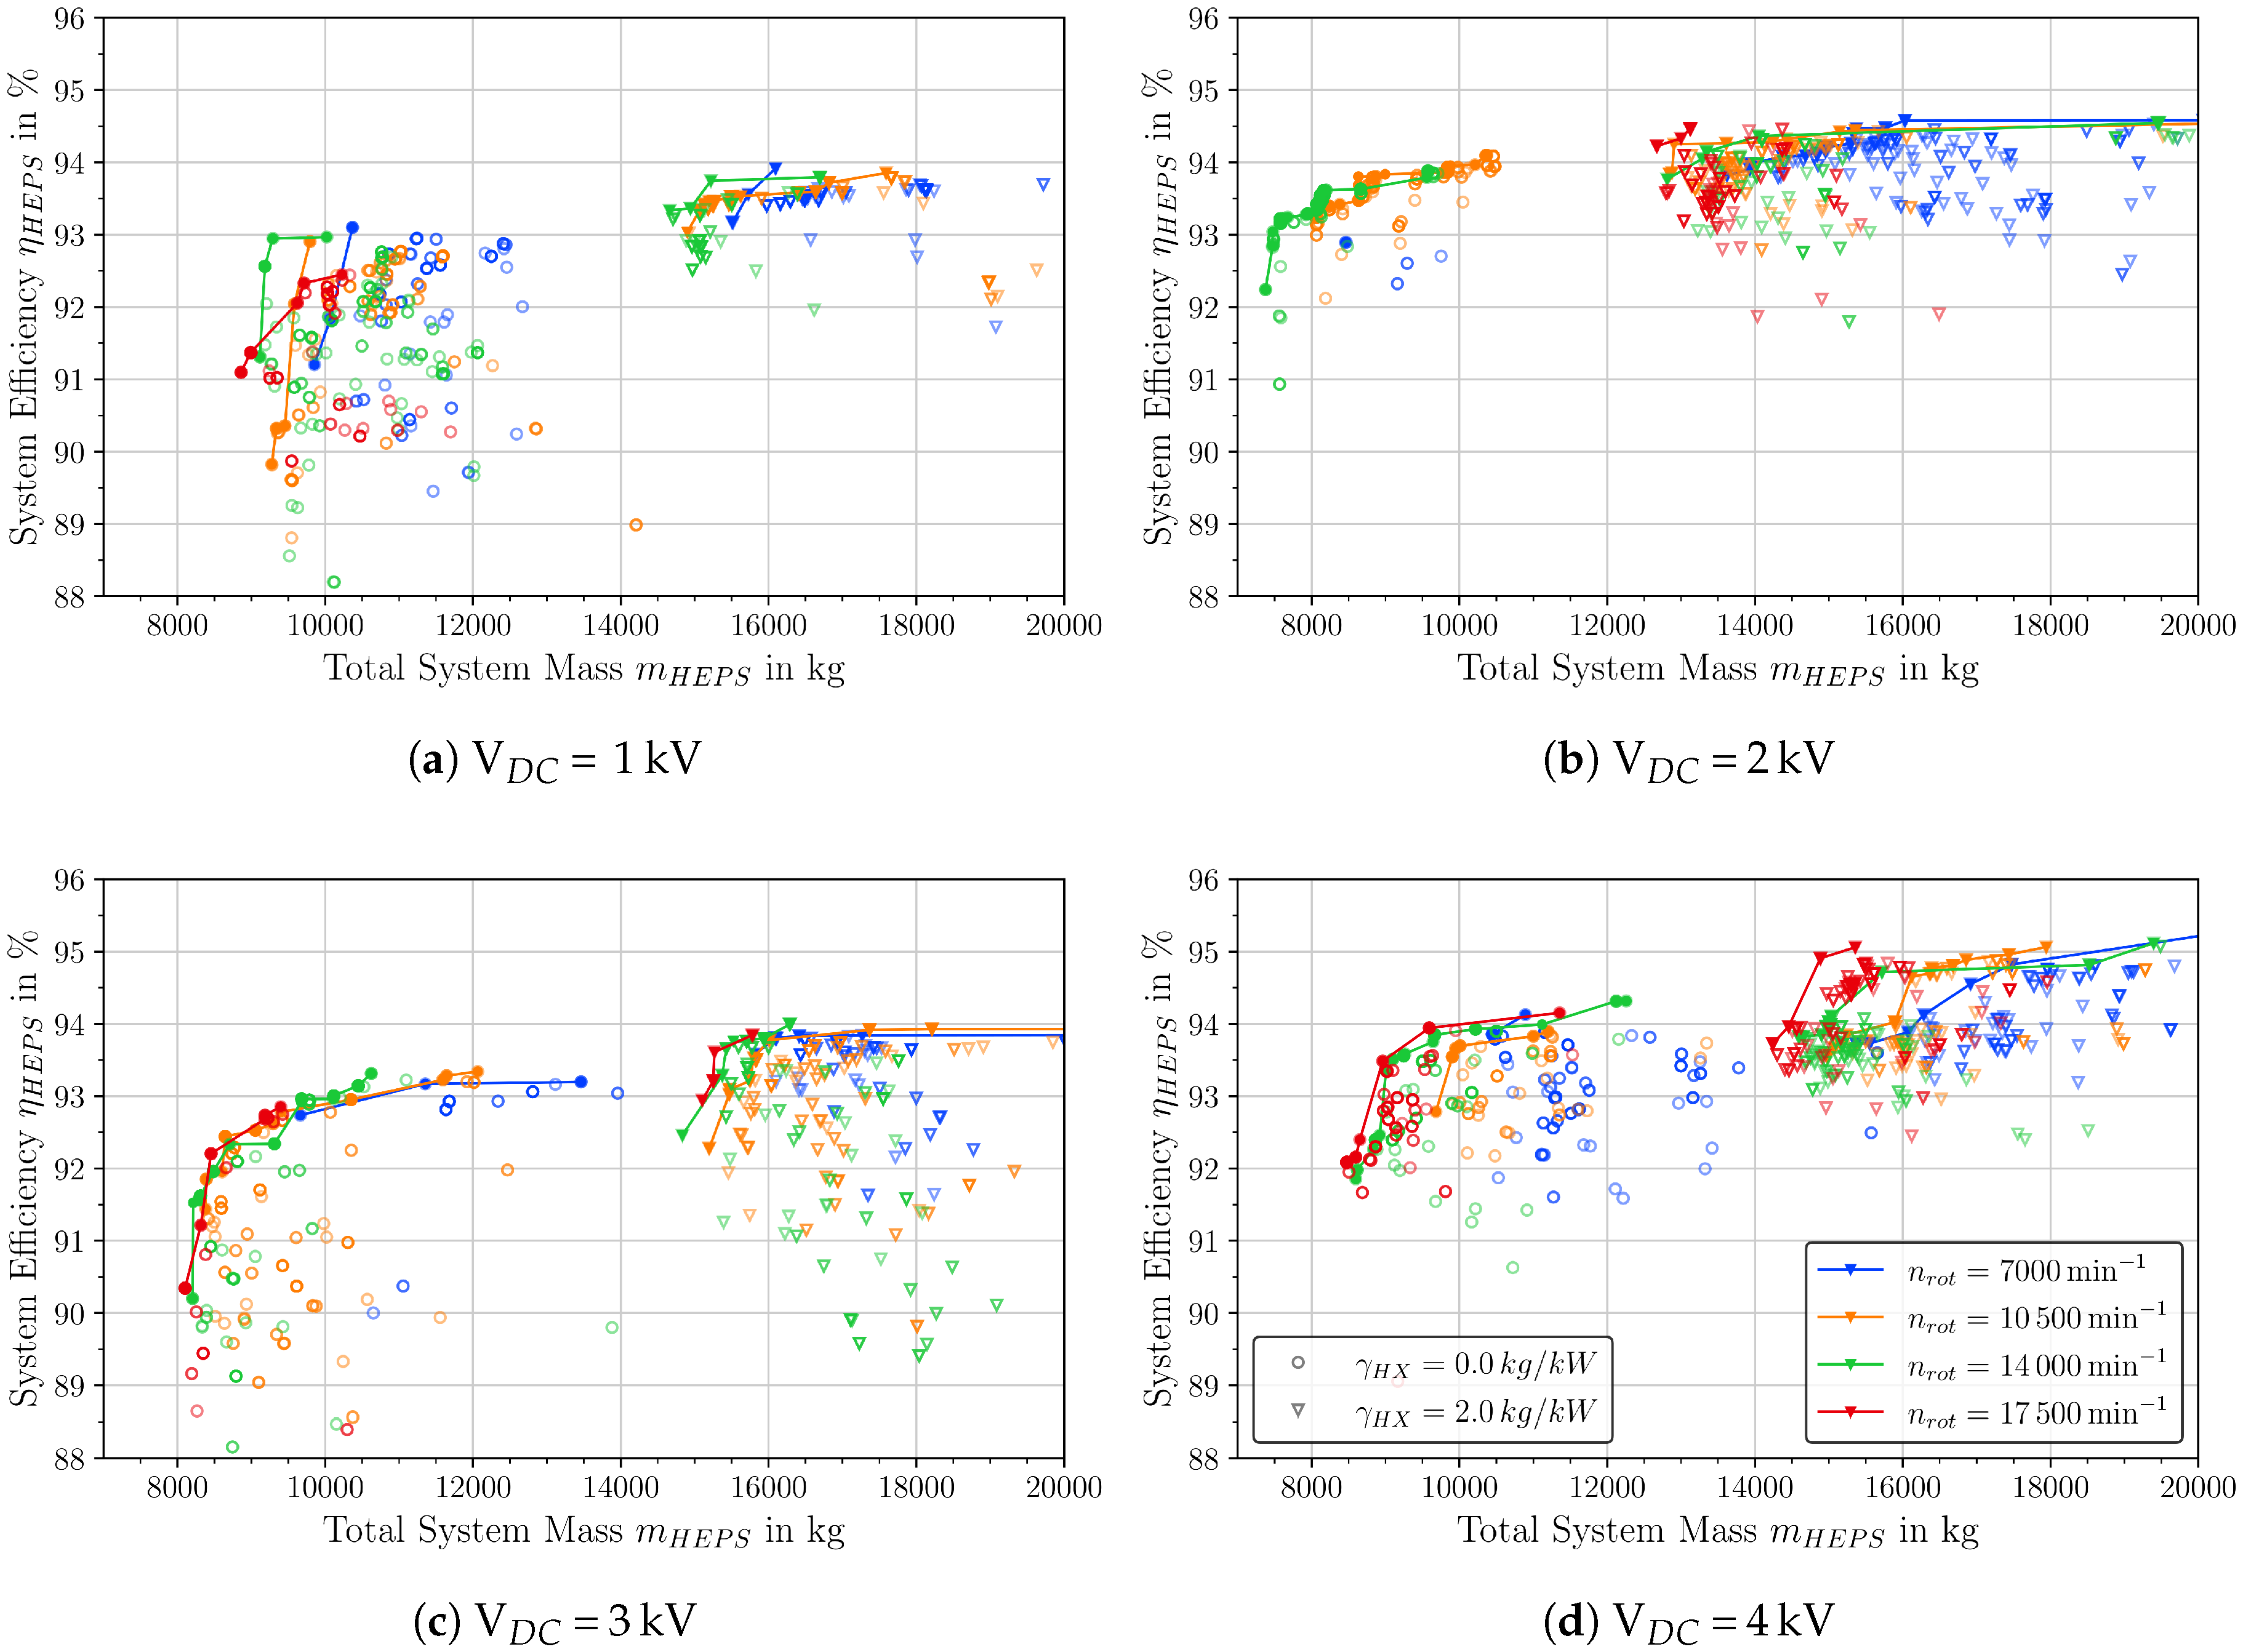
4.5. Complete Electric Propulsion System

The mass versus efficiency dependence for the complete system can be seen in Figure 14 for a system voltage of 1 kV, 2 kV, 3 kV and 4 kV with and without including the heat-exchanger. The lowest system masses for the electric components only (i.e., heat exchangers are not included) are roughly 7400 kg to 9000 kg at efficiencies of 91% to 94.4%. Including the heat-exchanger results into a significant change in mass. Assuming a very light heat exchanger ( γ H X = 0.5 kg/kW) the system weight is increased by up to 1.5 t. When using more conservative assumptions ( γ H X = 2.0 kg/kW), the contribution of the heat-exchanger mass is larger than the contribution of any other component as can be seen in Figure 15. It can contribute up to 40% to the total system mass. With and without heat-exchanger, the heaviest configurations can be found for DC-link voltages of V D C = 1 kV and the lightest configurations can be found for V D C = 2 kV. For V D C = 1 kV, the contribution of the cables is pronounced, whereas for voltages V D C 3 kV the lack of availability of high current modules for the inverter leads to heavier configurations.
Looking at the particular components, it can be seen that the preferred topology of the inverter depends on the voltage level: In Figure 16a the number of solutions of the last generation of the optimization for different topologies and voltages is shown. The 3LNPC topology is dominant for V D C = 2 kV and V D C = 4 kV, whereas for V D C = 1 kV and V D C = 3 kV, the 2L-topology dominates. Inverters with 5LSMC-topology can be found only for higher voltages V D C 3 kV. This result is in good correspondence with Figure 10a (voltage dependence of inverter mass). Also, the heat-exchanger has an influence on the choice of inverter topology as can be seen in Figure 16b: Without heat-exchanger, all topologies can be found within the design space and the 3LNPC-topology is dominant; with a light heat-exchanger ( γ H X = 0.5 kW/kg), the 3LFC-topology is eliminated and the 2L-topology is slightly favored over the 3L-topology, while with γ H X = 2.0 kW/kg, the 3LNPC-topology is dominant and there are no designs with 5LSMC-topology. The dominating solutions also provide the lightest designs as can be seen in Figure 17: Here the mass versus efficiency dependence is shown for different inverter topologies and voltages with and without heat-exchanger. For V D C = 1 kV, designs with 2L-inverters provide the lightest solutions, while for V D C = 2 kV and V D C = 4 kV the 3LNPC-topology yields the lightest results. An interesting case is V D C = 3 kV, where a 2L-topology or 5LSMC-topology is optimal if the heat-exchanger is not taken into account but a 2L-topology or 3LNPC-topology give the best results if the heat-exchanger accounts for the finite efficiencies.
Also in the case of the motor, the heat-exchanger has a high influence on the result: In Figure 16c the number of solutions of the last generation of the optimization for different motor rotation speeds n r o t and heat-exchanger assumptions is shown. With higher heat-exchanger mass, there is a tendency towards lower rotation speeds of the motor. The lightest solutions are found for n r o t = 10,500 min 1 , 14,000 min 1 and 17,500 min 1 . However, as can be seen in Figure 18, still gear ratios of 4 and 5 provide the lightest solutions with and without heat-exchanger. It is somewhat counterintuitive that system designs with n r o t = 17,500 min 1 (for instance in the case of V D C = 4 kV) are lighter and more efficient than solutions with n r o t = 10,500 min 1 and n r o t = 14,000 min 1 . This could indicate that the losses for high-speed machines are underestimated by the analytical models and must be analyzed in more detail.
The dependency of the system weight on the electric frequency is shown in Figure 19 for different voltages and heat-exchanger assumptions. Without a heat-exchanger, the mass gains saturate at around f e l 3 kHz. If the heat-exchanger is taken into account, higher losses by higher electric frequencies are penalized and therefore designs with f e l 3 kHz are heavier. The optimal range appears to be within 1.5 kHz f e l 3 kHz where the mass dependency is low. However, effects like faster aging of insulation or inverter modules with higher frequencies are not taken into account. Such effects would favor lower frequencies.
At last, we would like to state that the electric machines for the optimal system designs have a rather low D/L ratio of 0.4 to 0.5. This can certainly be a challenge for rotor dynamics: In a first approximation the first critical frequency of a rotor can be calculated as n c r i t = c 2 π m , where c is the effective stiffness of the rotor (including the bearing system) and m is its mass. A D/L ratio of 0.5 means that the rotor is twice as long as thick resulting in its inherent stiffness being low. With lower stiffness the critical frequencies shift towards lower values, usually below the operation speed. In this case, the critical frequency must be passed quickly through ramp up which in turn requires a complex bearing system (e.g., dampers). Furthermore, this can limit the allowable speed operation range for the motor as sufficient safety margins away from critical frequencies are required to avoid resonance damage.
In Table 2 an overview of the main component parameters for the lightest system with η s y s > 93% is given. For comparison: The lightest cryogenic configuration had a weight of roughly 8 t and an efficiency of 99.8%. It has no gearbox and the weight of liquid hydrogen and its tank contribute roughly 20% to the total system mass.

4.6. Single Component Optimization Versus System Optimization

An interesting question that came up during the investigation was: Do pareto-optimal designs for each single component produce an optimal system if these are combined? We want to present some findings on this issue by comparing the motor designs from the system optimization and the single component optimization results. In Figure 20a the mass vs. efficiency dependency for the electric motor is shown for different cases: (a) If the motor is optimized alone; (b) If the whole system is optimized with and without heat-exchanger. One can see the designs that are optimal for the system do not belong to the pareto-optimal designs of the motor optimization. This trend is even more pronounced if the same data is plotted in mass vs. power factor coordinates as shown in Figure 20b. Lighter solutions with low power factor are rejected during the system optimization. The lower power factor in the case where the heat-exchanger is included can be understood as a consequence of the lower efficiency penalty, i.e., designs with higher power factor are rejected in favor of designs with higher efficiency. This result is a good evidence to the necessity of an initial system optimization ahead of the detailed optimization of single components.

5. Discussion of Results

In this paper, we presented a detailed analysis on the sizing of a non-cryogenic turbo-electric propulsion drive train based on a A321XLR reference aircraft with the aim of a direct comparison to a full cryogenic turbo-electric propulsion drive train. Our analysis is based on bottom-up analytical models that take into account relevant physical effects on component level. The optimization of the system was performed by a specifically designed multi-objective genetic algorithm. Our key findings for a non-cryogenic turbo-electric propulsion system are:
  • The lowest weight for a turbo-electric propulsion system without cryogenic components could be around 9.9 t to 12.9 t with efficiencies in the range between 92% to 94%. This weight includes the gearbox, electric machines, inverters, cables and heat exchangers. Not included are the propulsors, the gas turbines, protection devices and the battery.
  • Optimal DC-link voltages are in the range of V D C = 2 kV. This result is mainly driven by a trade-off between the cable masses and the usable modules for the inverters.
  • Optimal electric frequencies are in the range 1.5 kHz ≤ f e l ≤ 3.0 kHz. Optimal power factors for electric machines are around 0.7 to 0.8.
  • Designs with gearbox tend to be the lighter than direct drive solutions with n r o t = 3500 min 1 . Optimal gear ratios appear to be from 3 to 5, i.e., motor rotation speeds from n r o t = 10,500 min 1 to n r o t = 17,500 min 1 are favorable.
  • The choice of optimal inverter topology depends strongly on the DC-link voltage. For V D C = 2 kV and V D C = 4 kV, the optimal choice is 3LNPC, while for V D C = 1 kV and V D C = 3 kV, a 2L-topology is the better choice. 5LSMC can be advantageous for V D C = 3 kV to achieve higher efficiencies.
  • The heat exchanger can contribute a large proportion of the system weight (up to 40%) and have an impact on the optimal choice of inverter modules and motor rotation speed.
  • Optimal designs for single components do not yield necessary the best designs for an optimal system.
Comparing the results for a fully cryogenic turbo-electric power train from [8] and a non-cryogenic turbo-electric power train, as presented in this paper, we can draw the following conclusions:
  • The weight advantage of a cryogenic electric propulsion system to a non-cryogenic electric propulsion system is roughly 1.5 t to 3.5 t depending on the assumption for the heat-exchanger. In terms of power density this would be an increase from 3.1 kW/kg to 4.8 kW/kg. The efficiency of the cryogenic system can be better by 6% to 8%. In a configuration with batteries, this would give the cryogenic system an additional weight advantage over the non-cryogenic system.
  • Comparing the power-to-weight ratio of both the CEPS and TEPS designs to the power-to-weight ratio of the state-of-the-art turbofan drive train (which is about 8 kW/kg), it is obvious that both solutions perform worse concerning power density. This is not surprising, since the turbo-electric drive train configuration acts as an electric transmission between the gas turbine and the fan, simply adding more components to the drivetrain and reducing its efficiency. Thus, advantages can only be leveraged if batteries are added as a highly efficient boost power source for take-off (and taxi) and/or the aircraft architecture is redesigned to make use of the new degrees of freedom that a hybrid-electric configuration offers [4,38].
  • A large part of the weight advantage of the cryogenic system does not come solely from lighter cables and electric machines but from the cooling systems. Indeed the heat-exchanger including its peripheral systems could significantly outweigh the mass of liquid hydrogen (and the required tanks). For shorter missions even less hydrogen would be required, thus giving an additional weight advantage. Furthermore, liquid hydrogen that would be added to the turbine, could further increase its efficiency by up to 6%. In contrast, a heat-exchanger would produce additional drag of 3% to 5% [39,40]. In principle, a part of the waste heat can be used for fuel pre-heating to avoid these drag losses due to the heat-exchanger. However, the Jet-A1 does not provide sufficient heat-capacity to absorb all the waste heat from the electric components, wherefore the heat-exchanger remains necessary in the non-cryogenic case. Summing up these effects and taking into account the efficiency of the electric system, the cryogenic propulsion system could have an total efficiency advantage of up to 12% to 18%.
  • The optimal DC-link voltages are similar for both non-cryogenic and cryogenic designs. They are around V D C = 2 kV.
  • For the lightest non-cryogenic designs, a gearbox with a gear ratio from 3 to 5 and high electric frequencies up to f e l 3 kHz is required. In the cryogenic case with superconducting components direct drives with electric frequencies f e l 350 Hz yield the best solutions. Here, the strong influence of the AC losses in superconductors limits the frequency to such small values.

6. Conclusions

The general conclusion is that a fully cryogenic drivetrain can have a potential weight and efficiency advantage compared to a non-cryogenic turbo-electric drive train. Nevertheless, the weight advantage is not (as one might expect) a factor of 2 or larger but 10% to 40%. Thus, from a technological point of view, the realization of a turbo-electric short-range aircraft should be possible both with and without cryogenic components.
The choice, of whether to take the cryogenic path or not, is a choice of technological challenges that one would like to tackle: In the case of a cryogenic system, the major challenges to face are the integration of the cooling system and cryogenic piping in the airframe; design and testing of cryogenic power modules and other components for power electronics; and realization of cryogenic stator windings. On the other hand for non-cryogenic systems, challenges come in form of high electric frequencies that enhance the EMI footprint, special high-frequency power modules and high-frequency resistant insulation; rotor dynamics of electric machines with a low D/L ratio; and further in the design and airframe integration of corresponding heat exchangers.
Leaving the technological view aside and coming from a commercial perspective, the weight of the additional turbo-electric drive train is in the same range as the payload of the aircraft (about 25 t). Without a complete aircraft redesign, this would eat up about half of the allowable payload. In a redesigned aircraft (that will be heavier than the current one) replacing a TEPS with a CEPS, would yield a weight reduction of up to 3 t (CEPS compared to TEPS), which corresponds to a payload increase of up to 10%. Also, an efficiency advantage of up to 18% (CEPS compared to TEPS) could correspond to an SFC reduction in the same range. Whether these numbers justify the additional financial efforts of developing and certifying a cryogenic turbo-electric drive train or not, requires further business analysis. Nonetheless, going this way will make sense only in the combination with a specific hybrid-electric aircraft design that can overcompensate the additional mass of the hybrid-electric drive train (compared to a turbofan drive train) by exploiting the new design degrees of freedom offered by hybridization.
To increase the fidelity in the feasibility of turbo-electric drive trains, we suggest extending the analysis to the following topics:
  • Since the heat-exchanger has a significant influence on the total system weight, it is important to include a sizing model for the heat-exchanger. This will lead to interesting trade-offs concerning the inlet/outlet temperature of heat-exchanger and the electric machines and power electronics. Furthermore, the drag losses of the heat-exchanger could be included into the total system efficiency.
  • An important component that was left out so-far during the sizing but is inevitable are protection devices. Analytical sizing models for current-fault limiters and switches must be derived and included into the system sizing.
  • The sizing of the corresponding battery for the Taxi, Take-Off and Climb segments of the mission.
  • A more detailed modeling of the electric machines and inverters for the most interesting designs (e.g., by FE-solvers for electric machines and software-tools like PLECS for power electronics).
  • One important issue that was not looked into was the reliability and fault tolerance of the components, since the component design requires items that have not been built and tested yet. Hence, no reliability and fault tolerance modeling could be done at this point. Once reliability data is available for items that are similar enough to what is required for the designs, a reliability analysis should be included in the design flow.
  • Modeling of the transient system behavior with 1D-transient system analysis tools like SimCenter Amesim or Matlab Simulink.
  • A long-term goal should be a combined sizing loop of aircraft and drivetrain system that should also include a propulsor and turbine sizing model.

Author Contributions

Methodology, S.B.; Resources, P.R.; Supervision, M.N.; Visualization, M.C.; Writing—original draft, M.F.; Writing—review and editing, M.B. All authors have read and agreed to the published version of the manuscript.

Funding

Bundesministerium für Wissenschaft, Forschung und Wirtschaft: 20Y1516C.

Acknowledgments

The authors acknowledge the financial support by the Federal Ministry for Economic Affairs and Energy of Germany in the framework of LuFoV-2 (project number 20Y1516C). We thank Simon Wolfgang Mages, Alexander Zakrzewski and Mabroor Ahmed for discussions. Furthermore, we thank Siemens Digital Industry Solutions for providing support with software.

Conflicts of Interest

The authors declare no conflict of interest.

Abbreviations

Overview of abbreviations and frequently used symbols in this publication.
AbbreviationExplanation
2LTwo-Level inverter topology
3LFCThree-level flying capacitor inverter topology
3LNPCThree-level neutral point clamp inverter topology
3LTNPCThree-level T-type neutral point clamp inverter topology
5LSMCFive-level stacked multicell inverter topology
ACAlternating current
CEPSCryogenic turbo-electric propulsion system
CO 2 Carbon dioxide
CS-25European certification specifications document for large aircraft
DCDirect current
iDoFInternal degrees of freedom
EPUElectric propulsion unit
FEAFinite element analysis
HEPSHybrid-electric propulsion system
IGBTInsulated-gate bipolar transistor
MOSFETMetal–oxide–semiconductor field-effect transistor
PAXPassengers
PLECSPiecewise linear electric current simulation
SFCSpecific fuel consumption
SiCSilicon Carbide
TEPSNon-cryogenic turbo-electric propulsion system
THDTotal harmonic distortion
SymbolExplanation
cos( ϕ )Power factor of electric machine
d i , m a x Maximal allowable diameter for the i-named component [mm]
D r o t Rotor diameter of electric machine [mm]
f e l , i Electric frequency of the i-named component [Hz]
γ H X Weight-to-power ratio of the heat-exchanger [kg/kW]
J r m s Current density in the stator slot [A/mm 2 ]
l i , m a x Maximal allowable length for the i-named component [mm]
L r o t Rotor length of electric machine [mm]
m i Mass of the i-named component [kg]
n r o t Rotation speed at the shaft of electric machines [min 1 ]
n T E Rotation speed at the shaft of the gas turbine [min 1 ]
N p o l e s Number of poles in electric machines
N i Number of initial configurations in population
N g Number of calculated generations
N o Number of breed offspring configurations per generation
N p Number of selected parent configurations per generation
η i Efficiency of the i-named component [%]
P i Electric power of the i-named component [MW]
T i Temperature of the i-named component [°C]
V D C DC-link voltage [kV]

References

  1. Darecki, M.; Edelstenne, C.; Enders, T.; Fernandez, E.; Hartman, P.; Herteman, J.P.; Kerkloh, M.; King, I.; Ky, P.; Mathieu, M.; et al. Flightpath 2050: Europe’s Vision for Aviation: Report of the High Level Group; ACARE: Derby, UK, 2011. [Google Scholar] [CrossRef]
  2. International Air Transport Association. IATA Technology Roadmap; IATAN: Miami, FL, USA, 2013. [Google Scholar]
  3. Felder, J.; Kim, H.; Brown, G. Turboelectric distributed propulsion engine cycle analysis for hybrid-wing-body aircraft. In Proceedings of the 47th AIAA Aerospace Sciences Meeting Including the New Horizons Forum and Aerospace Exposition, Orlando, FL, USA, 5–8 January 2009; p. 1132. [Google Scholar] [CrossRef] [Green Version]
  4. DelRosario, R. A future with hybrid electric propulsion systems: A NASA perspective. In Proceedings of the Turbine Engine Technology Symposium, Dayton, OH, USA, 11 September 2014. [Google Scholar]
  5. Schulz, E. Global Networks, Global Citizens. Global Market Forecast 2018–2037; Airbus: Blagnac, France, 2018. [Google Scholar]
  6. Berg, F.; Palmer, J.; Miller, P.; Dodds, G. HTS system and component targets for a distributed aircraft propulsion system. IEEE Trans. Appl. Supercond. 2017, 27, 1–7. [Google Scholar] [CrossRef]
  7. Wheeler, P. Technology for the more and all electric aircraft of the future. In Proceedings of the 2016 IEEE International Conference on Automatica (ICA-ACCA), Curico, Chile, 19–21 October 2016; pp. 1–5. [Google Scholar] [CrossRef]
  8. Martin, B.; Stefan, B.; Corduan, M.; Filipenko, M.; Matthias, N.; Peter, R.; Pham, Q.H. A Holistic System Approach for Short Range Passenger Aircraft with Cryogenic Propulsion System. Supercond. Sci. Technol. 2020, 33. [Google Scholar] [CrossRef]
  9. AIRBUS S.A.S. A321 Aircraft Characteristics Airport and Maintenance Planning. 2019. Available online: https://www.airbus.com/content/dam/corporate-topics/publications/backgrounders/techdata/aircraft_characteristics/Airbus-Commercial-Aircraft-AC-A321.pdf (accessed on 13 September 2019).
  10. Pratt & Whitney. Geared Turbofan Commercial Engines; Pratt & Whitney: East Hartford, CT, USA, 2019. [Google Scholar]
  11. Greatrix, D.R. Turboprop and Turboshaft Engines. In Powered Flight; Springer: Berlin, Germany, 2012; pp. 269–289. [Google Scholar]
  12. EASA. Certification Specifications for Large Aeroplanes, CS-25, 2009; EASA: Cologne, Germany, 2009.
  13. Hsieh, M.F.; Hsu, Y.C. A Generalized Magnetic Circuit Modeling Approach for Design of Surface Permanent-Magnet Machines. IEEE Trans. Ind. Electron. 2012, 59, 779–792. [Google Scholar] [CrossRef]
  14. Krug, D. Vergleichende Untersuchungen von Mehrpunkt-Schaltungstopologien mit zentralem Gleich-Spannungszwischenkreis für Mittelspannungsanwendungen. [Comparison of Medium-Voltage Multilevel Converters with Central DC Link, Chapter 3]. Ph.D. Thesis, TU Dresden, Dresden, Germany, 2016. (In German). [Google Scholar]
  15. Biser, S.; Wortmann, G.; Ruppert, S.; Filipenko, M.; Noe, M.; Boll, M. Predesign Considerations for the DC Link Voltage Level of the CENTRELINE Fuselage Fan Drive Unit. Aerospace 2019, 12, 126. [Google Scholar] [CrossRef] [Green Version]
  16. Cao, W.; Mecrow, B.C.; Atkinson, G.J.; Bennett, J.W.; Atkinson, D.J. Overview of Electric Motor Technologies Used for More Electric Aircraft (MEA). IEEE Trans. Ind. Electron. 2012, 59, 3523–3531. [Google Scholar] [CrossRef]
  17. Golovanov, D.; Papini, L.; Gerada, D.; Xu, Z.; Gerada, C. Multidomain optimization of High-Power-Density PM Electrical Machines for System Architecture Selection. IEEE Trans. Ind. Electron. 2018, 65, 5302–5312. [Google Scholar] [CrossRef]
  18. Sorong, H.; Jian, L.; Leonardi, F.; Lipo, T. A general approach to sizing and power density equations for comparison of electrical machines. IEEE Trans. Ind. Electron. 1998, 34, 92–97. [Google Scholar] [CrossRef] [Green Version]
  19. Siemens PLM Software Inc. Simcenter SPEED: PC-BDC 13.06 User’s Manual; SIEMENS: Plano, TX, USA, 2018. [Google Scholar]
  20. Boresi, A.P.; Schmidt, R.J. Advanced Mechanics of Materials, 6th ed.; Wiley: New York, NY, USA, 2003. [Google Scholar]
  21. Eslami, M.R. Theory of Elasticity and Thermal Stresses: Explanations, Problems and Solutions; Solid Mechanics and Its Applications; Springer: Dordrecht, The Netherlands, 2013; Volume 197. [Google Scholar]
  22. Verband der TÜ V e.V. AD2000-Merkblatt B 6: Zylinderschalen unter ä u s ¨ s erem Ü berdruck. Available online: https://www.beuth.de/de/technische-regel/ad-2000-merkblatt-b-6/316608794 (accessed on 27 May 2020).
  23. IEC 60664-1:2007. Insulation Coordination for Equipment within Low-Voltage Systems; IEC: Geneva, Switzerland, 2007. [Google Scholar]
  24. Shin Etsu N39UH Nd-Fe-B Magnet Demagnetization Curves at Elevated Temperature. 2016. Available online: http://www.shinetsu-rare-earth-magnet.jp/e/download/N39UHsheet.pdf (accessed on 6 May 2019).
  25. Von Roll Schweiz, A.G. Winding Wires and Litz Wires. 2019. Available online: https://www.vonroll.com/userfiles/downloads/1576761040530073/2.01.1_Wire_EN.pdf (accessed on 17 January 2020).
  26. 3M Novec 7500 Engineered Fluid Product Information. 2018. Available online: https://multimedia.3m.com/mws/media/65496O/3mtm-novectm-7500-engineered-fluid.pdf (accessed on 7 May 2019).
  27. KISSSoft AG. KissSys. 2019. Available online: https://www.kisssoft.ch/english/products/kisssys.php (accessed on 7 May 2019).
  28. Zakrzewski, A. Gearbox Model for Hybrid-Electric Propulsion Systems. Master’s Thesis, University of Stuttgart, Stuttgart, Germany, 2019. [Google Scholar]
  29. Akturk, A.; Wilkins, R.; McGarrity, J.; Gersey, B. Single event effects in Si and SiC power MOSFETs due to terrestrial neutrons. IEEE Trans. Nucl. Sci. 2016, 64, 529–535. [Google Scholar] [CrossRef]
  30. Krug, D.; Bernet, S.; Fazel, S.S.; Jalili, K.; Malinowski, M. Comparison of 2.3-kV Medium-Voltage Multilevel Converters for Industrial Medium-Voltage Drives. IEEE Trans. Ind. Electron. 2007, 54, 2979–2992. [Google Scholar] [CrossRef]
  31. Ilgevicius, A. Analytical and Numerical Analysis and Simulaiton of Heat Transfer in Electrical Conductors and Fuses. Ph.D. Thesis, Universität der Bundeswehr München, Munich, Germany, 2014. [Google Scholar]
  32. Chapmann, J.W.; Schulo, S.L.; Nitzsche, M.P. Development of a Thermal Management System for Electrified Aircraft. In Proceedings of the AIAA Scitech 2020 Forum, Orlando, FL, USA, 6–10 January 2020. [Google Scholar] [CrossRef]
  33. Konak, A.; Coit, D.W.; Smith, A.E. Multi-Objective Optimization Using Genetic Algorithms: A Tutorial. Reliab. Eng. Syst. Saf. 2006, 91, 992–1007. [Google Scholar] [CrossRef]
  34. Fonseca, C.; Fleming, P. Multiobjective optimization and multiple constrainthandling with evolutionary algorithms. I. A unified formulation. IEEE Trans. Syst. Man Cybern. Part A (Syst. Hum.) 1998, 28, 26–37. [Google Scholar] [CrossRef] [Green Version]
  35. Srinivas, N.; Deb, K. Multiobjective Optimization Using Nondominated Sorting in Genetic Algorithms. J. Evol. Comput. 1994, 2, 221–248. [Google Scholar] [CrossRef]
  36. Madonna, V.; Giangrande, P.; Galea, M. Electrical Power Generation in Aircraft: Review, challenges and opportunities. IEEE Trans. Transp. Electrif. 2018, 4, 646–659. [Google Scholar] [CrossRef]
  37. Coroplast Fritz Müller GmbH & Co. KG. Wires and Cables: Complete Product Range for Automotive Applications. 2020. Available online: https://www.coroplast.de/fileadmin//user_upload/Coroplast_Wires_and_Cables_EN.pdf (accessed on 9 March 2020).
  38. Pornet, C.; Gologan, C.; Vratny, P.; Seitz, A.; Schmitz, O.; Isikveren, A.; Hornung, M. Methodology for Sizing and Performance Assessment of Hybrid Energy Aircraft. J. Aircr. 2014, 52, 341–352. [Google Scholar] [CrossRef]
  39. Rodger, D. Key Performance Parameters for Future NATO Hybrid/Electric Military Air Vehicles. In Proceedings of the 31st Congress of the International Council of the Aeronautical Sciences, Belo Horizonte, Brazil, 9–14 September 2018. [Google Scholar]
  40. Rheaume, J.M.; Macdonald, M.; Lents, C.E. Commercial Hybrid Electric Aircraft Thermal Management System Design, Simulation, and Operation Improvements. In Proceedings of the AIAA Propulsion and Energy Forum 2019, Indianapolis, IN, USA, 19–22 August 2019. [Google Scholar] [CrossRef]
Figure 1. (a) Turbo-electric re-equipped aircraft example for requirement derivation. The image is only illustrative as in reality such a generator placement would require substantial changes to the aircraft design (b) Typical power demand during different phases of a mission with a cruise phase of 2500 nm .
Aerospace 07 00107 g001
Figure 2. Schematics of the Turbo-electric propulsion system (TEPS). The losses of the electric components are dissipated into ambient air by corresponding heat exchangers (that are not shown in the scheme).
Aerospace 07 00107 g002
Figure 3. Schematic of the system optimization workflow.
Aerospace 07 00107 g003
Figure 4. Example for functionality of the optimization algorithm: (a) For an electric machine; (b) for a whole TEPS.
Aerospace 07 00107 g004
Figure 5. Mass and efficiency of electric machine designs. (a) distinguished by the current density J r m s ; (b) distinguished by the pole number N p o l e s .
Aerospace 07 00107 g005
Figure 6. (a) Mass vs. efficiency of electric machine designs including the mass of the heat exchanger for different current densities J r m s and different weight-to-power ratios for the heat-exchanger. (b) Mass of a 10 MW motor (), two axially stacked 10 MW motors with the corresponding gearbox () and the latter together with the mass of the corresponding heat-exchanger assuming γ H X = 0.5 kg/kW () and γ H X = 2.0 kg/kW ().
Aerospace 07 00107 g006
Figure 7. (a) Mass and efficiency of designs for an electric machine for different rotation speeds. (b) Combined mass and efficiency for two axially stacked 10 MW motors with the corresponding gearbox.
Aerospace 07 00107 g007
Figure 8. (a) Impact of DC-link voltage V D C on mass and efficiency of electric machines designs. (b) Power factor cos ϕ vs. motor mass for different rotation speeds.
Aerospace 07 00107 g008
Figure 9. (a) Total mass and efficiency of the considered inverter topologies for four 2.5 MW inverters. (b) Combined mass of inverter and corresponding heat-exchanger vs. efficiency.
Aerospace 07 00107 g009
Figure 10. (a) Voltage dependence of mass for 2L, 3LNPC and 5LSMC topology. (b) Voltage dependence of efficiency for 2L, 3LNPC and 5LSMC topology.
Aerospace 07 00107 g010
Figure 11. Distribution of conduction and switching losses for different electric frequencies f e l and DC-link voltages V D C for (a) 2L designs and (b) 3LNPC designs at a power level of P i n v = 2.5 MW.
Aerospace 07 00107 g011
Figure 12. (a) Mass versus DC-link voltage dependence for inverter designs with 2L-topology. The mass includes the inverter and the heat-exchanger with different assumptions for γ H X . (b) Mass versus DC-link voltage dependence for inverter designs with 3LNPC-topology. Please keep in mind that in these plots the shape of the markers represents the assumption on the weight-to-power ratio γ H X and not the topology.
Aerospace 07 00107 g012
Figure 13. The specific mass (right axis) and the mass (left axis) of the DC power cables for different voltage levels. The effect of insulation mass overcompensating the conductor mass only starts above 7 kV to 9 kV (depending on the conductor material).
Aerospace 07 00107 g013
Figure 14. Mass versus efficiency dependency for the whole drive train (gearbox, motors, inverters, cables, rectifiers and generators) shown for different voltages with (▼) and without heat-exchanger (●).
Aerospace 07 00107 g014
Figure 15. Mass breakdown of the lightest system configurations with an efficiency η s y s > 92% for different voltages and assumptions for heat exchangers. The lightest designs can be found for DC-link voltages of V D C = 2 kV in all three cases. The colors of the components are as follows; from top to bottom: Heat-Exchanger: ■ m H X ; Generator: ■ m G e n ; Rectifier: ■ m R e c t ; Cable: ■ m C a b l e ; Inverter: ■ m I n v ; Motor: ■ m M o t o r ; Gearbox: ■ m G B .
Aerospace 07 00107 g015
Figure 16. The number of solutions of the last generation of the optimization for different inverter topologies is shown (a) under varying voltages and (b) under varying heat-exchanger assumptions. (c) The number of solutions of the last generation of the optimization for motor rotation speeds is shown under varying heat-exchanger assumptions.
Aerospace 07 00107 g016
Figure 17. Mass versus efficiency dependency for the whole drive train with (▼) and without heat-exchanger (●) for different DC-link voltages. With different colors, pareto-fronts for different inverter topologies are highlighted.
Aerospace 07 00107 g017
Figure 18. Mass vs. Efficiency dependency for the whole drive train with (▼) and without heat-exchanger (●) for different DC-link voltages. With different colors, pareto-fronts for different motor rotation speeds n r o t are highlighted.
Aerospace 07 00107 g018
Figure 19. The dependency of system mass on electric frequency of motor and inverter for various voltages with (▼) and without heat-exchanger (●).
Aerospace 07 00107 g019
Figure 20. Comparison of results for a motor configuration after optimization of a motor only (●) and a system with (■) and without heat-exchanger (▼): (a) Mass vs. efficiency; (b) Mass vs. power factor.
Aerospace 07 00107 g020
Table 1. Requirements and global variables to the system, the EPU and the GenSets.
TypeSymbolUnitRange/Value
V D C V 1000–4000
T a K 218–318
Globalp a , m a x mbar 1013
FL ft 40,000
l C a b l e m 26.0
f e l , E P U Hz 175–4000
P E M MW 10.5
EPUn E M min 1 3500–21,000
d E M , m a x m 0.6
l E M , m a x m 0.9
f e l , g e n Hz 333–4000
P G e n MW 21.0
Genn G e n min 1 10,000
d G e n , m a x m 0.5
l G e n , m a x m 2.0
Table 2. Filtered results for three different assumptions for heat-exchanger and optimal voltage choice. The components belong to systems with an efficiency η S y s > 93% and lowest mass. The efficiencies of the systems appear to be very similar due to the selection of systems with an efficiency of η S y s > 93% instead of selecting the lightest system for each case.
TypeSymbolUnitValueValueValue
Global γ H X kg / kW 0.0 0.5 2.0
V D C V 200020002000
m s y s kg 7610990412,998
η s y s % 93.2 93.1 94.3
Gearbox m G B kg 446606446
η G B % 99.7 99.7 99.7
Motorf e l Hz 233328001750
n E M min 1 17,50014,00017,500
d E M m 0.35 0.39 0.33
l E M m 0.79 0.52 0.74
cos( ϕ ) 0.81 0.71 0.78
m E M kg 440357444
η E M % 98.8 98.7 98.8
InvTopology 3LNPC3LNPC3LTNPC
m I n v kg 414556
η I n v % 98.5 98.3 98.4
Cable m c a b l e kg 323232
η c a b l e % 99.8 99.8 99.8
RectifierTopology 3LNPC3LNPC3LNPC
m R e c t kg 109113 94.9
η R e c t % 97.4 97.4 98.5
Genf e l Hz 216711671000
n E M min 1 10,00010,00010,000
d E M m 0.5 0.45 0.46
l E M m 1.1 1.1 1.1
cos( ϕ ) 0.76 0.81 0.85
m E M kg 120214031638
η E M % 98.8 98.9 99.0
HX m H X kg 0.0 13804560

