Article

A System Dynamics Prediction Model of Airport Environmental Carrying Capacity: Airport Development Mode Planning and Case Study

College of Civil Aviation, Nanjing University of Aeronautics and Astronautics, Nanjing 211100, China
*
Author to whom correspondence should be addressed.
Aerospace 2021, 8(12), 397; https://doi.org/10.3390/aerospace8120397
Submission received: 1 November 2021 / Revised: 8 December 2021 / Accepted: 9 December 2021 / Published: 14 December 2021
(This article belongs to the Collection Air Transportation—Operations and Management)

Abstract

:
Airport environmental carrying capacity (AECC) provides the fundamental conditions for airport development and operation activities. The prediction of AECC is a necessary condition for planning an appropriate development mode for the airport. This paper studies the dynamic prediction method of the AECC to explore the development characteristics of AECC in different airports. Based on the driving force-pressure-state-response (DPSR) framework, the method selects 17 main variables from economic, social, environmental and operational dimensions, and then combines the drawing of causal loop diagrams and the establishment of system flow diagrams to construct the system dynamics (SD) model of AECC. The predicted values of AECC are obtained through SD model simulation and accelerated genetic algorithm projection pursuit (AGA-PP) model calculation. Considering sustainable development needs, different scenarios are set to analyze the appropriate development mode of the airport. The case study of the Pearl River Delta airports resulted in two main conclusions. First, in the same economic zone, different airports with similar aircraft movements have similar development characteristics of AECC. Second, the appropriate development modes for different airports are different, and the appropriate development modes for the airport in different periods are also different. The case study also proves that the AECC prediction based on SD model and AGA-PP model can realize short-term policy formulation and long-term planning for the airport development mode, and provide decision-making support for relevant departments of airport.

1. Introduction

In recent years, the air transportation industry has continued to develop due to its convenient accessibility. However, the rapid development of the air transportation industry has also caused a negative impact on the local society, economy and environment [1]. The increased operating volume of the airport has caused a series of problems such as air pollution, noise impact, carbon emissions, and flight delays [2]. These negative impacts will change the airport’s ability to service aircraft and vehicle operations and hinder the sustainable development of the airport [3]. In order to promote the sustainable development of the airport, scholars have considered the impact of sustainable development elements such as society, economy and environment on the airport [4], carried out research on the evaluation of the airport’s sustainable development and achieved some research results [5,6], but rarely to comprehensively study the development characteristics of the airport from the relationship between operation and economic and social and environmental factors. With the rise of the concept of environmental carrying capacity (ECC), many research fields have expanded the connotation of ECC [7]. Taking the assessment and prediction of ECC as a measure of sustainable development in the field [8]. ECC can comprehensively consider the interaction mechanism between the internal factors and external factors of the environment, and can be used as an effective indicator to measure the level of sustainable development of a region [9]. In order to explore the development characteristics of airport from the relationship between internal and external factors, Airport environmental carrying capacity (AECC) has gradually attracted attention [10].
AECC is an important part of airport sustainable development research, and the changes of AECC have impacts on airport development. The development of the airport is affected by multiple factors, such as economy, society, and environment [11]. AECC has many influencing factors and the relationship between the factors is complicated. Changes in the environment around the airport, as well as changes in the level of urban economic and social development, will all lead to changes in AECC. In order to measure the level of sustainable development of the airport, we explored the key factors that affect the development of the airport. Lili Wan studied the connotation of AECC and the AECC evaluation process based on the accelerated genetic algorithm projection pursuit (AGA-PP) model [12], and the results prove the feasibility of the evaluation process. The AGA-PP model is good at analyzing data characteristics [13] determining the importance of each influencing factor of AECC. In addition, it can calculate multiple factors into a comprehensive index. The comprehensive index represents AECC. The larger the comprehensive index, the greater the airport’s carrying capacity for aircraft operations [14]. Accurate assessment of AECC is the basis for airport stakeholders to plan the scale and mode of airport development.
In order to further study the development trend and characteristics of AECC, and to reasonably plan the development mode appropriate for the airport, this paper mainly studies the prediction method of AECC. In the research related to ECC, domestic and foreign scholars mostly use mature prediction models to study ECC, such as the use of grey models to predict the impact factors of traffic environmental carrying capacity (TECC) [15], and the use of time series models to predict traffic carrying capacity (TCC) [16], using BP neural network models to predict the geological environment carrying capacity (GECC) [17]; however, these models cannot systematically and comprehensively consider the impact of different factors on the ECC and ignore the causal relationship between the influencing factors. System dynamics (SD) theory can analyze and study the system feedback process properly by comprehensively considering the causal relationship between subsystems and different variables, and is suitable for studying the behavior of complex systems over time [18]. The SD model has been successfully applied to the prediction of atmospheric environmental carrying capacity [19] and the evaluation of tourism carrying capacity [20]. In the AECC prediction study, Peng used the logistic regression model to simply predict the AECC, and gave recommendations for the sustainable development of the airport [21]; however, the previous research was in the static prediction of the AECC. The predicted values of the indicators are independent of each other and the study lacked dynamic analysis of the correlation between evaluation indicators. In fact, the development process of the airport is dynamic. AECC will continue to change with changes in the society, economy, environment and operating conditions. Therefore, the dynamic prediction of AECC can better realize the continuous planning and management of the airport development mode.
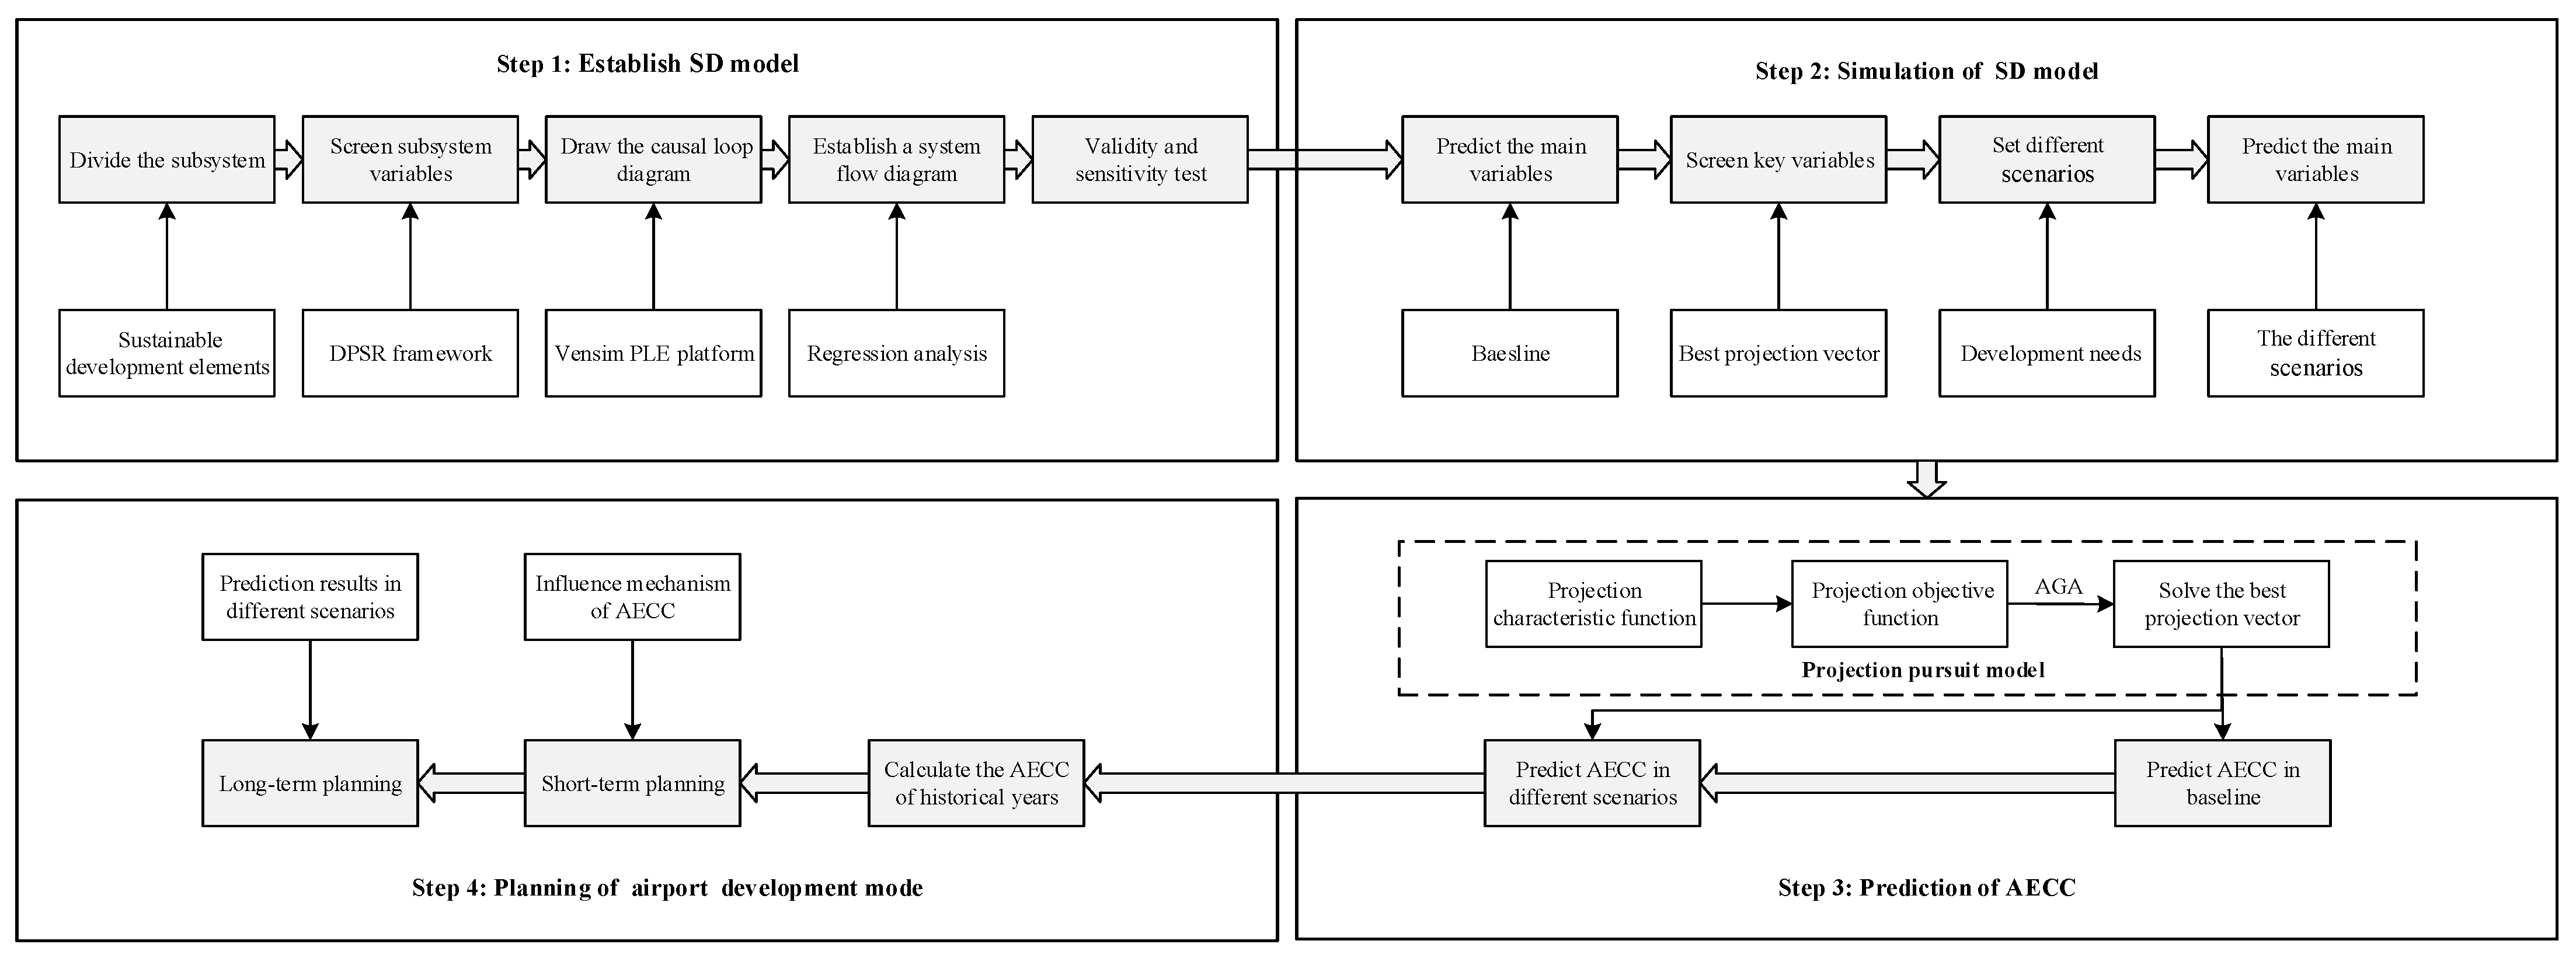
This paper studies the dynamic prediction method of the AECC and its impacts on airport development by constructing an SD model of the AECC and combining it with the AGA-PP model. The content is arranged as follows: Section 2 describes the case study and constructs the SD model of AECC; Section 3 predicts AECC under the current development of the airport; Section 4 predicts the AECC under different scenarios and uses the Pearl River Delta airports as examples to plan the appropriate development mode for Guangzhou Baiyun International Airport (CAN), Shenzhen Baoan International Airport (SZX), and Hong Kong International Airport (HKG), as well as provide a decision-making basis for relevant departments of airport development; Section 5 provides some concluding remarks.

2. Materials and Methods

2.1. Study Area and Data Sources

The Pearl River Delta is located in the south-central part of Guangdong Province, China, with a total area of 55,368 square kilometers. It has obvious geographical advantages and is an important economic center in China. Driven by the development of the regional economy, the civil aviation industry in the Pearl River Delta has developed rapidly, and the number of flights at the airport ranks among the top in China. The development of the regional economy has also benefited from the radiation drive of the development of airports. At present, the economic growth rate of the Pearl River Delta region has slowed down, and the limitations of development have gradually emerged. At the same time. The increasing air traffic flow has caused problems, such as shortage of airspace resources, flight delays, and environmental pollution at large airports in the region, hindering the sustainability of airport development, and affecting regional economic development. Therefore, the coordinated development of regional economy and airport is imperative. It is urgent to study the development characteristics of the AECC and to plan the appropriate development mode of the airport, so as to promote the sustainable development of the airport and the coordinated development between the airport and the region.
The original data are mainly obtained from statistics, such as the Guangzhou statistical yearbook, the Shenzhen statistical yearbook, the Hong Kong statistical yearbook, the Annual Airport Production Bulletin, and the Annual Civil Aviation Development Report from 2008 to 2018. NOx, CO, HC, PM and carbon dioxide pollutant emissions are calculated using the formula in AEDT [22], and the noise level refers to ICAO’s Doc9911 [23].

2.2. Methodology

The AECC prediction method and its impacts on airport development mode planning are based on the system dynamics (SD) model and the accelerated genetic algorithm projection pursuit (AGA-PP) model. The flow chart of methodology is shown in Figure 1.
Step 1: Establish SD model of AECC. Combining sustainable development elements [2], the SD model is divided into social, economic, environmental and operational subsystems, according to the principle of causality of the driving force-pressure-state-response (DPSR) framework, screen the main variables of the subsystem and analyze the feedback relationship between the variables. Then, use the Vensim PLE platform to draw the causal loop diagram, and use the regression analysis method to establish the system flow diagram of the SD model. Finally, the validity and sensitivity of the SD model are tested.
Step 2: Simulation of SD model. Predict the main variables of the SD model under the current development of the airport (baseline), use the projection pursuit model to solve the best projection vector (αj) of the main variables, and determine the key variables based on the ranking of αj and multi-dimensional screening criteria, Combining economic, social, environmental and operational development needs to set up different scenarios. Simulate the SD models in different scenarios to obtain the predicted values of the main variables.
Step 3: Prediction of AECC. According to the predicted values of the main variables of the SD model, the AGA-PP model is used to predict the AECC under baseline and different scenarios. Among them, the calculation steps of the AGA-PP model [12] are: (1) construct the projection characteristic function; (2) construct the projection objective function; (3) combine the accelerated genetic algorithm to solve the optimal projection vector (αj); (4) Calculate the projection characteristic value (AECC) according to the normalized value of the main variable and the αj.

2.3. Establish SD Model of AECC

2.3.1. System Analysis of AECC

The system dynamics (SD) method was created by MIT professor J.W. Forrester. The method is based on feedback control theory and computer simulation technology to carry out related research on complex social, economic, and ecological system issues. The system dynamics method divides the research object into subsystems, and can analyze the feedback interaction process of the subsystems well. Thus, it is suitable for studying the behavior of complex systems over time.
The SD model can analyze the evolution of AECC and predict the main variables in the model. AECC is affected by factors such as economy, society, environment, and operation [12]. According to the integrality and hierarchical characteristics in SD theory, this paper divides AECC into four subsystems: society, economy, environment, and operation. Explore the causal relationship between the operation and the society, economy and environment. According to the system boundary division principle of the SD model, the city where the airport is located is taken as the system boundary of the SD model.

2.3.2. Variable Selection and Causal Loop Diagram Drawing

The SD model contains four subsystems: society, economy, environment, and operation. The subsystems are composed of a first-order feedback loop. The feedback loop is composed of different types of variables. The main variables of the subsystem are screened according to the driving force-pressure-state-response (DPSR) framework [24]. The causal loop diagram reflects the feedback relationship between subsystem variables, and reveals the evolution mechanism of AECC. This paper draws causal loop diagrams based on the Vensim PLE platform. “+” indicates a positive relationship, that is, an increase in one variable will lead to an increase in another variable; “−” is the opposite. The main variable screening and causal loop diagrams analysis are as follows:
  • Social subsystem
    The social subsystem is dominated by humans, and environmental pollution caused by population movement and population activities within the airport area affects the AECC. The causal circuit diagram of this subsystem is shown in Figure 2a. The total population of the city and the urbanization rate are important factors that affect the demand for passenger air transportation [25]. The total urban population is calculated from births and deaths. The auxiliary variables are birth rate and death rate [26]. When the urban population and urbanization rate increase, the more frequent the population movement, the more frequent flights will increase. Air pollutants produced by flights will put pressure on the environment, and, at the same time, the rate of change of air pollutants will have an impact on the rate of population mortality [27]. Therefore, the total urban population (y1) and urbanization rate (y2) are taken as the main variables of the social subsystem. The variables of the social subsystem are shown in Table 1. Variables connect the subsystems, aircraft movements connect the social subsystem with the operational subsystem, and the rate of change of atmospheric pollutants connects the social subsystem with the environmental subsystem.
  • Economic subsystem
    Economic development is required for the stable development of the society, environment and airport operation subsystems; however, excessive economic growth will lead to resource consumption, environmental pollution, and affect the coordinated development of various subsystems. The causal circuit diagram of the economic subsystem is shown in Figure 2b. The higher the economic level of a city, the larger the per capita GDP, and the passenger throughput will increase [25]. At the same time, the growth of the urban economy will drive the investment in the air transportation industry and the increase in industrial output value, thereby increasing the cargo and mail throughput. The higher the investment in the air transportation industry, the more conducive to the construction and development of the airport [26]. Therefore, urban GDP per capita (y3) and urban air transport industry investment (y4) are taken as the main variables of the economic subsystem. The variables of the economic subsystem are shown in Table 2.
    The GDP impact index is the comprehensive value of pollutant emissions, carbon dioxide emissions, and noise levels after logarithmic processing. This index mainly affects GDP growth [28]. The connection between subsystems mainly depends on the connection between variables.
  • Environmental subsystem
    The causal circuit diagram of the environmental subsystem is shown in Figure 2c. Aviation emissions and noise are the key influencing factors of environmental pollution around the airport [29]. ICAO’s Doc 9889 stipulates that pollutant emissions around airports mainly consider the LTO cycle, proposes that the main pollutant gases are NOx, HC and CO, and the wear of tires, brakes and asphalt, and fine particulate matter (PM) produced by aircraft movement are also one of the main pollutants [30]. At the same time, the carbon dioxide emitted by aircraft will exacerbate the greenhouse effect [31]. GB 9660-88 stipulates that the environmental standards for aircraft noise around the airport, indicating that the noise level is also the main factor affecting the airport environment. The “China Civil Aviation Fourth Airport Construction Action Plan” requires the greening of the airport and energy-saving measures as important measures to improve the environment [32]. The variables of the environmental subsystem are shown in Table 3.
  • Operating subsystem
    The causal circuit diagram of the operation subsystem is shown in Figure 2d. The operation data is the most intuitive feedback of the airport’s production and operation status. The annual airport production bulletin of the General Administration of Civil Aviation of China is usually based on passenger throughput, cargo and mail throughput, and aircraft movements reflects the level of airport production and operation [33]. At the same time, the On-time flight clearance rate is used in the civil aviation industry development bulletin to reflect the operating level of the airport and to measure the operating efficiency of the airport [34]. Therefore, annual passenger throughput (y13), annual cargo and mail throughput (y14), annual aircraft movements (y15), on-time flight clearance rate (y16) and growth rate of on-time flight clearance rate (y17) are selected as the main variables of the airport operation subsystem. The variables of the operating subsystem are shown in Table 4.

2.3.3. System Flow Diagram Establishment of SD Model

The system flow diagram of the SD model can further describe the structure of the AECC system and the nature of the variables in the system, clarify the feedback and control process of the system, and predict the main variables of the SD model. According to the causality diagram and the main variables of the SD model, use the regression analysis method, grey model, and system dynamics function to establish mathematical equations between variables. The system flow diagram of the SD model is established based on the Vensim PLE. As shown in Figure 3, the system flow diagram of the SD model includes 8 state variables, 9 rate variables, 45 auxiliary variables and 17 constant variables.
The SD model (Figure 3) established in this paper is applicable to all airports. The system flow diagrams of different airports are the same, and the method of establishing mathematical equations between variables is also similar. According to the sample data obtained by statistics and calculations, the historical time period of the SD model is set to 2008–2018, and the simulation time period is set to 2019–2028. Take CAN as an example, the data of the main variables of CAN from 2008 to 2018 are shown in the Table 5.
In order to study the development characteristic of AECC at different airports, this paper uses CAN, SZX, HKG as examples to establish SD models for each airport. Since the flow diagrams of each airport are the same, and the mathematical equation establishment methods among the variables are similar, CAN is chosen as the representative to illustrate as follows.
  • State variables
    State variables are accumulations that change over time. There are eight state variables in the SD model, which are urban GDP, urban total population, urbanization rate, NOx, HC, CO and PM emissions, and airport green area.
    The equation of the state variable is generally defined as INTEG (inflow rate-outflow rate, initial value), INTEG (X) represents the integral function. For examples: (1) urban GDP = INTEG (urban GDP growth, initial value of urban GDP); (2) urban total population = INTEG (birth population-death population, initial value of urban total population); (3) NOx emissions = INTEG (NOx emissions growth, initial value of NOx emissions); (4) urbanization rate = INTEG (Growth rate of urbanization rate, initial value of urbanization rate) etc.
  • Rate variable
    The rate variable is a variable that directly changes the value of the accumulation variable, reflecting the input or output speed of the accumulation variable. There are nine rate variables in the SD model, including birth population, death population, GDP growth, urbanization rate growth, NOx emission growth, CO emission growth, HC emission growth, PM emission growth, and airport green area growth.
    For example: (1) urban GDP growth = −805,276 × urban GDP affected index + 0.011 × urban GDP + 3.56279 × 10⁷; (2) NOx emission growth = ground support equipment NOx emission index × aircraft ground support equipment emissions growth + motor vehicle NOx emission index × motor vehicle emissions growth + aircraft pollutant emission growth × aircraft NOx emission index.
  • Auxiliary variable
    The value of the auxiliary variable at the current time and the value at the historical time are independent of each other. The SD model includes: the output value and proportion of primary and secondary industries, urban per capita GDP, disposable income of urban residents, passenger throughput, aircraft movements, cargo and mail throughput, energy consumption per passenger, and index of on-time flight clearance, etc.
    In the establishment of system mathematical equations, table functions need to be used to express the non-linear relationship of some variables over time. When using table functions, it is necessary to combine predictive models to determine the values of variables in the simulation time period. Because the AECC system has dynamic changes in randomness, and the variable data is incomplete or uncertain. According to the greyness of the AECC system, this section uses the grey GM (1,1) model to predict the data of the variables. Use data statistical analysis methods to judge the linear relationship between variables, and use regression analysis methods to establish mathematical equations between variables. For examples: (1) disposable income of urban residents = urban per capita GDP × 0.234 − 537.882; (2) passenger throughput = 1.732 × urban total population + income conversion index × disposable income of urban residents −3.03154 × 10⁶; (3) aircraft movements = 0.013 × cargo and mail throughput + 0.005 × passenger throughput +117,843. The statistical measures are shown in Table 6, Table 7, Table 8, Table 9, Table 10 and Table 11.
  • Constant value
    The constant value does not change with time, and the pollutant gas emission index of each emission source in the SD model are constant values. According to the calculation results of various pollutants, the emission index of the four pollutant gases for each emission source can be calculated. The results are shown in Table 12.

2.3.4. Validity and Sensitivity Test of SD Model

SD model testing includes model structure testing and model behavior testing. Structural testing means that the model structure is the same as the real system, and behavior testing means that the model output data is similar to the real data. Structural testing is performed in order to ensure that the model can simulate the causal relationship of the real system. The analysis of the causal relationship between SD model variables is supported by reference documents, which proves that the model has passed the structural evaluation. Behavior testing is to check the correctness of the mathematical equations between the variables in the model to verify whether the error value between the simulated data and the real data output by the model is within an acceptable range, including validity testing and sensitivity testing.
This paper establishes the SD models of CAN, SZX and HKG respectively, and verifies the validity of the models. The validity of the model can be proven when the relative error between the real data and the simulated data of the variable is between [−8%, 8%] [20]. Take CAN as an example: the relative error between the real value (Table 5) and the simulated value of the 17 main variables from 2008 to 2018 is shown in Table 13. The relative error is about [−8%, 8%], which proves the validity of the model. At the same time, the change trend of each variable can be observed when the simulation is running, which meets the sensitivity requirements.

3. Results

The current development of the airport as the baseline for simulation, use the prediction results of variables and combine with the AGA-PP model to predict AECC in the baseline, calculate the AECC in historical years and analyze the leading factors of AECC improvement. From the perspective of short-term planning, provide suggestions for improving the AECC of airports.
Taking CAN, SZX, and HKG as examples to verify, the calculation steps of AECC are as follows: firstly, normalize the original data of the 17 main variables of the SD model from 2008 to 2018; secondly, the αj of the main variables obtained by the AGA-PP model; finally, the AECC of three airports from 2008 to 2018 is calculated based on the normalized value of the main variables and αj, and the results are shown in Table 14. The background color in the Table 14 represents the increase in AECC value compared to the previous year.
From the results in Table 3, it can be seen that the AECC values of three airports were similar in 2008, indicating that the early AECC of three airports were at a similar level. The AECC of the three airports showed a fluctuating and declining trend from 2008 to 2018, indicating that, although the air traffic volume has increased year by year, the AECC has been declining. In the long run, the AECC will limit the sustainable development of the airport. In contrast, AECC of SZX has a small floating range, AECC of HKG has a large fluctuation, mainly due to the impact of economic and operational dimension variable data fluctuations from 2008 to 2018.
According to data collection and processing (the Shenzhen Airport Statistical Yearbook of 2020 has not been published), we have calculated that the AECC of CAN in 2020 is 1.78, and the AECC of HKG in 2020 is 2.75. This is the main reason for the significant increase in the AECC under the influence of the COVID-19 pandemic. It is the substantial reduction in pollutant emissions and the increase in the normal release rate that have had a significant impact on the AECC, and the per capita GDP has not been significantly affected by the COVID-19 pandemic. Therefore, during the COVID-19 pandemic, although the airport’s flight traffic volume had dropped significantly, from the perspective of sustainable development, the airport’s service efficiency for aircraft activities in 2020 has increased.
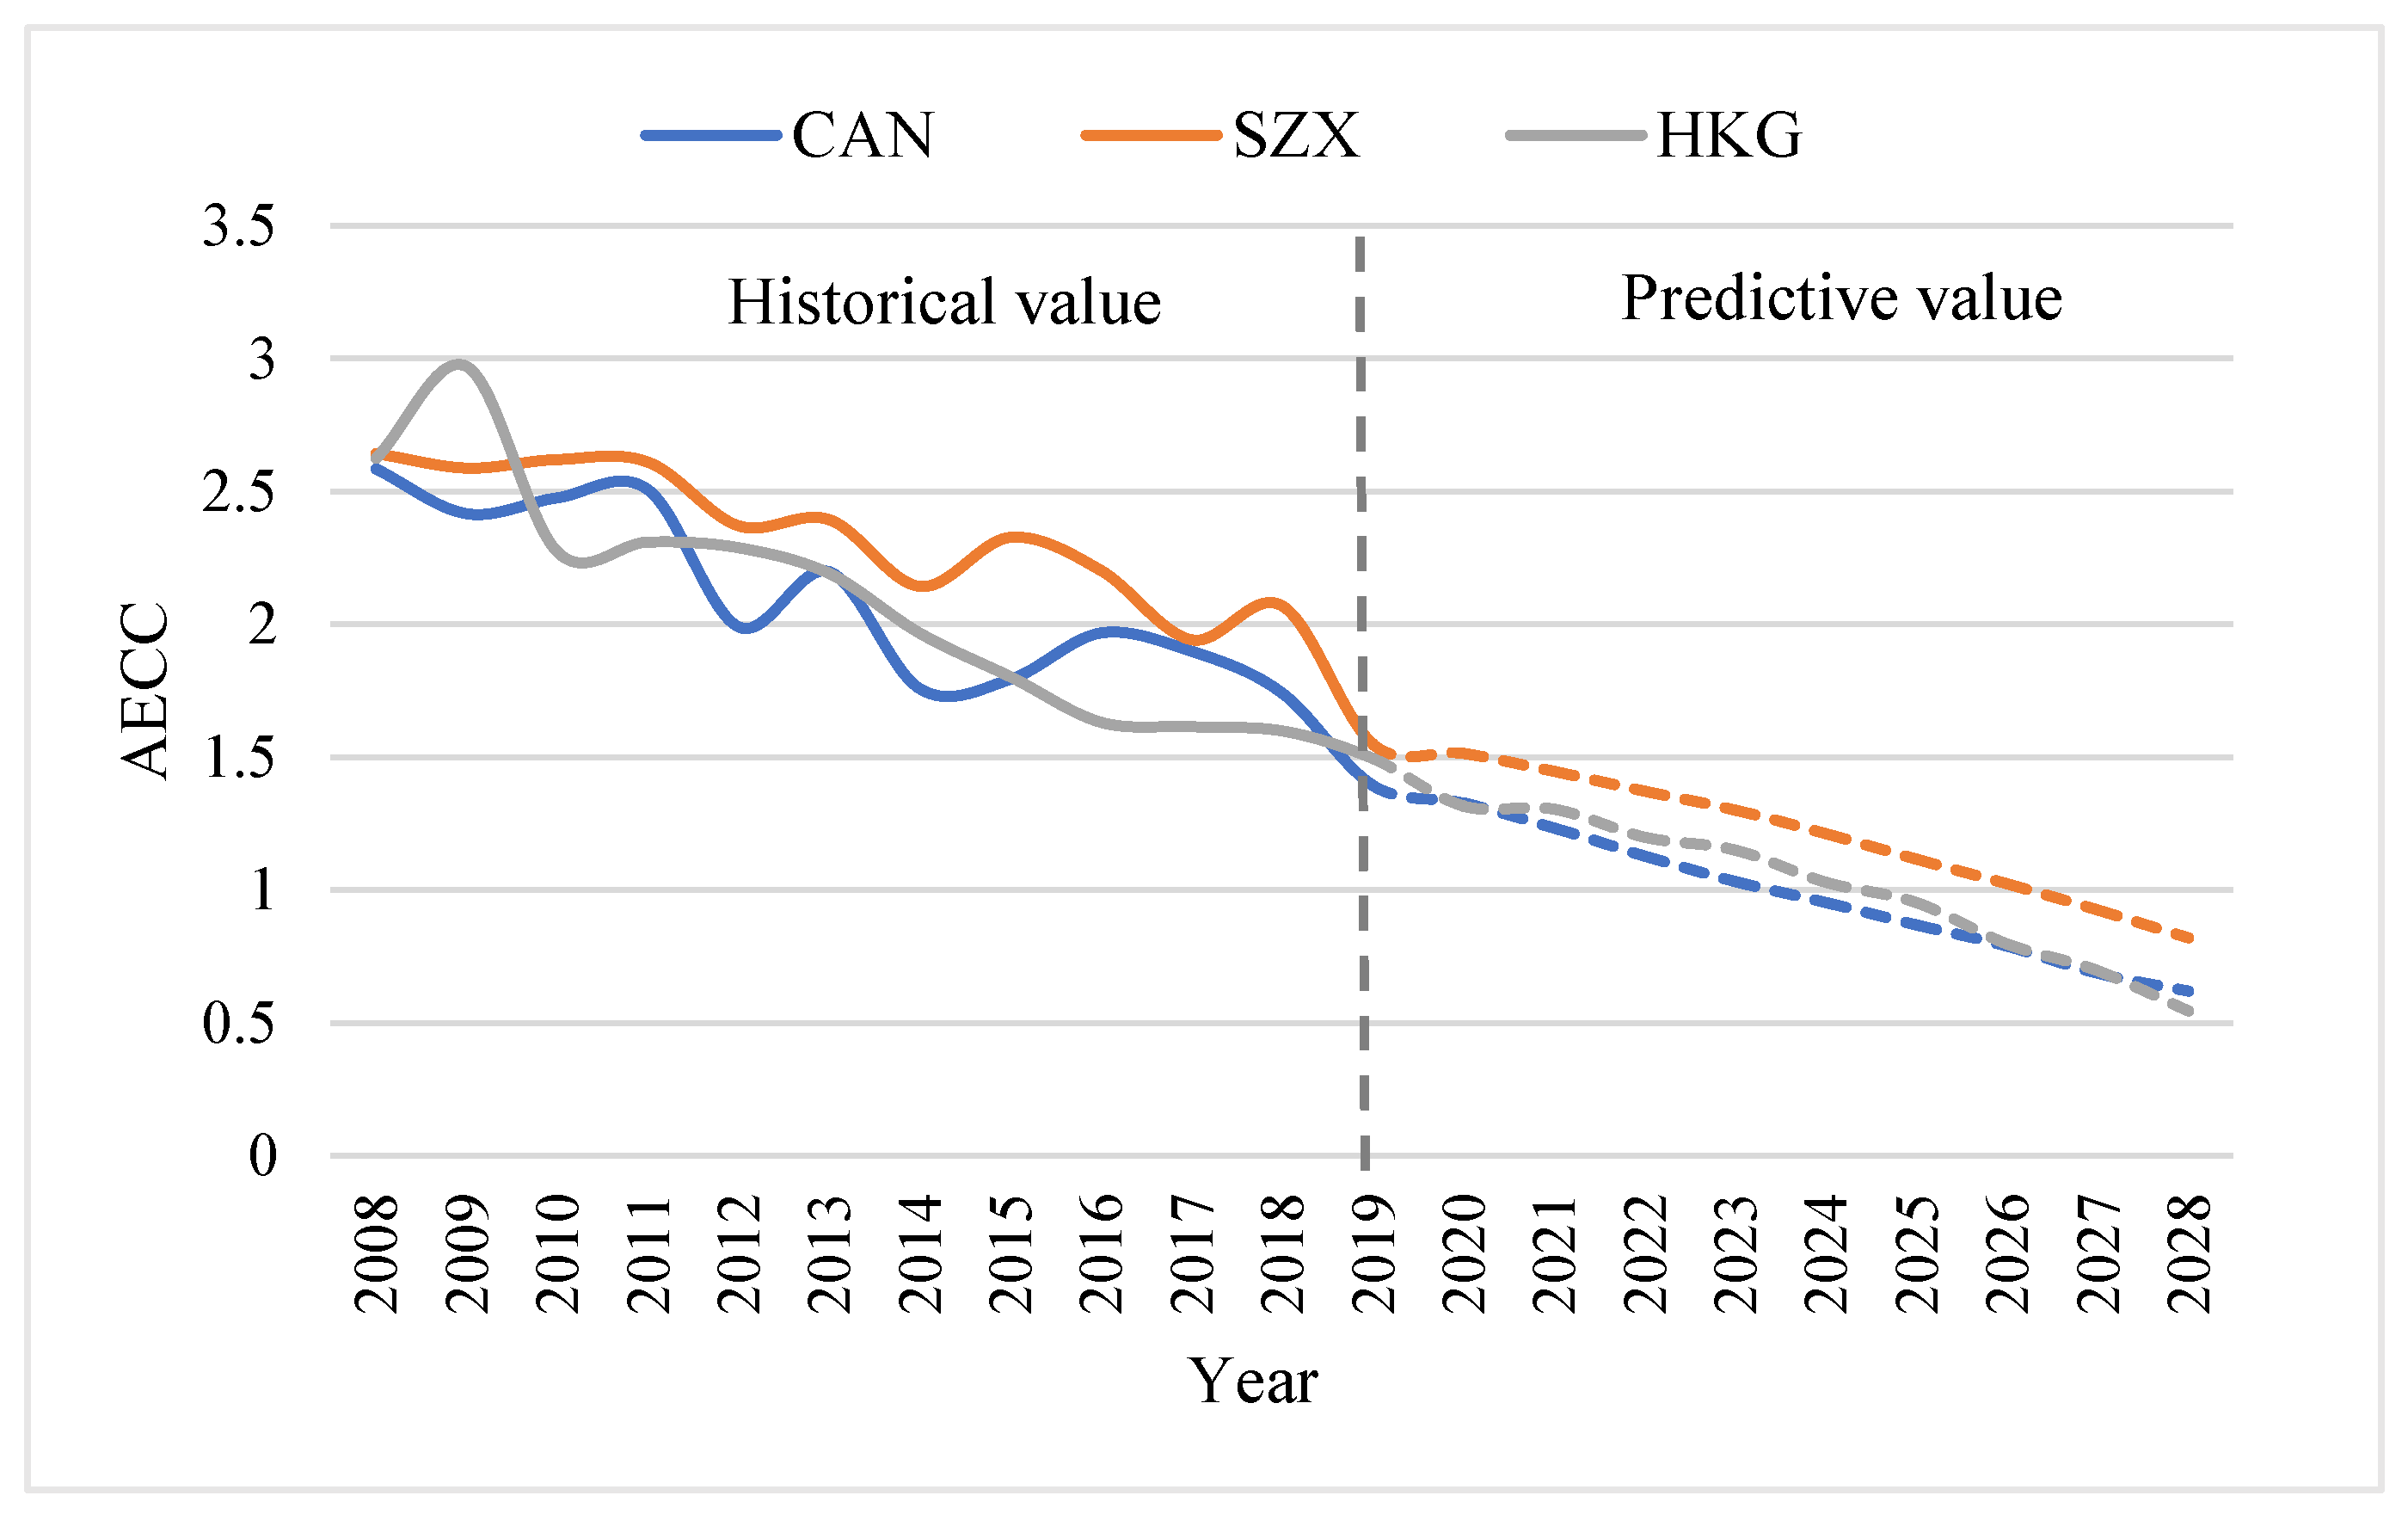
Run the SD model to get the predicted value of the main variables from 2019 to 2028, combined with the calculation steps to predict the AECC of the three airports from 2019 to 2028 is shown in Figure 4.
It can be seen from Figure 4 that the AECC of three airports in the baseline from 2019 to 2028 has shown a continuous downward trend. The continuous decline of AECC will become a bottleneck restricting the sustainable development of the airport.
In order to provide the improvement measures of the AECC of each airport from the perspective of short-term planning, the perspective of short-term planning includes analyzing the current development status of the airport, mining the influencing factors of AECC, and proposing measures to improve AECC.
For CAN, compared with 2009, the AECC in 2010 has increased. The main reason is that the reduction rate of energy consumption per passenger in 2010 reached the highest value in historical years, accounting for 46.1% of the AECC value added. The main reason for the increase of AECC in 2013 and 2016 was also the increase in the reduction rate of energy consumption per passenger. The improvement of AECC in 2011 is mainly due to the decrease of noise level and the increase of the on-time flight clearance rate. Therefore, in the short term, CAN should focus on the decrease in energy consumption per passenger, the increase in noise level and the on-time flight clearance rate. Measures to reduce energy consumption per passenger and noise level reduction are: adopt continuous descent operations (CDO), continuous climb operations (CCO), GBAS precision approach landing, etc.
For SZX, the main reason for the increase of AECC in 2010 was the increase in the on-time flight clearance rate, accounting for 60.8% of the AECC value added. The reason for the increase of AECC in 2013 was that the urban air transportation industry investment increased by 88.4% compared to 2012, which played a leading role in the improvement of AECC. Therefore, increasing the on-time flight clearance rate and urban air transport industry investment in the short term will effectively improve the AECC of SZX.
For HKG, the increase of AECC in 2009 and 2011 was due to the increase in the on-time flight clearance rate. The on-time flight clearance rate in 2009 increased by 10.6% compared to 2008, and the on-time flight clearance rate in 2011 increased by 4.2% compared to 2010. Therefore, in the short term, HKG should mainly take measures to increase the on-time flight clearance rate to improve AECC and promote the sustainable development of the airport.

4. Discussion

4.1. Different Scenarios Settings

AECC is the foundation for the airport to maintain normal operation activities, different airport development modes will affect the changing trend of AECC. When AECC exceeds its load level, it will restrict the sustainable development of the airport. This section sets up different scenarios and simulate SD models to discuss scenarios that can improve AECC.
The main variables of the SD model have different effects on the AECC. This paper uses the AGA-PP model to solve the αj of the main variables. αj is the best projection reflecting the characteristics of variable data structure, and can indicate the degree of influence of the main variable on AECC. The calculation results are shown in
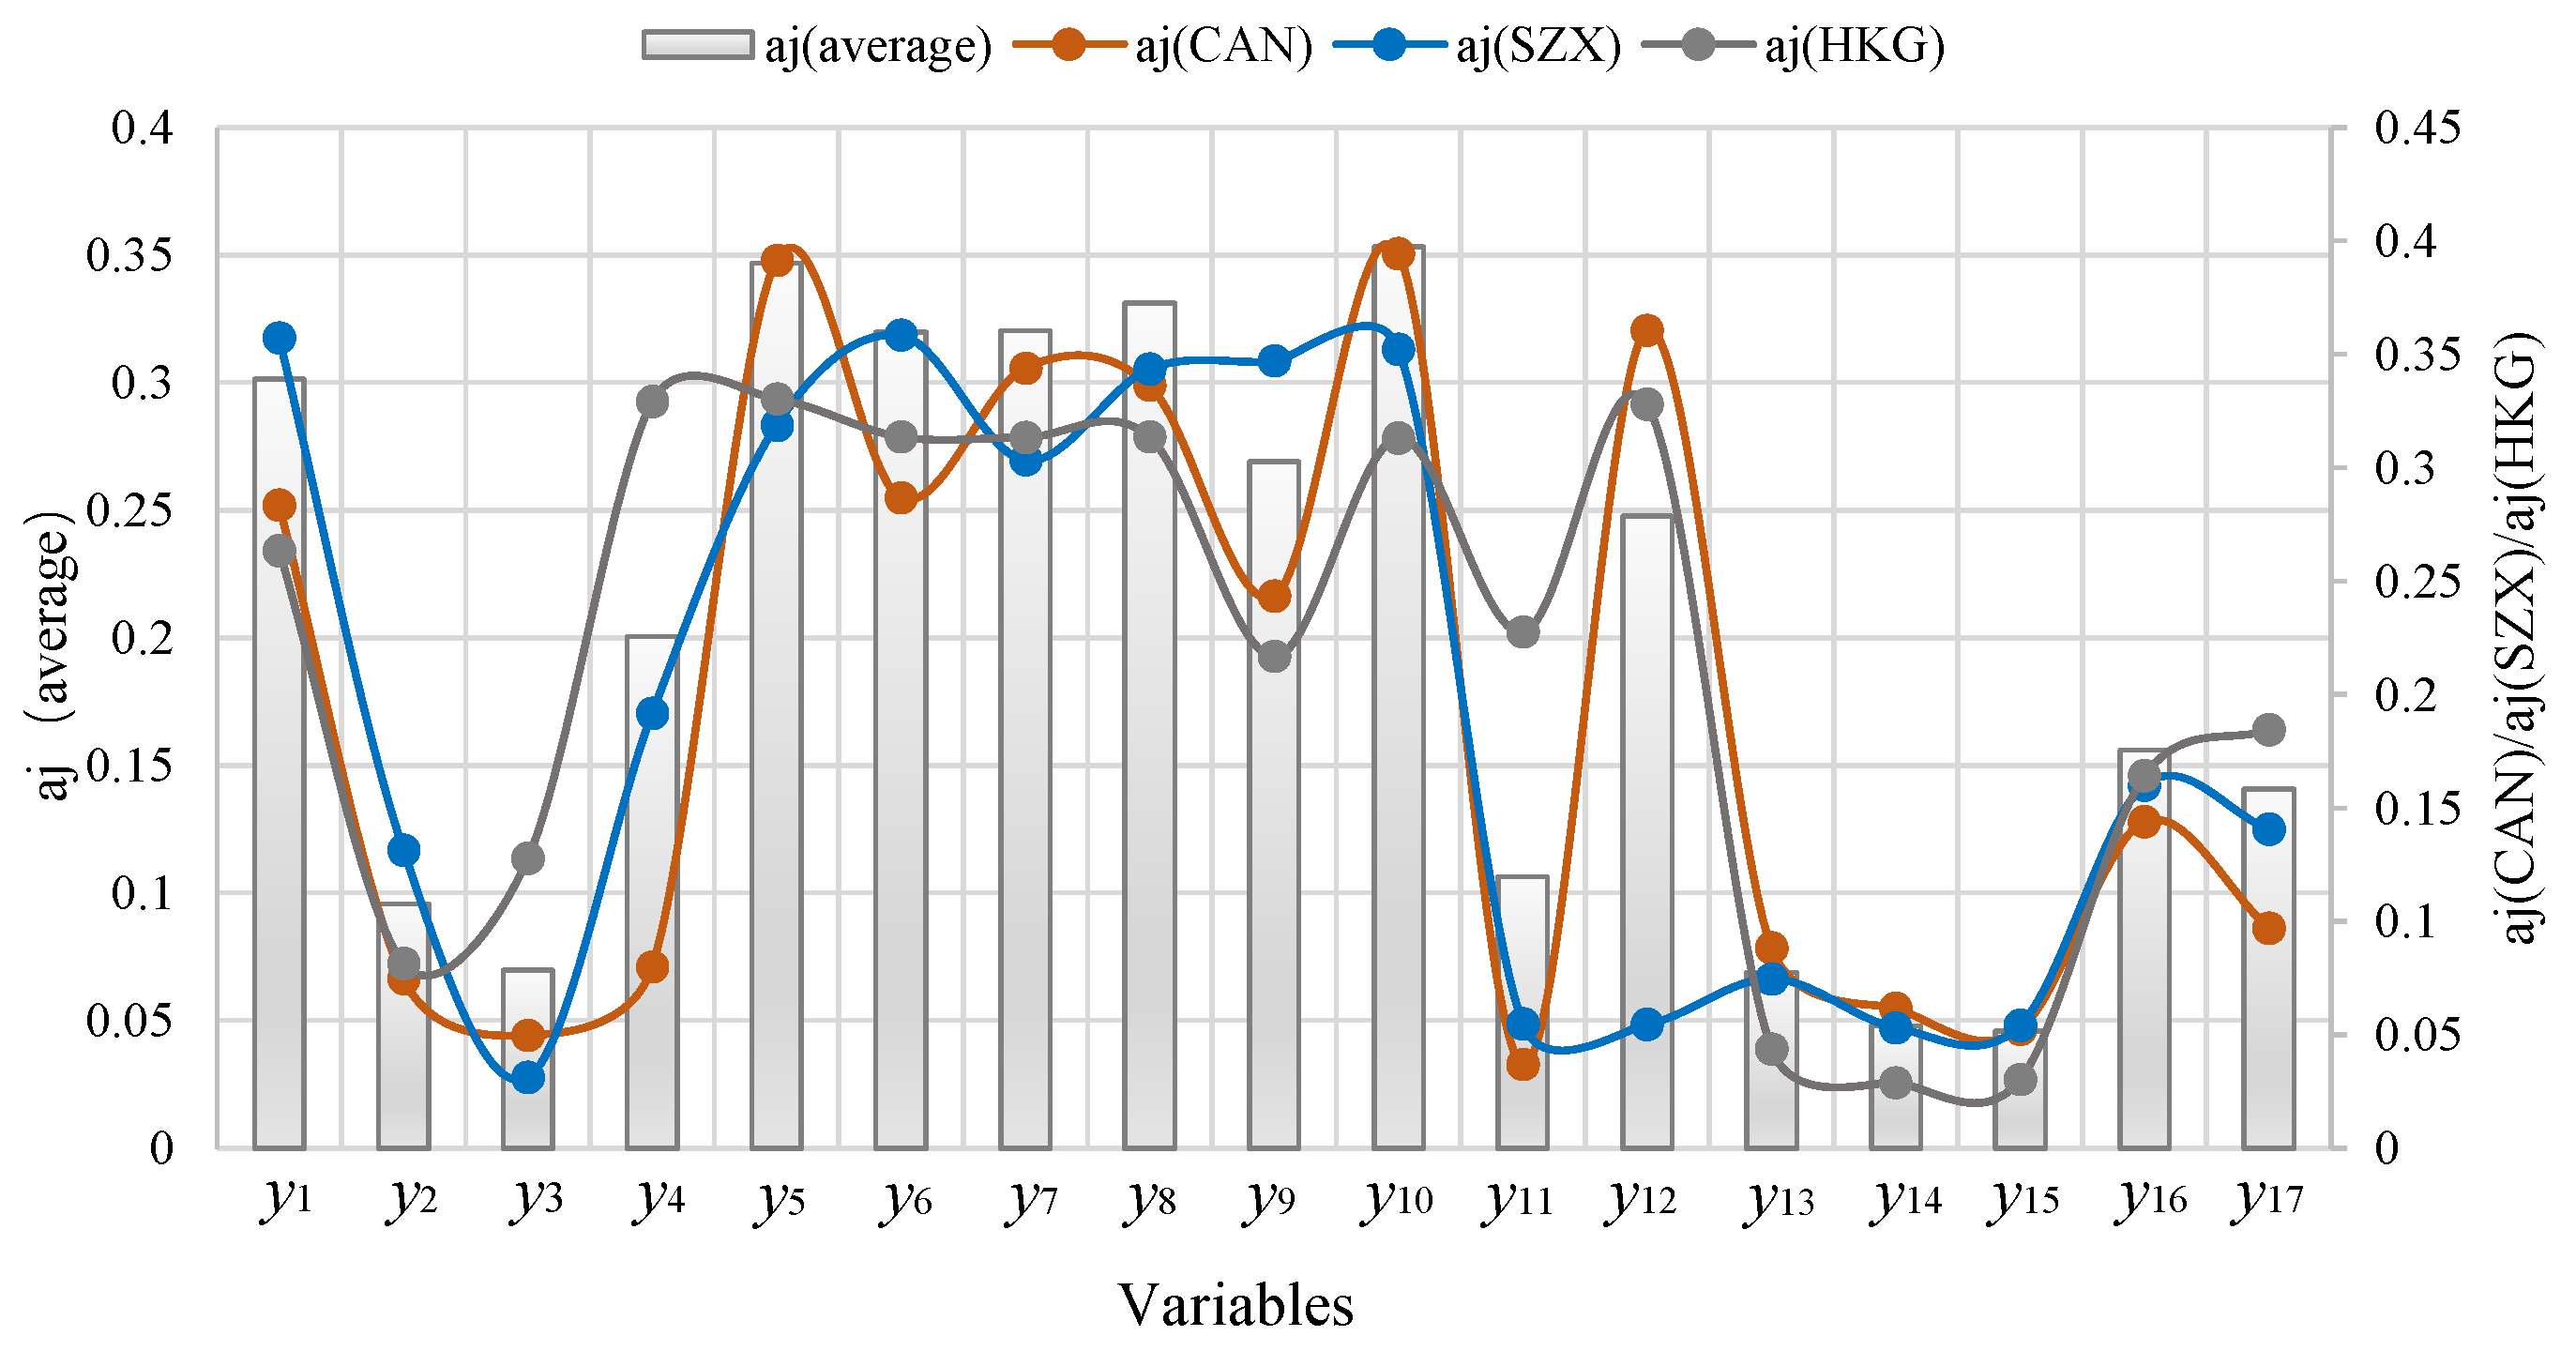
 Figure 5.
It can be seen from Figure 5 that the distributions of the main variable values of CAN, SZX and HKG are roughly similar. In this paper, the αj(average) of the main variables of three airports is used to screen the key variables of AECC.
By comparing the αj(average) of the main variables, comprehensively considering the impact of economic, social, environmental and operational dimensions on AECC, screen variables that have a significant impact on AECC and cover multiple dimensions, including carbon dioxide emissions (y10), NOx emissions (y5), PM emissions (y8), HC emissions (y7), CO emissions (y6), urban total population (y1), noise level (y9), reduction rate of energy consumption per passenger (y12), urban air transport industry investment (y4), and on-time flight clearance rate (y16).
Among these variables, the calculation methods for the three pollutant gases of NOx, CO, and HC are the same, and the change trend of the variables is also similar. Among the three, NOx emissions have the greatest impact on AECC, so NOx emissions variable is selected as the representative of pollutants.
The key variables are: urban total population (y1), urban air transport industry investment (y4), NOx emissions (y5), PM emissions (y8), noise level (y9), carbon dioxide emissions (y10), reduction rate of energy consumption per passenger (y12), and on-time flight clearance rate (y16). This paper refers to commonly used scenario setting methods [35] and adjusts the key variables of each subsystem according to the development needs of the economy, society, environment and operation. The parameter settings are shown in Table 15.

4.2. Analysis of Influencing Indicators

Simulate the SD model in different scenarios, predict the main variable of the SD model, and explore the characteristics of the simulation results. Compare the change trends of the key variables (y1, y4, y5, y8, y9, y10, y12, y16) of each airport under the baseline and different scenarios, as shown in Figure 6.
Analyzing the simulation results of the CAN in Figure 6a, it can be seen that the urban total population is the least under the social development mode. The air transportation industry investment is the most under the coordinated development mode. The NOx emissions, PM emissions, carbon dioxide emissions and noise levels are the least under the environmental protection mode. The reduction rate of energy consumption per passenger is the highest in the social development mode. The on-time flight clearance rate is the highest in the coordinated development mode. For CAN, most of the key variables achieve the optimal simulation results under the scenario of adjusting this variable, and a few key variables achieve the optimal results in the coordinated development mode or the social development mode.
From the simulation results of SZX in Figure 6b, it can be seen that the urban total population of the city is lowest number under the social development mode. The air transportation industry investment under the economic development mode is optimal. The NOx emissions, PM emissions, carbon dioxide emissions and noise levels are the least under the coordinated development mode. The reduction rate of energy consumption per passenger is the optimal in the environmental protection mode, and the on-time flight clearance rate is the highest in the airport operation mode. For SZX, most of the key variables achieve the optimal simulation results under the scenario of adjusting this variable, and a few key variables achieve the optimal results in the coordinated development mode.
From the simulation results of the HKG in Figure 6c, the urban total population is the least under the coordinated development mode. The air transportation industry has the largest amount of investment under the economic development mode. In the early stage, NOx emissions and PM emissions are the lowest under the environmental protection mode, and the lowest under the social development mode in the later stage. The noise level is the lowest under the environmental protection mode, and the carbon dioxide emissions are the lowest under the coordinated development mode. The simulation results of the reduction rate of energy consumption per passenger maintained the optimal results for three consecutive years in the environmental protection mode, and then reached the optimal results in the social development mode. The on-time flight clearance rate is the highest in the airport operation mode. For HKG, most of the key variables of the SD model achieve the optimal simulation results under the scenario of adjusting the variables, and a few of key variables achieve the optimal results in the coordinated development mode or the social development mode.
In summary, the optimal simulation results of the key variables of the three SD models are similar. Among them, the optimal simulation results of the key variables of CAN and HKG are the same, and both reach the optimal under the mode of adjusting the variable, the coordinated development mode or the social development mode. By comparing the characteristics of the original data of the three airports and the commonalities of urban development, it is concluded that the aircraft movements of CAN and HKG are similar, indicating that, in the same economic zone, different airports with similar aircraft movements have similar development characteristics of AECC.

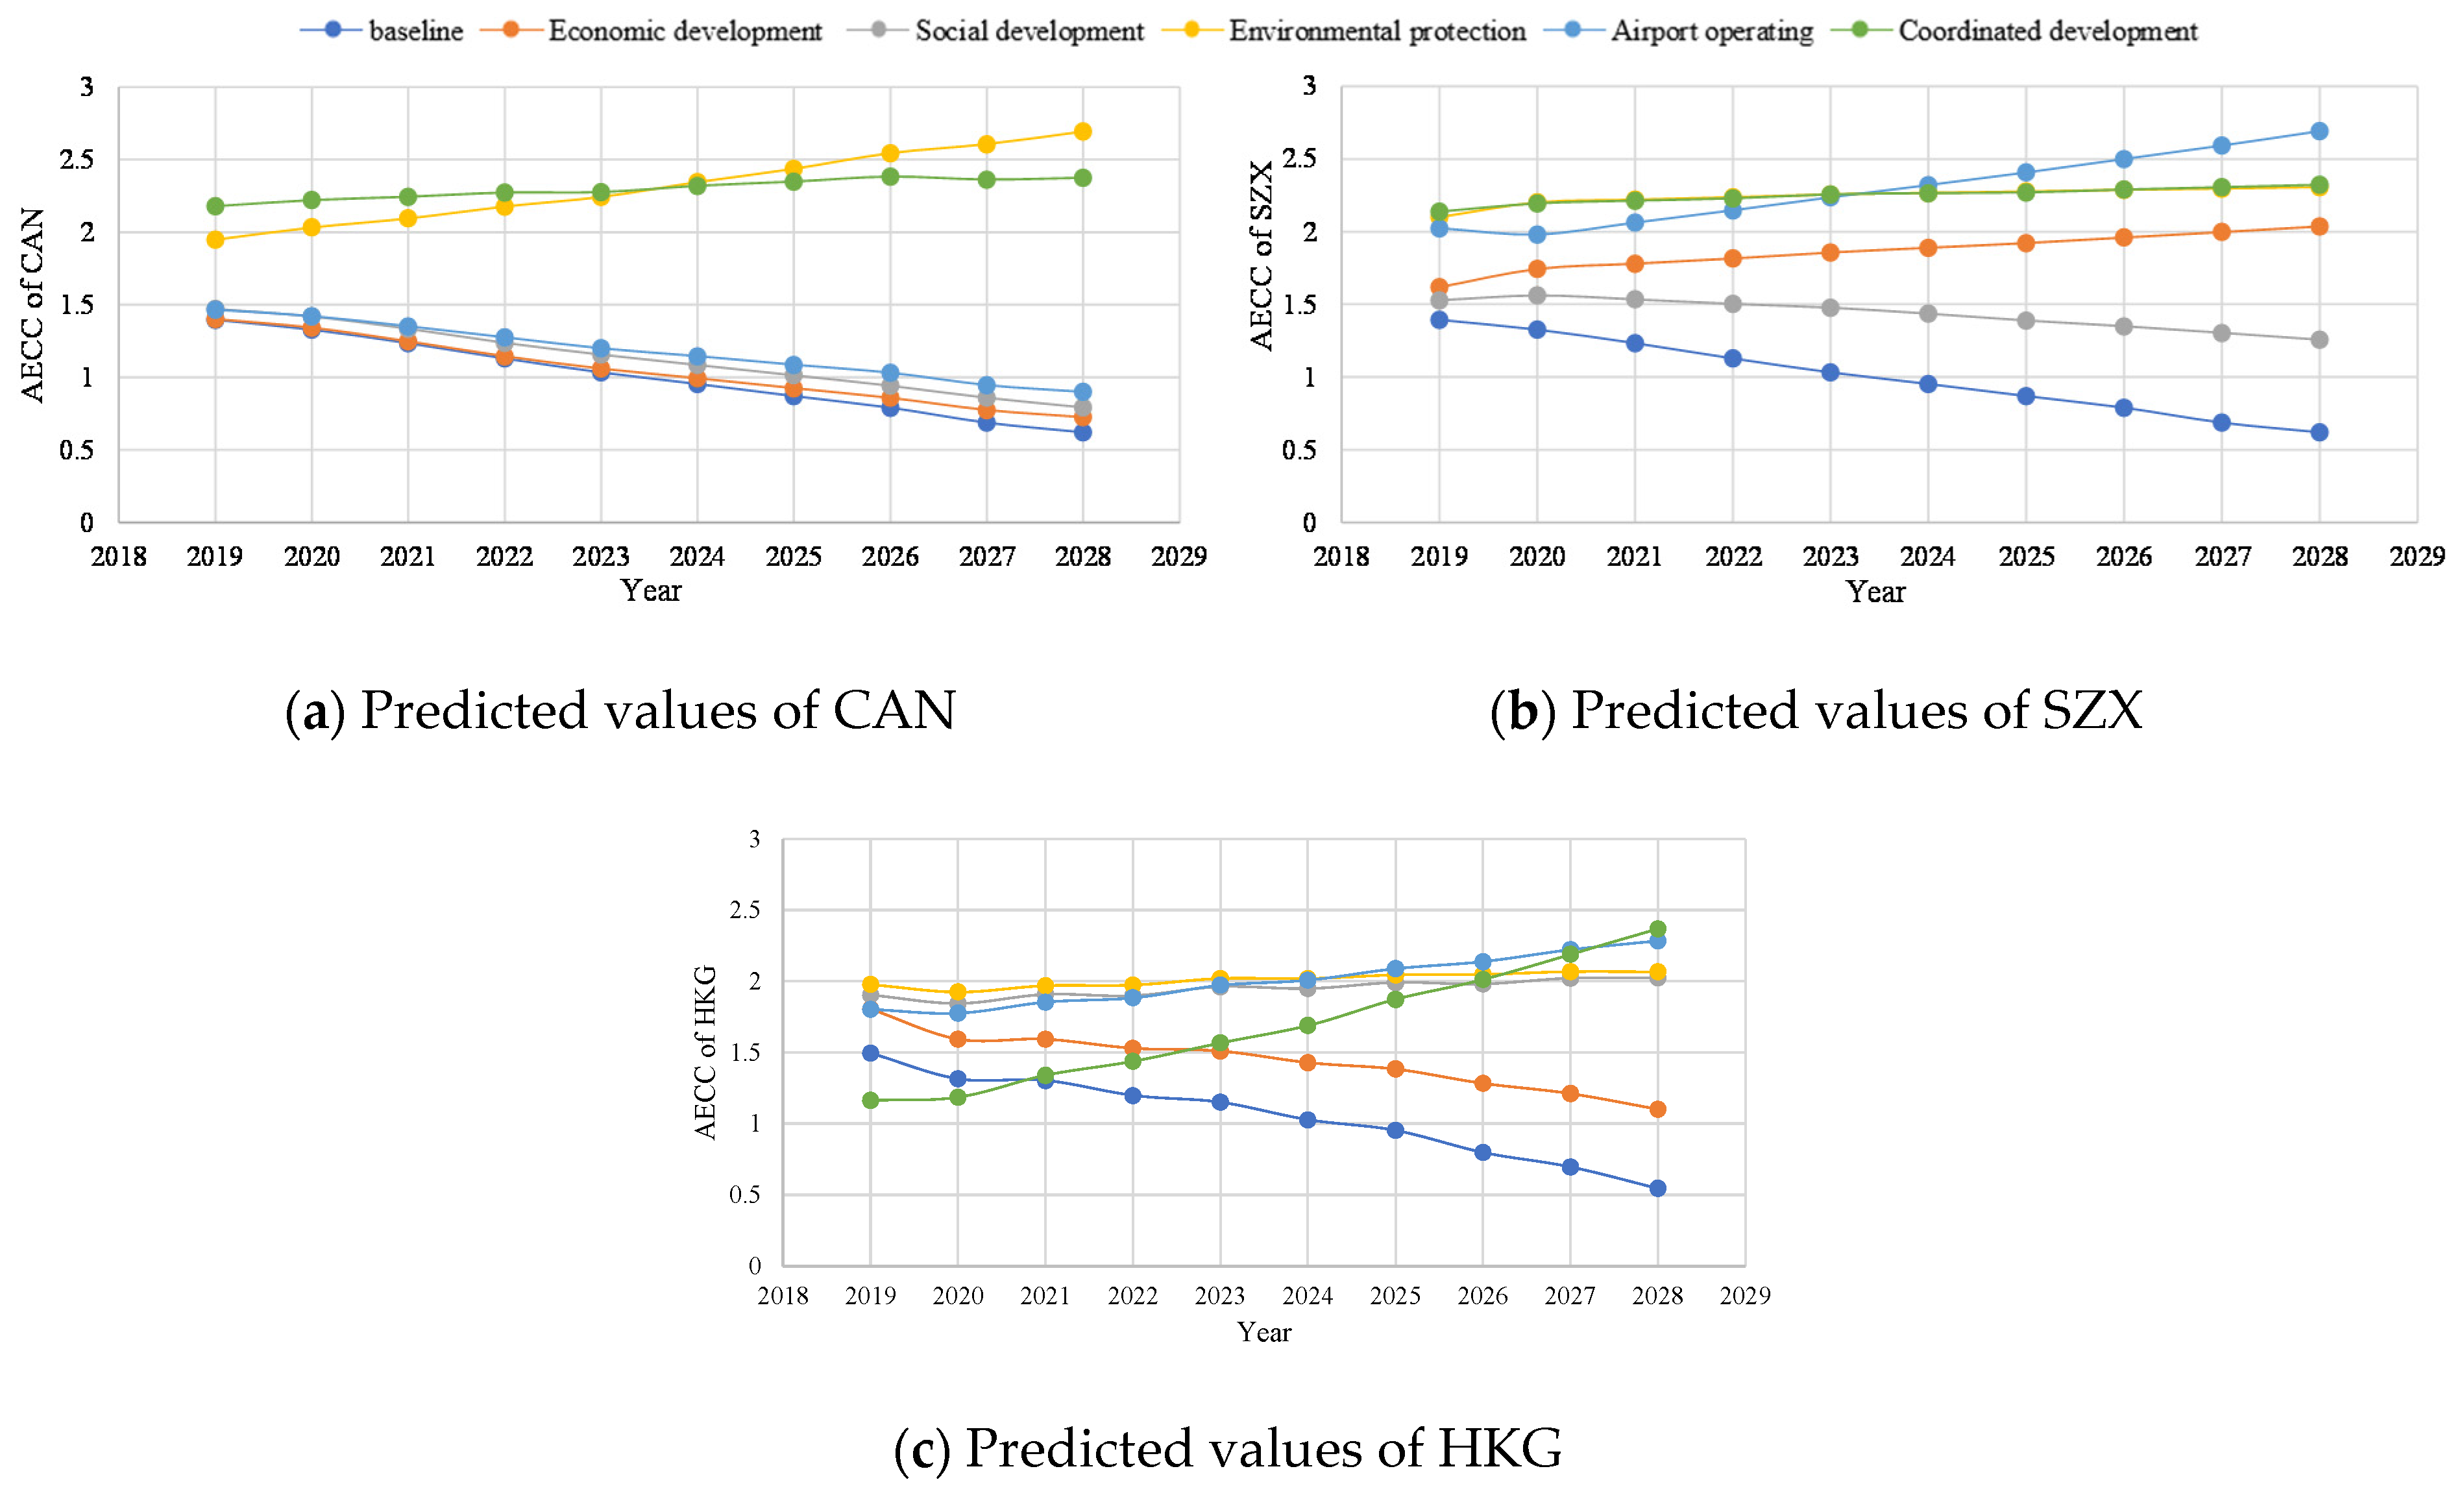
4.3. Prediction of AECC in Different Scenarios

In order to make long-term planning for the development mode of each airport that can improve AECC, predict the AECC of each airport under the baseline and different scenarios. According to the calculation steps of AECC, the forecast data of the 17 main variables of the SD model from 2019 to 2028 are normalized and the αj is solved. Using the normalized value and the αj to predict the AECC of the three airports, the change trend of the AECC of each airport is shown in Figure 7.
It can be seen from Figure 7a that AECC of CAN will show a decreasing trend under the normal development mode, while the predicted value of AECC under the environmental protection mode and coordinated development mode will show an upward trend, and after 2024, the AECC under the environmental protection mode will surpass the coordinated development mode, indicating that in the long run, CAN is suitable for the coordinated development mode before 2024, After 2024, the environmental protection mode should be adopted to upgrade AECC to promote the sustainable development of the airport.
In Figure 7b, AECC of SZX shows a downward trend under the normal development mode, while its AECC has been improved under the economic development, environmental protection, airport operation, and coordinated development mode. In contrast, the AECC under the coordinated development mode will be the largest before 2023, SZX should adopt a coordinated development mode. After 2023, the airport operation mode will become the most suitable mode for the long-term development of SZX.
In Figure 7c, AECC of HKG shows a continuous downward trend under the normal development mode, but shows an upward trend under the social development, environmental protection and airport operation modes. Therefore, the long-term plan of the HKG development mode is as follows: the environmental protection mode should be adopted before 2024, and the airport operation mode will be adopted from 2024 to 2027. As the coordinated development mode has the fastest growth rate, the coordinated development mode will improve AECC of HKG after 2027.
To sum up, the development modes for different airports that can improve AECC are different, and the development modes for airports that can improve AECC in different periods are also different.

4.4. Political Suggestions

  • For CAN, in the short term, the main measures are to increase the reduction rate of energy consumption per passenger, noise level and on-time flight clearance rate to effectively improve AECC. In the long run, CAN is appropriate for a coordinated development mode before 2024, and adopt an environmental protection mode after 2024.
  • For SZX, in the short term, it is important to take measures to improve the on-time flight clearance rate and the air transport industry investment to effectively improve AECC. In the long run, SZX should comprehensively consider the coordinated development of economy, society, environment, and operation before 2023, and adopt a coordinated development mode; after 2023, SZX adopts airport operation mode, with the long-term goal of increasing the on-time flight clearance rate.
  • For HKG, the predicted value of AECC dropped the fastest among the three airports. In the short term, measures to improve the on-time flight clearance rate are mainly taken to improve AECC; in the long term, HKG will mainly adopt environmental protection mode before 2024, and will focus on airport operation mode from 2024 to 2027. After 2027, it will be appropriate for a coordinated development mode.

5. Conclusions

In order to plan the development mode of the airport that can improve AECC, and promote the sustainable development of the airport, this paper studied the dynamic prediction method of AECC and its impacts on airport development. Based on the calculation results of the AECC from 2008 to 2018 of the Pearl River Delta Regional Airports, this paper analyses the impact mechanism of AECC, and formulated measures to improve AECC in the short term. Based on the SD model simulation combined with the AGA-PP model to predict the AECC from 2019 to 2028, this paper analyzed the development characteristics of AECC and planned appropriate development modes for airports in the long term. The following conclusions can be drawn:
  • The AECC of CAN, SZX, and HKG showed a fluctuating and declining trend from 2008 to 2018, indicating that, although air traffic has increased year by year, AECC has been declining. Through the SD model simulation and combined with the AGA-PP model to predict the current development of AECC from 2019 to 2028, it will show a continuous downward trend.
  • By simulating the SD model in different scenarios and analyzing the simulation results of key variables, it is concluded that, in the same economic zone, different airports with similar aircraft movements will have similar development characteristics of AECC.
  • By predicting the AECC under different scenarios, it is concluded that the appropriate development modes for different airports are different, and the appropriate development modes for the airport in different periods are different.
  • The combination of the SD model and the AGA-PP model can realize AECC prediction and airport development mode planning. Details are as follows: CAN is appropriate for a coordinated development mode before 2024, and to adopt an environmental protection mode after 2024. SZX adopts a coordinated development mode before 2023, and is more appropriate for airport operation mode after 2023. HKG mainly adopts an environmental protection mode before 2024, and adopts an airport operation mode from 2024 to 2027. After 2027, it will be appropriate for a coordinated development mode.
The research conclusions of this paper can provide technical support and decision-making basis for relevant departments to plan appropriate development mode of different airports, so as to promote the sustainable development of the airport and the coordinated development between the airport and the region.

Author Contributions

Conceptualization, Q.P. and L.W.; methodology, Q.P. and L.W.; software, T.Z.; validation, T.Z. and Z.W.; data curation, Y.T.; writing—original draft preparation, Q.P. All authors have read and agreed to the published version of the manuscript.

Funding

This research was funded by the National Natural Science Foundation of China, grant number U1933119 and the Foundation of the Graduate Innovation Center, Nanjing University of Aeronautics and Astronautics, grant number kfjj20200722.

Data Availability Statement

The original data is available from the Statistical Yearbook of Guangzhou (http://tjj.gz.gov.cn/ (accessed on 7 December 2021)), Statistical Yearbook of Shenzhen (http://tjj.sz.gov.cn (accessed on 7 December 2021)), Statistical Yearbook of Hong Kong (https://www.censtatd.gov.hk/sc/ (accessed on 7 December 2021)), Civil Aviation Industry Development Statistical Bulletin and National Civil Aviation Flight Operation Efficiency Report from 2008 to 2018 (http://www.caac.gov.cn/index.html (accessed on 8 December 2021)), Statistics of Hong Kong International Airport (https://www.cad.gov.hk/chinese/home.html (accessed on 8 December 2021)).

Conflicts of Interest

The authors declare no conflict of interest.

References

  1. Mrazova, M. Sustainable development—The key for green aviation. INCAS Bull. 2014, 6, 109–122. [Google Scholar]
  2. Wan, L.; Peng, Q.; Wang, J.; Tian, Y.; Xu, C. Evaluation of Airport Sustainability by the Synthetic Evaluation Method: A Case Study of Guangzhou Baiyun International Airport, China, from 2008 to 2017. Sustainability 2020, 12, 3334. [Google Scholar] [CrossRef] [Green Version]
  3. Santa, S.B.; Ribeiro, J.M.P.; Mazon, G.; Schneider, J.; Barcelos, R.L.; de Andrade, J.B.S.O. A Green Airport model: Proposition based on social and environmental management systems. Sustain. Cities Soc. 2020, 59, 102160. [Google Scholar] [CrossRef]
  4. Kilkiş, Ş.; Kılkış, Ş. Benchmarking airports based on a sustainability ranking index. J. Clean. Prod. 2016, 130, 248–259. [Google Scholar] [CrossRef]
  5. Monsalud, A.; Ho, D.; Rakas, J. Greenhouse gas emissions mitigation strategies within the airport sustainability evaluation process. Sustain. Cities Soc. 2015, 14, 414–424. [Google Scholar] [CrossRef]
  6. Lu, M.-T.; Hsu, C.-C.; Liou, J.J.; Lo, H.-W. A hybrid MCDM and sustainability-balanced scorecard model to establish sustainable performance evaluation for international airports. J. Air Transp. Manag. 2018, 71, 9–19. [Google Scholar] [CrossRef]
  7. Su, Y.; Yu, Y.-Q. Dynamic early warning of regional atmospheric environmental carrying capacity. Sci. Total Environ. 2020, 714, 136684. [Google Scholar] [CrossRef] [PubMed]
  8. Wu, M.; Wu, J.; Zang, C. A comprehensive evaluation of the eco-carrying capacity and green economy in the Guangdong-Hong Kong-Macao Greater Bay Area, China. J. Clean. Prod. 2021, 281, 124945. [Google Scholar] [CrossRef]
  9. Liu, R.Z.; Borthwick, A.G.L. Measurement and assessment of carrying capacity of the environment in Ningbo, China. J. Environ. Manag. 2011, 92, 2047–2053. [Google Scholar] [CrossRef] [PubMed]
  10. Wang, Z.; Zhou, K.; Tian, Y.; Wan, L.L. Study of Airport Environmental Carrying Capacity and Capacity Based on Pollutant Discharge. Environ. Prot. Sci. 2018, 44, 88–94. [Google Scholar] [CrossRef]
  11. Wang, Z.; Song, W.-K. Sustainable airport development with performance evaluation forecasts: A case study of 12 Asian airports. J. Air Transp. Manag. 2020, 89, 101925. [Google Scholar] [CrossRef]
  12. Wan, L.; Peng, Q.; Zhang, T.; Wang, Z.; Tian, Y. Evaluation of Airport Environmental Carrying Capacity: A Case Study in Guangzhou Baiyun International Airport, China. Discret. Dyn. Nat. Soc. 2021, 2021, 5580313. [Google Scholar] [CrossRef]
  13. Wei, X.; Wang, J.; Wu, S.; Xin, X.; Wang, Z.; Liu, W. Comprehensive evaluation model for water environment carrying capacity based on VPOSRM framework: A case study in Wuhan, China. Sustain. Cities Soc. 2019, 50, 101640. [Google Scholar] [CrossRef]
  14. Guo, Q.; Wang, J.; Yin, H.; Zhang, G. A comprehensive evaluation model of regional atmospheric environment carrying capacity: Model development and a case study in China. Ecol. Indic. 2018, 91, 259–267. [Google Scholar] [CrossRef]
  15. Wang, Q.; Lei, L. Research on the traffic environment carrying capacity based on grey prediction model. Friends Sci. 2008, 7, 70–72. [Google Scholar]
  16. Li, R.; Wu, J.J. Prediction of Beijing traffic carrying capacity. Shandong Sci. 2013, 26. Available online: http://en.cnki.com.cn/Article_en/CJFDTotal-SDKX201302022.htm (accessed on 9 December 2021).
  17. Luan, H.L. Research on Geological Environment Carrying Capacity Prediction System Based on Composite Index and BP Neural Network; Hebei University of Technology: Tianjin, China, 2016. [Google Scholar]
  18. Zhang, Y.; Yue, Q.; Wang, T.; Zhu, Y.; Li, Y. Evaluation and early warning of water environment carrying capacity in Liaoning province based on control unit: A case study in Zhaosutai river Tieling city control unit. Ecol. Indic. 2021, 124, 107392. [Google Scholar] [CrossRef]
  19. Zhou, Y.; Zhou, J. Urban atmospheric environmental capacity and atmospheric environmental carrying capacity constrained by GDP–PM2.5. Ecol. Indic. 2017, 73, 637–652. [Google Scholar] [CrossRef] [Green Version]
  20. Wang, J.; Huang, X.; Gong, Z.; Cao, K. Dynamic assessment of tourism carrying capacity and its impacts on tourism economic growth in urban tourism destinations in China. J. Destin. Mark. Manag. 2020, 15, 100383. [Google Scholar] [CrossRef]
  21. Peng, Q.P.; Wan, L.L.; Zhang, T.C.; Tian, Y. Research on evaluation and prediction methods of airport environmental carrying capacity. Aeronaut. Comput. Technol. 2021, 51, 64–68. [Google Scholar]
  22. FAA. Aviation Environmental Design Tool (AEDT) Technical Manual Version 2c; U.S. DOT Volpe Center: Cambridge, MA, USA, 2016.
  23. ICAO. Doc9911, Recommended Method for Computing Noise Contours around Airports Montreal; ICAO: Montreal, QC, Canada, 2011. [Google Scholar]
  24. Evdokimova, G.A.; Mozgova, N.P.; Korneikova, M.V. Content and toxicity of heavy metals in soils of zone affected by gas-air emissions from the Pechenganikel plant. Eurasian Soil Sci. 2014, 5, 531–625. [Google Scholar] [CrossRef]
  25. Shen, J.Y.; Zeng, X.Z.; Wu, G.X. Research on the System Dynamics Model of China’s Civil Aviation Passenger Transport Market Demand Forecast. J. East China Jiaotong Univ. 2019, 36, 57–66. [Google Scholar] [CrossRef]
  26. Zhang, R.T. Research on Energy Saving and Emission Reduction Strategies of Sichuan Comprehensive Transportation System Based on System Dynamics; Southwest Jiaotong University: Chengdu, China, 2018. [Google Scholar]
  27. Song, Y.C. Energy-Economy-Environment-Population Sustainable Development Modeling Research Based on System Dynamics; Metallurgical Industry Press: Beijing, China, 2016. [Google Scholar]
  28. You, C.H. Evaluation and Analysis of the Ecological Carrying Capacity of Huainan City Based on System Dynamics; Anhui Jianzhu University: Hefei, China, 2018. [Google Scholar]
  29. Yin, R.Z. Research on Optimization of Approach and Departure Routes in Terminal Area Based on Environmental Impact; Nanjing University of Aeronautics and Astronautics: Nanjing, China, 2018. [Google Scholar]
  30. Torija, A.J.; Self, R.H. Aircraft classification for efficient modelling of environmental noise impact of aviation. J. Air Transp. Manag. 2018, 67, 157–168. [Google Scholar] [CrossRef] [Green Version]
  31. Loo, B.; Li, L.; Psaraki, V.; Pagoni, I. CO2 emissions associated with hubbing activities in air transport: An international comparison. J. Transp. Geogr. 2014, 34, 185–193. [Google Scholar] [CrossRef]
  32. China Civil Aviation Fourth Airport Construction Action Plan (2020–2035); Civil Aviation Administration of China: Beijing, China, 2020.
  33. Annual Airport Production Bulletin. Beijing: Civil Aviation Administration of China, 2008~2018. Available online: http://www.caac.gov.cn/XXGK/XXGK/TJSJ/index_1216.html (accessed on 8 December 2021).
  34. Civil Aviation Industry Development Bulletin. Beijing: Civil Aviation Administration of China, 2008~2018. Available online: http://www.caac.gov.cn/XXGK/XXGK/TJSJ/index_1214.html (accessed on 8 December 2021).
  35. Yu, L.H. Influencing Factors and Mechanism of Energy Saving and Emission Reduction of Freight Transportation Based on System Dynamics; Tsinghua University: Beijing, China, 2017. [Google Scholar]
Figure 1. The flow chart of methodology.
Aerospace 08 00397 g001
Figure 2. Causality diagram of the four subsystems.
Aerospace 08 00397 g002
Figure 3. Airport environmental carrying capacity system flow diagram.
Aerospace 08 00397 g003
Figure 4. The development trend of AECC in three airports.
Aerospace 08 00397 g004
Figure 5. The αj of the main variables.
Aerospace 08 00397 g005
Figure 6. Simulation results of key variables in different scenarios.
Aerospace 08 00397 g006
Figure 7. Predicted values of AECC in different scenarios.
Aerospace 08 00397 g007
Table 1. The variables of the social subsystem.
State VariableRate VariableAuxiliary Variable
variablestotal urban population (y1), urbanization rate (y2)birth population, death populationbirth rate, death rate, urban population, Death rate in change.
Table 2. The variables of the economic subsystem.
State VariableRate VariableAuxiliary Variable
variablesurban GDP,urban GDP growth,urban GDP per capita (y3), urban air transport industry investment (y4), Disposable income of urban residents, The proportion of the primary industry, Proportion of the secondary industry, etc.
Table 3. The variables of the environmental subsystem.
State VariableRate VariableAuxiliary VariableConstant Variable
variablesNOx emissions(y5), CO emissions(y6), HC emissions(y7), PM emissions(y8), airport green area (y11)NOx emission growth, CO emission growth, PM emission growth, HC emission growth, etc.noise level (y9), carbon dioxide emissions (y10), reduction rate of energy consumption per passenger (y12), motor vehicle NOx emission index, aircraft NOx emission index, energy consumption per passenger, etc.carbon dioxide emission index
Table 4. The variables of the operating subsystem.
Auxiliary VariableConstant Variable
variablesAnnual passenger throughput (y13), Annual cargo and mail throughput (y14), Annual aircraft movements (y15), On-time flight clearance rate (y16) and Growth rate of on-time flight clearance rate (y17).carbon dioxide emission index, etc.
Table 5. The data of the main variables of CAN.
Variables200820092010201120122013
y17.84 × 1067.88 × 1067.91 × 1067.96 × 1068.00 × 1068.05 × 106
y281.7582.4883.2284.5584.8985.83
y3106,686120,251134,384148,967164,178178,936
y4250,981473,5901.17 × 1062.02 × 1061.71 × 1062.31 × 106
y51.98 × 1092.13 × 1092.36 × 1092.64 × 1092.86 × 1093.09 × 109
y61.71 × 1091.85 × 1092.05 × 1092.27 × 1092.46 × 1092.65 × 109
y71.75 × 1081.89 × 1082.09 × 1082.30 × 1082.49 × 1082.67 × 108
y82.06 × 1072.22 × 1072.44 × 1072.65 × 1072.84 × 1073.04 × 107
y959.158.859.758.660.359.2
y103.91 × 10114.15 × 10114.40 × 10114.66 × 10114.93 × 10115.18 × 1011
y11197,608211,638226,664250,918254,180264,347
y124.013.863.733.613.523.43
y133.25 × 1073.59 × 1073.93 × 1074.30 × 1074.67 × 1075.04 × 107
y14852,771937,8361.03 × 1061.13 × 1061.27 × 1061.29 × 106
y15291,661309,419327,911347,624367,809386,400
y160.8260.8190.7580.7720.7480.739
y170.005−0.00847−0.074480.01847−0.03109−0.01203
Variables20142015201620172018
y18.12 × 1068.19 × 1068.29 × 1068.37 × 1068.50 × 106
y286.0886.2686.3486.8686.95
y3193,430207,571220,682234,048246,191
y41.73 × 1061.70 × 1062.01 × 1062.74 × 1062.51 × 106
y53.33 × 1093.56 × 1093.72 × 1093.73 × 1094.01 × 109
y62.85 × 1093.02 × 1093.12 × 1093.20 × 1093.45 × 109
y72.87 × 1083.03 × 1083.11 × 1083.21 × 1083.46 × 108
y83.23 × 1073.39 × 1073.44 × 1073.58 × 1073.84 × 107
y959.160.76161.361.8
y105.44 × 10115.69 × 10115.93 × 10116.17 × 10116.40 × 1011
y11273,863281,805292,232303,337317,594
y123.363.313.263.223.18
y135.39 × 1075.73 × 1076.06 × 1076.39 × 1076.70 × 107
y141.39 × 1061.50 × 1061.64 × 1061.72 × 1061.88 × 106
y15405,391423,966442,033459,746477,039
y160.6880.6880.7920.7890.849
y17−0.06874−0.000290.151308−0.002780.075453
Table 6. Model summary of disposable income of urban residents.
ModelRR2R2 after AdjustmentStandard Estimation Error
10.993 a0.9860.9851402.58218
a. Predictive variables: (constant), urban per capita GDP
Table 7. Equation parameters of disposable income of urban residents.
Coefficient a
ModelUnstandardized CoefficientStandardized CoefficienttSignificance
BStandard ErrorBeta
1(constant)−537.8821699.005 −0.3170.759
urban per capita GDP0.2340.0090.99325.5720.000
a. Dependent variable: Disposable income of urban residents
Table 8. Model summary of passenger throughput.
ModelRR2R2 after AdjustmentStandard Estimation Error
10.991 a0.9820.9971750,538.09
a. Predictive variables: (constant), Urban total population, Disposable income of urban residents
Table 9. Equation parameters of passenger throughput.
Coefficient a
ModelUnstandardized CoefficientStandardized CoefficienttSignificance
BStandard ErrorBeta
1(constant)−3031,537.407494,510.38 −0.4050.696
Disposable income of urban residents1001.96723.5730.99442.5050.000
Urban total population1.7321.0380.0391.6690.134
a. Dependent variable: Passenger throughput
Table 10. Model summary of aircraft movements.
ModelRR2R2 after AdjustmentStandard Estimation Error
10.993 a0.9860.9828417.13145
a. Predictive variables: (constant), cargo and mail throughput, passenger throughput
Table 11. Equation parameters of aircraft movements.
Coefficient a
ModelUnstandardized CoefficientStandardized CoefficienttSignificance
BStandard ErrorBeta
1(constant)117,842.54511,583.465 10.1730.000
passenger throughput0.0050.0010.9286.8370.000
cargo and mail throughput0.0130.0270.0680.5010.630
a. Dependent variable: aircraft movements
Table 12. Emission index of pollutant from different emission sources.
NOxCOHCPM
aircraft0.6150.3530.030.002
aircraft ground support equipment0.3790.5350.0670.019
motor vehicle0.0670.8360.0930.004
Table 13. Relative error between the real value and the simulated value of 17 main variables (%).
20082009201020112012201320142015201620172018
y10.000.871.882.242.653.223.574.144.826.765.62
y20.000.010.660.510.140.650.770.850.330.846.01
y30.004.231.700.642.141.200.821.993.215.256.52
y41.081.350.151.173.116.344.936.771.150.873.53
y50.020.050.405.277.147.999.799.659.958.992.06
y60.020.110.483.714.895.466.597.8510.907.291.68
y70.003.013.065.526.326.657.438.4110.987.802.19
y80.000.410.391.011.421.551.942.504.153.395.41
y90.981.151.221.181.141.251.830.400.450.446.35
y104.020.160.440.531.552.121.763.371.431.337.01
y110.000.073.405.362.873.223.843.133.072.195.79
y126.863.463.774.231.962.070.000.320.201.790.01
y132.733.304.224.793.574.281.783.571.213.164.45
y149.571.971.494.701.341.834.893.020.823.693.91
y153.860.160.440.531.582.171.793.261.411.342.39
y166.186.930.152.870.170.877.768.065.374.456.25
y177.124.140.545.831.692.473.738.044.552.493.17
Table 14. AECC values of three airports from 2008 to 2018.
Year20082009201020112012201320142015201620172018
CAN2.582.412.482.511.992.201.761.791.971.901.74
SZX2.642.592.622.612.372.392.142.332.201.942.07
HKG2.622.972.272.312.292.191.971.801.631.621.60
Table 15. Parameter settings of different scenarios.
ScenariosParameter Settings
Scenario1Economic development Pay attention to economic development and increase urban air transportation industry investment ratio by 20% through experiments.
Scenario2Social developmentAiming at population control, through experiments to reduce the birth rate of the urban total population by 20%.
Scenario3Environmental protectionFocusing on environmental protection, referring to the overall goal of civil aviation’s 13th Five-Year Plan for energy conservation and emission reduction, the NOx, CO, HC, PM emissions, carbon dioxide emissions growth rate and noise level will be reduced by 10%, and reduced energy consumption per passenger by 20%.
Scenario4Airport operatingPay attention to the efficiency of airport operation, and increase the on-time clearance rate by 20% through the test.
Scenario5Coordinated developmentPay attention to the coordinated development of economy, society, environment and airport operation, and adjust the above parameters.
Publisher’s Note: MDPI stays neutral with regard to jurisdictional claims in published maps and institutional affiliations.

