Radio Frequency Interference Measurements for a Radio Astronomy Observatory Site in Indonesia


Space Science Center, National Institute of Aeronautics and Space of Indonesia, 40173 Bandung, Indonesia
*
Author to whom correspondence should be addressed.
Aerospace 2021, 8(2), 51; https://doi.org/10.3390/aerospace8020051
Submission received: 8 January 2021
/
Revised: 1 February 2021
/
Accepted: 5 February 2021
/
Published: 17 February 2021
Abstract
:We report on the measurements of radio frequency interference (RFI) at Mount Timau, Kupang, Indonesia, which is intended to host a future radio astronomy observatory. These measurements were taken twice in October 2020 and December 2020 to obtain the RFI environment, at frequencies between 70 and 7000 MHz. Due to the limitations of the measurement data, the results presented in this paper are based on peak detection rather than statistical analysis. Based on the measurement results, the frequency interval between 70–88 MHz and 120–150 MHz is relatively quiet, and the frequency range of 150–300 MHz is relatively clear. The frequency interval of 300 to 800 MHz is relatively quiet, except at the frequency of 600 MHz. The frequency range of 800–1400 MHz is also relatively quiet. The predominant terrestrial services in this band are at 840 MHz, with an amplitude around 32 dB, and 916 MHz, with an amplitude around 12 dB, and the global system for mobile (GSM) signals around 954 MHz have an amplitude around 20 dB above the noise floor. The frequency range of 1400–7000 MHz is also relatively quiet. In this band frequency, we can see RFI at 2145 and 2407 MHz, emitted by local Wi-Fi, and at 2683 MHz, with amplitudes of 18, 40 and 15 dB, respectively, from the noise level. We conclude that, for this period, the frequency band allocated for astronomy can possibly be used for radio telescope development.
1. Introduction
Presently, man-made radio frequency interference (RFI) is continuously increasing in telecommunication systems, radar systems, radio navigation services etc. [1,2,3,4]. These RFIs will affect the radio astronomy data obtained for astronomic research. For mitigation, RFI detection is underway and mitigation methods are being planned, meaning that more reliable measurements can be obtained.
Site evaluation for an astronomical observatory in Indonesia is being performed as part of a feasibility study for a new radio telescope at a multi-wavelength radio frequency observatory. The East Nusa Tenggara, located in southeastern Indonesia, holds the most promising candidate locations for such an astronomical site, based on its clear sky fraction [5]. The radio spectrum is becoming increasingly occupied, mainly at frequencies below 2 GHz, most commonly by wireless communications [1]. As such, it is important to conduct RFI measurements to ascertain the suitability of certain locations for a radio telescope system. The measured data can be used as references for RFI measurements in the future. For the present RFI measurement, we selected the frequency range used for radio astronomy: in 70 MHz–7 GHz. Knowing the RFI conditions in several specified frequency bands is very important, since this will provide information on its measured levels and the procedure for its mitigation. It is also very useful for interpreting the corresponding data.
The RFI in our measurements could possibly be generated by television and radio broadcasts, the global system for mobile (GSM) communication, amateur radio communication, automotive emissions, radio navigation, aeronautical radar, and so on [1,2,3]. In Indonesia, the regulations of frequency allocation are managed by the Ministry of Communication and Informatics [6,7]. Our measurements could be useful as a reference to check if the frequency band allocations of the regulation office are really being followed. The policy of radio frequency allocation is regularly reviewed by this ministry, and basically states compulsory compliance to the International Telecommunication Union (ITU) recommendation. This paper is organized as follows. An introduction is presented in Section 1. A detailed description of the locations, instruments and methods involved in obtaining the measurements is presented in Section 2. The measurement results and their analysis are presented in Section 3, and the conclusions are given in Section 4.
2. The RFI Measurement
2.1. Location of RFI Measurement
The locations for radio telescopes are selected to be as far away as possible from populated areas. Considering the meteorological conditions described in Ref. [5], the location selected for our measurement is the Mount Timau area, which is a mountainous site. The site where the construction of an optical telescope is now underway is shown in Figure 1.
Figure 1. shows the location for RFI measurements—Timau Mount, at longitude (E) 123°56′24.4″, latitude (S) 9°35′4.9″, and altitude 1532 m.
2.2. Instruments for RFI Measurement
Two types of spectrum analyzers were used in this measurement: (1) Spectrum MasterMS2721B, Anritsu Company, California, USA, working in the frequency interval of 10–7100 MHz, for the measurements obtained in October 2020. (2) Spectrum Analyzer DSA 815, Rigol Technologies Inc., Beijing, China, working in the frequency interval of 0.9–1500 MHz, with a displayed average noise level (DANL) of –136 dBm and a minimum resolution bandwidth (RBW) of 100 Hz, for the measurements obtained in December 2020. The antenna used in this work were log periodic antennas with a working frequency of 40–1800 MHz, and a dipole low-gain antenna. For the second measurement, we used a preamplifier around 13 dB that was installed on the antenna boom, connected at around 3 m from the antenna connector output.
Commonly, RFI signals are polarized [8], so measuring the polarization of the RFI is important. In this measurement, we also activated the pre-amplifier prepared inside the spectrum analyzer. Photos of the measurement are shown in Figure 2, with two types of spectrum analyzers—a log periodic and a dipole antenna.
In the measurement process, we applied the Square Kilometre Array (SKA) protocol, as described in Ref. [9], as a guidance, although not always in the same way. The SKA protocol covers a frequency range from 70 MHz to 22 GHz. The sensitivity of our measurement system and the gain of the antennae were lower than that specified by the protocol, and our measurement cycle was also shorter.
3. Results and Discussion
We took two measurements at Mount Timau, in October 2020 and December 2020, in the night and the day time. The location was very close to the summit of Mount Timau. For these measurements, we use a handheld spectrum analyzer with a dipole low-gain antenna and a log periodic antenna. At the altitude of 1532 m above sea level, the line of sight to Kupang City, a large city, is around 70 km, and that to Dili, Timor-Leste is around 200 km. These are possible strong emitters of the RFI that is picked up at the site. Here, measurements were made to cover the radio frequency of 70–7000 MHz.
The measurement results are plotted in Figure 3, Figure 4, Figure 5, Figure 6, Figure 7, Figure 8, Figure 9, Figure 10, Figure 11 and Figure 12 and are expressed as power spectral intensity in dBm versus frequency in MHz. The analysis is also discussed below.
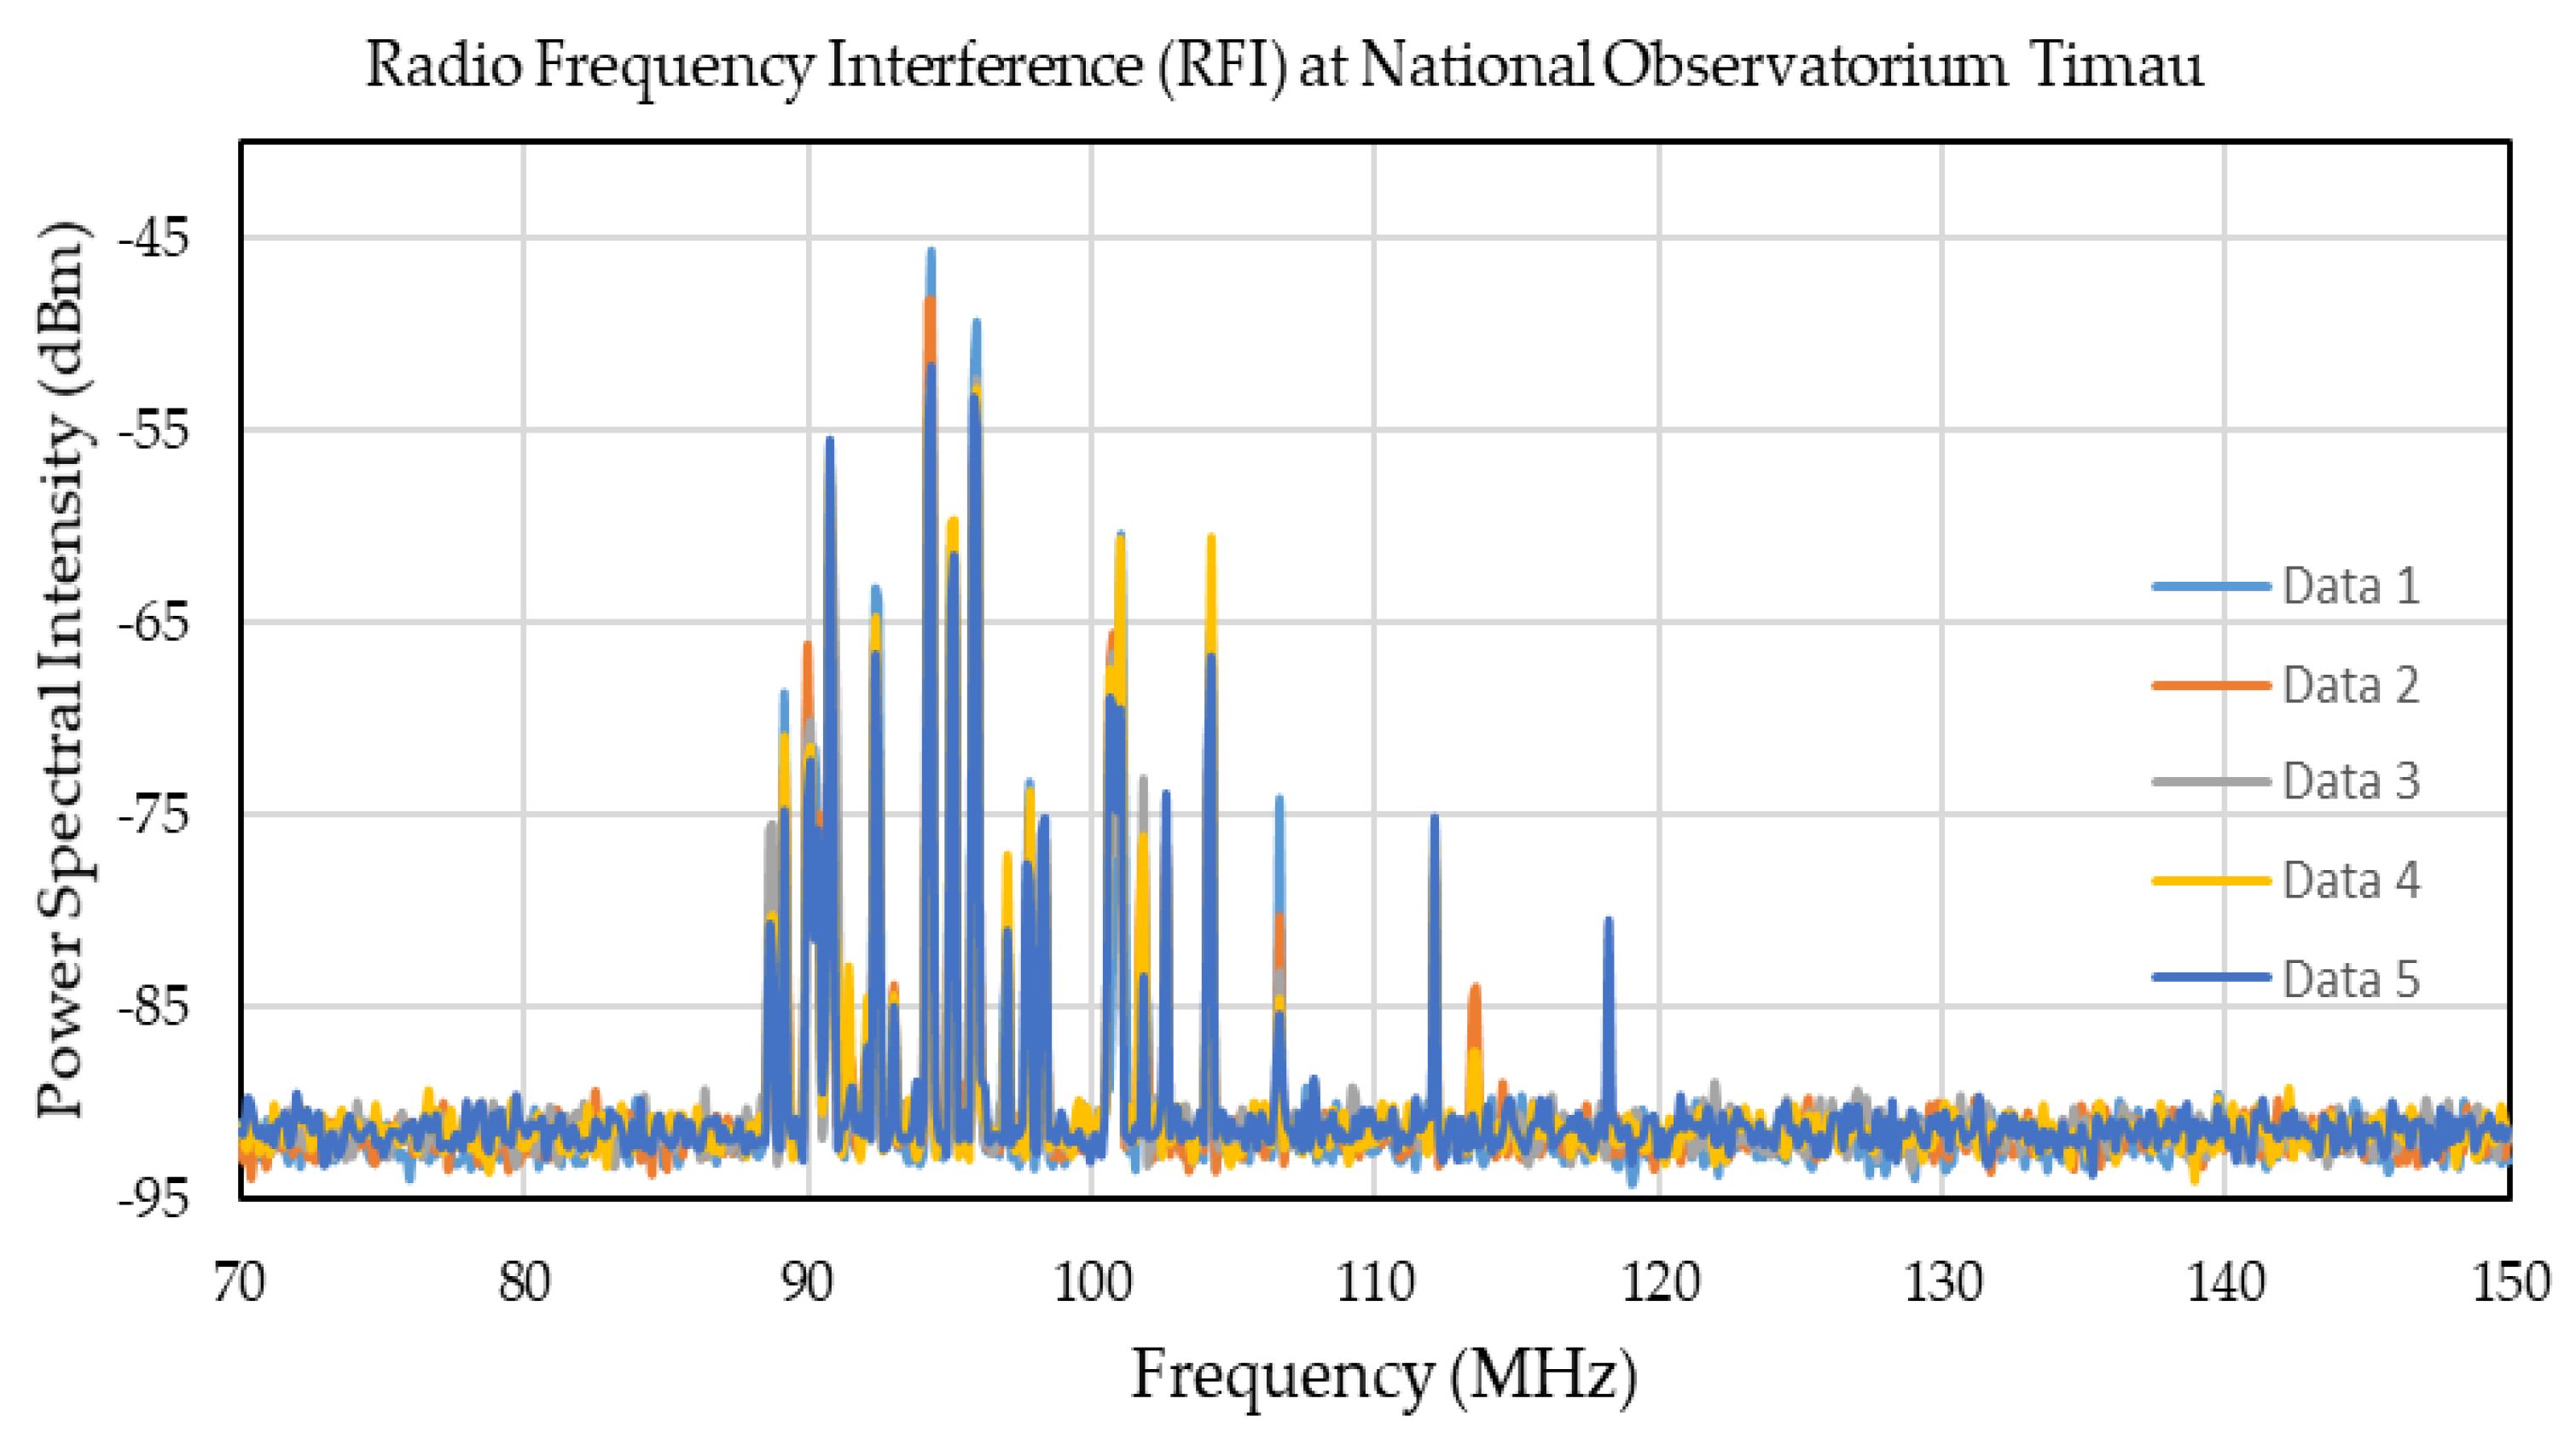
3.1. Band 1: 70–150 MHz
The 70–150 MHz range is the lowest frequency range assigned within the SKA protocol and is referred to as Band 1. We can see from Figure 3, that terrestrial services contribute to most of the RFI. A significant share of the RFI in this band originates from radio broadcasts for frequency modulation (FM) radio, in the 88–118 MHz range, with amplitude varying from 15 to 40 dB above the noise floor. The frequency between 70–88 MHz and 120–150 MHz is relatively quiet.
3.2. Band 2: 150–300 MHz
At Mount Timau, Band 2, with the frequency range of 150–300 MHz, is relatively clear, and there is no strong RFI in this band except at the frequency of 287 MHz, with an amplitude of 6 dB above the noise floor. The vertical axis in Figure 4 depicts from –100 to –80 dBm, in order to enhance the very weak signal at 287 MHz. However, the RFI signals at 260 MHz, from military geostationary satellites, are undetected, probably due to the low sensitivity of our measurement equipment.
3.3. Band 3: 300–800 MHz
The frequency interval of 300 to 800 MHz is very important for radio astronomy, as regards observing the interstellar medium, the Sun, deuterium lines, steep spectrum sources, and pulsars in the frequencies 322–328.6 MHz, 406.1–410 MHz, and 608–614 MHz [10,11]. However, these interval frequencies are also allocated for other science services, such as for communication, and biomass and soil measurements by National Oceanic and Atmospheric Administration (NOAA) [11]. We noticed that this band is busy in the frequency range of 336–554 MHz, at the average power spectral intensity of 8 dBm, and with the maximum power spectral intensity of 15 dBm at 536 MHz. The RFI here is mostly caused by television broadcasts, wireless communication and land mobile communication [6,7]. In the manual of Indonesian frequency allocation [6,7], this band is also reserved for universal service obligation, public protection and disaster relief, international mobile telecommunication, and high-definition television. In Figure 5, we can see RFI in the range of 336–554 MHz, even though this has relatively low amplitude; however, the frequency range from 600 to 800 MHz still contains many frequency slots that can be used for radio astronomy.
3.4. Band 4: 800–960 MHz
In Band 4, with the frequency interval of 800–960 MHz, there are no special allocation bands for radio astronomy. However, this band is used to observe the redshifted lines emitted by extragalactic sources. In our measurements, the resolution bandwidth (RBW) was set to 30 KHz, and the noise floor rose to about −85 dBm. We managed to perform three measurement cycles. The terrestrial service allocations in this band are mainly for mobile communication and fixed wireless access, at 840 MHz, with an amplitude around 32 dB above the noise floor, and 916 MHz, with an amplitude around 12 dB above the noise floor, respectively. The GSM signals around 954 MHz have an amplitude around 20 dB above the noise floor, as shown in Figure 6. We also observed a radio signal at 871 MHz that suddenly appeared and disappeared.
3.5. Band 5: 960–1400 MHz
The rest frequency of neutral hydrogen (HI) is 1420.4 MHz. As such, the frequencies in the 960–1400 MHz range close to the HI frequency are very important for radio astronomy. Extragalactic observations must consider the redshifted lines that fit in this frequency band. The frequencies from 1300 to 1400 MHz are allocated for extragalactic HI and recombination line observations [10,11]. From Figure 7, we can see that this band area is very quiet.
3.6. Band 6: 1400–2000 MHz
The frequency range of 1400 to 2000 MHz is also very important for radio astronomy as regards the observation of galactic and local extragalactic neutral hydrogen (HI), recombination lines, radio source spectra, the galactic continuum, and extragalactic OH masers [10,11]. The frequency ranges of 1428–1452 MHz and 1498–1522 MHz are actually allocated for wireless broadband [2,3,4,5,6,7], and other sub bands for mobile satellite communication.
We note the presence of strong mobile communication signals at 1650.9 MHz, with an amplitude around 22 dB from the noise floor. In the frequency band of 1836–1876 MHz, we also found strong RFI with amplitudes over 25 dB from the noise floor and bandwidth around 50 MHz, as shown on Figure 8, this being emitted by a Very-small-aperture terminal (VSAT) for internet services.
According to the ITU recommendation RA.769-2, Band 7, with the frequency interval of 2000–3000 MHz, is reserved for radio astronomy and other ISM (industrial, scientific and medical) purposes. In this frequency band, we can see RFI at 2145 MHz and 2407 MHz, emitted by local Wi-Fi, and at 2683 MHz, with amplitudes of 18, 40 and 15 dB from the noise level, respectively, as shown in Figure 9.
3.7. Bands 8 and 9: 4000–7000 MHz
Bands 8 and 9, with a frequency range of 3000–8000 MHz, are also important for radio astronomy. The measurement of RFI in these bands is displayed in Figure 10a,b. None of the predominant terrestrial RFI sources are observed in this frequency range. It is worth noting that the measurement at these frequencies was undertaken using two antenna types; the results in Figure 10a were derived using a log periodic antenna, and those in Figure 10b using a dipole antenna, as in Figure 2, for the comparison of measurement. These results are less accurate due to the limitation of the antenna bandwidth, based on technical specification.
In Figure 11 and Figure 12, we compare the RFI results from previous measurements [12] in the frequency ranges of 70–1000 MHz and 1000–2000 MHz. In Figure 12, we can see a great deal of RFI, mainly at 1.8 GHz, which is generated by Wi-Fi in the area.
For comparison, the RFI measured in other countries [13] was emitted by radio FM at frequencies of 87–108 MHz, by television broadcasting at frequencies of 510–790 MHz, by mobile communication at frequencies of 870–960 MHz and 1805–2170 MHz, and by Wi-Fi at frequencies of 2306–2481 MHz.
4. Conclusions
From this work, we can conclude that the RFI environment at Mount Timau is very quiet, except in the Very High Frequency (VHF) and Ultra High Frequency (UHF) bands. The frequency ranges of 70–88 MHz and 120–150 MHz are relatively quiet. In Band 2, the frequency range of 150–300 MHz is also relatively clear. This band is used for Sun, interstellar medium, pulsar and continuum observations. The frequency interval of 300 to 800 MHz is important for radio astronomy, in terms of the observation of the interstellar medium, the Sun, deuterium lines, steep spectrum sources, and pulsars with the frequencies of 322–328.6 MHz, 406.1–410 MHz, and 608–614 MHz. We can see from Figure 8 that this band is relatively quiet, except at the frequency of 600 MHz. The frequency ranges of 960–1400 MHz, close to the HI frequency, is also relatively quiet. The frequency ranges of 1400–7000 MHz, used for neutral hydrogen (HI) (at 1420.4 MHz), methyladyne (CH), formaldehyde (H2CO), methanol (CH3OH) and continuum observations, is also relatively quiet.
Author Contributions
Conceptualization, P.P S. and T.M.; methodology, P.P.S.; software, P.P.S.; validation, P.P.S., T.M., M.B. and B.S.; formal analysis, P.P.S. and M.B.; investigation, P.P.S. and M.B.; resources, P.P.S., T.M., M.B. and B.S.; data curation, P.P.S., M.B.; writing—original draft preparation, P.P.S.; writing—review and editing, P.P.S., T.M. and M.B.; visualization, P.P.S.; supervision, T.M. and B.S.; project administration, P.P.S.; funding acquisition, P.P.S. and T.M. All authors have read and agreed to the published version of the manuscript.
Funding
This research was funded by National Institute of Aeronautics and Space of Indonesia (LAPAN), Indonesia.
Acknowledgments
The authors wish to thank the staff at Management Center of National Observatory, LAPAN, Kupang for their kind support of this program, Bambang Siantoro for his kind support in providing the spectrum analyzer and tools for measurement, and Ruddy Kurniawan for help with the measurements. The funding support from LAPAN is also greatly appreciated. The authors acknowledge the anonymous reviewers for the very helpful and useful comments to improve this paper.
Conflicts of Interest
The authors declare no conflict of interest.
References
- Chen, D.; Yang, J.; Wu, J.; Tang, H.; Huang, M. Spectrum occupancy analysis based on radio monitoring network. In Proceedings of the 1st IEEE International Conference on Communication, Beijing, China, 15–17 August 2012. Wireless Networking Application. [Google Scholar]
- Islam, H.; Koh, C.L.; Oh, S.W.; Qing, X.; Lai, Y.Y.; Wang, C.; Liang, Y.-C.; Toh, B.E.; Chin, F.; Tan, G.L.; et al. Spectrum survey in Singapore: Occupancy measurements and analyses. In Proceedings of the International Conference on Cognitive Radio Oriented Wireless Networks and Communications (CROWNCOM), Singapore, 15–17 May 2008. [Google Scholar]
- Kucuk, I.; Uler, I.; Oz, S.; Onay, S.; Ozdemir, A.R.; Gulcsen, M.; Sarikaya, M.; Dagtekin, N.D.; Ozeren, F.F. Site selection for a radio astronomy observatory in Turkey: Atmospherical, meteorological, and radio frequency analyses. Exp. Astron. 2012, 33, 1–26. [Google Scholar] [CrossRef]
- Abidin, Z.Z.; Adnan, S.; Ibrahim, Z.A. RFI profiles of prime candidate sites for the first radio astronomical telescope in Malaysia. New Astron. 2010, 15, 307–312. [Google Scholar] [CrossRef]
- Hidayat, T.; Mahasena, P.; Dermawan, B.; Hadi, T.W.; Premadi, P.W.; Herdiwijaya, D. Clear sky fraction above Indonesia: An analysis for astronomical site selection. Mon. Not. R. Astron. Soc. 2012, 427, 1903–1917. [Google Scholar] [CrossRef] [Green Version]
- Regulation of the Minister of Communication and Informatics. No. 29/PER/M.KOMINFO/07/2009 Regarding Table of Indonesian Radio Frequency Spectrum Allocation; Regulation of the Minister of Communication and Informatics: Jakarta, Indonesia, 2009; (In Indonesia Language).
- Setiawan, D. Frequency Allocation, Policy and Spectrum Planning of Indonesia; Ministry of Communication and Informatics (Depkominfo): Jakarta, Indonesia, 2010; (in Indonesia Language).
- Space Science Center. National Institute of Aeronautics and Space, Timau National Observatory at a Glance; Gramedia Press (PT Gramedia): Jakarta, Indonesia, 2017; (in Indonesia Language). [Google Scholar]
- Ambrosini, R.; Beresford, R.; Boonstra, A.-J.; Ellingson, S.; Tapping, K. RFI Measurement Protocol for Candidate SKA Sites; SKA Memo No. 37; SKA Organisation: Cheshire, UK, 2003. [Google Scholar]
- CRAF: Handbook for Radio Astronomy, 3rd ed.; European Science Foundation: Strasbourg, France, 2005.
- National Academies Press. Handbook of Frequency Allocations and Spectrum Protection for Scientific Uses; National Academies Press: Washington, DC, USA, 2007. [Google Scholar]
- Hidayat, T.; Munir, A.; Dermawan, B.; Jaelani, A.T.; Léon, S.; Nugroho, D.H.; Suksmono, A.B.; Mahasena, P.; Premadi, P.W.; Herdiwijaya, D.; et al. Radio frequency interference measurements in Indonesia. Exp. Astron. 2014, 37, 85–108. [Google Scholar] [CrossRef]
- Jaroenjittichai, P.; Punyawarin, S.; Singwong, D.; Somboonpon, P.; Prasert, N.; Bandudej, K.; Kempet, P.; Leckngam, A.; Poshyachinda, S.; Soonthornthum, B.; et al. Radio frequency interference site survey for thai radio telescopes. J. Phys. Conf. Ser. 2017, 901, 12062. [Google Scholar] [CrossRef]
Figure 1.
Location of national observatory [8].
Figure 1.
Location of national observatory [8].

Figure 2.
Photos of measurement: (a) Anritsu MS2721B; (b) log periodic antenna and pre amplifier; (c) Rigol DSA 815.
Figure 2.
Photos of measurement: (a) Anritsu MS2721B; (b) log periodic antenna and pre amplifier; (c) Rigol DSA 815.

Figure 3.
Results of a radio frequency survey at low frequencies between 70 and 150 MHz.

Figure 4.
Results of radio frequency survey at low frequencies between 150 and 300 MHz.

Figure 5.
Results of radio frequency survey at low frequencies between 300 and 800 MHz.

Figure 6.
Results of radio frequency survey at low frequencies between 800 and 960 MHz.

Figure 7.
Results of radio frequency survey at low frequencies between 960 and 1400 MHz.

Figure 8.
Results of radio frequency survey at low frequencies between 1400 and 2000 MHz.

Figure 9.
Results of radio frequency survey at low frequencies between 2000 and 3000 MHz.

Figure 10.
Results of radio frequency measurement at the following frequencies: (a) between 4000 and 7000 MHz, using a log-periodic antenna; (b) between 5000 and 7000 MHz, using a dipole antenna.
Figure 10.
Results of radio frequency measurement at the following frequencies: (a) between 4000 and 7000 MHz, using a log-periodic antenna; (b) between 5000 and 7000 MHz, using a dipole antenna.

Figure 11.
Recent measurements at frequencies 70–1000 MHz.

Figure 12.
Recent measurements at frequencies 1000–2000 MHz.


Table 1.
Measurement cycle specified by the SKA protocol, for Mode 1 adapted from [9,10]. RBW: minimum resolution bandwidth in KHz units.
| Frequency Band (MHz) | RBW (KHz) | Frequency (MHz) | For Observation |
|---|---|---|---|
| 10–150 | 3 | 38 | Observation of the Sun, Jupiter, interstellar medium and steep spectrum sources |
| 150–300 | 3 | 150–153 | Sun, interstellar medium, pulsar and continuum observation |
| 300–800 | 30 | 322–328.6, 406.1–410, 608–614 | Sun, interstellar medium, deuterium lines, steep spectrum sources and pulsar |
| 800–960 | 30 | For observing redshifted line from extragalactic sources | |
| 960–1400 | 1000 |
|
|
| 1400–3000 | 30 | 1420.4 | Neutral hydrogen (HI) at 1420.4 MHz |
| 3000–22,000 | 1000 |
|
|
Publisher’s Note: MDPI stays neutral with regard to jurisdictional claims in published maps and institutional affiliations. |
© 2021 by the authors. Licensee MDPI, Basel, Switzerland. This article is an open access article distributed under the terms and conditions of the Creative Commons Attribution (CC BY) license (http://creativecommons.org/licenses/by/4.0/).
Share and Cite
MDPI and ACS Style
Sitompul, P.P.; Manik, T.; Batubara, M.; Suhandi, B. Radio Frequency Interference Measurements for a Radio Astronomy Observatory Site in Indonesia. Aerospace 2021, 8, 51. https://doi.org/10.3390/aerospace8020051
AMA Style
Sitompul PP, Manik T, Batubara M, Suhandi B. Radio Frequency Interference Measurements for a Radio Astronomy Observatory Site in Indonesia. Aerospace. 2021; 8(2):51. https://doi.org/10.3390/aerospace8020051
Chicago/Turabian StyleSitompul, Peberlin Parulian, Timbul Manik, Mario Batubara, and Bambang Suhandi. 2021. "Radio Frequency Interference Measurements for a Radio Astronomy Observatory Site in Indonesia" Aerospace 8, no. 2: 51. https://doi.org/10.3390/aerospace8020051
Note that from the first issue of 2016, this journal uses article numbers instead of page numbers. See further details here.