
A Holistic Approach for Optimal Pre-Planning of Multi-Path Standardized Taxiing Routes


College of Civil Aviation, Nanjing University of Aeronautics and Astronautics, Nanjing 210016, China
*
Author to whom correspondence should be addressed.
Aerospace 2021, 8(9), 241; https://doi.org/10.3390/aerospace8090241
Submission received: 27 July 2021
/
Revised: 29 August 2021
/
Accepted: 30 August 2021
/
Published: 1 September 2021
(This article belongs to the Collection Air Transportation—Operations and Management)
Abstract
:Standardized Taxiing Routes (STRs) are defined as published taxiing-in and taxiing-out routes for aircraft between gates and runways, aiming at improving ground movement safety at busy or complex airports. Most of the STRs specify only one path between each O–D (Origin–Destination) pair, which compromises the flexibility of route choice in time-varying traffic scenarios. In this paper, we present a holistic approach of planning and validating Multi-Path Standardized Taxiing Routes (MPSTRs) based on System-Optimal Traffic Assignment (SOTA), by firstly defining the flow-based congestion cost of runway, taxiway, and sectorized apron operation at a macroscopic level. A human-in-the-loop experiment comprised of six operation scenarios follows to investigate the impact of the pre-planned MPSTRs on human controllers’ performance. Results confirm the positive effect of the MPSTRs on taxiing performance without increasing the controllers’ workload, which also implies that the MPSTRs would be a promising approach for balancing safety and efficiency for the STRs-based taxiing operation and dynamic routing optimization without substantial investment.
1. Introduction
With the continuous increase in flight demand and the expansion of airports, physical structure, as well as the traffic situation, is becoming ever more complex. Significantly, it is leading to undesirable phenomena such as stop-and-go movements on airport surface, frequent taxiing conflicts, excessive runway queuing, and even gridlock [1]. Moreover, incidents of mis-issued and misheard taxiing instructions occurred occasionally due to weaker common situational awareness between controllers and pilots [2]. The airport surface operation is facing the dual challenges of safety and efficiency.
Standardized Taxi Routes (STRs), defined as published taxiing-in and taxiing-out routes for aircraft between gate and runway based on the structural characteristics of the airport surface and runway configuration, were proposed by NASA in 1999 and implemented at Level 9–14 airports across the USA [3]. In 2009, EUROCONTROL conducted a study on STRs at some of the busiest European airports [4]. The study showed the effectiveness in improving situational awareness and reducing both operation complexity and miscommunication after implementing STRs at the Paris and Amsterdam airports [4]. In 2018 and 2019, Guangzhou Baiyun Airport and Hangzhou Xiaoshan Airport published their STRs in AIPs to enhance the level of safety of surface operations [5]. Currently, most of the published STRs present only one fixed route for each Origin–Destination (OD) pair. Intuitively, a single and static standard route is conducive to operational standardization, but it is difficult to adapt to a time-varying traffic flow pattern, reducing the flexibility of route selection and resource utilization in complex scenarios. In contrast, planning too many STRs between an OD pair in the absence of a highly automated route planning and guiding system (e.g., Advanced Surface Movement Guidance and Control System (A-SMGCS)) [6] will greatly increase the cognitive complexity for controllers and pilots, which is not conducive to the establishment of shared situational awareness and may even lead to an increase in the control workload and operational conflicts. Therefore, establishing Multi-Path Standardized Taxiing Routes (MPSTRs) with moderate scale (i.e., appropriate amount of candidate taxiing routes) seems to be a feasible approach that has the potential to achieve a balanced improvement of safety and efficiency. Here, MPSTRs refer to a STR set in which several candidate taxiing routes are planned between each runway and gate (or apron).
Equipping Automatic Taxiing Planning (ATP) systems is a more advanced way to improve surface operation safety, efficiency, and economy while reducing air traffic controllers’ workload, by replacing or supporting human decision-making with high precise facilities and automated algorithms [7,8,9]. Driven by emerging concepts of operation including Airport Collaborative Decision Making (A-CDM) [10], Departure MANager (DMAN) [11], Surface MANager (SMAN) [12], Total Airport Management (TAM) [13], Surface Collaborative Decision Making (Surface CDM) [14], Surface Operation Automation Research (SOAR) [15], etc., proposed in SESAR and NEXTGEN, the automated assistance to controllers received intensive attention as practical solutions, such as digital taxiing manager [16], Spot and Runway Departure Advisor (SARDA) [17], Moving Map [18], autonomous Taxibot [19]. In addition, a large number of academic studies have focused on comprehensive models and efficient algorithms for solving automated taxiing planning problems. Rathinam proposed a fixed route-based node sequencing method for taxiing networks, which assigns the optimal arrival time of the nodes for each aircraft considering the expected off-block time, takeoff time, and taxiing separation constraints [20]. Although operation conflicts can be effectively reduced, fixed routes limit the space of feasible solutions for conflict-free taxiing to some extent. The Mixed Integer Linear Program (MILP) based on spatiotemporal networks is a widely used model framework for the integrated optimization of taxiing routes and sequences with various objectives [21,22]. However, the computational time cost of MILP is too high to meet the timeliness of large-scale taxiing network scheduling. Especially in emergencies, the rapid re-planning of taxiing routes cannot be supported [23,24]. Pre-defining candidate routes has become a main approach for reducing the search space and improving computational efficiency in real-time taxiing planning by providing predefined candidate routes [25,26,27]. With the development of the Surface Trajectory-Based Operation (STBO) concept [28], the taxiing planning problem further extends the discrete route selection and sequencing at critical points to the continuous 3D (X, Y, time) taxiing trajectory optimization through introducing precise speed profile control [29,30]. To overcome the computational efficiency problem of the integrated optimization of taxiing routes, arrival times, and speed profiles for tactical operation, sequential optimization was adopted as a compromised strategy to achieve the local optimum, where pre-defined candidate routes likewise become an effective accelerator [31]. In addition to improving computing efficiency, MPSTRs have a strong potential to underpin the future autonomous taxiing [32] at the airport surface through assisting human controllers to perform active monitoring, enhancing common situation awareness among controllers, pilots, and automated systems, as well as improving the transparency, acceptability, and interpretability of trajectory planning, such that it enables controllers to quickly intervene and take over automated systems, especially in unexpected situations, greatly enhancing operation safety [33].
Overall, MPSTRs would be a promising way to balance safety, efficiency, and timeliness for both manual and autonomous modes of airport surface operation. Nevertheless, only a few studies on the establishment of MPSTRs (or candidate routes) were reported, which mainly relied on the simple shortest path and human experience. Ma et al. achieved the extraction and generalization of MPSTRs based on the frequency of route usage by analyzing historical taxiing trajectory data recorded by surveillance radar, which yielded a good result in terms of practicality and acceptance [34]. However, the MPSTRs extracted with this method reflected more of the controllers’ strategies, rather than optimal solution space for different traffic scenarios.
Therefore, in order to meet the requirements of safety and the efficiency improvement of taxiing operations, especially in busy airports, we systematically investigated the flow-based optimal MPSTRs planning method based on macroscopic traffic flow dynamics to balance the optimality and acceptability, which was validated by fast simulation and Human-In-The-Loop (HITL) experiments. The proposed MPSTRs enhance the adaptive matching between the typical traffic flow patterns and the taxiway system resources from the strategic level. In addition, the proposed method is capable of efficiently constructing and continuously updating the MPSTRs as a reliable candidate route set for dynamic taxiing planning, supporting the standardization, autonomy, and high efficiency of airport taxiing operations. Overall, the contribution of this paper is that theoretical optimized MPSTRs are generated with a HITL simulation to enhance the adaptability and practicability based on a holistic and efficient methodological framework. The detailed work of this study includes:
- (1)
- Heterogeneous traffic congestion cost modeling for airport surface sub-network. Fundamental diagrams characterizing the evolution of flow congestion at runways, taxiways, and aprons were established, and the time-based congestion cost function of sub-network at airport surface was then defined to provide the basis for optimal traffic flow assignment.
- (2)
- MPSTRs generation based on System-Optimal Traffic Assignment (SOTA). The path-based dynamic traffic assignment algorithm was improved using K shortest paths as the base scheme and minimal total congestion cost as the objective. The optimal distribution of the traffic flows in the surface network for a specific flight schedule was generated, on the basis of which the MPSTRs were extracted by balancing both optimality and path size.
- (3)
- Validation of the applicability of MPSTRs based on HITL experiments. A real-time HITL simulation experiment was conducted using a tower simulator to further validate the impact of the MPSTRs on control performance like workload, potential taxiing conflict, taxiing efficiency, etc., for different traffic patterns compared to fixed standard route strategies, providing insight into the further application of the MPSTRs.
The remainder of this paper is organized as follows. Section 2 discusses the traffic flow congestion characteristics and generalized cost expressions for three subsystems: runway, taxiway, and apron. Section 3 describes the construction of the dynamic traffic assignment model and the solution algorithm for generating the MPSTRs based on K-shortest paths (KSPs) with the objective of minimum total congestion cost. In Section 4, by taking Nanjing Lukou International Airport as an example, the verification of the superiority, adaptability, and practicality of the extracted MPSTRs is described from the perspectives of theoretical optimization and real-time simulation. Section 5 discusses the conclusions and the further directions.
2. Traffic Flow Congestion Characteristics on Airport Surface
Airport traffic congestion is essentially an imbalance between demand and supply, which is microscopically manifested by aircraft stop-and-go, as well as longer waiting times at gates, apron entry and exit points, and runway departure queue. Macroscopically, congestion results in increased taxiing times and reduced network throughput [1]. This section describes the fundamental diagrams of the traffic flow for the runway, taxiway, and apron subsystems, in order to characterize the dynamics of flows propagation in different subnetworks. Then, a generalized congestion cost function is given to provide the basis for optimal traffic assignment in Section 3.
2.1. Runway Congestion Cost (RCC)
The runway is the primary place for aircraft takeoff and landing. Runway capacity is influenced by many factors such as runway operation mode, separation standard, aircraft type, airspace conditions, and air traffic controllers’ behavior [35]. The delay of inbound and outbound flights of a runway subsystem is expressed as the extra airborne time and runway holding time, respectively. Regarding the main purpose of this research, the time of holding at the gate due to runway congestion is not included. Therefore, the following runway congestion cost is provided.
Definition 1.
(Departure congestion cost). It refers to the cumulative delay experienced by departing flights waiting in line at the threshold of a runway during the unit time slice due to the departure capacity constraints, noted as .
Definition 2.
(Landing congestion cost). It refers to the cumulative landing delay experienced by landing flights in the air during a unit time slice due to landing capacity constraints, noted as .
Therefore, the runway congestion cost function is essentially a statistical relationship characterizing the variation of the runway delay according to the rate of takeoff and landing demand. Although numerous studies have shown that this function exhibits exponential function characteristics [36,37], its parameter calibration requires sufficient radar or Automatic Dependent Surveillance–Broadcast (ADS–B) data to calculate the flight delay and runway holding time for each flight. When historical data are missing or incomplete, queuing models [38] or commercial fast-time simulator (e.g., AirTOp, TAAM) are commonly used for simulation to extrapolate the congestion evolution of runway traffic flow [39,40]. It is also applicable to taxiway and apron congestion cost studies.
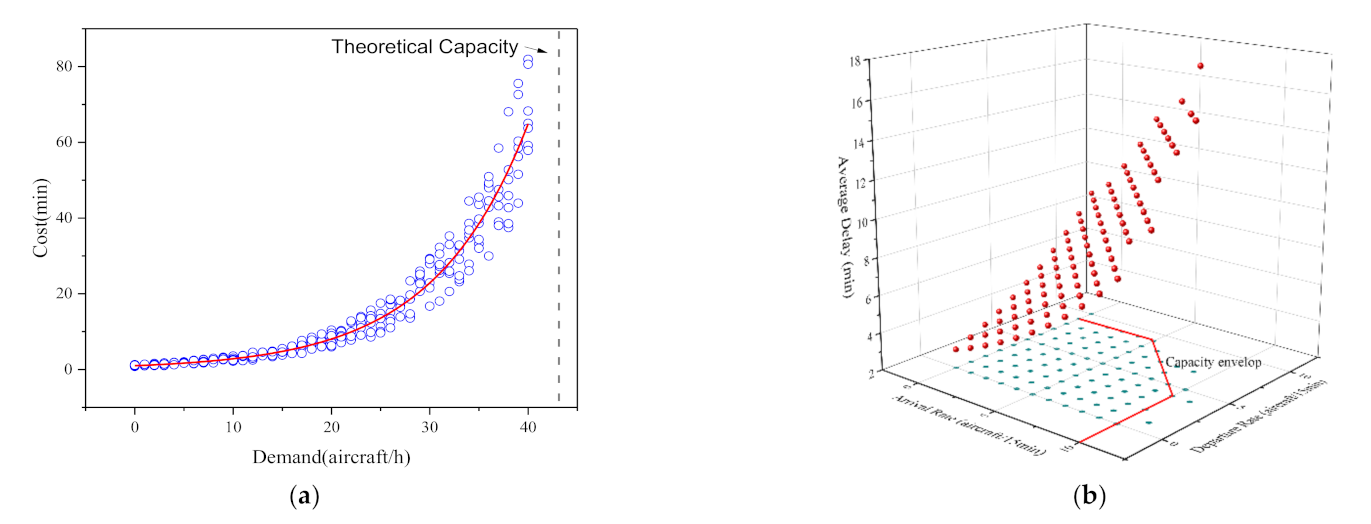
Depending on the runway operation mode, the runway congestion cost function has two-dimensional and three-dimensional forms, as shown in Figure 1.
Runways in segregated operation mode are used only for takeoff or only for landing, and there is no or very limited interaction between takeoff and landing operations. In this case, the landing or departure runway congestion cost is approximated as a univariate function of the landing rate or takeoff rate , denoted as and , respectively.
The mixed operation mode means that the runways can be used for both takeoff and landing, and there is a high competition for runway resources between landing and departure flows. In this mode, the capacity of runway system can be expressed as a convex envelope function for both single-runway and multi-runway airports. In this case, the runway congestion cost is approximated as a binary function of the landing rate and the takeoff rate per unit time, denoted as .
2.2. Taxiway Congestion Cost (TCC)
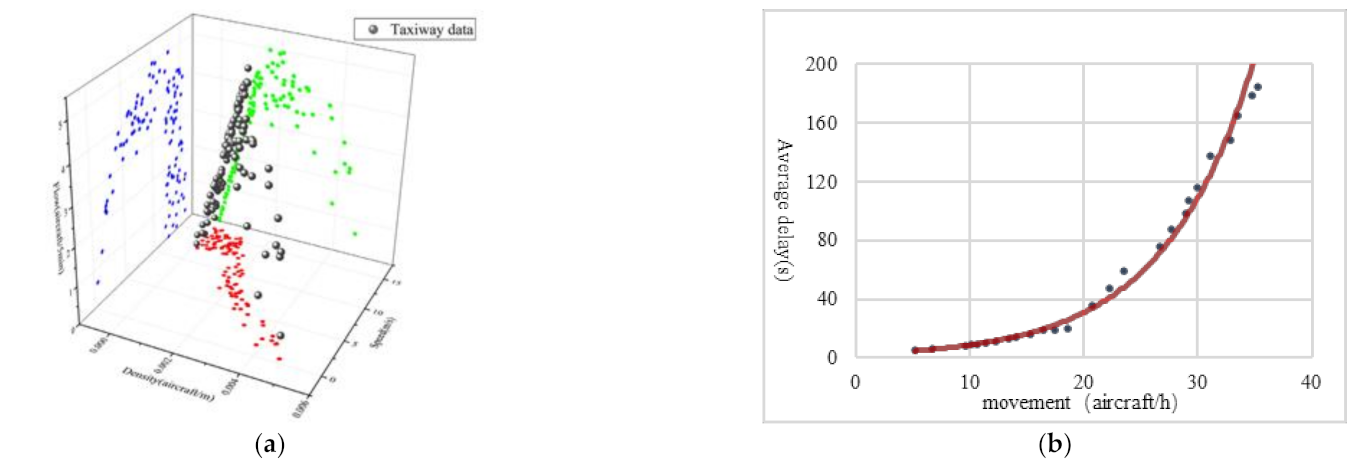
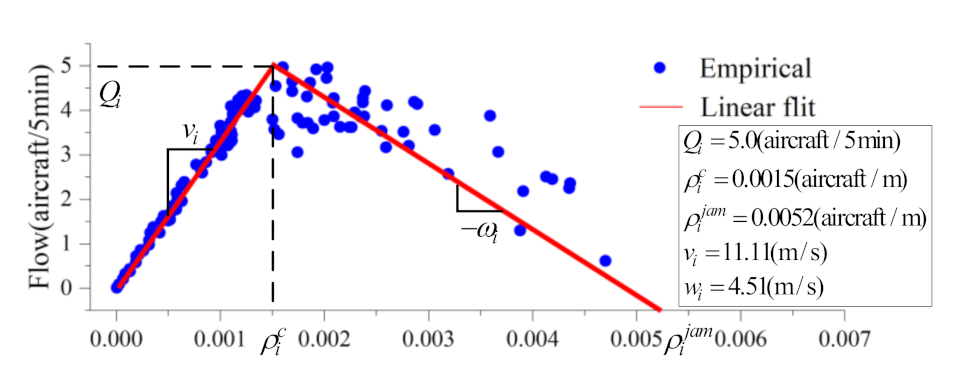
Similar to road traffic, aircraft taxiing at the airport surface is characterized by the balance between demand and supply, which are typically captured by a density-flow relationship known as the fundamental diagram for road traffic [41]. A comprehensive empirical study on the fundamental diagram of airport surface was carried out to illustrate the distinctive flow-density-speed relationship, as shown in Figure 2a. For the details, please refer to our published paper [1]. The taxiway fundamental diagram shows segmentation function characteristics as expressed in Equation (1), presenting two distinct phases, that is, a free-flow phase and a congested phase.
where is the outflow rate of a taxiway link per unit time, is the average speed of traffic flow, is the aircraft density of a link, is the critical density point in the transition from free flow to the congested phase, and is the corresponding rule from to . According to Equation (1), the relationship between the average speed and the traffic density can be derived, which can then be translated into the relationship between the taxiing time and the traffic volume according to the length of the taxiway link. Then, based on Definition (3), the total taxiing congestion cost of the airport surface over a period of time can be measured.
Definition 3.
(Taxiing congestion cost). It refers to the total time that the traffic flow spends on each link of the taxiway network manifesting taxiing conflict or congestion during a unit time slice , denoted as .
2.3. Apron Congestion Cost (ACC)
The apron is the area of an airport where aircraft are parked. Considering the very limited maneuvering space in the area, the standardized taxiing route defined in this paper is the path between the runway and exit/entry point of the aprons. Therefore, it is essential to cluster the gates or stands into several aprons with the fewest operational interactions. We proposed a similarity index that measures the overlap among regulated pushback or taxiing routes inside the apron area. The DBSCAN (Density-Based Spatial Clustering of Applications with Noise) clustering algorithm [42] was directly applied to sectorize the gate to achieve the minimization of the operational impact between different apron classes, such that we assume the calibration of congestion cost for each apron is independent.
2.3.1. DBSCAN-Based Apron Sectorization
- (1)
- Path similarity measurement
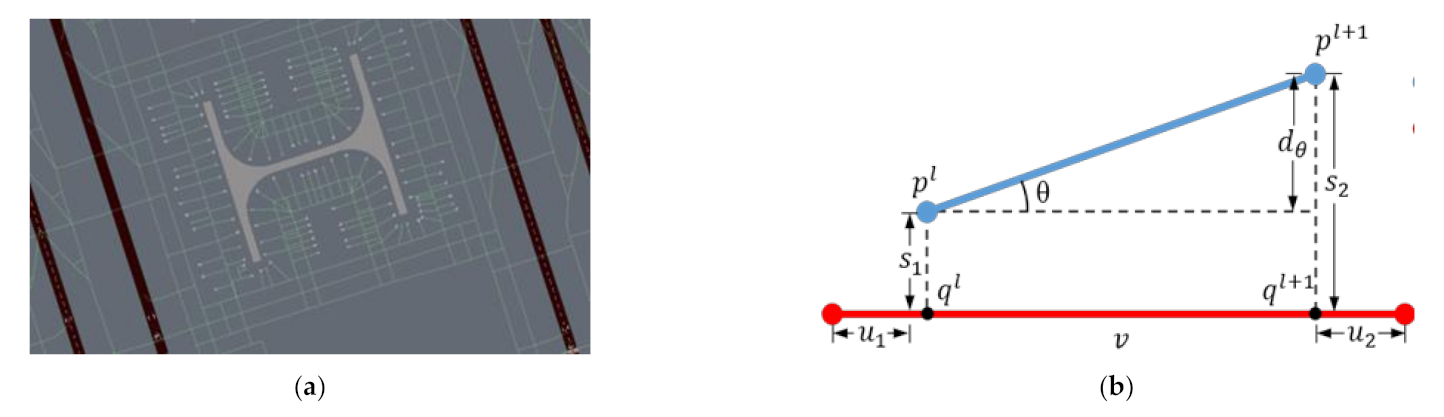
Taxiway network in the apron area is much denser than that in maneuvering area of the airport. The interactions during pushback or taxiing are complex in terms of merge, diverge, crossover, and even head-on conflict, see Figure 3a. Therefore, we propose an efficient method based on weighted line segment distance to measure the similarity between any two paths in the apron area.
The distance between two line segments in a two-dimensional plane can be assessed by three quantities: perpendicular distance, parallel distance, and angle distance, as given by Formulae (2)–(4), respectively. These three components are adapted from similarity measures used in pattern recognition [43]. Without loss of generality, we define these distances based on Figure 3b.
Let and be the distances of and from , respectively. The perpendicular distance between the segments and is defined as
The parallel distance is defined as:
The angle distance is defined as:
Finally, the line segment distance is a convex combination of the distances above.
where . Then, the similarity of the two segments is quantified as follows with a given threshold (experimentally set as 100 m in this paper):
Based on the similarity between pairs of line segments, we introduce a recursively defined function to find the longest common subsequence (LCS) of each path, which is a modification of the existing methods [44,45]. Let two paths in the apron expressed as a sequence of line segments be denoted by and . We defined the similarity of LCS as Equation (7), which returns the similarity measure of best alignment between and .
- (2)
- Path difference-based clustering using DBSCAN
DBSCAN is widely recognized as an excellent clustering algorithm that is efficient, robust, insensitive to the initial values, and can identify arbitrary-shaped clusters [46]. Based on the measurement of path similarity, DBSCAN is adopted to find the best clusters based on the definition of “distance” of any two paths, denoted as . Considering the maturity of the DBSCAN method, it is not repeated here [42].
2.3.2. Apron Congestion Cost
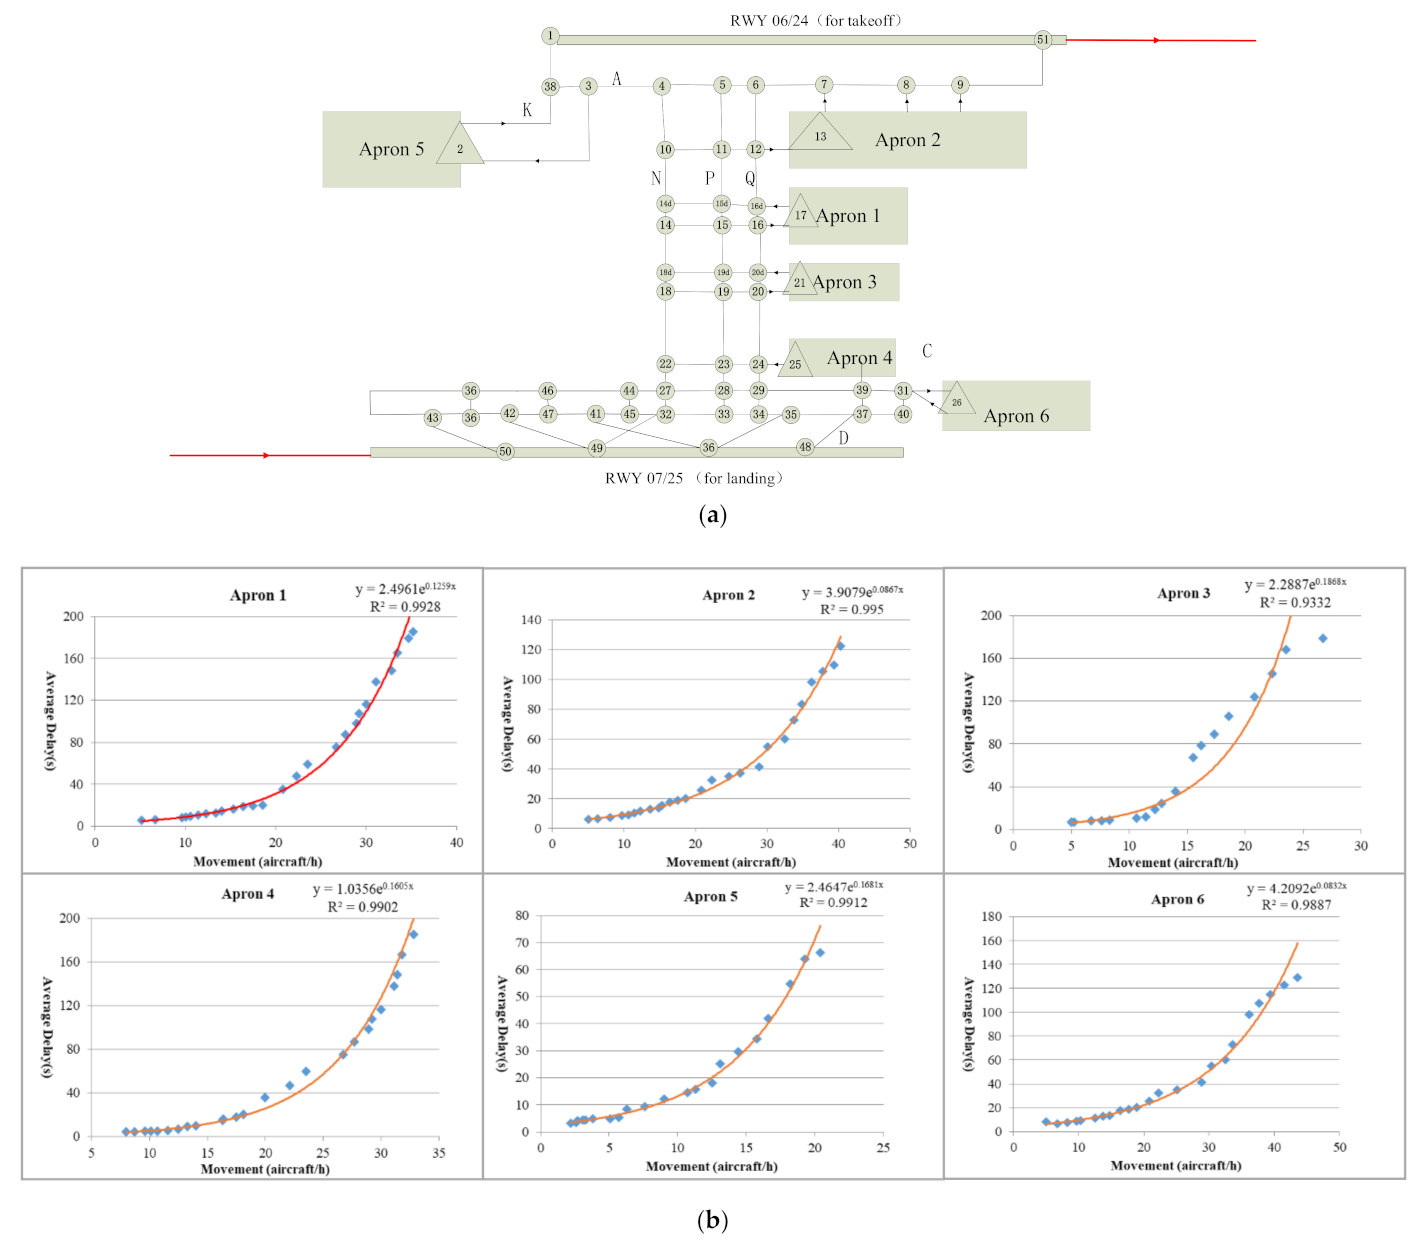
Complex apron structure results in significant potential conflicts during pushback, taxi-out, and taxi-in. The apron sectorization aims to minimize the inter-influence between areas. The relationship between the traffic volume (i.e., number of aircraft moving or holding at some positions due to apron congestion) and the average delay within the apron area can be measured based on historical data and well-calibrated commercial fast-time simulation, as shown in Figure 2b. The Apron Congestion Cost (ACC) is then given as follows.
Definition 4.
(Apron Congestion Cost). It refers to the total time that the traffic flow travels within an apron area considering the pushback and taxiing conflict during a unit time slice , denoted as , where is the total unimpeded travel time within the apron area, n is the active traffic volume, and is the average delay of apron area operation.
In summary, the total congestion cost of traffic flow on an airport surface is simply the sum of RCC, TCC, and ACC, denoted as . Its physical meaning is the aircraft travel time with the accumulation of runway takeoff and landing delays, taxiing time, and operation time in apron area, which can be approximated as the total taxiing time of all flights. The aim of proposed MPSTR generation method is to minimize the total congestion cost for various traffic scenarios.
3. MPSTRs Generation Based on Dynamic Traffic Flow Assignment
The aim of airport MPSTR planning is to establish a moderate scale, safe, and efficient STR set that achieves a balance between taxiing flexibility and control complexity. Traditional taxiing route optimization focusing on tactical operations should consider the specific spatial location of a flight and its associated conflicts with uncertainties (e.g., landing time, pushback time, and taxiing speed). However, due to the weakening effect of the decision-making lead time on the prediction accuracy of uncertainties, STR planning at the strategic level does not concentrate on individual flight characteristics. Rather, it is a more robust and efficient way to characterize the macroscopic congestion dynamics emerging from group interactions within the airport surface network from the perspective of generalized costs, as defined above. With this concept, the K shortest paths (KSPs) search algorithm is used in this section to generate candidate route sets of effective taxiing routes between any runway and apron area. Furthermore, based on the historical flight plan and runway and gate allocation information, a system-optimal traffic assignment model is established to identify the spatial and temporal distribution of network traffic flow corresponding to the lowest congestion cost, in order to extract prevalent routes from KSPs and establish the MPSTR set at the airport.
3.1. KSPs Search between Runways and Aprons
The aim of the KSP problem is to find the K shortest paths between the origin and destination points of the network [47]. In this paper, based on apron sectorization, the origin and destination point of a departing flight is simply defined as the exit point of the apron areas and the departure runway threshold, respectively. For an arrival flight, its taxiing path starts at the vacated point of the landing runway and ends at the entry point of the assigned apron. To ensure a safe and smooth surface operation, fundamental taxiing rules, the regulated link direction especially should be followed when constructing the K shortest paths. Thus, the determination of the candidate set of taxiing routes is a search for K acyclic shortest paths connecting any OD pair in a directed and edge-weighted non-negative network defined as , where V is the set of nodes and E is the set of directed edges. The number of nodes is denoted as and the number of edges is denoted as . The edge of node pointing towards is denoted as , where , are the tail and head nodes of edge e, respectively. Each edge has a non-negative length, denoted as or . Then a path is simply defined as , where . The immediately preceding node of is denoted as , and the immediately following node of is . For example, , . When and only when there exists that results in , . The length of the route is denoted as . The sub-route of the subsequence to in route is denoted as , where . Moreover, the connection between routes is defined; i.e., the end point of route is the starting point of route , denoted as .
Definition 5.
(K-shortest paths). The constrained KSP problem can be represented as . Its aim is to find K paths from node to such that , , where is the other paths from node to within the network G.
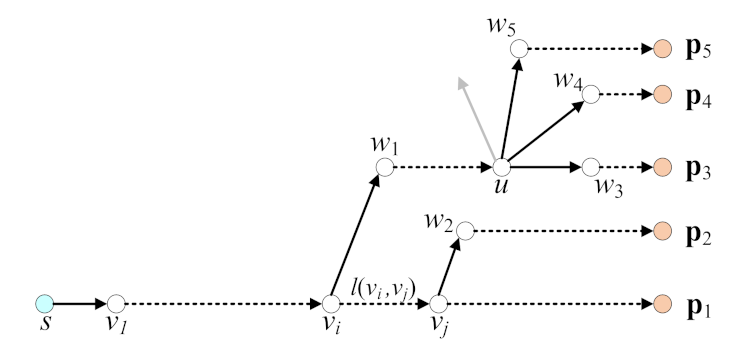
Let Q be the priority queue for storing candidate paths and T be the reverse shortest paths tree in network G with t as the root node. The path from node u to t in T is denoted as . For a given node , is the route length from node u to t. is the immediate subsequent node of node u in T, thus is an edge in T. Based on the above definition, Yen’s algorithm known as a classical and efficient method for solving these types of problems is adopted [48]. The straightforward computational steps are shown in Table 1 and Figure 4.
3.2. System-Optimal Traffic Assignment (SOTA) in the Surface Network
3.2.1. Model Assumptions
Based on the generalized congestion cost of traffic flow and the KSPs of each OD pair in the surface network, we adapted the system-optimal traffic assignment (SOTA) model to identify the optimal flow spatial distribution and prevailing taxiing routes using the historical flight demand of the airport. To simplify the problem, the following assumptions were made for modeling.
- (1)
- Runway and apron assignment information is acquired from the historical flight plans.
- (2)
- Taxiing routes can be selected only from the KSPs based on the assigned runway and apron.
- (3)
- Only the network between the runway and the entry/exit point of each apron area is examined.
- (4)
- Optimization is implemented at the macroscopic level, without considering the specific conflict during taxiing.
3.2.2. Symbol Description
| Set of taxiway links. | Traffic flow assigned to the link . | ||
| Set of nodes of the airport surface network, . | The average velocity function of taxiway link . | ||
| Set of the origin points of the airport surface network. Each origin point presents the exit of the runway or the exit of the apron. | The length of the link . | ||
| Set of the destination points of the airport surface network. Each destination point , presents the entrance to the apron or the runway threshold. | The congestion cost function of taxiway link . | ||
| Set of departing flights, is the total number of departing flights in the time window. | The set of aprons. Each apron is denoted as . The total number of aprons is . | ||
| Set of arriving flights and the total number of landing flights during the time window. | The number of active flights of apron g during the time window. | ||
| Departing flights, . | The average delay time function for apron operations. | ||
| Arriving flights, . | The average unimpeded travel time within apron area g. | ||
| Set of available runways, . | The set of taxiing routes for the OD pair (o-s). | ||
| Runway congestion cost function. | The kth taxiing route for the OD pair (o-s). | ||
| Number of inbound flights assigned to runway r. | Traffic demand for the OD pair (o-s). | ||
| Number of departing flights assigned to runway r. | If the taxiway link is on the kth taxiing route of the OD pair (o-s), the value is 1; otherwise, the value is 0. |
3.2.3. Decision Variables
The aim of traffic assignment is to improve the overall operational efficiency on airport surface by optimizing the spatial distribution of traffic flows within a certain time window. Therefore, the decision variable is defined as representing the traffic flow assigned to the kth path of the OD pair (o-s) within a certain time window. Based on the decision variables, the number of landing and departing flights at any runway r and the number of flights in apron g can be expressed as follows:
3.2.4. Objective Function
The objective of the network air traffic assignment is set as system optimum in this paper. In other words, based on the definitions of the runway, taxiway, and apron congestion costs described in Section 2.1, Section 2.2 and Section 2.3, the aim is to minimize the total cost of surface congestion within the specific time period, as shown in Equation (9).
where the runway congestion cost function is related to the runway configuration (e.g., amount, operating mode), thus the runway congestion cost is denoted by for general simplification expressing the total runway delay caused by landing and departing flow combination for a certain type of runway configuration; the taxiway congestion cost function can be simply derived from Section 2.2.
3.2.5. Constraints
Conservation constraints need to be established for the flow within links, paths, and ODs to ensure the numerical rationality of the macroscopic traffic flow distribution on the airport surface. These constraints mainly include:
- (1)
- Non-negative constraint
The traffic flow assigned to any taxiing route k is not less than 0.
The traffic flow assigned to any link is not less than 0.
- (2)
- Flow conservation constraint
OD flow conservation: The total number of flights on any OD pair shall be equal to the sum of the flights assigned to all K paths on that OD pair.
Flow conservation at origin and destination: The inbound and outbound traffic flows at runways and apron areas are conserved; i.e., the total runway takeoff and landing flows are equal to the total inbound and outbound flows in the aprons.
- Path flow conservation: This means that for any o-s, the flow assigned to each taxiing route is conserved to ensure the consistency of taxiing.
- Link flow conservation: This ensures that the number of flights flowing in from node i on taxiway link is equal to the number of flights flowing out from node j.
- (3)
- Path capacity constraint
Assuming the homogeneity of taxiing network, the jam density can be obtained based on the fundamental diagram of taxiing traffic flow at link level. Then the flow allocated to any link should satisfy
In summary, the dynamic traffic assignment model of airport surface network with the objective of minimizing the total cost of operational congestion can be written as
3.2.6. Algorithms
The proposed SOTA model is a typical multi-OD traffic assignment problem [50]. The Frank–Wolfe algorithm [51] is one of the most classical algorithms in solving such kind of problems, which transforms a nonlinear planning problem into a series of linear sub-problems with the same constraints showing unique advantages for solution accuracy and efficiency. However, the traditional Frank–Wolfe algorithm is link-based, which is not appropriate for solving path-based optimizations. To this end, an improved Frank–Wolfe algorithm was adapted without changing the structure of the original algorithm by introducing variables and representing the traffic flow assigned to path k between o-s, and the set of paths between o-s that has been assigned flows, respectively.
The path flow update is the key feature of the improved Frank–Wolfe algorithm in this study. Let be the current shortest path during nth iteration, then the flow on route is corrected according to the descent step , i.e., the flow is added to the original flow on path , while the flow is reduced from the original flow on the other paths in except for , so that the total flow between o-s remains . For any route k in , the flow after n iterations is denoted as . Therefore, the path flow update is as shown in Equation (18). The steps of the improved Frank–Wolfe algorithm are in Table 2, which return the optimal traffic flow distribution on the candidate K shortest paths.
4. Case Study
Taking Nanjing Lukou International Airport (ZSNJ) operating in separated runway configuration as an example, we calibrated the congestion cost functions of the runways, aprons, and taxiways by applying historical operation data and AirTOp [39]. Based on the optimal flow distribution in the taxiway network, we established a MPSTR set considering both flexibility and feasibility, validated through a Human-In-The-Loop experiment using a tower simulator to investigate the influences of the MPSTRs on the controller’s subjective cognition and operational performance.
4.1. Data
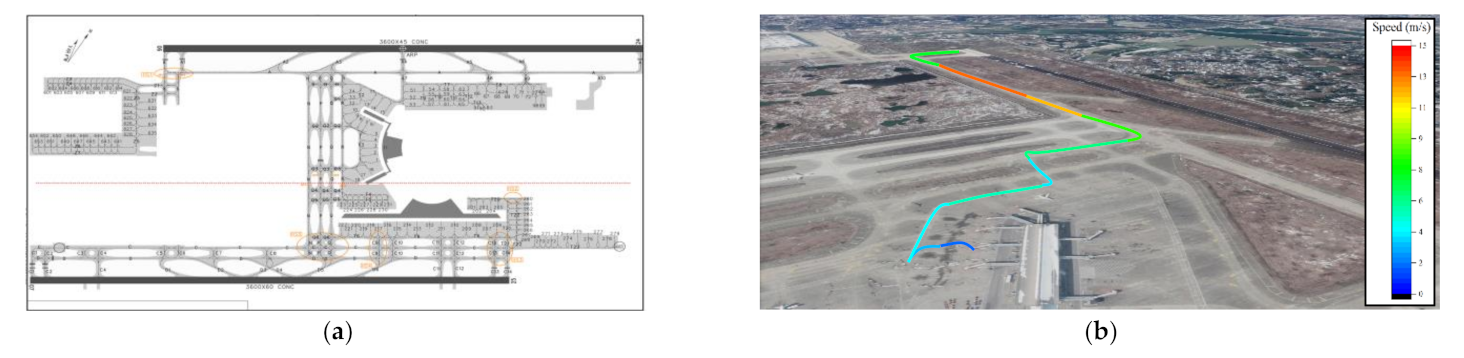
The basic data used in this study could be divided into four categories: physical structure, surface operation rules, historical flight plans, and surface surveillance data. (1) The physical structure mainly includes the airside network structure and the topological relationship, which served as the basis for the simulation and network traffic assignment, as shown in Figure 5a. (2) Surface operation rules mainly include the runway operation mode, taxiing rules, apron usage rules, minimum safety separation during take-off, landing, and taxiing. For this study, only eastward operation under segregated runway configuration was considered. Flights take off on Runway 24 and land on Runway 25. Taxiways N, P, and Q operate in a single direction from south to north. Flights on taxiway C are only permitted to taxi from east to west while taxiway D operates in the opposite direction. (3) The historical flights from June 2017 to May 2018 were used as the basic data in this study, including the flight number, aircraft type, parking position, departing/landing runway, scheduled and actual in-block/off-block time, and actual take-off and landing time. (4) The surface surveillance radar recorded 4D trajectory data (4-DTD) of each flight, which is an ordered sequence of 4-tuples representing the position (longitude, latitude, height) and time, and with a time step size of 15 s. The data on 11 October 2017 were collected. The taxiing speed and heading profile of each aircraft can be constructed. For example, Figure 5 illustrates the speed and heading profiles of a particular aircraft. The 4-DTD were utilized to establish the fundamental diagram of taxiing flow.
4.2. Calibration and Verification
4.2.1. Verification of Baseline Simulation Environment
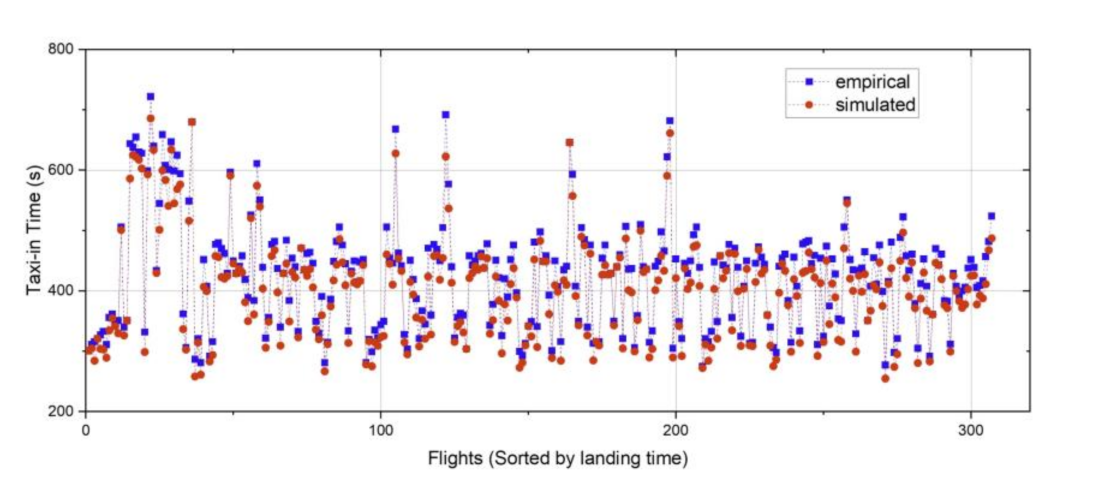
A fast-time simulation of surface operation of ZSNJ was developed based on AirTOp software. Using historical flight data and surface trajectory data on 11 October 2017 as the reference, we iteratively verified the settings of the simulation environment by examining the simulated taxiing time error with the input of actual landing time, pushback time, gate position, and taxiing route. Figure 6 shows the accuracy of the simulation. The average absolute error of the taxiing time was 51 s, with that of the taxiing time for arrival and departure being 34 and 68 s, respectively. This shows high and acceptable accuracy [52] and a convincing basis for further calibrating the congestion cost functions of the runways and aprons.
4.2.2. Calibration of Congestion Cost
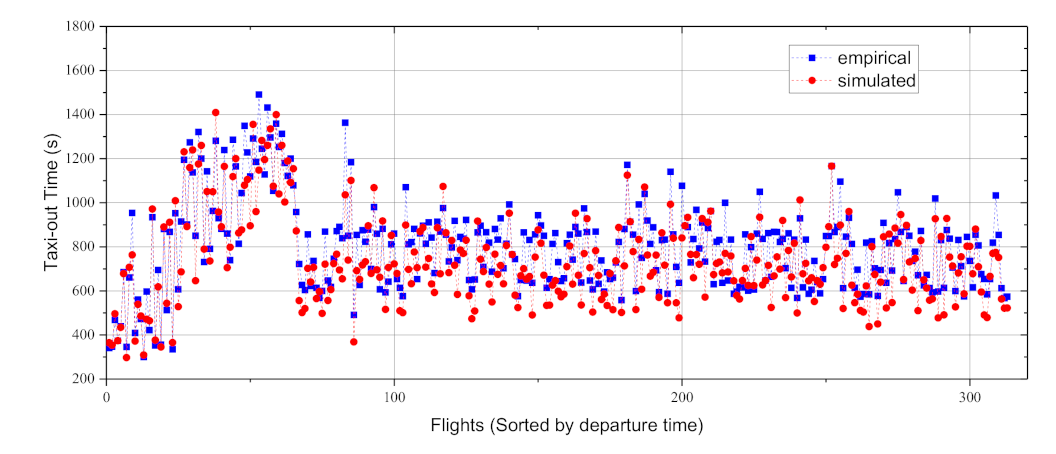
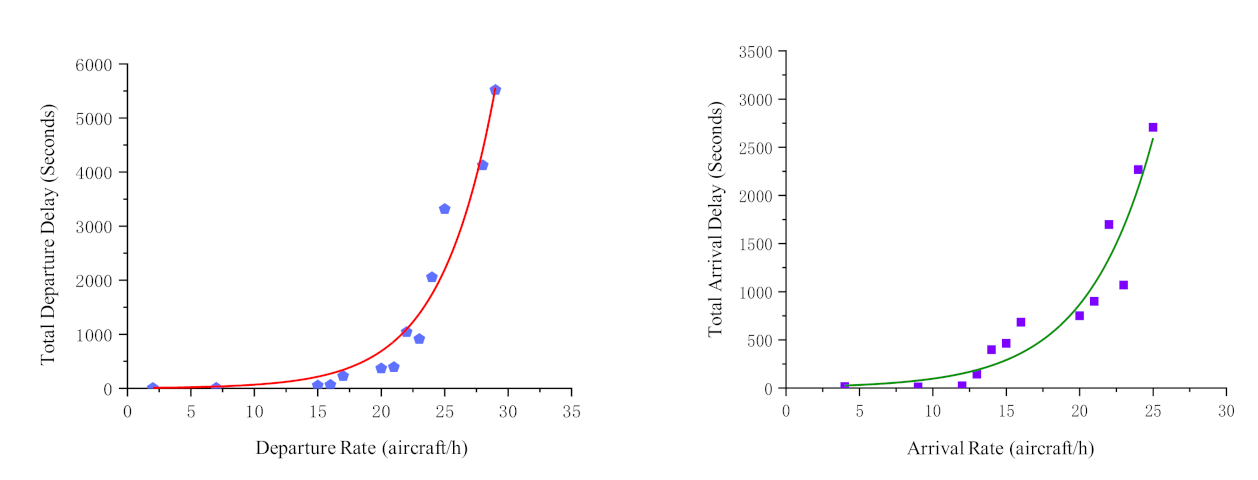
Runway congestion cost function: Through randomly increasing the traffic demand, the runway congestion cost functions (see Figure 7) were calibrated using the AirTOp simulator by exponential fitting (r_dep = 0.973, r_arr = 0.932), which illustrated the relationship between the flight delay and runway throughput for the departures and arrivals, respectively.
Taxiway congestion cost function: According to Section 2.2, the key to calibrating the taxiway congestion cost function was to create a fundamental diagram of the taxiing traffic flow. Based on the surface surveillance data from 11 October 2017, the fundamental diagram of the taxiway traffic was modeled (see Figure 8) similar to the previous studies in [1].
Apron congestion cost function: The aprons were divided into six areas (see Figure 9a) based on the method described in Section 2.3.2. The fast-time simulations were run to estimate the taxiing delay of flights in each apron area under different level of demand, thereby fitting the apron congestion cost functions (see Figure 9b).
The rationality and accuracy of the individual congestion cost in subsystems also needed to be verified from the perspective of global operation. We replaced the KSPs with the fixed taxiing routes that were currently in use. The SOTA then degenerated into a macroscopic simulation model of airport surface traffic flow. Based on the historical flight plan from June 2017 to May 2018, we calculated the average taxiing time of the flights, that is, the ratio of the total cost of surface operation to the total number of flights (see Table 3), which seems to be able to accurately simulate the aggregated traffic operation on the airport surface. The macroscopic simulation not only verified the accuracy of surface traffic characteristics analysis and the congestion cost calibration, but also further served as a comparison benchmark for the subsequent optimization of the taxiing flow.
4.3. Extraction of Multi-Path Standard Taxiing Routes
4.3.1. K-Shortest Paths Generation
In the segregated mode with runway 06 for take-off and 07 for landing, the K-shortest paths were generated based on the aforementioned basic taxiing rules. The maximum K value was set to 6. As shown in Appendix A, a total of 52 taxiing routes were generated. In particular, only one shortest taxiing route could be established since the taxiing route from the runway exit (Node 36) to Apron 6 (Node 26) was limited by the geographical location of the apron and the number of taxiways. For the departure taxiing from Apron 4 (Node 25) to the runway threshold (Node 1), nine taxiing routes could be established. Although the length of each of the nine taxiing routes was 3043 m, there were significant differences between the routes when it came to the number of turns, providing more feasible solutions to surface traffic scheduling. Figure 9a shows the physical space corresponding to the node numbers.
4.3.2. Prevailing Routes Analysis
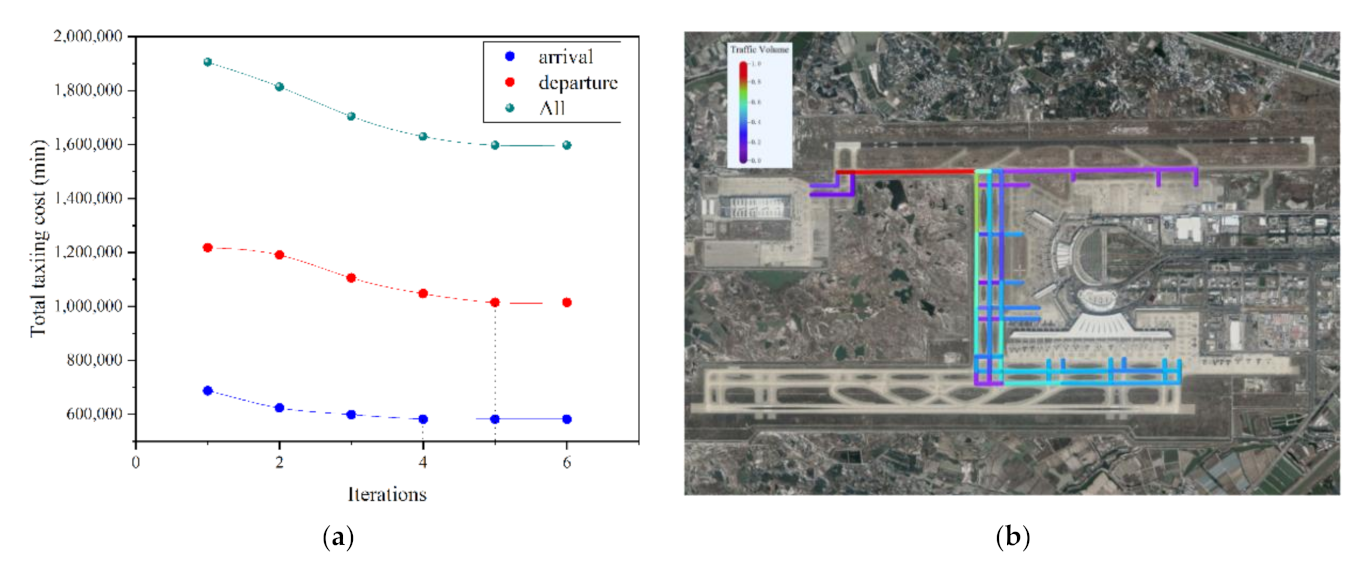
The dynamic variation of air traffic patterns may influence the extraction of prevailing routes for the optimal traffic assignment. Though the flight plan circulates on a weekly basis, considering the volatility of the deviation between the actual and planned time in daily operations, we needed to include as many historical traffic features as possible when constructing a reliable MPSTRs set. Therefore, based on the historical flight plan of Nanjing Lukou International Airport from June 2017 to May 2018, with system optimality as the objective, the traffic assignment in the taxiway network was optimized with the premise of KSPs. Figure 10a shows the iterative process of the optimal total cost of surface operation. The results indicated a rapid convergence. After optimization, the average arrival congestion cost was 5.32 min, and the average departure congestion cost was 9.27 min, with an increase of 18.96% and 16.37% in the taxi-in and taxi-out efficiency, respectively.
Figure 10b and Figure 11 show the optimal flow distribution in the taxiway network. For arrival, due to the control of the landing interval and the one-way operation of the main taxiway, the interactions between the arriving aircraft were comparatively weak during the taxiing. In this case, the unicity of the taxi-in route may also effectively reduce the taxiing conflict between the arrivals and departures. Hence, taxiing along the shortest paths for the arrivals (≥89%) had the absolute advantage. The departure taxiing flows converged towards the runway from different aprons, and this helped to alleviate the congestion hotspots for the fixed path by dynamically adjusting the taxiing routes. Therefore, the departure flows were distributed in a relatively balanced way in the network.
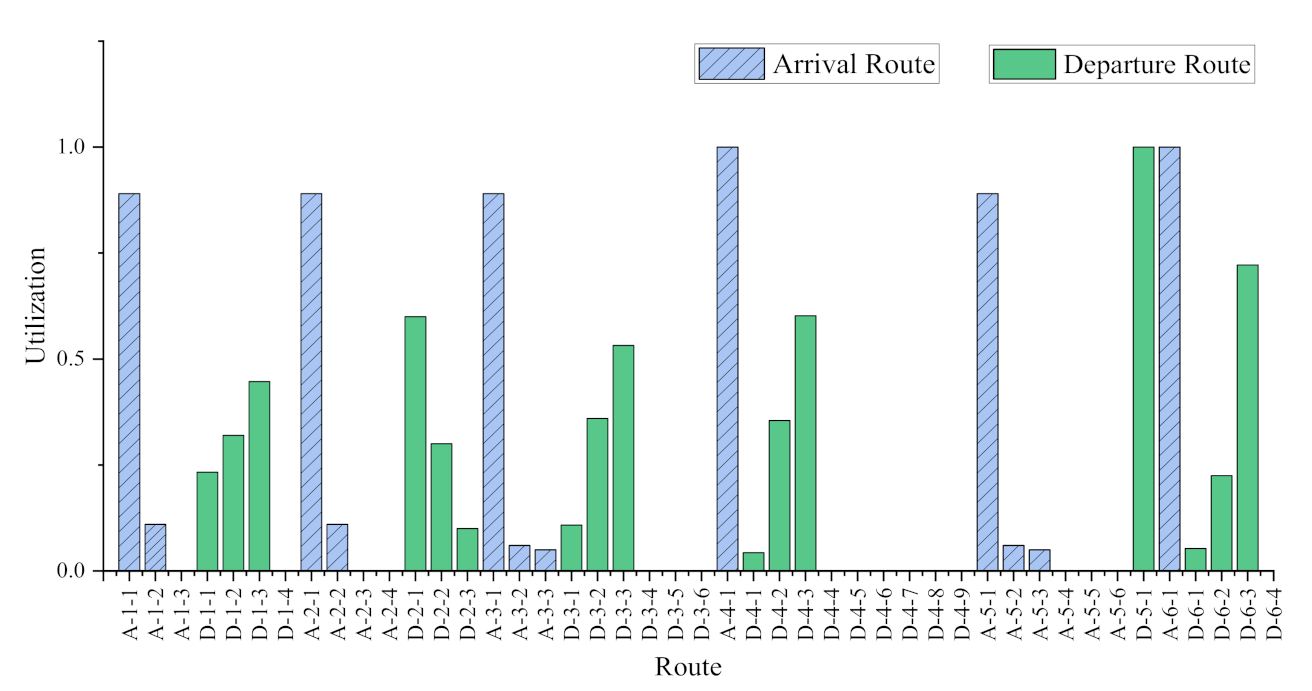
The key to establishing the MPSTRs set was to extract the prevailing routes with the premise of system optimality. Two principles, i.e., prevalence and conciseness, had to be taken into consideration. Prevalence means that a route should be frequently used; conciseness means that the total number of standard routes corresponding to an OD pair should not be too large, because without automated decision-making systems, taxiing scheduling with too many available routes (i.e., solution space) might increase the controller’s cognitive workload, weaken their situation awareness of the surface operation, and even affect their determination to adopt the dynamic routing strategies. Based on the current utilization rate of taxiing routes, for each apron, the size of MPSTRs to achieve an optimal cost is less than 4, and the minimum utilization rate reaches 4.3%. To further verify the feasibility of removing taxiing routes used less frequently, three routes with a utilization rate of lower than 5% were deleted, and the SOTA was re-run based on the same historical data. The results showed that the average taxiing time of flights increased by 7.4% during the period when the low-frequency taxiing routes were used, which implied that the identified low-frequency routes significantly influenced the improvement of the operating efficiency in some specific traffic scenarios. Hence, after weighing the size of the route set and its operating efficiency, we kept the low-frequency taxing routes. The complete MPSTRs are shown in Figure 11.
4.4. The Supplementary HITL Experiment for Analyzing Operational Performance Using MPSTRs
According to the above discussions, compared with fixed taxiing routes, the optimal route assignment based on the KSPs was theoretically more effective in improving the overall operational efficiency. However, without highly automated decision-making aids, the controller’s acceptance of using MPSTRs, and the role played by the controller in improving taxiing flexibility and efficiency during actual operations, especially the impact of route selection on the controller’s workload, remain to be further verified. As described in this section, we used a high-fidelity commercial tower simulator to carry out a Human-In-The-Loop (HITL) experiment to investigate the possible influences of the MPSTRs on the ATC workload, operational efficiency, and safety.
4.4.1. Experiment Setup
Simulation Tool
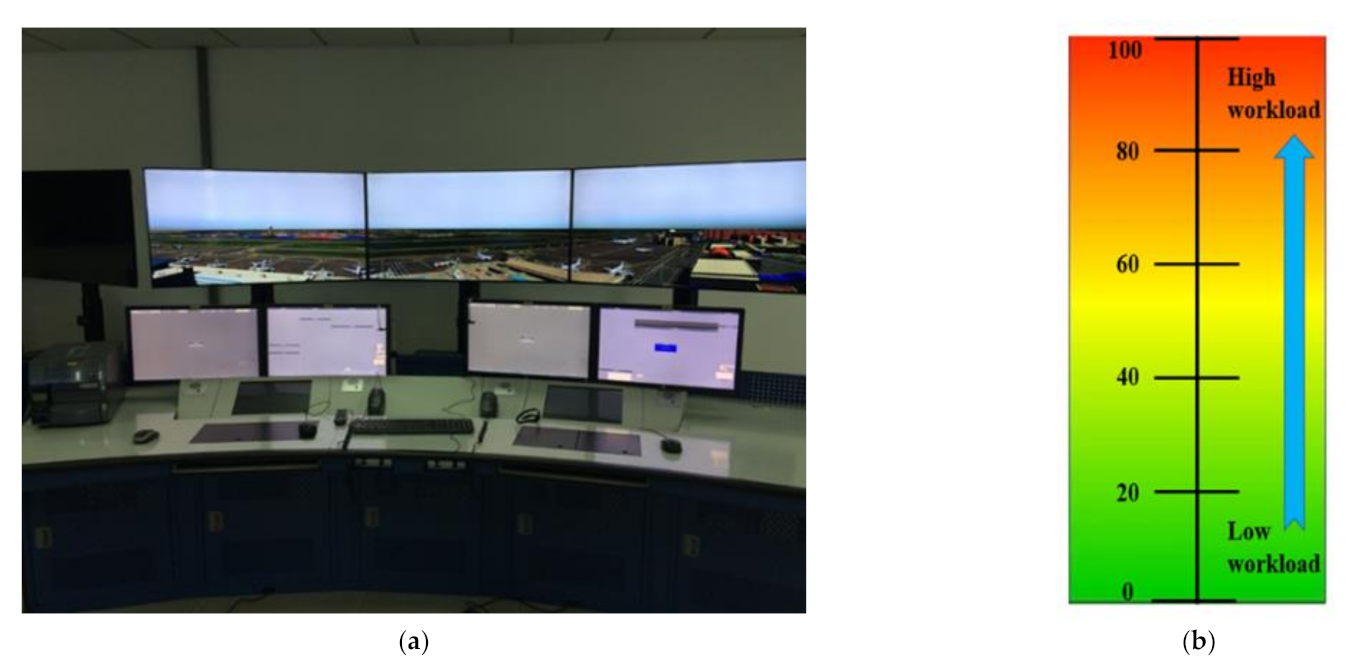
The tower simulator developed by China Electronics Technology Group Corporation [53] was used in this experiment to model and simulate the layout of airport runways, the layout of fixed buildings, the lighting effects, surface vehicle movement, flight movement, meteorological conditions, temporal and seasonal changes, and to generate a 3D view of the airport surface from the tower’s perspective and simulate the traffic situation on the airport surface and in the surrounding airspace (see Figure 12a). The simulator is capable of customizing the simulated tower control scenarios and supporting the controllers to monitor and guide the aircraft push-back, taxiing, take-off, and landing in various conditions.
Subjects
Ten tower controllers from Jiangsu Air Traffic Management Bureau (ATMB) participated in the experiment. The work experience of these controllers varied from two to ten years. Before the experiment, the subjects completed ten exercises of different complexity levels to eliminate the learning effects. Each exercise involved two types of routing strategies, i.e., fixed routes and MPSTRs. Only after the subjects confirmed that they were thoroughly familiar with the experimental tools and operation rules could they proceed to the formal testing.
Independent Variables
Two types of independent variables were defined in the experiment: (1) Traffic scenarios: arrival peak-hour (A), departure peak-hour (D), and balanced demand (AD); and (2) taxiing routes: the currently used fixed taxiing route and the MPSTRs established in this study.
Simulation Scenario
We selected three typical peak-hour traffic scenarios from the historical flight plan during June 2017 to May 2018, with each scenario lasting for two hours. The simulator drove the real-time simulation based on the input data of the flight plan, runway operation mode, and gate allocation, etc. We adopted a within-subjects design in the experiment, and the six types of experimental scenarios were arranged in different orders using Latin Square. It should be noted that to eliminate the impact of memory, the experiment was divided into two phases with a time interval of one week. The same subject was not involved in the same traffic scenario within the same experimental phase.
Dependent Variables
- (1)
- Subjective workload. A one-dimensional rating scale named as Rating Scale Mental Effort (RSME) that asks for the amount of effort that has been invested during task performance [54] was used to evaluate the subjective workload. At the end of each scenario, subjects were asked for a direct assessment of the mental load that they had experienced by putting a marker on a vertical scale, as shown in Figure 12b.
- (2)
- Taxiing time. The taxiing time, defined as the operating time of the flight between the gate and the runway, reveals the overall efficiency of the airport surface operation, which is consistent with the definition mentioned above.
- (3)
- Potential conflict. The simulator recorded the number of potential conflicts between flights during the surface operation. This conflict was manifested as a complete or intermittent stop of the flights. It should be pointed out that the intermittent stops of the departure flights in the runway queue were not regarded as conflicts.
- (4)
- Number of commands. In the experiment, the controllers sent relevant commands to the flights through screen operations and the system recorded the number of mouse and keyboard operations as a supplement to the controller’s subjective workload.
4.4.2. Results
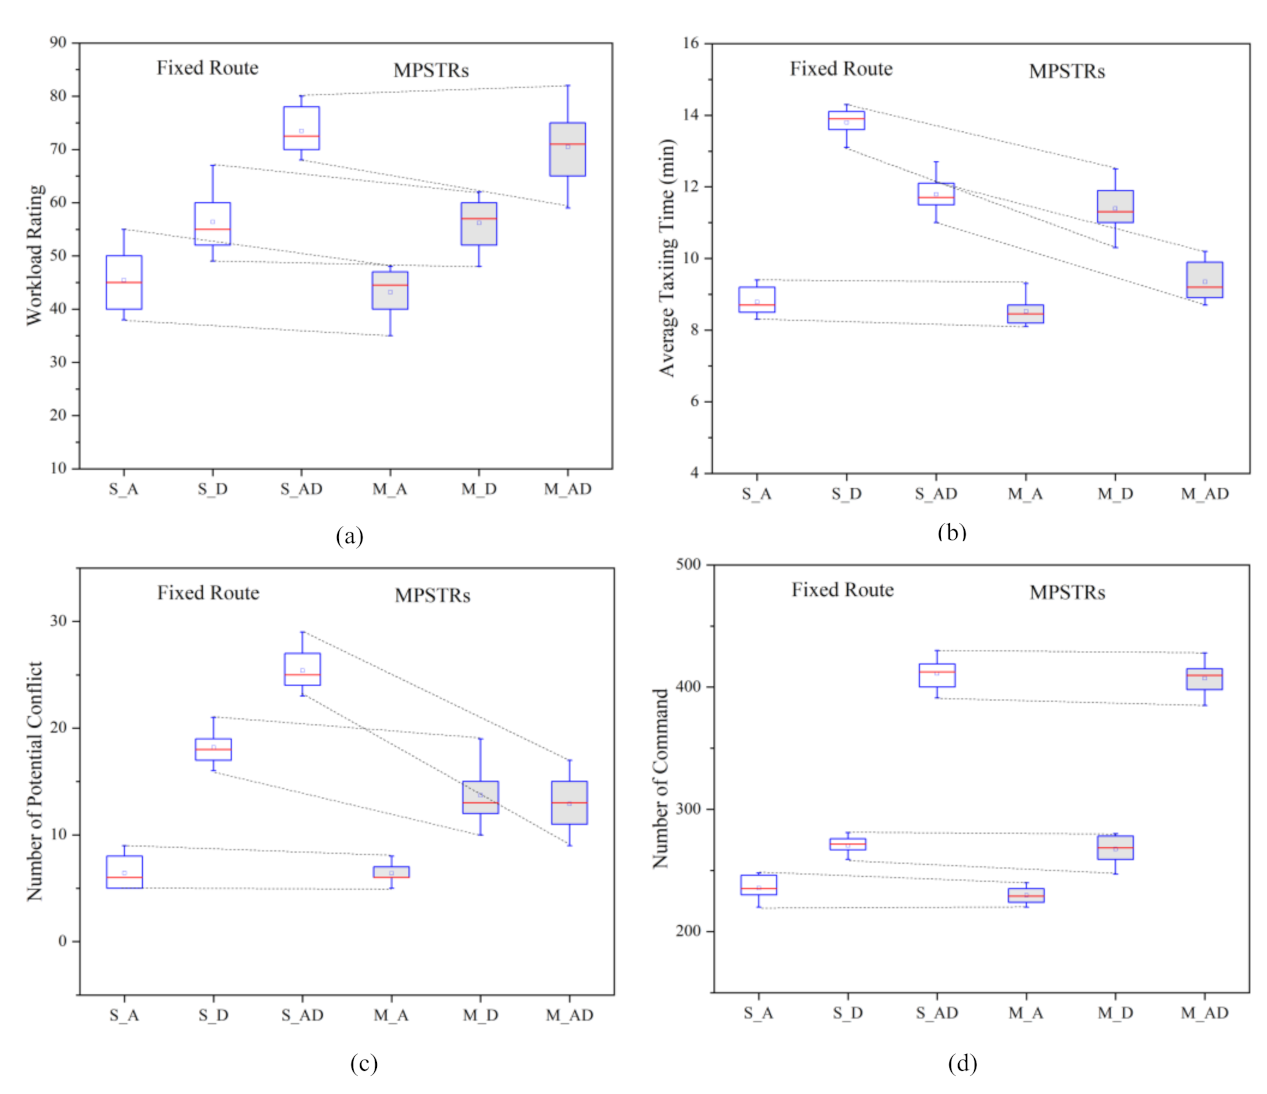
The dependent measures for the workload (RSME rating and Number of Commands) and the operational efficiency (Average Taxiing Time and Number of Potential conflict) are shown as box plots in Figure 13. None of the measures satisfied normality with the Shapiro–Wilk test or the homogeneity of variance with Levene’s test. The fact that the samples in different scenarios could be related also needed to be considered. For example, the workload ratings of the same subject for later scenarios may be related to those given in former scenarios. To account for these concerns of non-normality and the dependence of our data, we selected the more conservative Friedman test to analyze our data [55]. The significant results are shown in Table 4.
RSME Rating
The RSME ratings reflected the overall workload perceived by the subjects in each experiment. According to the results of the Friedman tests, for the two route use strategies, significant differences were found in the controller’s workload in different peak traffic scenarios (p < 0.001). For the fixed-path taxiing strategy, the controller’s average workload in balanced demand scenarios was 28.9 (p = 0.001) and 17.1 (p = 0.042) higher than those during arrival and departure peak-hour, respectively. However, no significant workload differences between arrival and departure peak-hour scenarios (p < 0.001) were observed. For the MPSTRs strategy, significant differences were found between any two different traffic scenarios. Furthermore, the pairwise comparisons for the same traffic scenario showed that different routing strategies did not lead to significant differences in the controller’s workload (p = 1.00) in the three traffic scenarios. In other words, when implementing the dynamic routing strategy based on the MPSTRs, the subjects did not perceive significant workload rise or decrease as a whole. Nevertheless, it should be noted that the workload is usually composed of visible workload and mental workload [56]. The drop of the number of potential conflicts (see Figure 13c), which is commonly recognized as a main factor contributing to the task and mental load, restrains the growth of the overall workload when using the MPSTRs strategy. It implied that without the support of automated decision-making tools, the MPSTRs strategy will put extra cognitive workload for the controllers.
Number of Commands
The number of commands reflected the frequency of instructions and equipment operations by the subjects during the experiment, which was the primary constituent of the visible workload. The results of the Friedman tests showed that for each type of routing strategy, similar to the workload features, there were significant differences in the number of commands applied in different peak-hour traffic scenarios (p < 0.001), which was mainly caused by traffic volume difference. Based on the pairwise comparisons, it was found that there was no significant difference in the number of commands generated by using different routing strategies in the same traffic scenario (p ≈ 1.000). Especially in the balanced demand scenario, when the potential taxiing conflict significantly declined (p = 0.009), as shown in Figure 13c, the undifferentiated number of commands implied that the MPSTRs-based dynamic route planning would increase the number of control commands to some extent.
Number of Potential Conflicts
The potential taxiing conflict reflects the safety level of flight operations on the airport surface. Based on the results gained in the Friedman tests, for the fixed-path taxiing strategy, the average number of potential conflicts in the balanced demand scenario was 18.2 times (p < 0.001) and 6.8 times (p = 0.025) larger than those in arrival and departure peak-hour, respectively. However, for the MPSTRs strategy, the number of potential conflicts in the balanced demand scenario was only significantly higher than that in arrival peak-hour (p = 0.005) but was almost the same as that in departure peak-hour (p ≈ 1.000). According to the pairwise comparisons, only in the traffic scenario of balanced demand was the MPSTRs strategy able to significantly reduce the potential taxiing conflict by 48.4% (p = 0.028). Therefore, unlike the single traffic modes such as divergence or convergence during arrival or departure peak-hour, the more distributed traffic flow in the balanced demand scenarios was more likely to be optimized; that is, the MPSTRs would be more effective in improving safety when the arrivals and departures are highly interacted.
Average Taxiing Time
The average taxiing time reveals the macroscopic operational efficiency of flights on the airport surface. The Friedman tests showed that, for each type of routing strategy, the average taxiing time during departure peak-hour was significantly longer than that during arrival peak-hour and balanced demand period (p < 0.001), which was consistent with the historical taxiing data. The pairwise comparison results showed that with the MPSTRs strategy, the average taxiing time during arrival peak-hour was reduced by 0.25 min (p = 0.153), the average taxiing time during departure peak-hour was shortened by 2.41 min (p = 0.002), and that in balanced demand period decreased by 2.44 min (p = 0.001), which verified that the MPSTRs strategy still had significant potential in improving the taxiing flexibility and efficiency despite the human decision-making approach.
5. Conclusions and Future Work
Multi-Path Standardized Taxi Routes (MPSTRs) are a promising approach to balancing the safety and efficiency for STR-based taxiing operation and flexible routing optimization, as well as future autonomous aircraft taxiing without substantial investment. This paper proposed a holistic approach in order to generate efficient alternative taxiing routes with a moderate scale, starting from a macroscopic traffic flow assignment based on the generalized congestion cost of runways, taxiways, and aprons. Microscopic HITL experiments using a high-fidelity simulator were implemented to validate the comprehensive effect of MPSTRs on air traffic control operations. In the following, our main conclusions, some potential applications, and future work are stated.
5.1. Main Conclusions
Fundamental diagrams characterizing the evolution of traffic flow congestion were established for the runway, taxiway, and apron subsystems, which were used to define the congestion cost function of the operations on the airport surface. Based on the KSPs, a taxiing route optimization method was proposed based on system-optimal traffic assignment, which achieved the optimal spatial-temporal distribution of the air traffic flow with the lowest congestion cost in the taxiway network. The established MPSTRs could theoretically improve the taxiing efficiency by more than 16%.
A Human-In-The-Loop experiment was designed, and the following conclusions were obtained: (1) In the same traffic scenario, the MPSTRs strategy was able to improve the taxiing safety and efficiency without increasing the controller’s workload. (2) Due to the variety of traffic situation complexity, the MPSTRs strategy was more advantageous during the departure peak-hours and arrival-departure balanced scenarios. (3) During the balanced demand period, the application of the MPSTRs strategy would increase the number of commands. Although there was no significant difference in the overall workload felt by the subjects, the individual workload showed great fluctuation. Similarly, this individual difference was also reflected in the taxiing time. Therefore, the necessary measures for reducing the controller’s workload and enhancing the stability of the positive effect are to optimize the operation specifications and regulations (e.g., simplifying the routing instructions by publishing MPSTRs via the AIP) and to provide Decision Support Systems.
5.2. Limitations and Future Work
Although the trade-off between efficiency and quantity was considered while extracting the MPSTR set from the optimal distribution of the taxiing flow, the entire iterative method was not fully explained due to the less complex surface network topology. In fact, the best tradeoff between efficiency and quantity could be gained by replacing the KSPs with the optimal route set generated by the SOTA while gradually eliminating low-frequency routes to establish the correlation between the optimal cost and the available routes.
In addition, the spatial-temporal distribution of the traffic demands (e.g., landing/pushback time and runway/gate assignment) would significantly affect the planning of the standardized taxiing routes. Although the flight schedule is periodic and the prevailing routes were generated based on one-year historical flight data, special scenarios such as large-scale flight delays and deicing, etc., need to be taken into consideration in further research.
In view of the different characteristics between controllers in terms of workload and operational efficiency, a scenario-based taxiing route recommendation strategy could be further established to bring the operational effectiveness of MPSTRs into full play. Moreover, the proposed dynamic traffic assignment method would be a promising approach to solve large scale optimization problems of the integrated scheduling of airport surface operation [57], e.g., integrated “runway-taxiing route-gate” assignment enhanced by dynamic departure pushback and landing time optimization, in both normal and abnormal conditions.
Author Contributions
Conceptualization, L.Y. and Z.Z.; methodology, L.Y. and F.L.; software, S.W.; validation, L.Y., Z.Z., and S.W.; formal analysis, L.Y.; investigation, S.W.; data curation, Z.Z.; writing—original draft preparation, L.Y., S.W., and F.L.; writing—review and editing, L.Y. and Z.Z.; visualization, S.W. and F.L.; supervision, L.Y.; project administration, L.Y.; funding acquisition, L.Y. All authors have read and agreed to the published version of the manuscript.
Funding
This research was funded by the National Natural Science Foundation of China (Grant No. 61903187), Natural Science Foundation of Jiangsu Province (Grant No. BK20190414).
Institutional Review Board Statement
Not applicable.
Informed Consent Statement
Not applicable.
Data Availability Statement
Not applicable.
Conflicts of Interest
The authors declare no conflict of interest.
Appendix A. The KSPs List
This appendix is the list of the K-shortest paths of Nanjing Lukou Airport. Each path is present by a sequence of numbers, which are the taxiway nodes as shown in Figure 9.
| Apron | K Value | Name | Path | Distance (m) |
| Taxi-in Routes | ||||
| 1 | 3 | A-1-1 | 34-29-24-20-16-17 | 1253 |
| A-1-2 | 33-28-23-19-15-16-17 | 1393 | ||
| A-1-3 | 32-27-22-18-14-15-16-17 | 1543 | ||
| 2 | 4 | A-2-1 | 34-29-24-20-16-12-13 | 1983 |
| A-2-2 | 33-28-23-19-15-11-12-13 | 2167 | ||
| A-2-3 | 33-28-23-19-20-16-12-13 | 2075 | ||
| A-2-4 | 32-27-22-18-14-10-11-12-13 | 2075 | ||
| 3 | 3 | A-3-1 | 34-29-24-20-21 | 976 |
| A-3-2 | 33-28-23-19-20-21 | 1169 | ||
| A-3-3 | 32-27-22-18-19-20-21 | 1068 | ||
| 4 | 1 | A-4-1 | 35-37-39--25 | 934 |
| 5 | 6 | A-5-1 | 34-29-24-20-16-12-6-5-4-3-2 | 3738 |
| A-5-2 | 33-28-23-19-15-11-5-4-3-2 | 3738 | ||
| A-5-3 | 32-27-22-18-14-10-4-3-2 | 3545 | ||
| A-5-4 | 33-28-23-19-15-14-10-4-3-2 | 3646 | ||
| A-5-5 | 33-28-23-19-15-11-5-4-3-2 | 3646 | ||
| A-5-6 | 33-32-27-22-18-14-10-4-3-2 | 3738 | ||
| 6 | 1 | A-6-1 | 35-37-40-31-26 | 1753 |
| Taxi-out Routes | ||||
| 1 | 4 | D-1-1 | 17-16d-12-6-5-4-3-1 | 2035 |
| D-1-2 | 17-16d-15d-11-5-4-3-1 | 2035 | ||
| D-1-3 | 17-16d-15d-14d-10-4-3-1 | 2219 | ||
| D-1-4 | 17-16d-15d-14d-10-11-5-4-3-1 | 2237 | ||
| 2 | 3 | D-2-1 | 13-7-6-5-4-3-38-1 | 2111 |
| D-2-2 | 13-8-7-6-5-4-3-38-1 | 2761 | ||
| D-2-3 | 13-9-8-7-6-5-4-3-38-1 | 3036 | ||
| 3 | 6 | D-3-1 | 21-20d-16-12-6-5-4-3-1 | 2591 |
| D-3-2 | 21-20d-19d-15-11-5-4-3-1 | 2591 | ||
| D-3-3 | 21-20d-19d-18d-14-10-4-3-1 | 2591 | ||
| D-3-4 | 21-20d-16-15-11-5-4-3-1 | 2591 | ||
| D-3-5 | 21-20d-16-15-14-10-4-3-1 | 2591 | ||
| D-3-6 | 21-20d-19d-15-14-10-4-3-1 | 2591 | ||
| 4 | 9 | D-4-1 | 25-24-20-16-12-6-5-4-3-1 | 3043 |
| D-4-2 | 25-24-23-19-15-11-5-4-3-1 | 3043 | ||
| D-4-3 | 25-24-23-22-18-14-10-4-3-1 | 3043 | ||
| D-4-4 | 25-24-20-16-15-11-5-4-3-1 | 3043 | ||
| D-4-5 | 25-24-20-16-15-14-10-4-3-1 | 3043 | ||
| D-4-6 | 25-24-20-19-15-11-5-4-3-1 | 3043 | ||
| D-4-7 | 25-24-20-19-18-14-10-4-3-1 | 3043 | ||
| D-4-8 | 25-24-23-19-18-14-10-4-3-1 | 3043 | ||
| D-4-9 | 25-24-23-19-15-14-10-4-3-1 | 3043 | ||
| 5 | 1 | D-5-1 | 2-38-1 | 531 |
| 6 | 4 | D-6-1 | 26-31-39-29-24-20-16-12-6-5-4-3-1 | 4617 |
| D-6-2 | 26-31-39-29--28-23-19-15-11-5-4-3-1 | 4617 | ||
| D-6-3 | 26-31-39-29-28-27-22-18-14-10-4-3-1 | 4617 | ||
| D-6-4 | 26-31-39-29-24-23-19-15-11-5-4-3-1 | 4617 | ||
References
- Yang, L.; Yin, S.; Han, K.; Haddad, J.; Hu, M. Fundamental Diagrams of Airport Surface Traffic: Models and Applications. Transp. Res. Part B 2017, 106, 29–51. [Google Scholar] [CrossRef]
- Tremaud, M. Erasing Confusion. Aero Saf. World 2010, 5, 14–19. [Google Scholar]
- Federal Aviation Administration. Standardized Taxi Routes(STR). Order 7110.116; U.S. Department of Transportation: Washington, DC, USA, 1999.
- Kristensen, A.; Andersson, S.; Matas, I.; Lane, R. Standard Airport Taxi Route Study; EUROCONTROL Experimental Center: Paris, France, 2009. [Google Scholar]
- Improving Efficiency: Hangzhou Airport Starts Implementing Standard Taxiing Route. Available online: http://www.caacnews.com.cn/1/5/201912/t20191204_1286864.html (accessed on 12 April 2019).
- Piazza, E. A-SMGCS routing and guidance functions. IEEE Aerosp. Electron. Syst. Mag. 2000, 15, 15–23. [Google Scholar] [CrossRef]
- Jakobi, J.; Teotino, D.; Montebello, P. Towards Higher-Level Services of an Advanced Surface Movement Guidance and Control System (A-SMGCS). Air Traffic Control Q. 2010, 18, 143–175. [Google Scholar] [CrossRef]
- Liu, Y.; Hansen, M.; Gupta, G.; Malik, W.; Jung, Y. Predictability impacts of airport surface automation. Transp. Res. Part C 2014, 44, 128–145. [Google Scholar] [CrossRef]
- Zhang, M.; Huang, Q.; Liu, S.; Li, H. Multi-objective optimization of aircraft taxiing on the airport surface with consideration to taxiing conflicts and the airport environment. Sustainability 2019, 11, 6728. [Google Scholar] [CrossRef] [Green Version]
- Corrigan, S.; Mårtensson, L.; Kay, A.; Okwir, S.; Ulfvengren, P.; McDonald, N. Preparing for Airport Collaborative Decision Making (A-CDM) implementation: An evaluation and recommendations. Cogn. Technol. Work 2015, 17, 207–218. [Google Scholar] [CrossRef]
- Böhme, D.; Brucherseifer, R.; Christoffels, L. Coordinated arrival departure management. In Proceedings of the 7th USA/Europe ATM R&D Seminar, Barcelona, Spain, 2–5 July 2007. [Google Scholar]
- Kjenstad, D.; Mannino, C.; Nordlander, T.E.; Schittekat, P.; Smedsrud, M. Optimizing AMAN-SMAN-DMAN at Hamburg and Arlanda airport. Proc. SID Stockh. 2013, 3, 1–6. [Google Scholar]
- Helm, S.; Classen, A.; Rudolph, F.; Werner, C.; Urban, B. Integration of landside processes into the concept of Total Airport Management. J. Air Transp. Stud. 2014, 5, 55–73. [Google Scholar] [CrossRef]
- Hall, W.D.; Fernandes, A. Key performance issues in surface collaborative decision making. In Proceedings of the 2013 IEEE/AIAA 32nd Digital Avionics Systems Conference (DASC), East Syracuse, NY, USA, 5–10 October 2013; pp. 1–15. [Google Scholar]
- Cheng, V.H.L. Surface operation automation research for airport tower and flight deck automation. In Proceedings of the 7th International IEEE Conference on Intelligent Transportation Systems, Washington, DC, USA, 3–6 October 2004; pp. 607–612. [Google Scholar]
- Cofer, D.; Amundson, I.; Sattigeri, R.; Passi, A.; Boggs, C.; Smith, E.; Gilham, L.; Byun, T.; Rayadurgam, S. Run-Time Assurance for Learning-Based Aircraft Taxiing. In Proceedings of the 2020 AIAA/IEEE 39th Digital Avionics Systems Conference (DASC), San Antonio, TX, USA, 11–15 October 2020; pp. 1–9. [Google Scholar]
- Hoang, T.; Jung, Y.C.; Holbrook, J.B.; Malik, W.A. Tower controllers’ assessment of the spot and runway departure advisor (SARDA) Concept. In Proceedings of the Ninth USA/Europe Air Traffic Management Research and Development Seminar, Berlin, Germany, 14–17 June 2011. [Google Scholar]
- Bakowski, D.L.; Hooey, B.L.; Foyle, D.C. Flight deck surface trajectory-based operations (STBO): A four-dimensional trajectory (4DT) simulation. In Proceedings of the 2017 IEEE/AIAA 36th Digital Avionics Systems Conference (DASC), St. Petersburg, FL, USA, 17–21 September 2017; pp. 1–10. [Google Scholar]
- Lukic, M.; Giangrande, P.; Hebala, A.; Nuzzo, S.; Galea, M. Review, challenges, and future developments of electric taxiing systems. IEEE Trans. Transp. Electrif. 2019, 5, 1441–1457. [Google Scholar] [CrossRef]
- Rathinam, S.; Montoya, J.; Jung, Y. An optimization model for reducing aircraft taxi times at the Dallas Fort Worth International Airport. In Proceedings of the 26th International Congress of the Aeronautical Sciences (ICAS), Anchorage, AK, USA, 14–19 September 2008; pp. 14–19. [Google Scholar]
- Marín, A.G.; Codina, E. Network design: Taxi planning. Ann. Oper. Res. 2008, 157, 135–151. [Google Scholar] [CrossRef]
- Evertse, C.; Visser, H.G. Real-time airport surface movementplanning: Minimizing aircraft emissions. Transp. Res. Part C 2017, 79, 224–241. [Google Scholar] [CrossRef]
- Clare, G.; Richards, A.G. Optimization of taxiway routing and runway scheduling. IEEE Trans. Intell. Transp. Syst. 2011, 12, 1000–1013. [Google Scholar] [CrossRef]
- Marín, Á.G. Airport taxi planning: Lagrangian decomposition. J. Adv. Transp. 2013, 47, 461–474. [Google Scholar] [CrossRef]
- Atkin, J.A.D.; Burke, E.K.; Ravizza, S. The airport ground movement problem: Past and current research and future directions. In Proceedings of the 4th International Conference on Research in Air Transportation (ICRAT), Budapest, Hungary, 1–4 June 2010; pp. 131–138. [Google Scholar]
- Hall, A.; Gabilondo, M.; Dechev, D. Using parallelization to improve the efficiency of an automated taxi route generation algorithm. Open Comput. Sci. 2012, 2, 118–127. [Google Scholar] [CrossRef]
- Czarnecki, M.; Skorupski, J. Method for identification of conflict points in the intelligent system of an aircraft taxi route choice. Arch. Transp. Syst. Telemat. 2015, 8, 9–14. [Google Scholar]
- Bakowski, D.L.; Hooey, B.L.; Foyle, D.C.; Wolter, C.A. NextGen Surface Trajectory-Based Operations (STBO): Evaluating conformance to a four-dimensional trajectory (4DT). Procedia Manuf. 2015, 3, 2458–2465. [Google Scholar] [CrossRef] [Green Version]
- Chen, J.; Weiszer, M.; Stewart, P.; Shabani, M. Toward a more realistic, cost-effective, and greener ground movement through active routing—part i: Optimal speed profile generation. IEEE Trans. Intell. Transp. Syst. 2015, 17, 1196–1209. [Google Scholar] [CrossRef] [Green Version]
- Obajemu, O.; Mahfouf, M.; Maiyar, L.M.; Al-Hindi, A.; Weiszer, M.; Chen, J. Real-time four-dimensional trajectory generation based on gain-scheduling control and a high-fidelity aircraft model. Engineering 2021, 7, 495–506. [Google Scholar] [CrossRef]
- Zhang, T.; Ding, M.; Zuo, H.; Chen, J.; Weiszer, M.; Qian, X.; Burke, E.K. An online speed profile generation approach for efficient airport ground movement. Transp. Res. Part C 2018, 93, 256–272. [Google Scholar] [CrossRef]
- Liu, C.; Ferrari, S. Vision-guided planning and control for autonomous taxiing via convolutional neural networks. In Proceedings of the AIAA Scitech 2019 Forum, San Diego, CA, USA, 7–11 January 2019; p. 928. [Google Scholar]
- Saez Nieto, F.J. The long journey toward a higher level of automation in ATM as safety critical, sociotechnical and multi-Agent system. Proc. Inst. Mech. Eng. Part G J. Aerosp. Eng. 2016, 230, 1533–1547. [Google Scholar] [CrossRef]
- Ma, J.; Delahaye, D.; Sbihi, M.; Scala, P.; Mota, M.M. A study of tradeoffs in airport coordinated surface operations. In Proceedings of the 5th ENRI International Workshop on ATM/CNS: Drafting Future Skies, Nakano, Japan, 29–31 October 2017. [Google Scholar]
- Kim, A.; Hansen, M. Validation of runway capacity models. Transp. Res. Rec. 2010, 2177, 69–77. [Google Scholar] [CrossRef] [Green Version]
- Guo, H.; Zhu, J. Calculation models of capacity and delay for y closely spaced parallel runway. J. Traffic Transp. Eng. 2008, 18, 68–72. [Google Scholar]
- Federal Aviation Administration. Airport Capacity and Delay. Advisory Circular, 150/5060-5; Office of Airport Planning & Programming, Planning & Environmental Division: Washington, DC, USA, 1983.
- Hansen, M. Micro-level analysis of airport delay externalities using deterministic queuing models: A case study. J. Air Transp. Manag. 2002, 8, 73–87. [Google Scholar] [CrossRef]
- Tee, Y.Y.; Zhong, Z.W. Modelling and simulation studies of the runway capacity of Changi Airport. Aeronaut. J. 2018, 122, 1022–1037. [Google Scholar] [CrossRef]
- Bazargan, M.; Fleming, K.; Subramanian, P. A simulation study to investigate runway capacity using TAAM. In Proceedings of the Winter Simulation Conference, San Diego, CA, USA, 8–11 December 2002; Volume 2, pp. 1235–1243. [Google Scholar]
- Daganzo, C.F. The cell transmission model: A dynamic representation of highway traffic consistent with the hydrodynamic theory. Transp. Res. Part B 1994, 28, 269–287. [Google Scholar] [CrossRef]
- Khan, K.; Rehman, S.U.; Aziz, K.; Fong, S.; Sarasvady, S. DBSCAN: Past, present and future. In Proceedings of the Fifth International Conference on the Applications of Digital Information and Web Technologies (ICADIWT 2014), Bangalore, India, 17–19 February 2014; pp. 232–238. [Google Scholar]
- Chen, J.; Leung, M.K.H.; Gao, Y. Noisy logo recognition using line segment Hausdorff Distance. Pattern Recognit. 2003, 36, 943–955. [Google Scholar] [CrossRef] [Green Version]
- Hermes, C.; Wohler, C.; Schenk, K.; Kummert, F. Long-term vehicle motion prediction. In Proceedings of the 2009 IEEE Intelligent Vehicles Symposium, Xi’an, China, 3–5 June 2009; pp. 652–657. [Google Scholar]
- Vlachos, M.; Kollios, G.; Gunopulos, D. Discovering similar multidimensional trajectories. In Proceedings of the 18th International Conference on Data Engineering, San Jose, CA, USA, 26 February–1 March 2002; pp. 673–684. [Google Scholar]
- Popat, S.K.; Emmanuel, M. Review and comparative study of clustering techniques. Int. J. Comput. Sci. Inf. Technol. 2014, 5, 805–812. [Google Scholar]
- Eppstein, D. Finding the k shortest paths. SIAM J. Comput. 1998, 28, 652–673. [Google Scholar] [CrossRef] [Green Version]
- Yen, J.Y. Finding the k shortest loopless paths in a network. Manag. Sci. 1971, 17, 712–716. [Google Scholar] [CrossRef]
- Chen, J.C. Dijkstra’s shortest path algorithm. J. Formaliz. Math. 2003, 15, 237–247. [Google Scholar]
- Wang, Y.; Szeto, W.Y.; Han, K.; Friesz, T.L. Dynamic traffic assignment: A review of the methodological advances for environmentally sustainable road transportation applications. Transp. Res. Part B 2018, 111, 370–394. [Google Scholar] [CrossRef]
- Van Vliet, D. The Frank-Wolfe algorithm for equilibrium traffic assignment viewed as a variational inequality. Transp. Res. Part B 1987, 21, 87–89. [Google Scholar] [CrossRef]
- Wang, X.; Brownlee, A.E.; Woodward, J.R.; Weiszer, M.; Mahfouf, M.; Chen, J. Aircraft taxi time prediction: Feature importance and their implications. Transp. Res. Part C 2021, 124, 102892. [Google Scholar] [CrossRef]
- Zhuang, Q.; Xi, Y. Construction Scheme of Airport Apron Tower Automation System. Aeronaut. Comput. Tech. 2019, 49, 110–119. [Google Scholar]
- Hermes, P.; Mulder, M.; van Paassen, M.M.; Boering, J.H.L.; Huisman, H. Solution space based analysis of the difficulty of aircraft merging tasks. J. Aircr. 2009, 46, 1995–2015. [Google Scholar] [CrossRef]
- Yang, L.; Han, K.; Borst, C.; Mulder, M. Impact of aircraft speed heterogeneity on contingent flow control in 4D en-route operation. Transp. Res. Part C 2020, 119, 102746. [Google Scholar] [CrossRef]
- Stamp, R.G. The DORATASK Method of Assessing ATC Sector Capacity—An Overview; DORA Commun. 8934, Issue 2; Department of Operational Research and Analysis (DORA), Civil Aviation Authority: London, UK, 1992. [Google Scholar]
- Badrinath, S.; Li, M.Z.; Balakrishnan, H. Integrated surface–airspace model of airport departures. J. Guid. Control Dyn. 2019, 42, 1049–1063. [Google Scholar] [CrossRef]
Figure 1.
The fundamental diagram of runway congestion: (a) segregated mode; (b) mixed mode.

Figure 2.
The fundamental diagrams of traffic flow congestion: (a) speed-density-flow relations of taxiway traffic flow; (b) active movement and average delay relationship for apron area operation.
Figure 2.
The fundamental diagrams of traffic flow congestion: (a) speed-density-flow relations of taxiway traffic flow; (b) active movement and average delay relationship for apron area operation.

Figure 3.
Taxiing path inside the apron area, (a) apron topology; (b) scheme of relative position of two line segments.
Figure 3.
Taxiing path inside the apron area, (a) apron topology; (b) scheme of relative position of two line segments.

Figure 4.
Schematic illustration of the concepts related to Yen’s algorithm.

Figure 5.
Basic data of ZSNJ used for MPSTRs generation. (a) Physical structure; (b) historical taxiing path and speed profile.
Figure 5.
Basic data of ZSNJ used for MPSTRs generation. (a) Physical structure; (b) historical taxiing path and speed profile.

Figure 6.
The comparison of simulated and empirical taxiing-in and taxiing-out time for each flight on a test day.
Figure 6.
The comparison of simulated and empirical taxiing-in and taxiing-out time for each flight on a test day.


Figure 7.
The relationship between runway throughput and delay at ZSNJ.

Figure 8.
The fundamental diagram of taxiing traffic flow on ZSNJ airport surface.

Figure 9.
Calibration of apron congestion cost. (a) Apron sectorization. (b) The relationship between apron delay and traffic movements in each apron area.
Figure 9.
Calibration of apron congestion cost. (a) Apron sectorization. (b) The relationship between apron delay and traffic movements in each apron area.

Figure 10.
The result of SOTA. (a) The convergence process of iteration; (b) the optimized flow distribution in taxiway network based on SOTA.
Figure 10.
The result of SOTA. (a) The convergence process of iteration; (b) the optimized flow distribution in taxiway network based on SOTA.

Figure 11.
Utilization rate of MPSTR.

Figure 12.
The tower simulation experiment. (a) The tower simulator; (b) the RSME scale for subjective workload rating.
Figure 12.
The tower simulation experiment. (a) The tower simulator; (b) the RSME scale for subjective workload rating.

Figure 13.
Box plots of dependent measures, for all six scenarios. (a) The workload rating; (b) average taxiing time; (c) number of potential conflicts; (d) number of command.
Figure 13.
Box plots of dependent measures, for all six scenarios. (a) The workload rating; (b) average taxiing time; (c) number of potential conflicts; (d) number of command.


Table 1.
Steps of the Yen algorithm.
| Step 1: | Initialize Q as an empty queue. |
| Step 2: | Find the shortest path using the Dijkstra algorithm [49]. If k = 1, STOP; otherwise, Add to Q, a set of candidate paths that will be used to search . To generate the candidate paths, repeat Steps 2.1–2.3 for any : |
| Step 2.1: | Remove e from network G. |
| Step 2.2: | Find the shortest path from tail(e) to t that does not overlap with the nodes in , where . If exists, add path to Q. It can be seen that deviates from at node tail(e). Let tail(e) be the deviating node of path , denoted as . |
| Step 2.3: | Recover e removed in Step 2.1. |
| Step 3: | Let i = 2. |
| Step 4: | If Q is empty, STOP (that is, there are no more available paths); otherwise, find the shortest path in Q, remove it from Q, and set . If , then STOP (that is, all the k shortest paths are found); otherwise, find the deviated paths of and add them to Q. |
| Step 5: | If i = i + 1, return to Step 3. |
Table 2.
Steps of the improved Frank–Wolfe algorithm.
| Step 1: | Initialization. Extract the congestion cost and let . Iteratively retrieve the shortest paths between each OD pair and assign all the flow between each o-s in the unit time window to , i.e., . The initial flow on each link is recorded as . Lei n = 1 and add to with its flow . |
| Step 2: | Update. Let . |
| Step 3: | Descent direction. According to , the shortest paths between each OD pair are traversed and retrieved, and all the flow between each o-s within the unit time window are assigned to route , i.e., . Then, the link flows are directly recorded. |
| Step 4: | Determine the step size. Solve for that satisfies using the dichotomy method. |
| Step 5: | Move and update the route flow. |
| Step 5.1: | Move. Let . |
| Step 5.2: | Traverse the OD pairs and update the path flow using Equation (18). |
| Step 6: | Termination condition. If , the algorithm terminates; otherwise, n = n+1, then go to step 2. |
Table 3.
Accuracy evaluation of congestion cost parameters calibration based on aggregated taxiing time.
Table 3.
Accuracy evaluation of congestion cost parameters calibration based on aggregated taxiing time.
| Historical Statistics | Macroscopic Simulation | Error | Relative Error | |||
|---|---|---|---|---|---|---|
| Mean | Standard Deviation | Mean | Standard Deviation | |||
| Arrival | 6.84 min | 6.28 min | 0.56 min | 0.48 min | 8.2% | 7.3% |
| Departure | 11.77 min | 11.12 min | 0.65 min | 0.72 min | 5.5% | 6.9% |
Table 4.
Results of Friedman tests on control performance measures.
| Mean Ranks | Mean Ranks | ||||||||||
|---|---|---|---|---|---|---|---|---|---|---|---|
| A | D | AD | A | D | AD | ||||||
| RSME | Number of Commands | ||||||||||
| Fixed Route | 18.20 | <0.001 | 1.10 | 1.90 | 3.00 | Fixed Route | 20.00 | <0.001 | 1.00 | 2.00 | 3.00 |
| MPSTRs | 16.80 | <0.001 | 1.00 | 2.20 | 2.80 | MPSTRs | 20.00 | <0.001 | 1.00 | 2.00 | 3.00 |
| Number of Potential Conflict | Average Taxiing Time | ||||||||||
| Fixed Route | 20.00 | <0.001 | 1.00 | 2.00 | 3.00 | Fixed Route | 20.00 | <0.001 | 1.00 | 3.00 | 2.00 |
| MPSTRs | 15.20 | 0.001 | 1.00 | 2.60 | 2.40 | MPSTRs | 20.00 | <0.001 | 1.00 | 3.00 | 2.00 |
Publisher’s Note: MDPI stays neutral with regard to jurisdictional claims in published maps and institutional affiliations. |
© 2021 by the authors. Licensee MDPI, Basel, Switzerland. This article is an open access article distributed under the terms and conditions of the Creative Commons Attribution (CC BY) license (https://creativecommons.org/licenses/by/4.0/).
Share and Cite
MDPI and ACS Style
Yang, L.; Wang, S.; Liang, F.; Zhao, Z. A Holistic Approach for Optimal Pre-Planning of Multi-Path Standardized Taxiing Routes. Aerospace 2021, 8, 241. https://doi.org/10.3390/aerospace8090241
AMA Style
Yang L, Wang S, Liang F, Zhao Z. A Holistic Approach for Optimal Pre-Planning of Multi-Path Standardized Taxiing Routes. Aerospace. 2021; 8(9):241. https://doi.org/10.3390/aerospace8090241
Chicago/Turabian StyleYang, Lei, Simin Wang, Fengjie Liang, and Zheng Zhao. 2021. "A Holistic Approach for Optimal Pre-Planning of Multi-Path Standardized Taxiing Routes" Aerospace 8, no. 9: 241. https://doi.org/10.3390/aerospace8090241
Note that from the first issue of 2016, this journal uses article numbers instead of page numbers. See further details here.