
Three-Dimensional Flight Envelope for V/STOL Aircraft with Multiple Flight Modes


1
Institute of Unmanned System, Beihang University, Beijing 100191, China
2
Key Laboratory of Advanced Technology of Intelligent Unmanned Flight System, Ministry of Industry and Information Technology, Beijing 100191, China
3
School of Aeronautic Science and Engineering, Beihang University, Beijing 100191, China
4
School of Transportation Science and Engineering, Beihang University, Beijing 102206, China
5
Beijing Institute of Space Long March Vehicle, Beijing 100076, China
*
Author to whom correspondence should be addressed.
Aerospace 2022, 9(11), 691; https://doi.org/10.3390/aerospace9110691
Submission received: 10 July 2022
/
Revised: 26 October 2022
/
Accepted: 1 November 2022
/
Published: 5 November 2022
(This article belongs to the Special Issue Aircraft Design (SI-4/2022))
Abstract
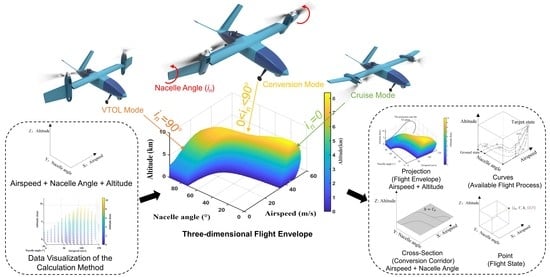
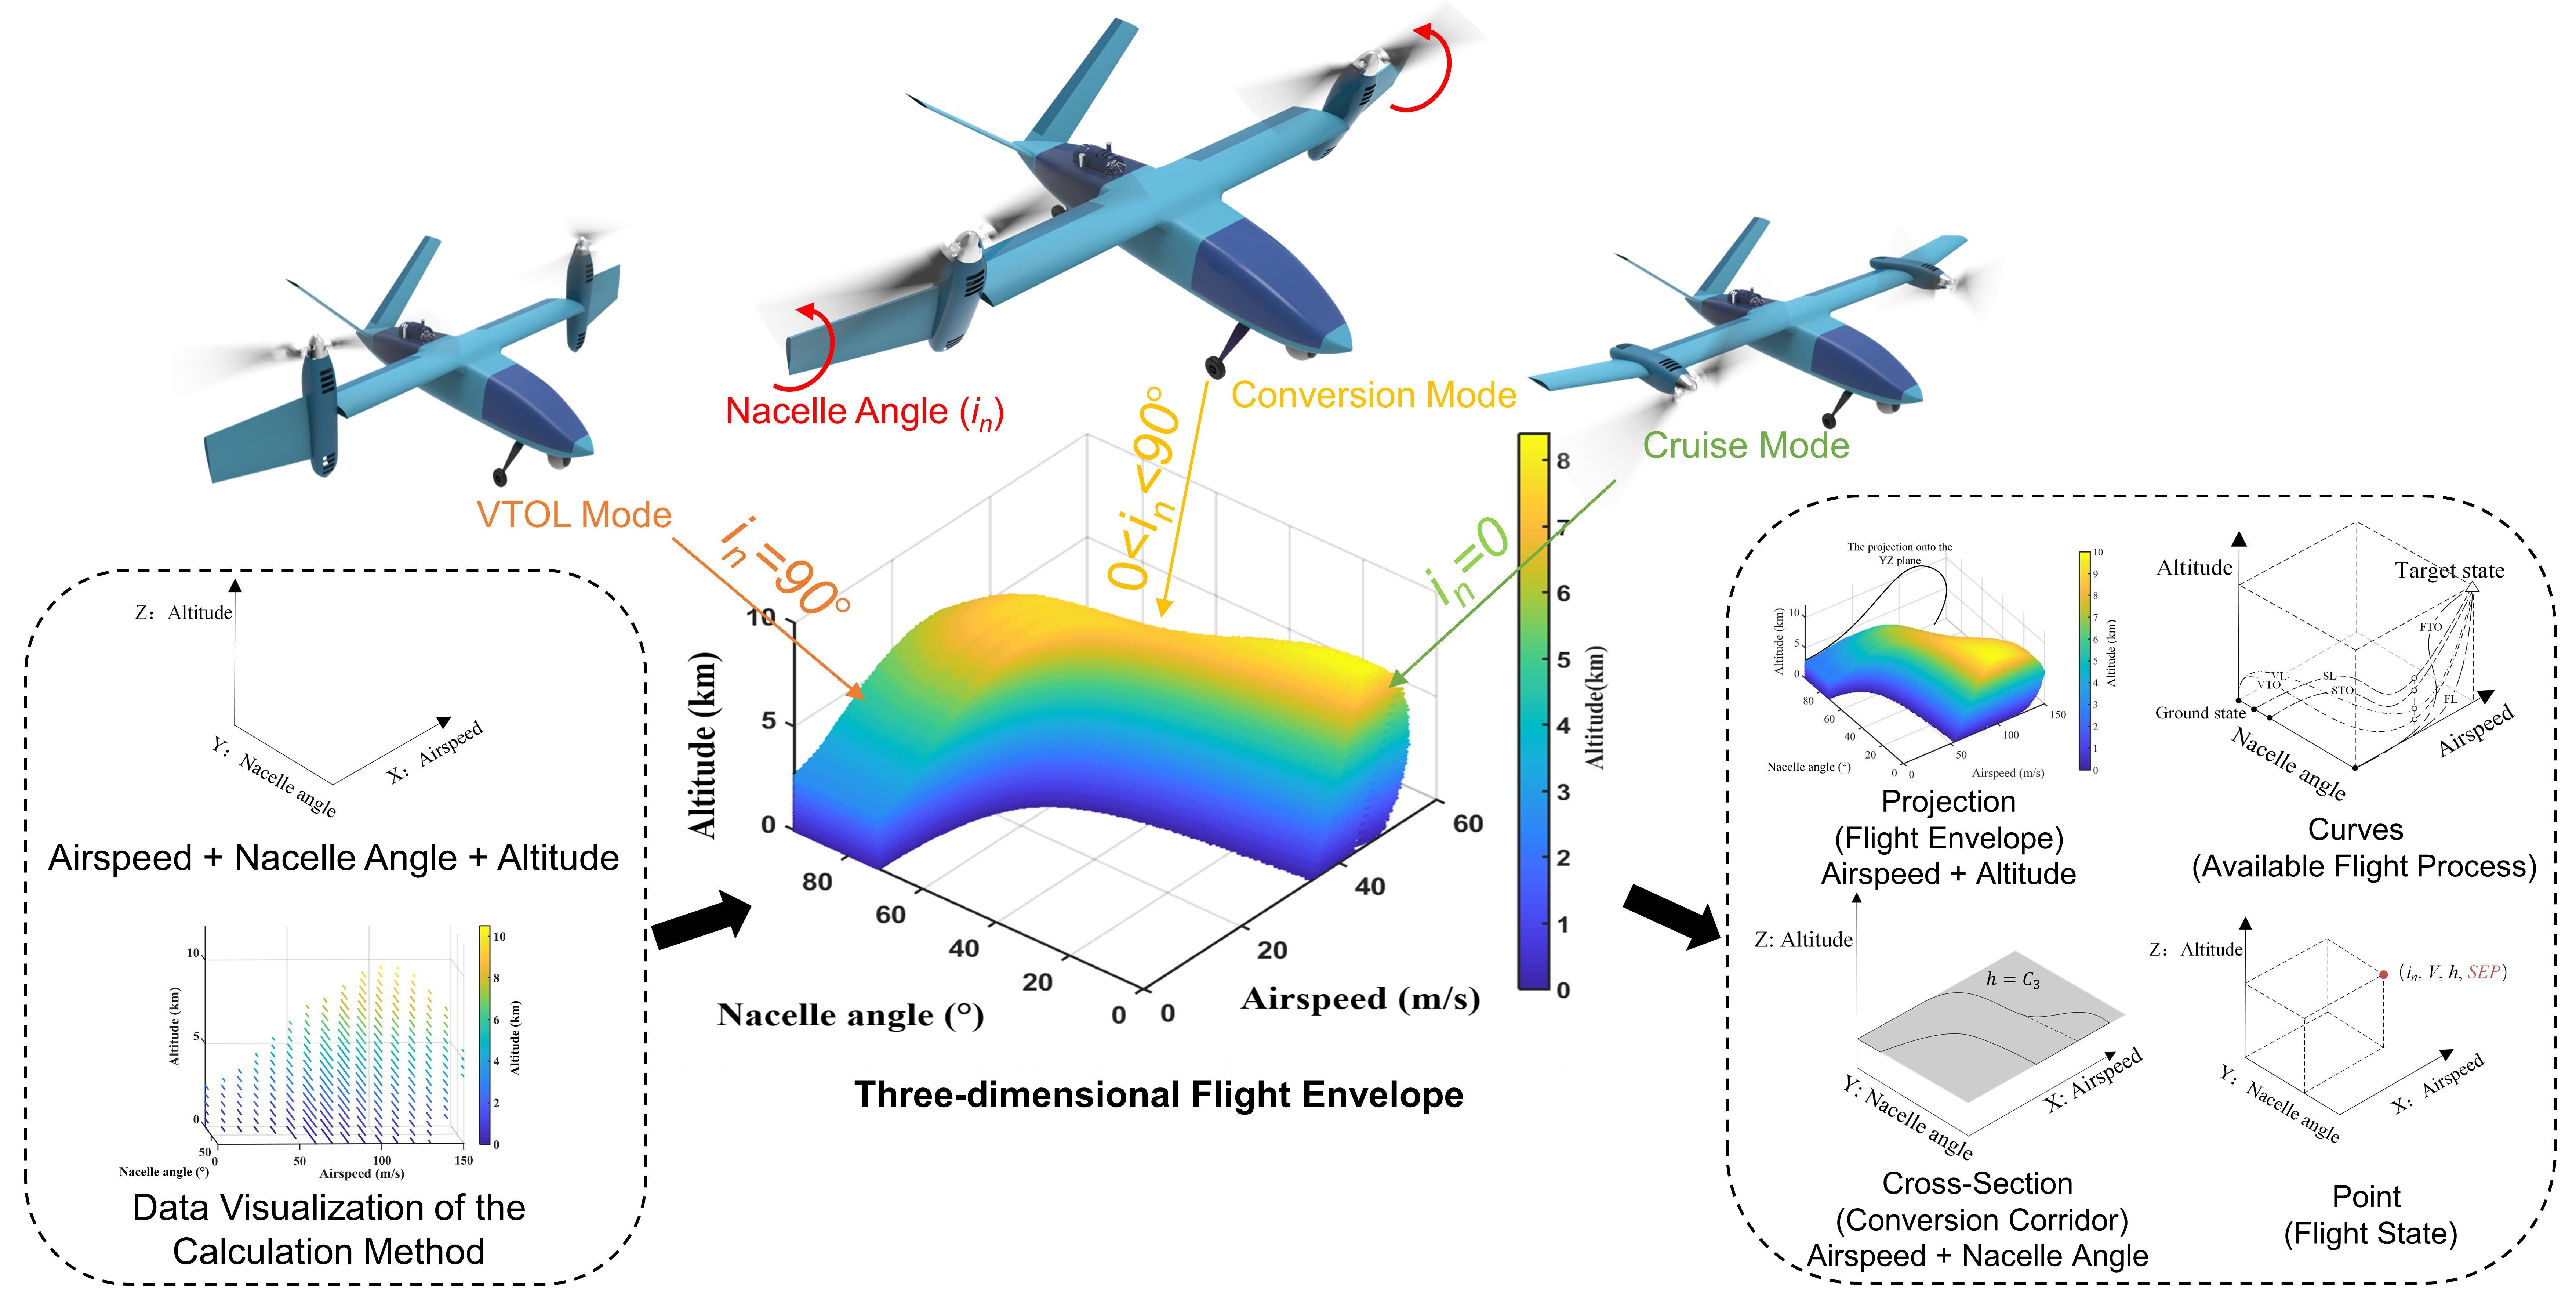
:Vertical or short take-off and landing (V/STOL) aircraft generally have three flight modes, namely, vertical take-off and landing (VTOL), conversion, and cruise, according to the variable angle of propulsion direction to the fuselage axis. However, the traditional flight envelope or conversion corridor lacks the capability to comprehensively present the flight characteristics of these three modes. Pursuant to this, the purpose of this paper was to present a three-dimensional (3D) flight envelope that combines propulsion direction, airspeed, and altitude in one figure. The 3D envelope was constructed subject to the constraints of power rating and equilibrium conditions. To verify its effectiveness, the flight data of XV-15 was used to generate the 3D envelope, following the projection along with the cross-section, which was compared with the traditional flight envelope and conversion corridor, respectively. The maximum specific excess power (SEP) of each flight state was also promptly obtained. In the case study, the flight performance of a rotor-wing aircraft was comprehensively analyzed using the generated 3D envelope. The proposed method in this study exhibited its versatility and capability to demonstrate the performance in all flight modes intuitively, which promoted the efficiency of V/STOL aircraft flight performance analysis as well.
1. Introduction
Vertical or short take-off and landing (V/STOL) aircraft have promising prospects due to their abilities with regard to V/STOL and high-speed forward flight [1]. According to the relationship between the propulsion direction and fuselage axis, V/STOL aircraft generally have three typical flight modes: VTOL mode, conversion mode, and cruise mode. The propulsion system of V/STOL aircraft consists of the thrust devices, such as the rotor and duct fan, and the engine. The widely equipped propulsion systems which are capable of adjusting the thrust vector can be divided into two types: one changes the controllable mechanical degree of freedom (DoF) between the thrust device and the fuselage to attain all the flight modes; the other controls the magnitude and direction of the resultant thrust by adjusting several thrust devices that are in different directions [2].
Two-dimensional (2D) diagrams used in V/STOL aircraft performance analysis generally show the traditional flight envelope and the conversion corridor. As a foundation for pilot and aerospace engineer training, the flight envelope is well-established in aviation. The region encircled by the flight envelope is where the aircraft can fly safely subject to the stall, propulsion, and control surface constraints [3,4,5], in which the horizontal and vertical axes represent the airspeed and the altitude, respectively [6,7]. The conversion mode is a representative and unsteady flight mode for V/STOL aircraft. Various methods regarding CFD, flight tests, wind tunnel experiments, etc. are employed to study the conversion characteristics [8,9,10]. The conversion corridor is an effective method to evaluate the conversion flight performance. Meanwhile, a smooth conversion flight requires keeping the flight state inside the corridor region [11]. A typical conversion corridor can be divided into three areas by the airspeed boundary of VTOL mode () and the stall airspeed of cruise mode (), as shown in Figure 1. Apparently, any single airspeed between 0 and can be achieved in the VTOL mode, and in the cruise mode, the aircraft can fly between and the cessation airspeed (); however, between and , a steady level flight can only be achieved in the conversion mode.
Despite the fact that the method to calculate the conversion corridor has been well developed [12], the property of a 2D planar diagram restricts both performance calculation and evaluation in the conversion flight phase, and they can only be carried out at several discrete altitudes. Apparently, some flight parameters, including the airspeed limit of VTOL mode () and the stall airspeed (), vary in accordance with the altitude. Therefore, the performance evaluation in the gap between the discrete altitudes can be mistakenly omitted.
This limitation can have an adverse impact on trajectory planning research, which involves all the flight phases of the mission and thus requires accurate control variables constraints. As a result, it is favorable to have continuous speed limits in different modes as well as altitudes [13]; likewise, it is also a prerequisite for V/STOL aircraft in high-altitude deployment at various altitudes [14]. Moreover, efficiency can be seriously impacted given the 2D conversion corridors constructed under the discrete ceilings. It is also redundant to display the derivatives’ variations in the conversion strategy within many corridor diagrams at different altitudes [15]. Similar disadvantages also exist in the traditional flight envelope, which cannot reflect the performance characteristics with the varying propulsion directions for the V/STOL aircraft.
To address the aforementioned limitations of the 2D diagram, a third-dimension extension was introduced, which is of great advantage for these aircraft with multiple flight modes. Some types of 3D flight envelope-introducing parameters, for instance, heading and bank angles, were adopted to evaluate their influence on trajectory planning related to altitude variation for damaged airplanes [16,17,18,19]. In Ref. [20], the 3D diagram was adopted to illustrate the trim capability of the V/STOL aircraft in multiple flight modes, which involves thrust, velocity, and incidence angle between the nacelle axis and fuselage coordinates.
The aim of the work presented in this paper is twofold: (i) to establish a 3D flight envelope that is of the capability to comprehensively demonstrate the flight characteristics of tilt-rotor aircraft; and (ii) to demonstrate its capabilities by employing it to a V/STOL aircraft case study with multiple flight modes. To achieve this aim, the angle between the fuselage axis and the nacelle direction must be introduced as a third dimension beyond the traditional flight envelope (this can also be regarded as adding the altitude information to the conversion corridor diagram). In relation to the first part of the aim, a novel 3D flight envelope combining the coordinates of altitude, airspeed, and propulsion direction was proposed for intuitively demonstrating flight performance in multiple modes. Furthermore, addressing the second part of the aim, a 3D envelope was applied to a case study involving generating the conversion corridors, in which the flight ceiling with different propulsion directions was obtained simultaneously.
This introduction is followed by the constitution and graphical description of the 3D envelope in Section 2, followed in Section 3 by the detailed 3D envelope calculation method. In Section 4, based on the XV-15 literature data, the maximum specific power (SEP) was calculated and displayed on the generated 3D envelope to demonstrate further the role it played in conversion flight mode analysis, in which the flight data were also included for envelope effectiveness verification. Subsequently, in Section 5, the envelope was applied to a different tilt-rotor-wing aircraft to explore the generality of the proposed method. Finally, the paper is concluded, and suggestions for future work are presented in Section 6.
2. Constitution and Graphs of the 3D Envelope
2.1. Longitudinal Equilibrium of V/STOL Aircraft
To obtain the envelopes in different flight modes of V/STOL aircraft, the flight status can be simplified to lateral-symmetric longitudinal motions. For V/STOL aircraft at steady level flight, as shown in Figure 2, the gravity, lift, drag, and thrust are acted at the center of gravity. In this study, the thrust is defined in the longitudinal symmetry plane of the fuselage.
From longitudinal force equilibrium, it can be yielded as [21]:
where is the angle of attack (AOA), is the nacelle angle. is the angle between the actual thrust direction and the nacelle axis, which is facilitated by the cyclic rotor pitch or the rudder in the duct fan.
2.2. Coordinates Definitions of the 3D Flight Envelope
The coordinates system of the 3D flight envelope is defined in Figure 3a, which follows the right-hand rule. The newly added Y-axis to the altitude-airspeed plane stands for the angle between the nacelle and fuselage, while the resultant thrust is assumed through the center of gravity. Therefore, in the 3D flight envelope, the XZ plane is equivalent to the traditional 2D flight envelope at a certain nacelle angle, and the XY plane can be regarded as the conversion corridor at a certain altitude.
Figure 3b shows an example of the 3D flight envelope of XV-15, a famous V/STOL aircraft with multiple flight modes. XV-15 is used as a case study to verify the proposed 3D flight envelope calculation, which is detailed discussed in Section 4. Based on the performance characteristics in the test report, a visual actual available flight region can be promptly generated. The projection of the 3D flight envelope onto the YZ plane would be consistence with its traditional envelope. The enclosed continuous region stands for the status in which the aircraft can be trimmed to a steady level flight, while its surface deflection is determined by the equilibrium constraints.
2.3. Points and Curves in the Graph of the 3D Flight Envelope
Any single point in the graph indicates a steady flight state corresponding to the airspeed, nacelle angle, and altitude. In Figure 3b, the colored contour is used to describe the altitude. Similarly, the current flight performance like fuel consumption, SEP, and aerodynamics derivatives, can also be displayed in this way. For instance, in the point shown in Figure 4a, three coordinates describe its flight state (altitude, airspeed, nacelle angle), and the colored contour shows the current SEP.
SEP is a fundamental parameter to describe the difference between the required and available power for steady-level flight at a reference state, which can also represent the potential climb rate at a sustained speed. The SEP can be promptly calculated as
where is the rated power of the engines and is the required power at the current altitude. Low SEP values are considered to be highly risky because of the low residual power, while high SEP values stand for the aircraft in a relatively power economic state.
One curve in the 3D graph represents a flight phase and the point moving along the curve in the direction of time represents the flight state changing from one point to the adjacent one. Common take-off and landing strategies of V/STOL aircraft with three flight modes (vertical, short, and fixed wing) and their abbreviations are listed in Table 1. Figure 4b shows different climb and descent curves in the above take-off and landing strategies, which start from the ground states in the corresponding flight mode, reach the same target state with the predetermined altitude and airspeed, and finally return to the ground state in the same flight mode. The nacelle angle, airspeed, and altitude vary along the three sets of intersected curves, which means the flight phases start in these three modes, and all reach the same state.
Figure 4c supplements the SEP contours of VTO, STO, and FTO modes. The color bar helps describe the maneuver performance in flight and its variation trend intuitively. It is a formidable task to calculate all the potential SEP values of the points along different curves. A practical method is to focus on the points with minimum SEP values that can be recognized as the most dangerous states. The size of points with minimum SEP can also be used to represent the accumulated flight time at these states. In this manner, any flight strategies can be promptly described and conveniently compared by curves in the 3D flight envelope.
2.4. Cross-Sections and Projections in the Graph of the 3D Flight Envelope
The cross-section of the 3D flight envelope at one coordinate value can be regarded as a 2D graph. The cross-sections sliced by X-plane represent the achievable altitude against the nacelle angle at a specific airspeed. For cross-sections sliced by Y-plane is the conventional flight envelope at a certain nacelle angle, and as for sliced by Z-plane is the conversion corridor at a certain altitude, as shown in Figure 5a.
Three meaningful cross-sections can be sliced at certain altitudes. The first cross-section at 0 altitude is the conversion corridor at sea level, which is frequently used for reference in V/STOL aircraft conversion performance studies. The second cross-section is at the altitude where the upper and lower limits of the corridor merge. This represents the characteristic altitude above which the VTOL mode no longer satisfies the equilibrium condition, namely the lower ceiling. The third cross-section is at the altitude where the boundary curves shrink into one point, which represents the ceiling of the aircraft.
Cross-sections can also utilize the contour to evaluate the flight performance. The maximum SEP contours, shown in Figure 5b as an example, indicate the risk level of the flight condition. Moreover, other quantitative results of important parameters in the conversion can be used for reference to evaluate a conversion strategy.
Figure 5c shows a typical 3D flight envelope that contains the flight performance data of all modes. The 3D flight envelope can be projected in three directions along the axes. The projection onto the airspeed-altitude plane intuitively produces the flight envelope, which can be used to verify the correctness of the 3D flight envelope by comparing it with the traditional envelope literature. The projection onto the altitude-nacelle angle plane presents the continuous ceiling change in conversion mode. The projection onto the airspeed-nacelle angle plane produces upper and lower limits of airspeed with different nacelle angles. Note that even though this projection outline is similar to the conversion corridor, the projected area should be larger than any conversion corridor since it can be regarded as the superimposition of all the conversion corridors at all possible altitudes.
3. Calculation Method of 3D Flight Envelope
The proposed 3D flight envelope can be applied to most kinds of V/STOL aircraft with three typical flight modes. Its calculation method flowchart is depicted in Figure 6. The envelope calculation method involves an iteration of the flight state parameters. In each cycle, the different values of altitude, airspeed, and nacelle angle are generated according to a pre-determined order.
To demonstrate the calculation method, a tilt-rotor aircraft is employed as an example since it is a representative V/STOL aircraft configuration. The involved parameters of each step in Figure 6 are listed in Table 2 and the calculation are described in detail.
At the beginning of the workflow in Figure 6, the ranges of AOA, altitude, and airspeed are specified which should cover the available flight states to avoid incomplete results. In the VTOL mode, the lift force balancing the gravity is mainly from the vertical component of thrust at a low airspeed. While in the fixed-wing mode, the lift can be provided from a small AOA up to a stall. Under this consideration, although the AOA can exceed the critical one in VTOL mode, post-stall aerodynamic characteristics will not influence the envelope calculation considerably. Therefore, the range of AOA should include from zero lift to stall.
Following other parameters according to the above flight state are generated, including air density (), lift (), drag (), and rated engine power (). Given the constant weight and the ignored ground effect, the calculation can be simplified. The air pressure and density are determined by the barometric altitude [22]. The lift and drag can be sourced from CFD simulation or empirical methods [23]. A non-turbocharged internal combustion engine was selected as the power plant model which involves the impact of the altitude on rated power. The rated power against the altitude is expressed as [24]:
where is the temperature and subscript 0 indicates the value at sea level. Besides, the power is further corrected by the function to fit the real engine characteristics.
Substituting the calculated lift, drag, gravity, and AOA into Equation (1), the performance parameters are calculated, including the power () and thrust () required, the angle of the propulsion direction (), and SEP. The propulsion direction is assumed to be perpendicular to the propeller disc. Following the angle relations shown in Figure 2, the nacelle angle is solved. The engine power coefficient is deduced from the momentum theory of propeller disc, the conservation law of energy, and the blade element theory, which is expressed by:
The empirical parameters relates to are recommended in Ref. [25]. The collective pitch of rotor blades varies with , thus so does and their relationship can be obtained by an optimal conversion process in Refs. [26,27]. The Equations (4) and (5) are the main equations of the momentum theory of propeller which are derived in Ref. [27].
Rotors that are installed on the symmetric nacelles are assumed to work in the same condition, so the required power of a tilt-rotor aircraft is written as [28]:
If the required power is less than the engine rated power at an altitude, the constraints are satisfied, and the current state is in the 3D envelope region. After all the parameters are obtained, the AOA, airspeed, and altitude will be updated to perform a new iteration until the complete envelope boundary is obtained.
From the perspective of the calculation process, we specified the AOA (), altitude (), and, airspeed () in the predetermined range, and then calculated their corresponding lift () and drag (). Through the longitudinal equilibrium condition (Equation (1)), the required thrust (), nacelle angle (), and angle between thrust and nacelle axis () can be revealed. The momentum method of the propeller (Equations (4)–(6)) is used to figure out the required power () (Equation (7)) from the thrust and flight state. Comparing the required power and power rating of the engine () in a certain flight state decides whether this state can be maintained by the VSTOL aircraft. With the iteration of the above process, the 3D flight envelope can be obtained.
The discrete data are shown in Figure 7 and the 3D flight envelope is produced finally by connecting the discrete points to a continuous envelope surface. The calculation process of different V/STOL aircraft is totally similar to the specific models of aerodynamic and power plants applied.
4. Verification of 3D Envelope
XV-15 is a famous tilt-rotor aircraft developed by Bell Company, as shown in Figure 8a. It was chosen for verification of the 3D envelope calculation method by comparing its results with the data of the literature. During the development process, the flight performance of the conversion corridor was of especial importance. Refs. [29,30,31] present part of the data about XV-15, such as the aerodynamic characteristic, flight envelope, conversion corridor, flight performance, etc.
The 3D flight envelope of XV-15 was generated according to the flowchart introduced in the previous section. The lift and drag coefficient curves, shown in Figure 8b [32], were adopted to calculate the lift and drag. Some key specifications of XV-15, listed in Table 3, were used for modeling and performance analysis.
The 3D flight envelope of XV-15 was shown in Figure 8c. The maximum SEP value at each steady state is depicted in Figure 8d and it was used to find the economical states of XV-15 and evaluate the risk during the entire envelope.
Figure 9a compared the conversion corridor sliced at sea level of the 3D flight envelope and the diagram from the literature. Figure 9b compares the flight envelope diagram from the literature and the one from the 3D envelope projection. The results and data agree fairly well, which lifts the level of confidence in the validity of the 3D flight envelope theory. Some slight deviations in the hovering state from the literature results can be attributed to some simplified constraints. The propulsion direction needs to keep vertically upward when hovering, which means the sum of , , and is 90°. Moreover, in real conditions the propulsion line does not usually go through the center of gravity exactly, thus Equation (1) should be corrected by supplementing the moment balancing equation. The above reasons result in a larger range near the hovering state for this 3D flight envelope.
The airspeed at 45° nacelle angle is defined as the cessation airspeed, while in Figure 9a. the cessation airspeed from the 3D envelope is larger than the literature-sourced value. This can be attributed to ignorance of cessation in the calculation because of a data absence in the literature. However, the upper airspeed limit obtained by the 3D flight envelope is well-fitted with that of traditional flight envelopes in the literature at sea level.
The 3D flight envelope proves its potential and validity to present comprehensive performance in all flight states by comparing verification studies based on XV-15. After the complete calculation workflow, parameters of interest, including SEP, can also be colored on the 3D envelope for performance analysis and risk evaluation.
5. Application on the Rotor-Wing
The analysis of the XV-15 flight envelope and conversion corridor based on the data extracted from the 3D envelope demonstrates the validity and accuracy of the proposed method. Conceivably, it is generalized to a V/STOL configuration as it is derived from the longitudinal equilibrium equations.
Rotor-wing is a different kind of V/STOL aircraft from tilt rotors or tilt wings, which has one winglet outside each of the nacelles. This can be of benefit for endurance since it improves the aspect ratio without significantly changing the scheme of the wing structure. Although the winglets deteriorate both stability and maneuverability in VTOL mode, the performance gains are relatively more beneficial in conversion and cruise modes of the rotor wing, compared with tilt-rotor configurations [33].
The aerodynamic model of the rotor-wing changes according to the nacelle-winglet angle. Thus, the rotor-wing control strategy exhibits strong nonlinear characteristics [34]. The data integrity from the 3D envelope is of great importance to the limits determination of the nacelle angle, altitude, and airspeed in various modes. Moreover, in the wind tunnel test, the reasonable and consistent parameters in conversion mode can be determined by the 3D envelope, which is more efficient compared with the traditional flight envelope and conversion corridor.
Figure 10a shows the three flight modes of a rotor-wing named XG-5 (V/STOL, conversion, and cruise). It has been studied by our team for years, and we have published research on the CFD simulation method of XG-5 [35]. The hybrid power plant in this rotor wing employs a gasoline engine driving a generator and the rotor on each side is driven by an electric motor. This series of hybrid-electric propulsion systems were proved to have some advantages in endurance [36]. The aerodynamic characteristics in Figure 10b were used to calculate the 3D envelope, where the CD@45 represents the drag coefficient at 45 degrees nacelle angle. It was obtained from both CFD (AOA > 30°) and integrated wind tunnel tests. The salient specifications of the rotor-wing aircraft are listed in Table 4.
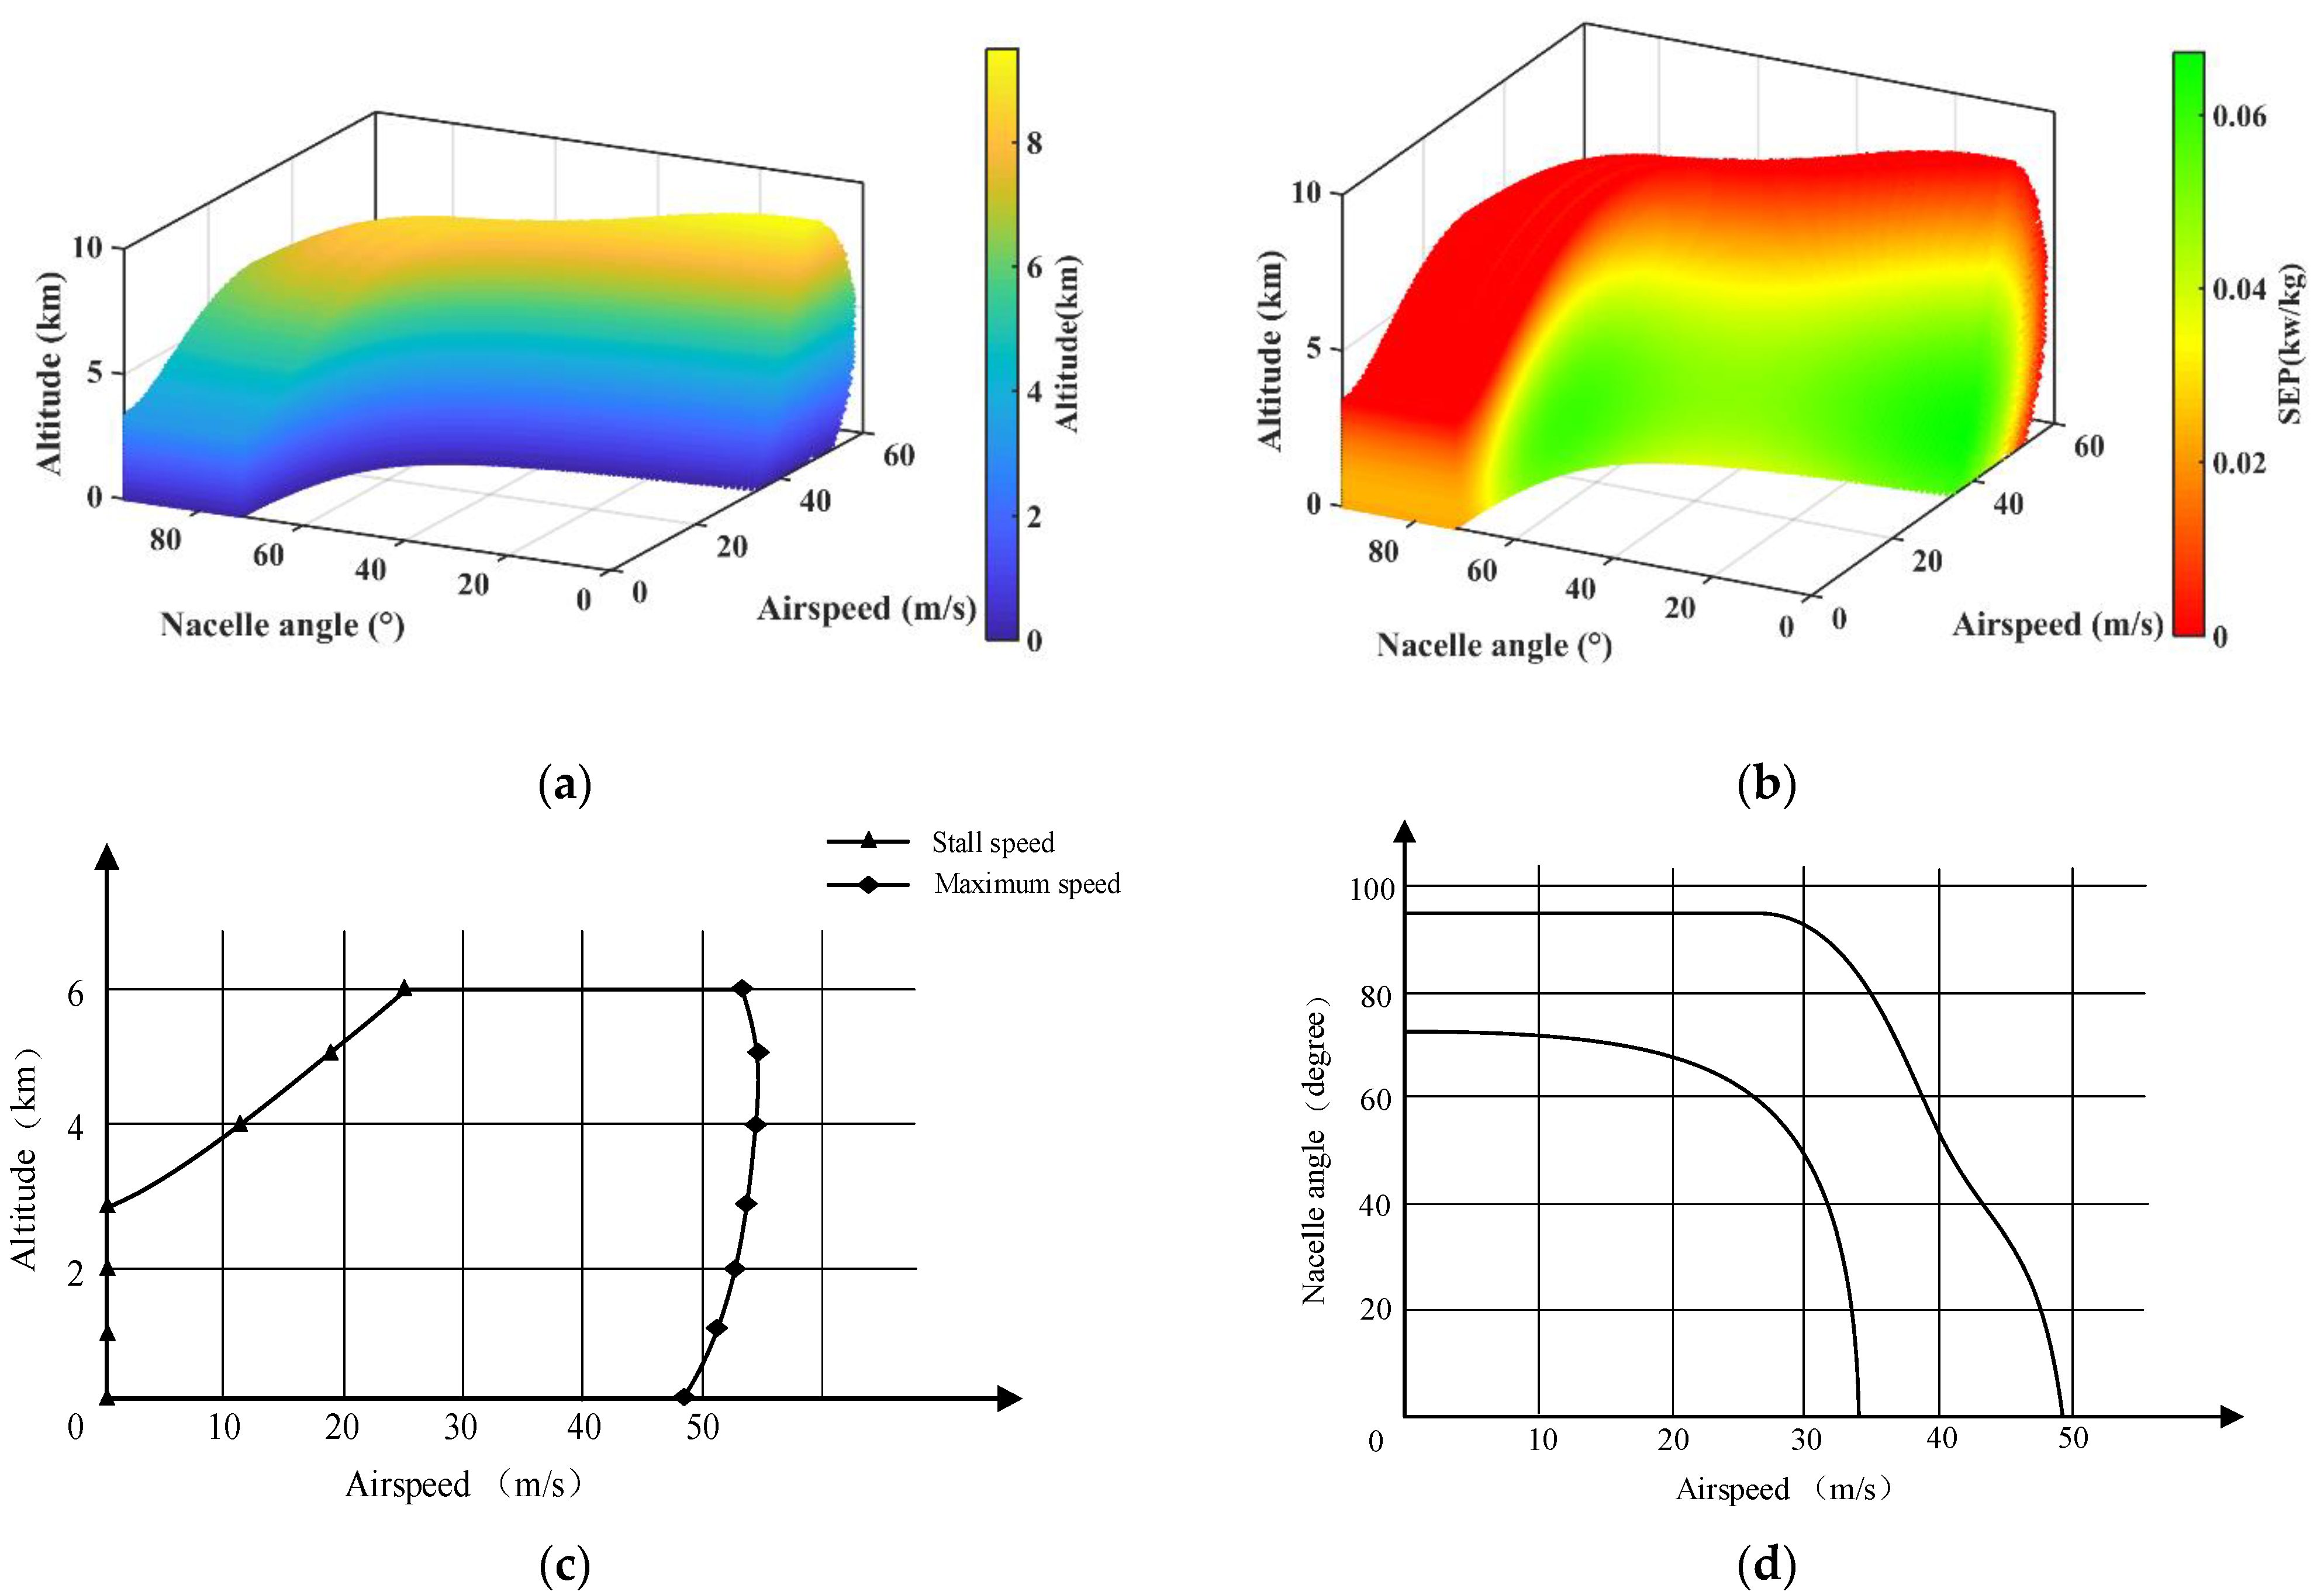
Figure 11a shows the 3D envelope results of this rotor wing. Optimized rotors and a hybrid power plant make the unmanned aerial vehicle (UAV) have a high thrust-to-weight ratio, and the ceiling is considerably high in VTOL mode benefiting from the lightweight structure. Because the propulsion efficiency of large-diameter rotors decreases rapidly with increase in speed and altitude, the ceiling in cruise mode only slightly higher than that of VTOL mode. The winglets cause a considerable drag increment at the medium nacelle angle and dynamic pressure. When the nacelle angle reduces to 45°and below, the drag decreases significantly, and the upper limit of airspeed increases accordingly. As shown in Figure 11d, the lower limit of the corridor is almost vertical because the lift of the winglets increases gradually with the decreasing nacelle angle. As a result, the conversion corridor is relatively narrow in the middle and broadened at both sides gradually, which is representative characteristics of rotor-wing aircraft.
Figure 11b shows the 3D envelope with the SEP value of the rotor wing. Its relationship with airspeed, altitude, and nacelle angle was presented intuitively, which can be used to comprehensively analyze the conversion corridor and envelope in cruise mode. Other performance features, such as altitude seaworthiness and economic efficiency in a predetermined cruise state, can be promptly analyzed as well.
The flight envelope and conversion corridor at sea level are the projection and cross-section of the 3D envelope respectively as shown in Figure 11c,d. Assisted by the 3D envelope, the applicable speed region of the flight test in a certain conversion mode that close to the stall speed can be conveniently determined.
6. Conclusions and Future Work
In this paper, a novel 3D flight envelope and its calculation method were proposed to comprehensively study the flight performance and conversion corridor for V/STOL aircraft with multiple flight modes. The three flight modes, VTOL, conversion, and cruise modes included in the typical flight phase of V/STOL aircraft can be expressed in the envelope intuitively, which reveals its practicality. The contour of parameters of interests, such as SEP, can also be superimposed to demonstrate the corresponding performance in all available flight states, which further enhances the versatility and flexibility. The detailed advantages regarding the envelope generating, performance analysis, and risky boundaries evaluations can be summarized as follows:
- The explicit calculation method enhances the 3D envelope generating efficiency. A concise flowchart is introduced and could be applied to various kinds of V/STOL aircraft. The detailed parameters inside the envelope, for instance, the lift, drag, rated and required power, can be derived after the complete process. Researchers can obtain the conversion corridors at all altitudes, the flight envelope at all nacelle angles, and the altitudes matching different nacelle angles at all velocities in one calculation process;
- The 2D flight envelope and conversion corridor of XV-15 in the literature were used as the verification study of the projection and cross-section of the generated 3D envelope. Then, this was applied to a rotor-wing configuration to demonstrate its versatility. The results from the two case studies not only demonstrate its capability to intuitively present the comprehensive flight performance in a 3D envelope, which is extraordinarily redundant using the traditional 2D diagrams, but also reveal the determinant of the VTOL and cruise mode to performance boundary and massive potentials in the conversion model;
- The 3D flight envelope provides a performance evaluation method to the V/STOL flight profile. A safe and economical flight mission can be conveniently organized based on the 3D flight envelope superimposed by the safety-related parameters. The application in the case study also reflected the proposed 3D flight envelope, can help to support control strategy design, and determine the subject contents of wind tunnel and flight test.
Two key avenues have been identified for future work. The first is to involve more constraints extracted from other disciplines, such as structural strength and aeroelasticity, to the 3D flight envelopes enhancing the fidelity of results. The second is to expand its application to other aspects by introducing the kinematical equations, for example, trajectory optimization, for V/STOL aircraft.
Author Contributions
Conceptualization, T.M. and X.W.; methodology, X.W.; validation, J.F., X.W. and S.H.; investigation, X.W.; resources, T.M.; data curation, X.W. and P.X.; writing—original draft preparation, T.M., X.W. and S.H.; writing—review and editing, J.F. and P.X. All authors have read and agreed to the published version of the manuscript.
Funding
This research received no external funding.
Data Availability Statement
The data presented in this study are available on request from the corresponding author.
Conflicts of Interest
The authors declare no conflict of interest.
Nomenclature
| Maximum airspeed of VTOL mode | |
| Stall airspeed of cruise mode | |
| Cessation airspeed of conversion mode | |
| Thrust | |
| Nacelle angle | |
| Angle of attack | |
| The angle between the thrust and nacelle axis | |
| Lift force | |
| Gravity force | |
| Drag force | |
| Specific excess power | |
| Altitude | |
| The power rating of the engine at an altitude of | |
| Required power | |
| Gravitational acceleration | |
| Airspeed | |
| Rating power at sea level | |
| Atmospheric pressure at an altitude of | |
| Atmospheric pressure at sea level | |
| The atmospheric temperature at sea level | |
| The atmospheric temperature at an altitude of | |
| Induced power | |
| Profile power | |
| Minimum profile power | |
| Parasitic power | |
| Climb power | |
| Airspeed component perpendicular to the rotor disc | |
| Airspeed component parallel to the rotor disc | |
| Rotational speed | |
| Ideal hover-induced velocity | |
| Power coefficient () | |
| Thrust coefficient () | |
| The ratio of airspeed component perpendicular to the rotor disc to ideal hover-induced velocity | |
| Empirical correction factor for disc | |
| The ratio of rotor-induced velocity to ideal hover-induced velocity | |
| Rotor solidity | |
| Drag coefficient of the blade | |
| Rotor advance ratio to drag | |
| Rotor advance ratio | |
| Number of rotors | |
| Transmission loss coefficient | |
| Atmospheric density at an altitude of | |
| Propeller radius | |
| Blade-tip velocity |
References
- Ye, L.; Zhang, Y.; Yang, S.; Zhu, X.; Dong, J. Numerical Simulation of Aerodynamic Interaction for a Tilt Rotor Aircraft in Helicopter Mode. Chin. J. Aeronaut. 2016, 29, 843–854. [Google Scholar] [CrossRef] [Green Version]
- Lightfoot, R. VTOL-1968. In Proceedings of the 5th Annual Meeting and Technical Display, American Institute of Aeronautics and Astronautic, Philadelphia, PA, USA, 21 October 1968. [Google Scholar] [CrossRef]
- Richardson, J.R.; Atkins, E.M.; Kabamba, P.T.; Girard, A.R. Envelopes for Flight Through Stochastic Gusts. J. Guid. Control Dyn. 2013, 36, 1464–1476. [Google Scholar] [CrossRef] [Green Version]
- Sharma, P.; Ochoa, C.; Atkins, E. Sensor-Aware Flight Envelopes for Urban Air Mobility. In Proceedings of the AIAA Scitech 2019 Forum, San Diego, CA, USA, 7 January 2019. [Google Scholar] [CrossRef]
- Anderson, J.D. Aircraft Performance and Design; WCB/McGraw-Hill: Boston, MA, USA, 1999; Volume 1, ISBN 978-0070019713. [Google Scholar]
- McClamroch, N.H. Steady Aircraft Flight and Performance; Princeton University Press: Princeton, NJ, USA, 2011. [Google Scholar] [CrossRef]
- Raymer, D. Aircraft Design: A Conceptual Approach; American Institute of Aeronautics and Astronautics, Inc.: Reston, VA, USA, 2012. [Google Scholar] [CrossRef] [Green Version]
- Fu, J.; Huang, J.; Wang, L.; Song, L. Oscillation Mode Flight Data Analysis Based on FFT. Aircr. Eng. Aerosp. Technol. 2019, 91, 157–162. [Google Scholar] [CrossRef]
- Zhou, P.; Chen, R.; Yuan, Y.; Chi, C. Aerodynamic Interference on Trim Characteristics of Quad-Tiltrotor Aircraft. Aerospace 2022, 9, 262. [Google Scholar] [CrossRef]
- Fu, J.; Heerden, A.S.; Judt, D.; Lawson, C. A Generic Mission-Level Flight Control Surface EMA Power Consumption Simulation Tool. Aerospace 2022, 9, 290. [Google Scholar] [CrossRef]
- Wang, C.; Zhou, Z.; Wang, R. Research on Dynamic Modeling and Transition Flight Strategy of VTOL UAV. Appl. Sci. 2019, 9, 4937. [Google Scholar] [CrossRef]
- Rutherford, J.; Orourke, M.; Martin, C.; Lovenguth, M.; Mitchell, C. Technology Needs for High-Speed Rotorcraft. 1991. Available online: https://ntrs.nasa.gov/citations/19910013823 (accessed on 23 October 2022).
- Wu, Y.; Li, H.; Su, X. A Path Planning Model of a Tiltrotor for Approaching an Aircraft Carrier during Landing. Proc. Inst. Mech. Eng. Part G J. Aerosp. Eng. 2021, 235, 2392–2406. [Google Scholar] [CrossRef]
- Zhang, J.; Yu, W.; Qu, X. A Trajectory Planning Model of Tiltrotor Considering Multi-Phase and Multi-Mode Flight. Proc. Inst. Mech. Eng. Part G J. Aerosp. Eng. 2019, 233, 6019–6031. [Google Scholar] [CrossRef]
- Chang, S.; Bang, H.; Lee, W.; Park, B. Dynamic Modeling and Fuzzy Control for a Small Tiltrotor Unmanned Aerial Vehicle. Proc. Inst. Mech. Eng. Part G J. Aerosp. Eng. 2013, 227, 1468–1487. [Google Scholar] [CrossRef]
- Choi, S.; Kang, Y.; Chang, S.; Koo, S.; Kim, J.M. Development and Conversion Flight Test of a Small Tiltrotor Unmanned Aerial Vehicle. J. Aircr. 2010, 47, 730–732. [Google Scholar] [CrossRef]
- Zhang, Y.; Ye, L.; Yang, S. Numerical Study on Flow Fields and Aerodynamics of Tilt Rotor Aircraft in Conversion Mode Based on Embedded Grid and Actuator Model. Chin. J. Aeronaut. 2015, 28, 93–102. [Google Scholar] [CrossRef] [Green Version]
- Abdallah, A.M. A New Concept for Three-Dimensional Aerodynamic Attitude Flight Envelope. In Proceedings of the 2018 Atmospheric Flight Mechanics Conference; American Institute of Aeronautics and Astronautics, Atlanta, GA, USA, 25 June 2018. [Google Scholar] [CrossRef]
- Roberts, L.; Deckert, W.; Hickey, D. Recent Progress in V/STOL Aircraft Technology. 1981. Available online: https://ntrs.nasa.gov/citations/19810011538 (accessed on 23 October 2022).
- Holsten, J.; Ostermann, T.; Moormann, D. Design and Wind Tunnel Tests of a Tiltwing UAV. CEAS Aeronaut. J. 2011, 2, 69–79. [Google Scholar] [CrossRef]
- Liu, Z.; He, Y.; Yang, L.; Han, J. Control Techniques of Tilt Rotor Unmanned Aerial Vehicle Systems: A Review. Chin. J. Aeronaut. 2017, 30, 135–148. [Google Scholar] [CrossRef]
- Slavik, S.; Klesa, J.; Brabec, J. Propeller Selection by Means of Pareto-Optimal Sets Applied to Flight Performance. Aerospace 2020, 7, 21. [Google Scholar] [CrossRef] [Green Version]
- Cetinsoy, E.; Dikyar, S.; Hancer, C.; Oner, K.T.; Sirimoglu, E.; Unel, M.; Aksit, M.F. Design and Construction of a Novel Quad Tilt-Wing UAV. Mechatronics 2012, 22, 723–745. [Google Scholar] [CrossRef]
- Valavanis, K.P.; Vachtsevanos, G.J. Handbook of Unmanned Aerial Vehicles; Springer: Berlin/Heidelberg, Germany, 2015; Volume 1, ISBN 978-90-481-9707-1. [Google Scholar]
- Wang, C.; Zhou, Z.; Wang, R.; Ding, Y. Study on Ducted Vertical Take-Off and Landing Fixed-Wing UAV Dynamics Modeling and Transition Corridor. Appl. Sci. 2021, 11, 10422. [Google Scholar] [CrossRef]
- Cao, Y.; Chen, R. Investigation on Nacelle Conversion Envelope Analysis Method of Tiltrotor Aircraft. J. Aerosp. Power 2011, 26, 2174–2180. Available online: https://perma.cc/3TTT-PMS4 (accessed on 15 July 2022).
- Johnson, W. Helicopter Theory; Dover Publications Inc.: Mineola, NY, USA, 2012; ISBN 978-0-486-68230-3. [Google Scholar]
- Carlson, E.; Zhao, Y.; Chen, R. Optimal Tiltrotor Runway Operations in One Engine Inoperative. In Proceedings of the Guidance, Navigation, and Control Conference and Exhibit; American Institute of Aeronautics and Astronautics: Portland, OR, USA, 9 August 1999. [Google Scholar] [CrossRef]
- Maisel, M.D. The History of the XV-15 Tilt Rotor Research Aircraft: From Concept to Flight; National Aeronautics and Space Administration, Office of Policy and Plans: Washington, DC, USA, 2000. Available online: https://history.nasa.gov/monograph17.pdf (accessed on 23 October 2022).
- Kleinhesselink, K.M. Stability and Control Modeling of the Tiltrotor Aircraft. 2007. Available online: https://hdl.handle.net/1903/7016 (accessed on 23 October 2022).
- Klein, G.D. Linear Modeling of Tiltrotor Aircraft (In Helicopter and Airplane Modes) for Stability Analysis and Preliminary Design; Naval Postgraduate School: Monterey, CA, USA, 1996; Available online: https://hdl.handle.net/10945/32094 (accessed on 23 October 2022).
- Brown, J.H.; Edenborough, H.K.; Few, D.D. XV-15 Tilt Rotor Test Progress Report; SAE Technical Paper; SAE International: Warrendale, PA, USA, 1977. [Google Scholar] [CrossRef]
- Hwang, S.-J.; Kim, Y.-S.; Lee, M.-K. Tilt Rotor-Wing Concept for Multi-Purpose VTOL UAV. Int. J. Aeronaut. Space Sci. 2007, 8, 87–94. [Google Scholar] [CrossRef] [Green Version]
- Oishi, M.; Tomlin, C. Switched Nonlinear Control of a VSTOL Aircraft. In Proceedings of the 38th IEEE Conference on Decision and Control (Cat. No.99CH36304), Phoenix, AZ, USA, 7–10 December 1999; Volume 3, pp. 2685–2690. [Google Scholar] [CrossRef]
- Ma, T.; Zhang, Z.; Liu, Z.; Wang, X.; Shuai, H. Effect of Rotor Slipstream of Tiltrotor Aircraft in Cruise Mode. J. Beijing Univ. Aeronaut. Astronaut. 2021, 45, 1124–1137. [Google Scholar] [CrossRef]
- Zong, J.; Zhu, B.; Hou, Z.; Yang, X.; Zhai, J. Evaluation and Comparison of Hybrid Wing VTOL UAV with Four Different Electric Propulsion Systems. Aerospace 2021, 8, 256. [Google Scholar] [CrossRef]
Figure 1.
Typical conversion corridor.
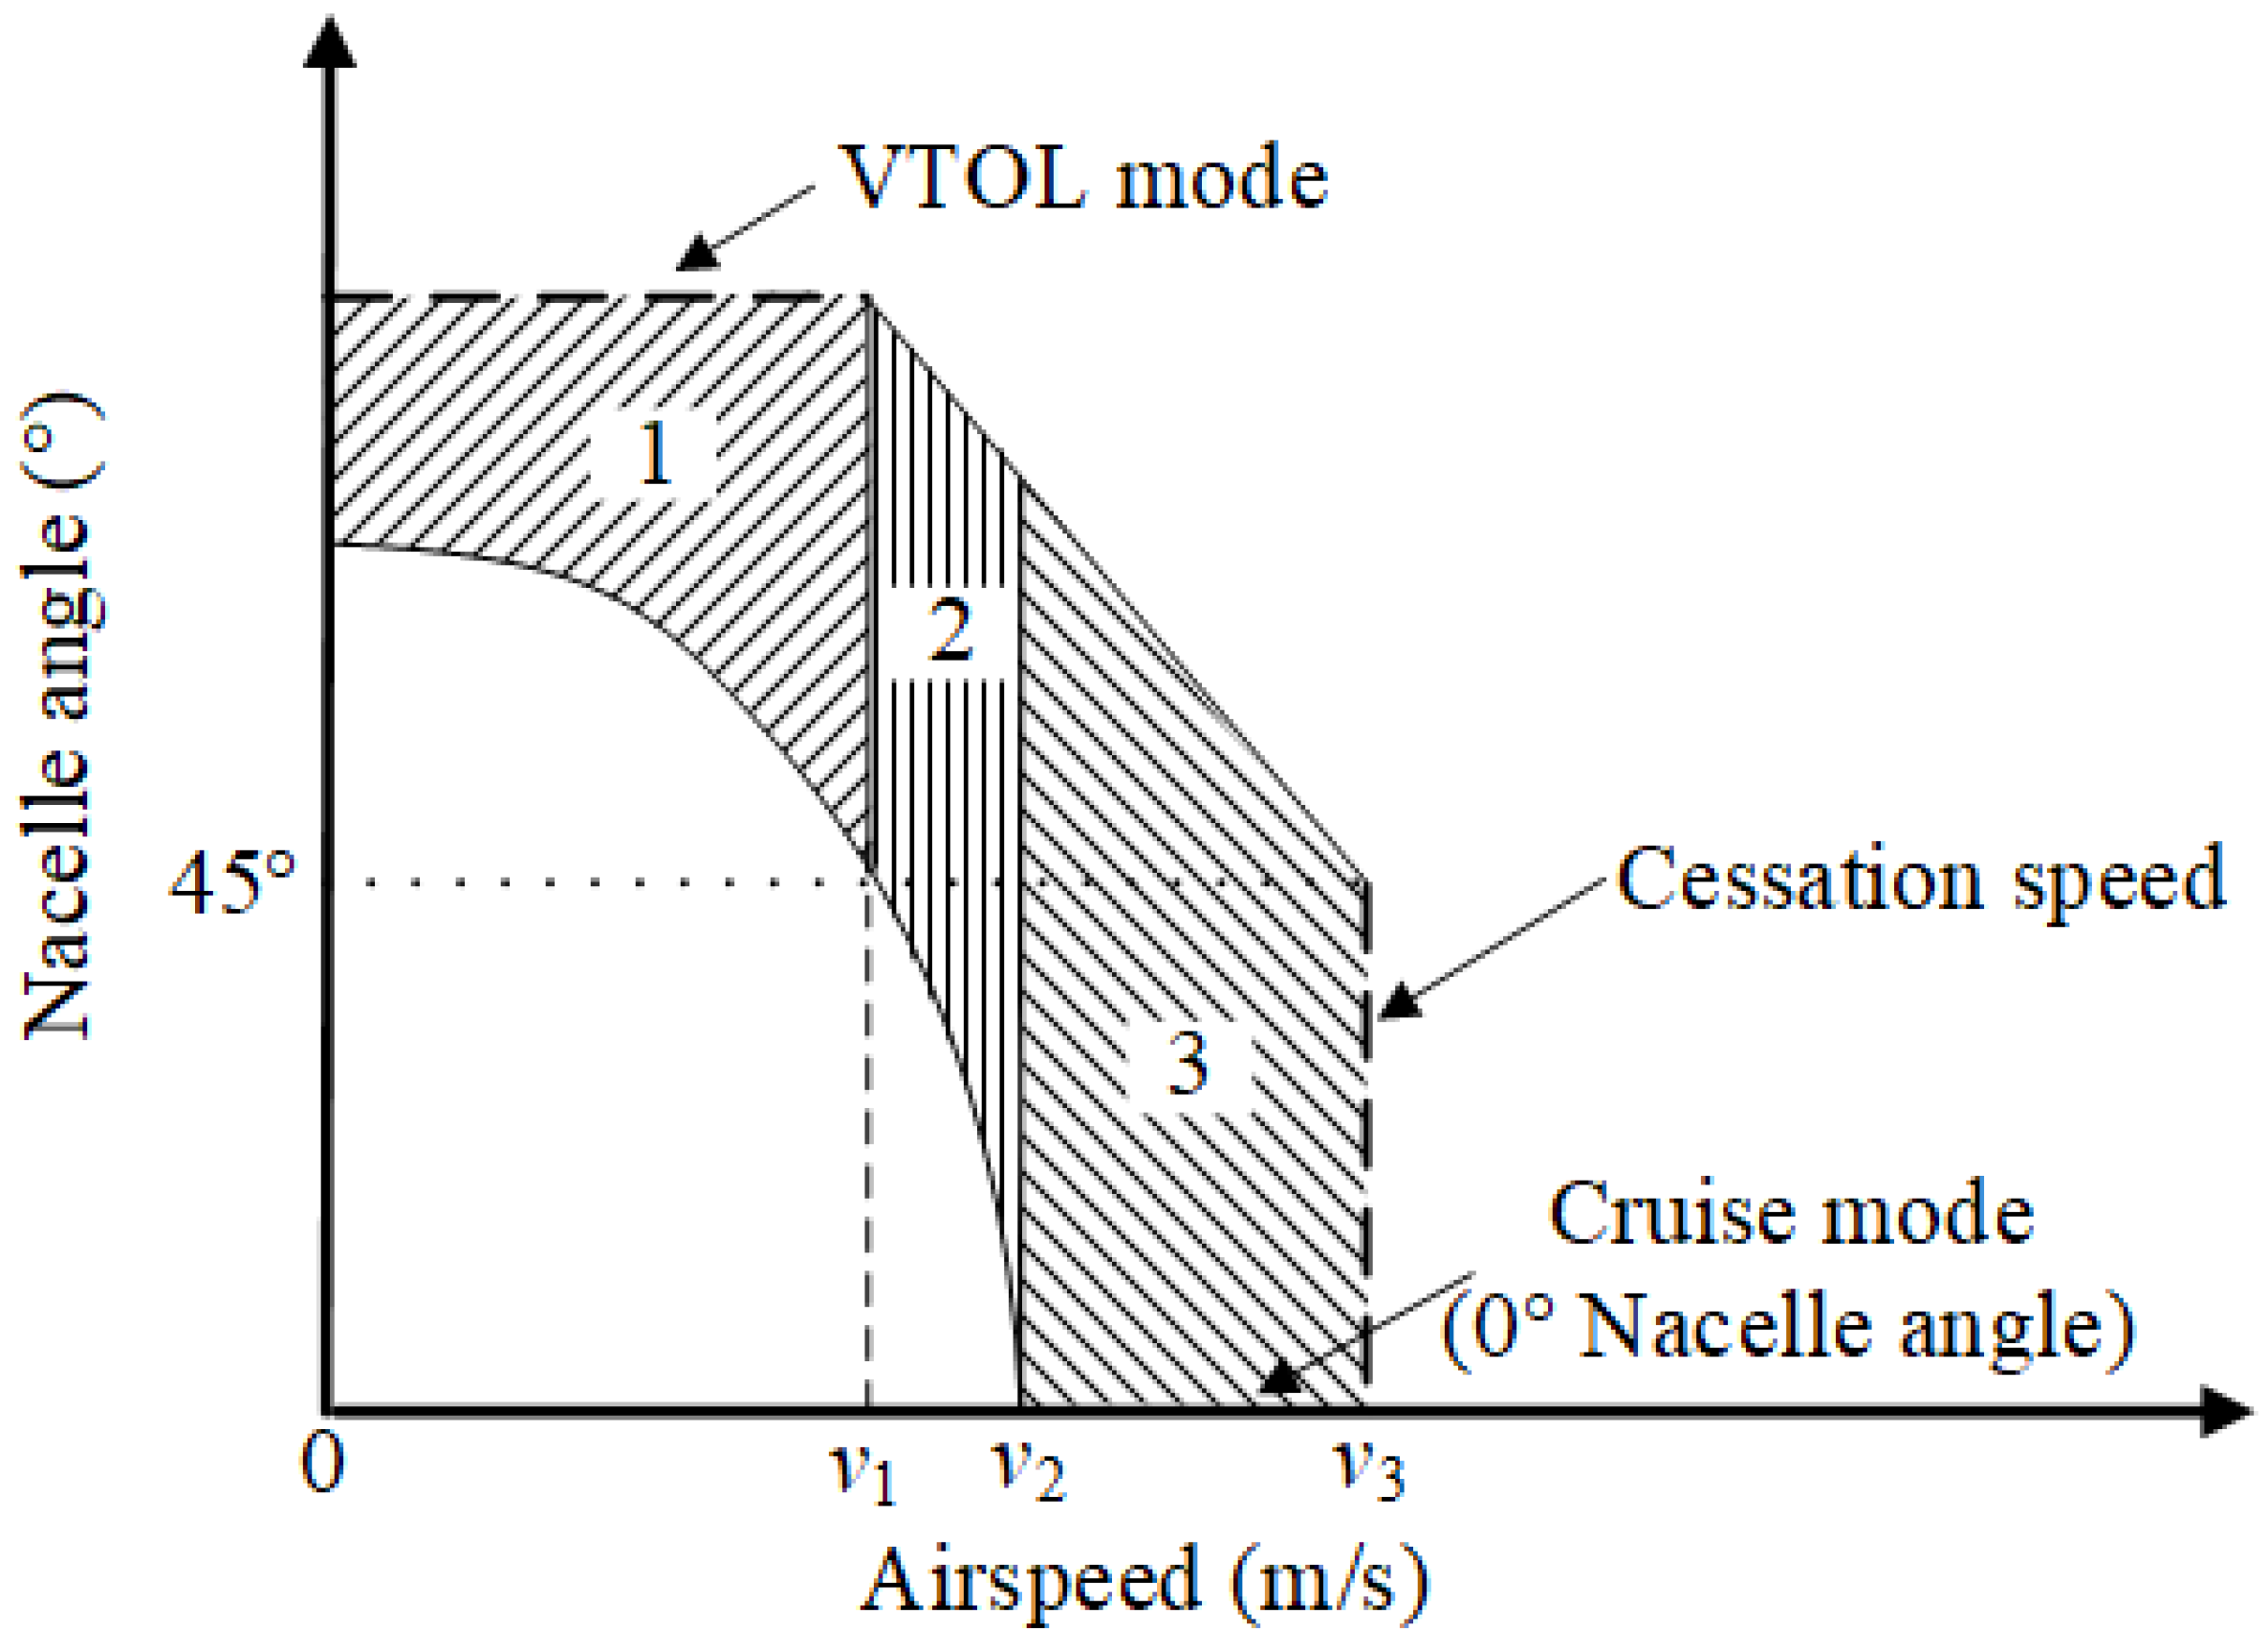
Figure 2.
Longitudinal equilibrium of a V/STOL aircraft in conversion mode.

Figure 3.
(a) Coordinates definitions of the 3D flight envelope; and (b) an example of the 3D flight envelope (XV-15).
Figure 3.
(a) Coordinates definitions of the 3D flight envelope; and (b) an example of the 3D flight envelope (XV-15).
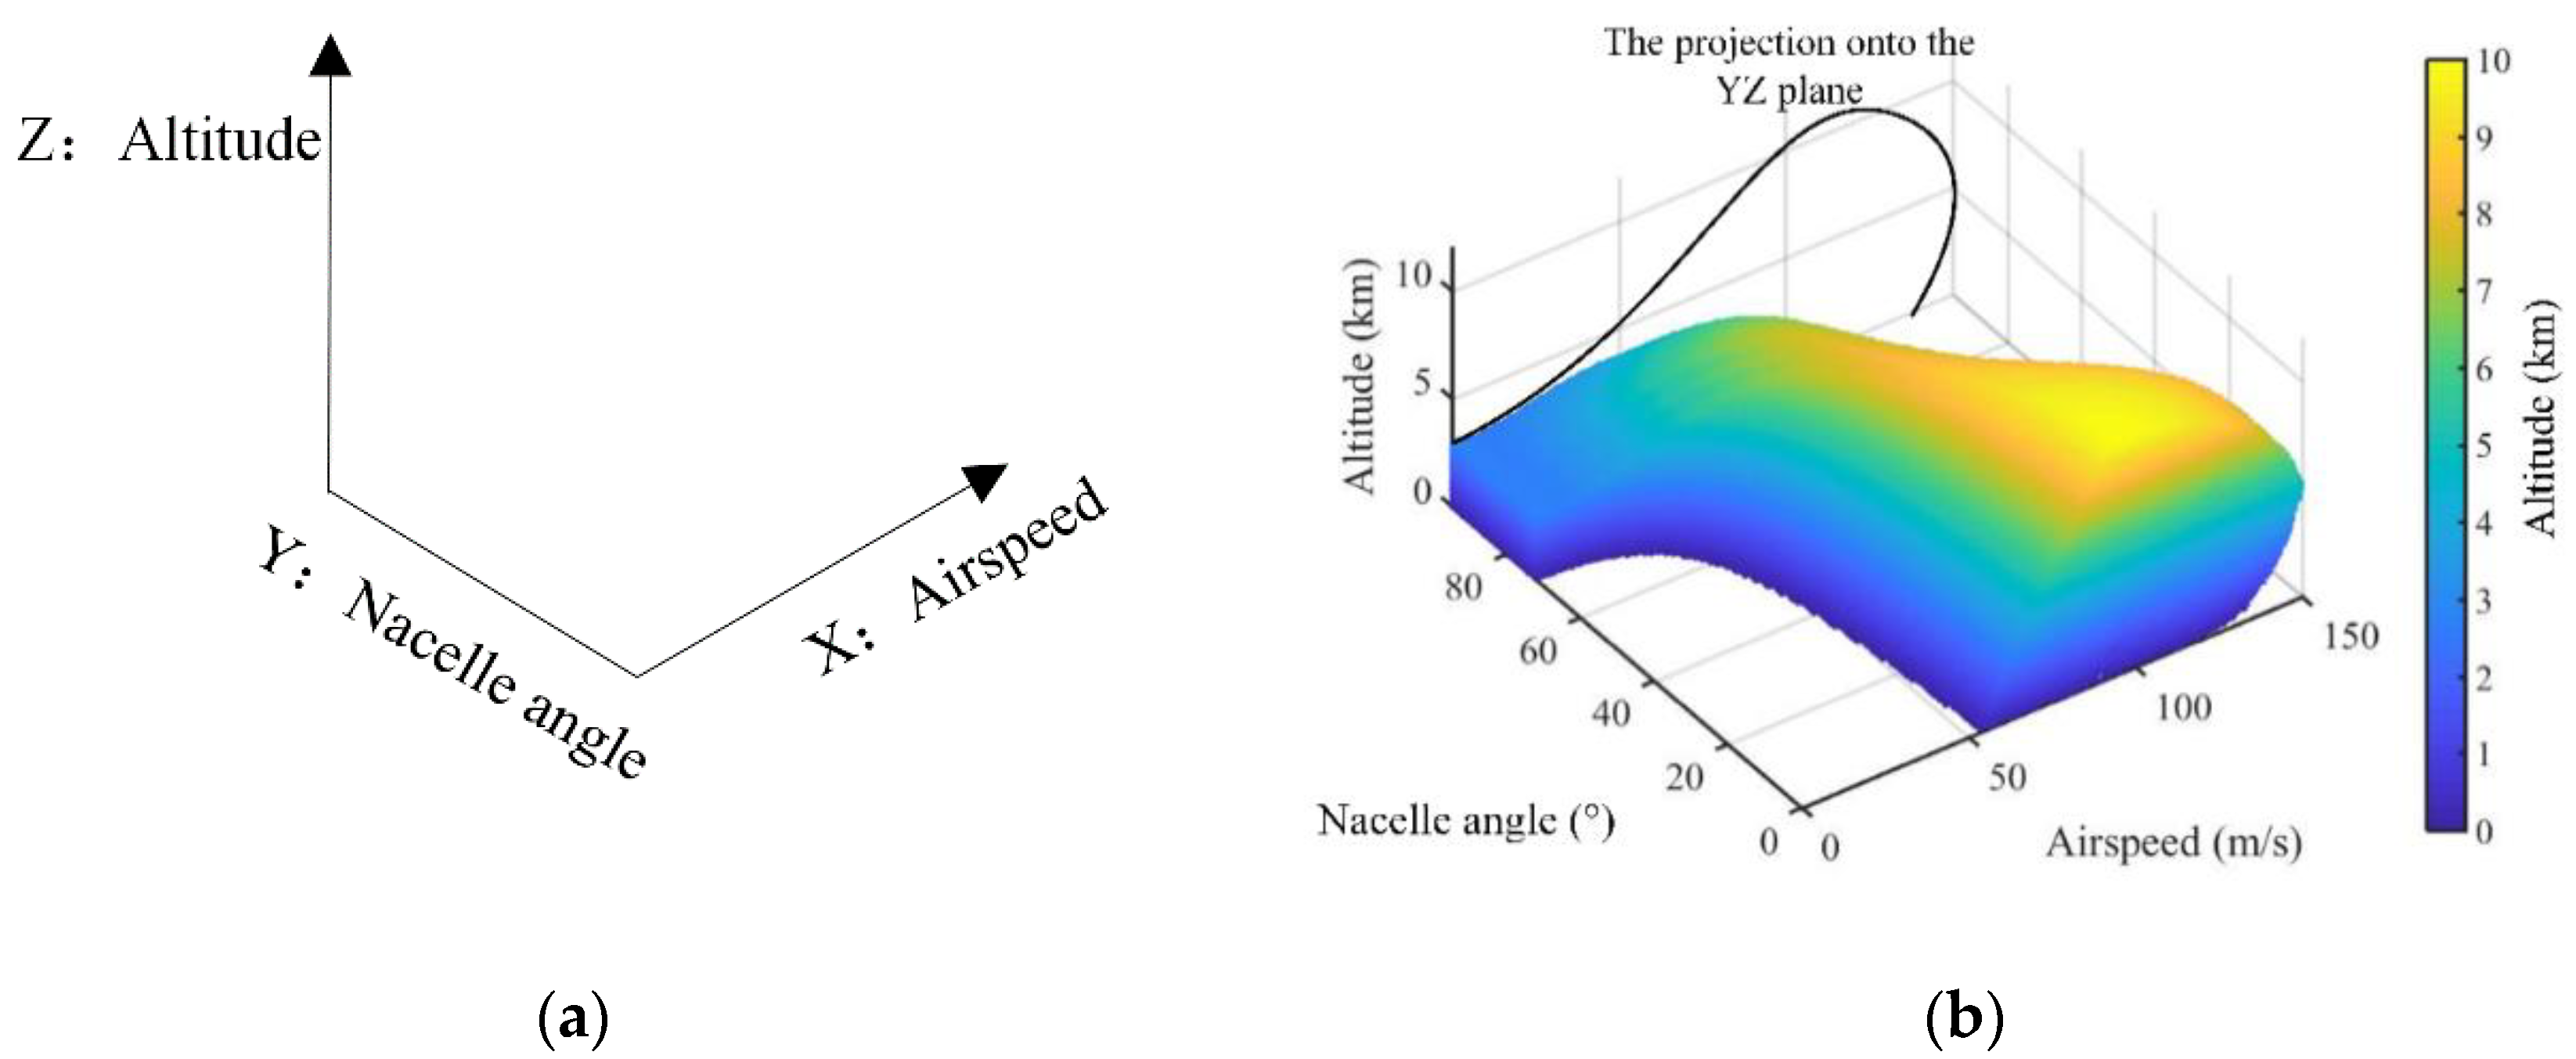
Figure 4.
(a) Coordinates information for the point in 3D envelope; (b) climb and descend curves at different flight modes (vertical, short, and fixed-wing take-off & landing) in 3D envelope; and (c) take-off curves at three take-off flight modes (vertical, short, fixed-wing) colored by the current SEP in 3D envelope.

Figure 5.
(a) Cross-sections of three coordinate values at X, Y, and Z planes; (b) cross-sections colored by SEP values at X, Y, and Z planes; and (c) the 3D flight envelope projection onto the Y-plane.
Figure 5.
(a) Cross-sections of three coordinate values at X, Y, and Z planes; (b) cross-sections colored by SEP values at X, Y, and Z planes; and (c) the 3D flight envelope projection onto the Y-plane.
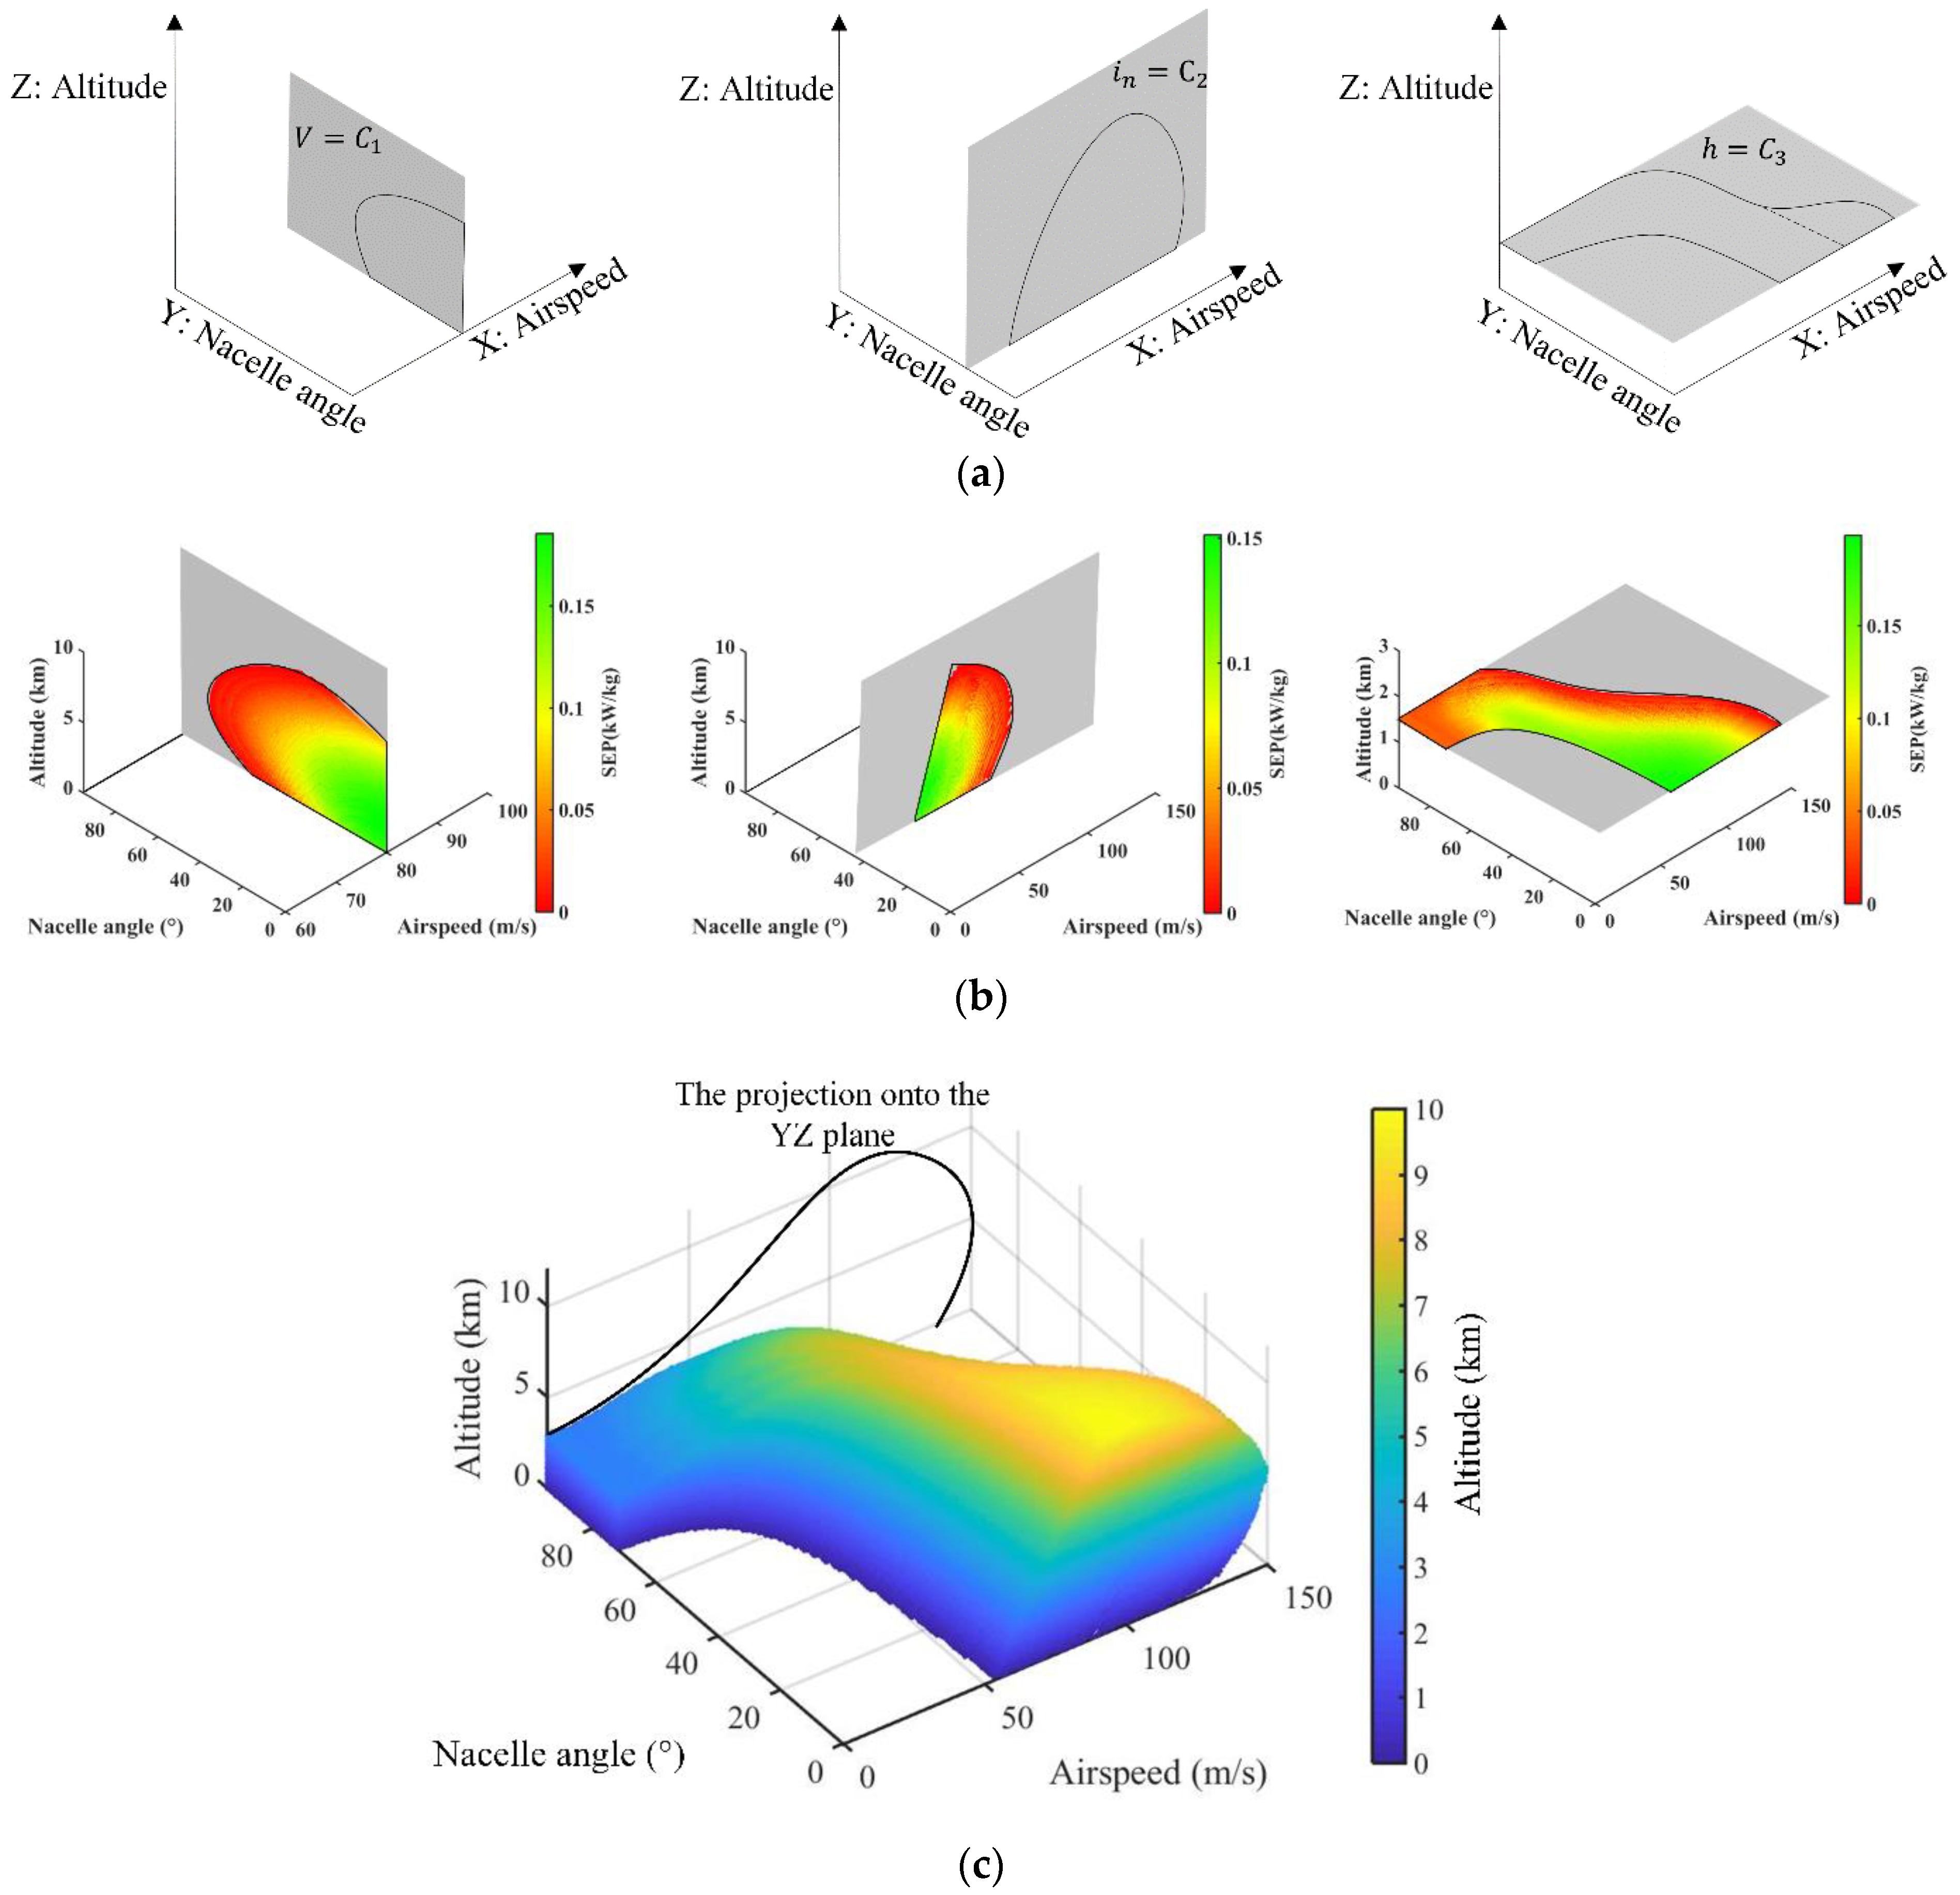
Figure 6.
The flowchart of 3D flight envelope calculation method.
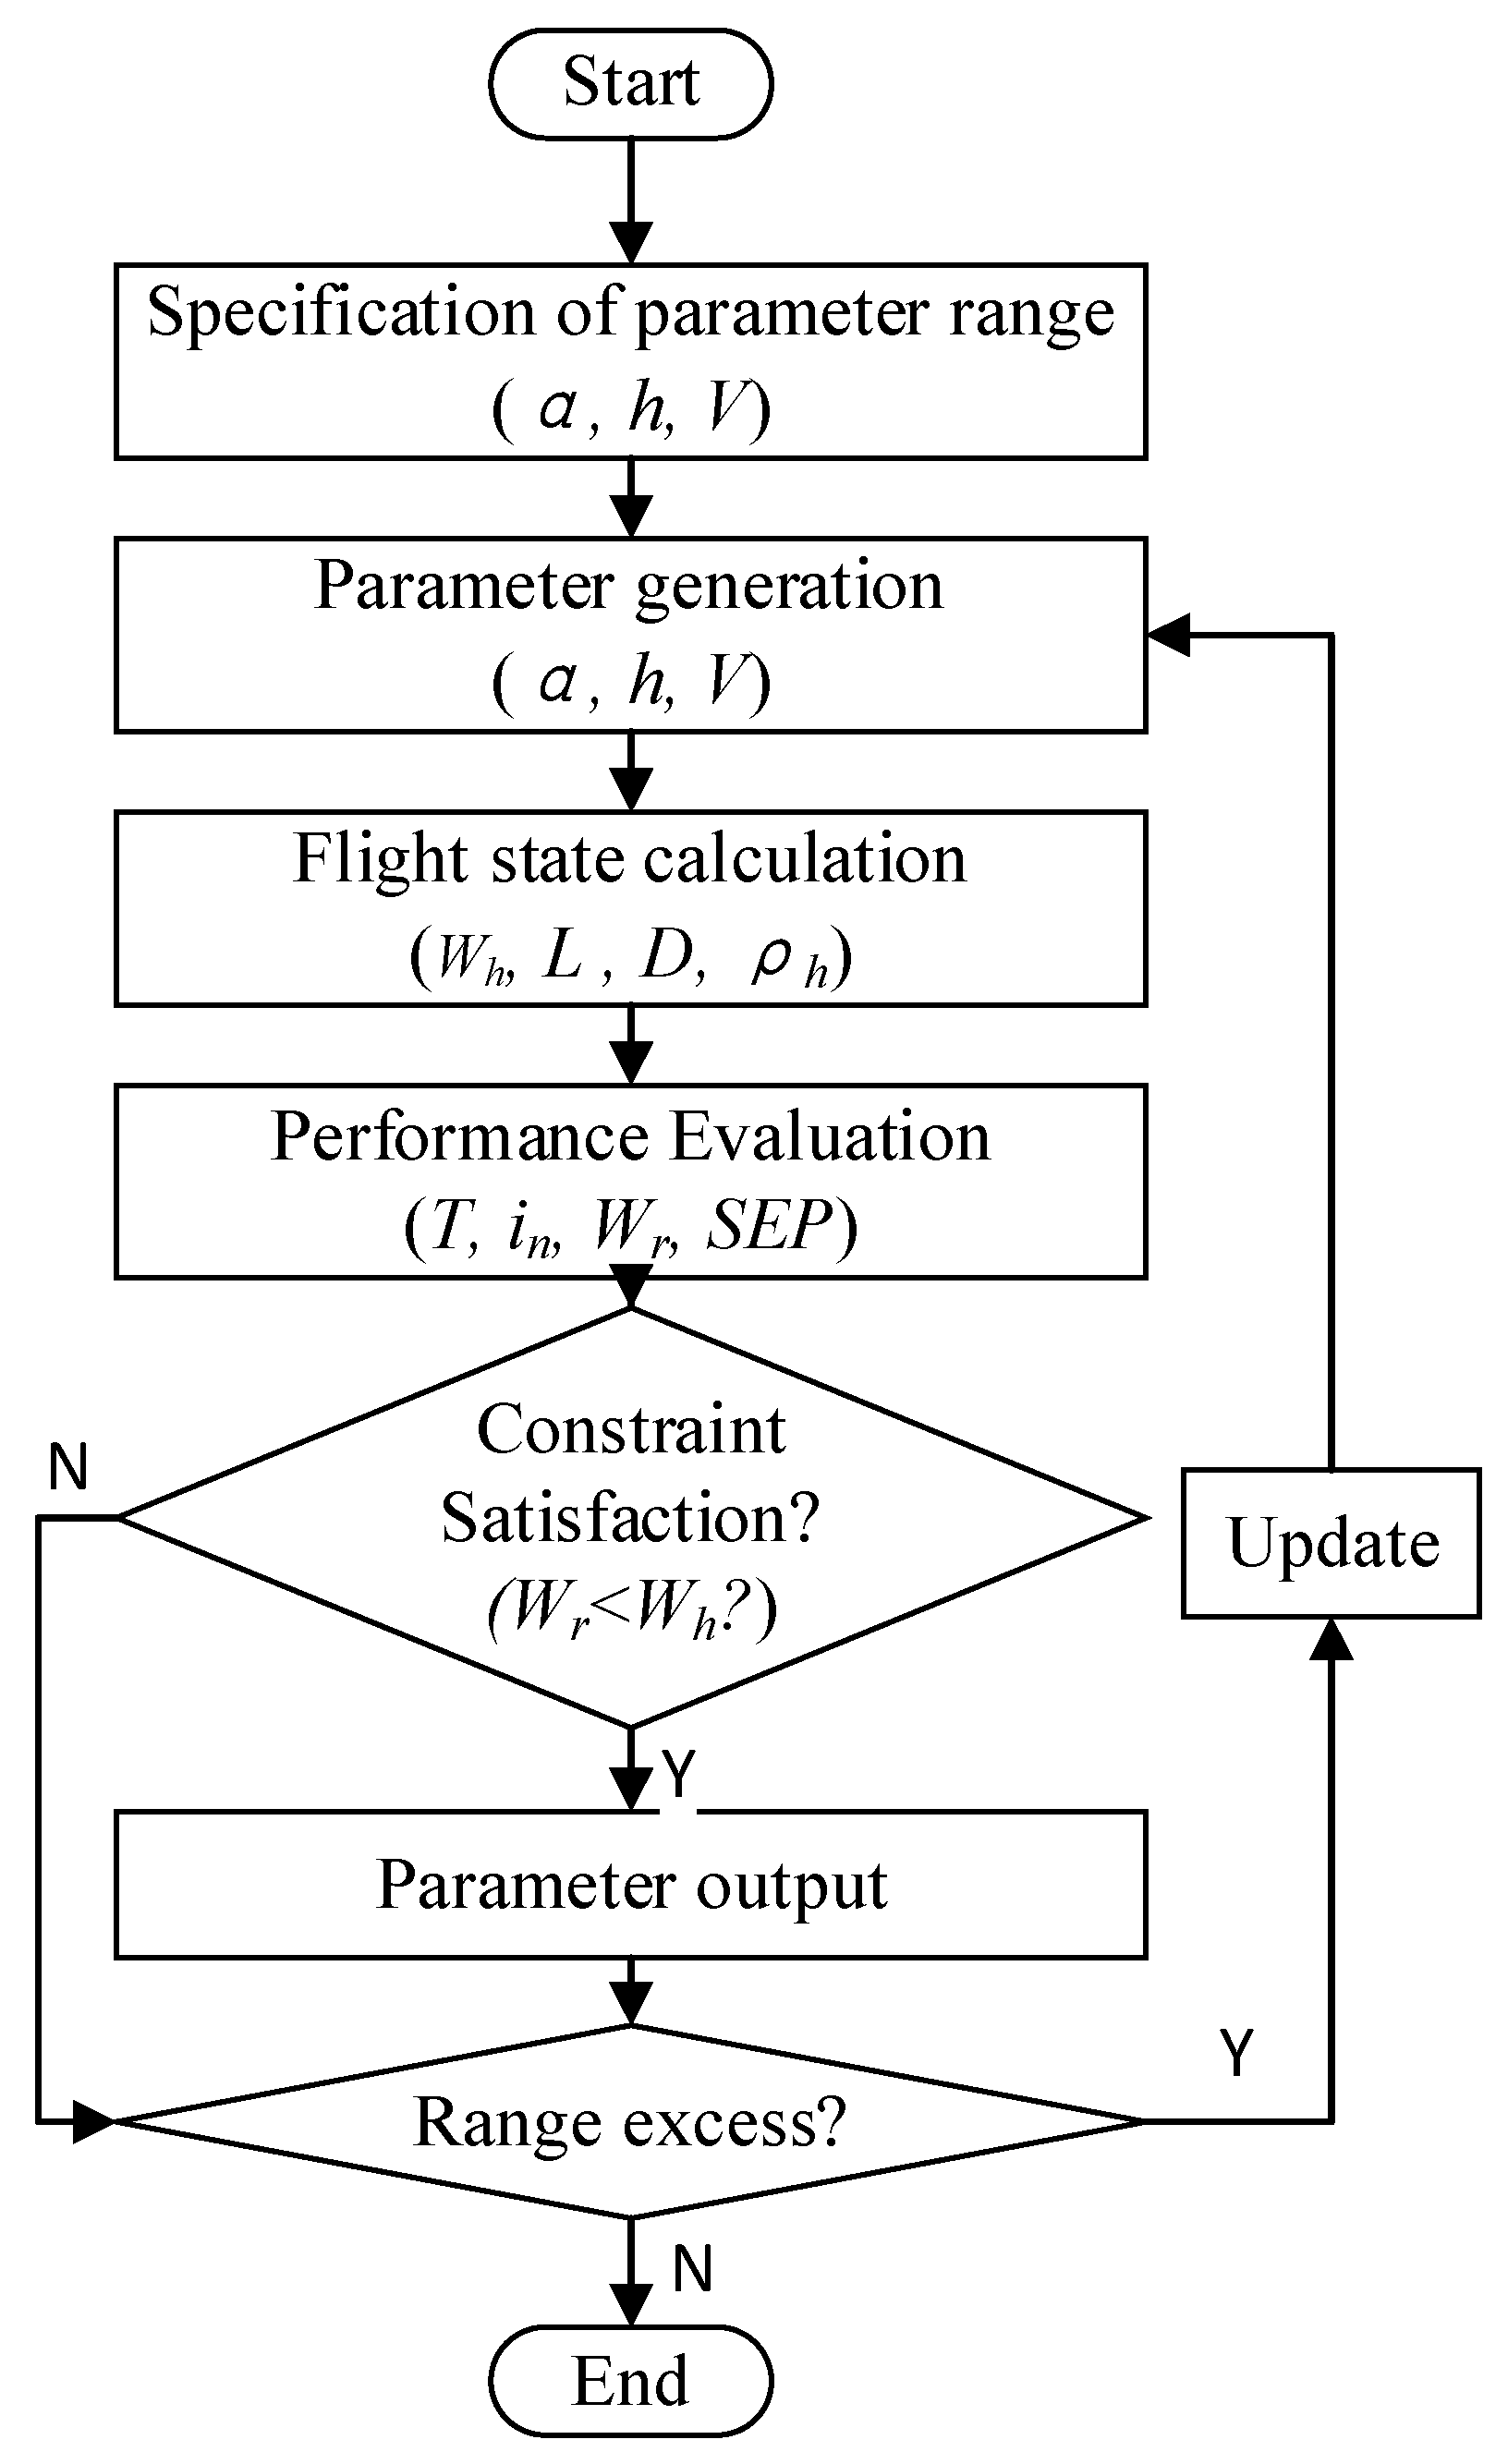
Figure 7.
(a) Discrete 3D envelope obtained by proposed method; and (b) discrete data colored by SEP.
Figure 7.
(a) Discrete 3D envelope obtained by proposed method; and (b) discrete data colored by SEP.

Figure 8.
(a) XV-15 tilt-rotor aircraft; (b) the lift and drag coefficient curves; (c) the calculated 3D envelope of XV-15; and (d) the 3D envelope of XV-15 with SEP contour.
Figure 8.
(a) XV-15 tilt-rotor aircraft; (b) the lift and drag coefficient curves; (c) the calculated 3D envelope of XV-15; and (d) the 3D envelope of XV-15 with SEP contour.
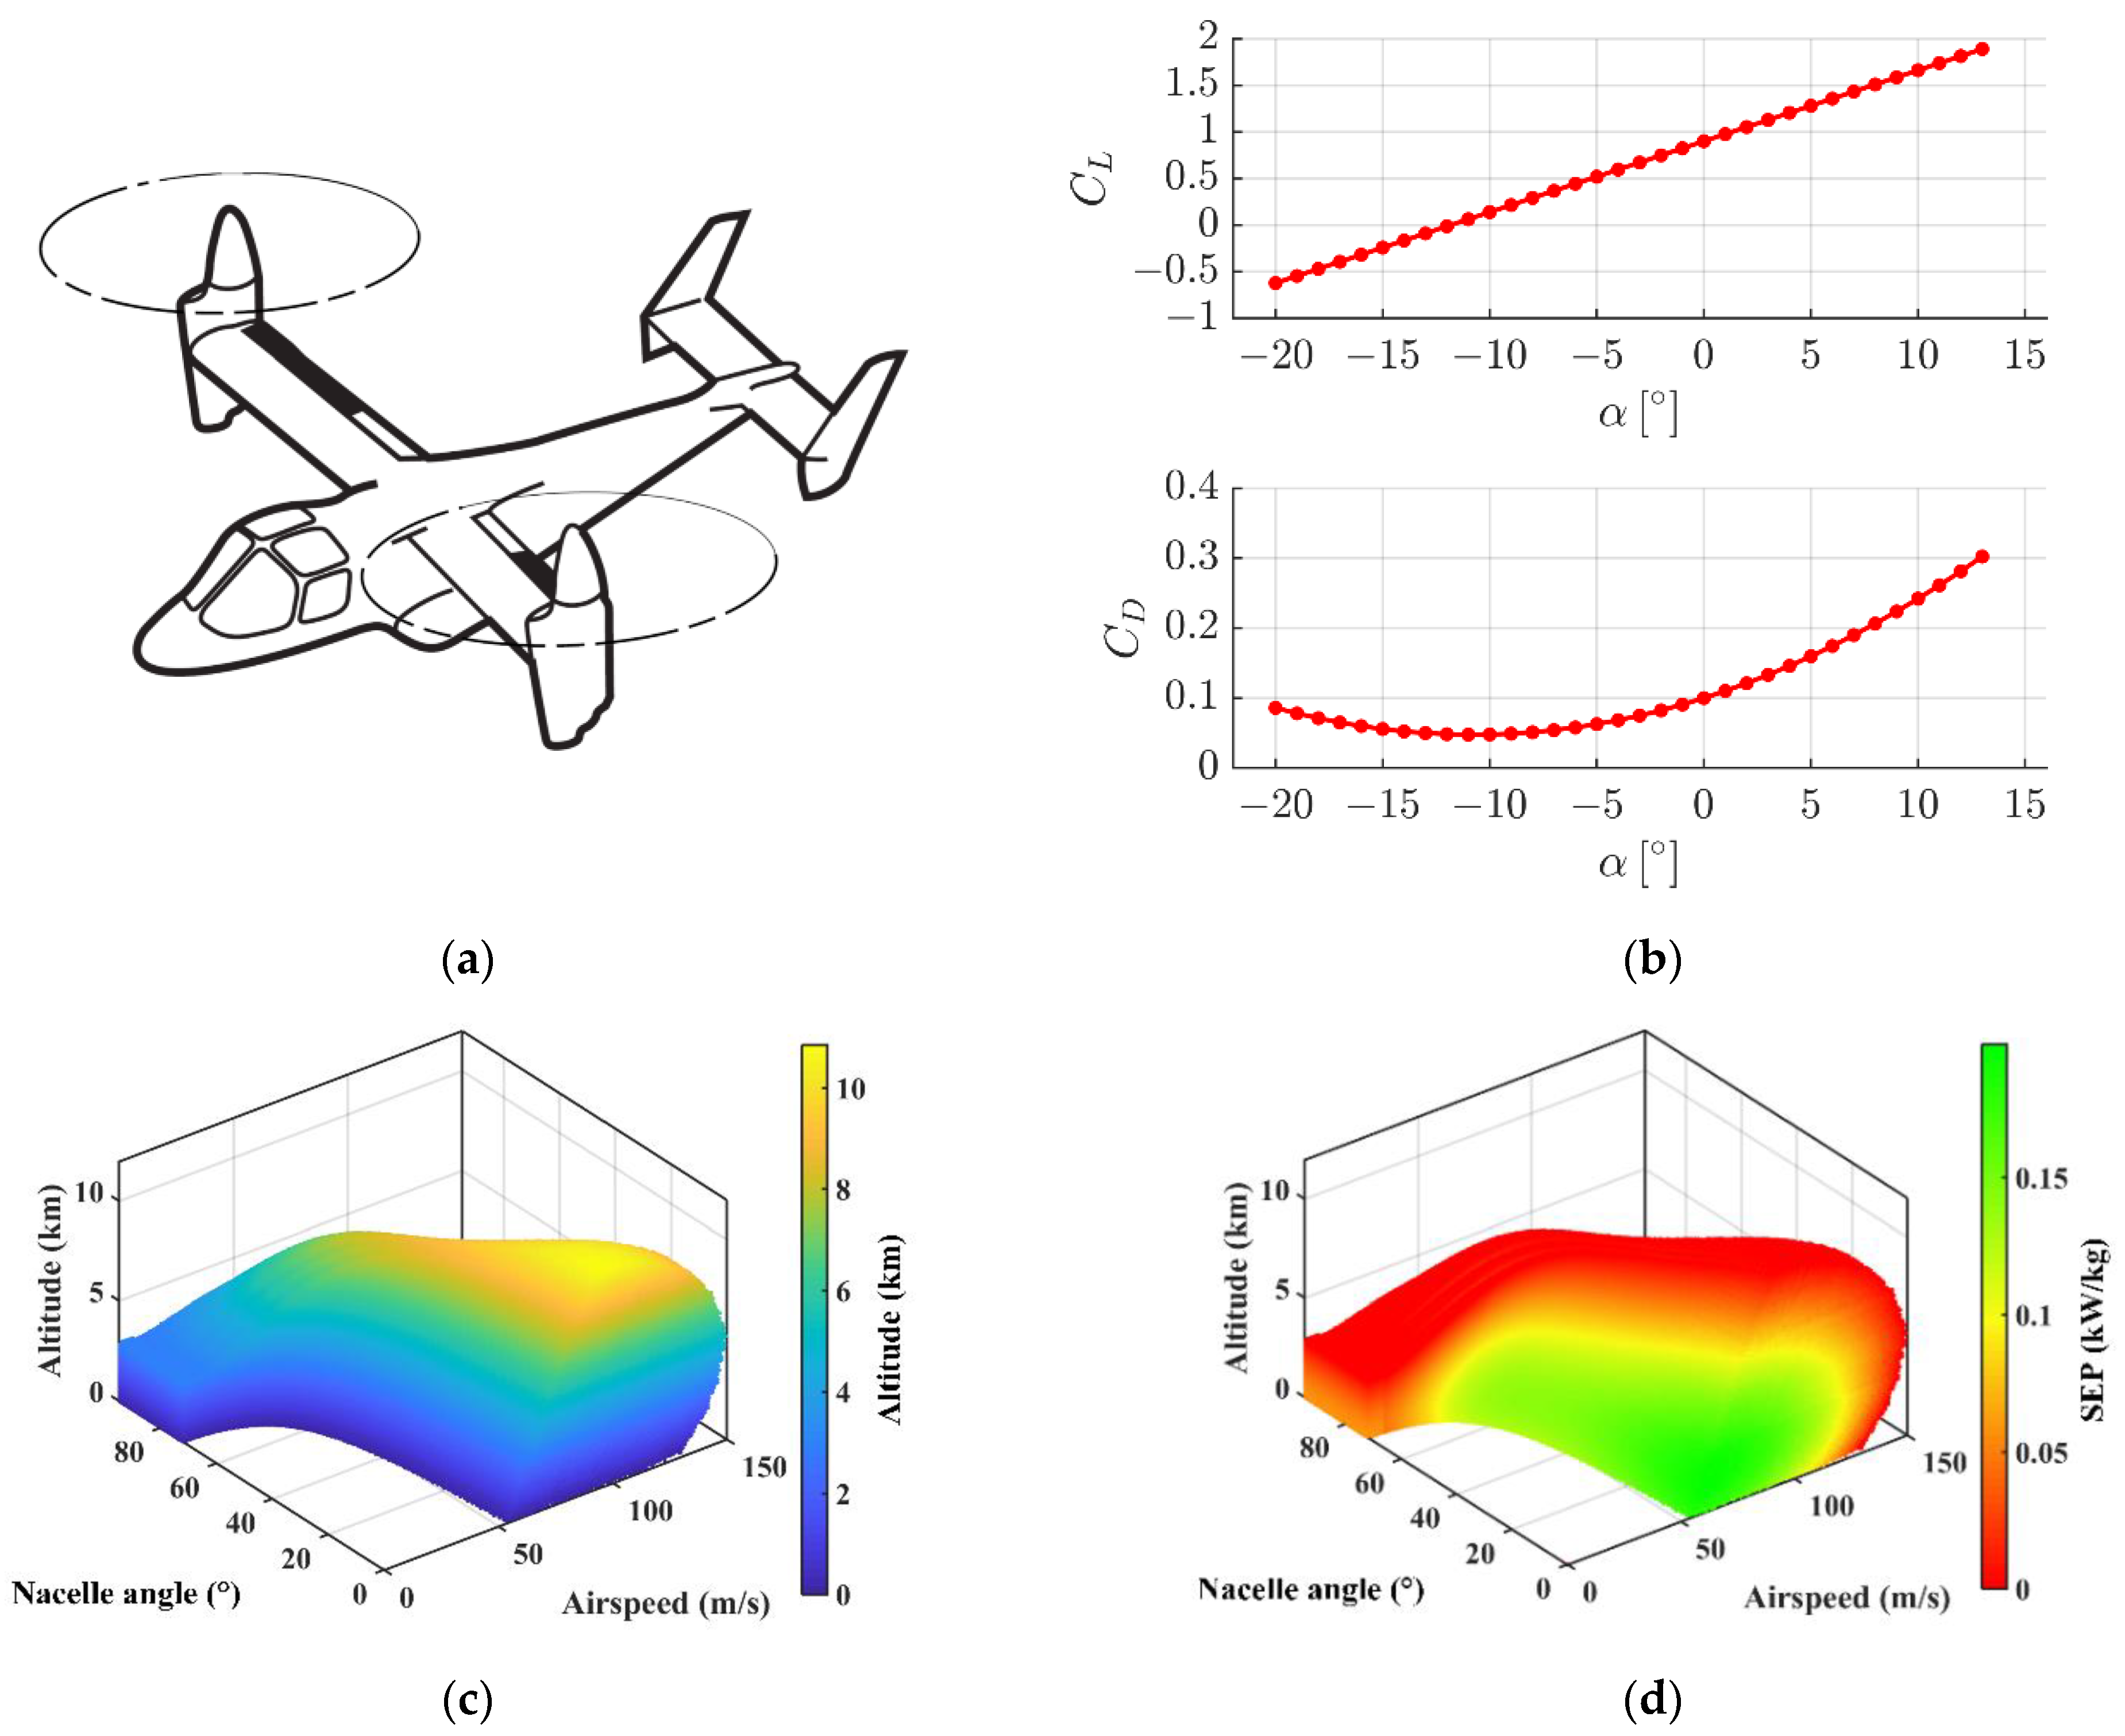
Figure 9.
Comparisons between the XV-15 data sourced from 3D envelope and literature [29]: (a) conversion corridor at sea level; and (b) flight envelope diagram.
Figure 9.
Comparisons between the XV-15 data sourced from 3D envelope and literature [29]: (a) conversion corridor at sea level; and (b) flight envelope diagram.
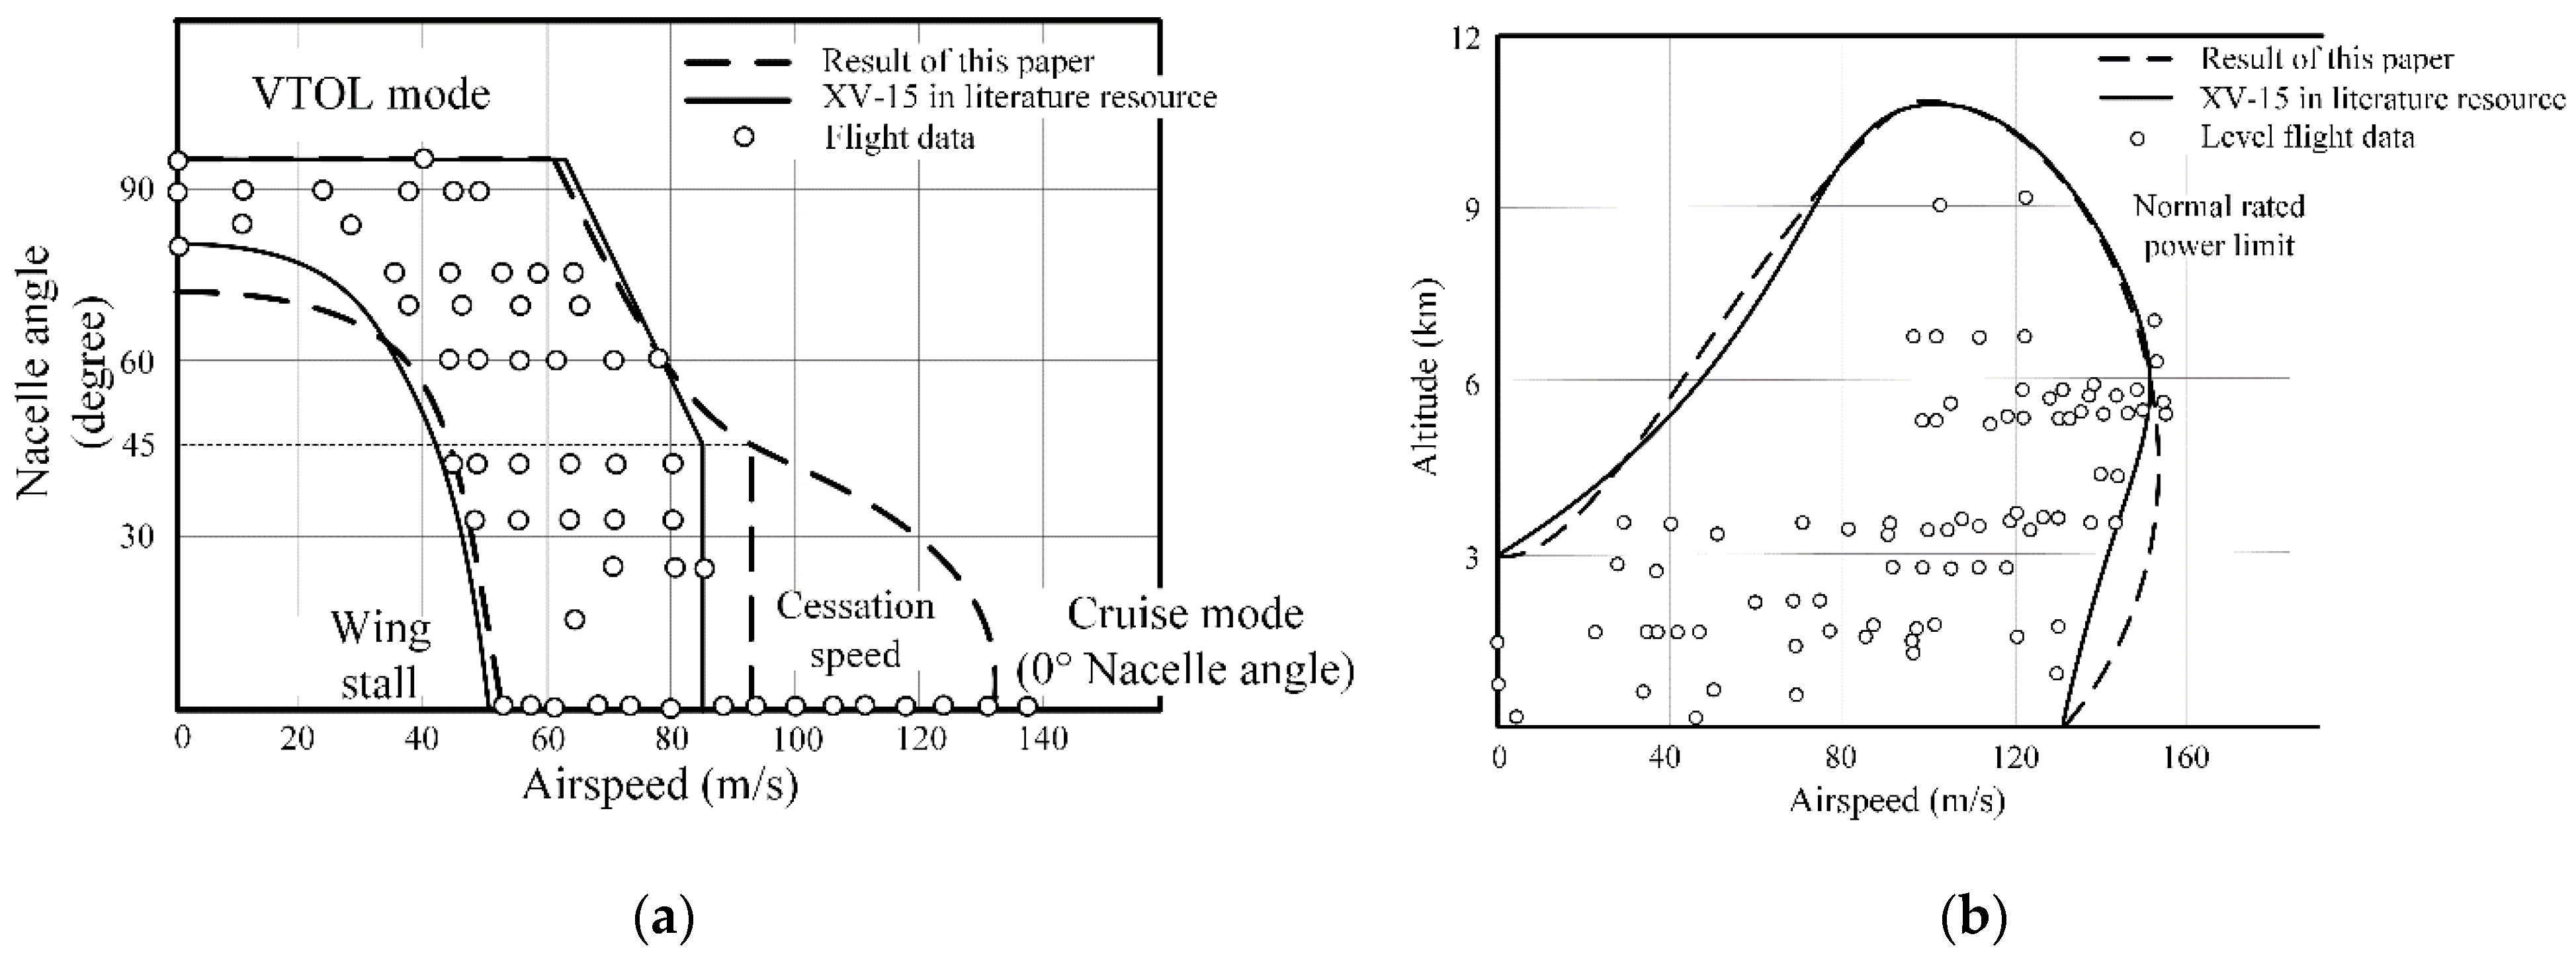
Figure 10.
(a) Three flight modes of the rotor wing (V/STOL, conversion, and cruise) [35]; and (b) aerodynamic characteristics of three nacelle angles.
Figure 10.
(a) Three flight modes of the rotor wing (V/STOL, conversion, and cruise) [35]; and (b) aerodynamic characteristics of three nacelle angles.

Figure 11.
(a) 3D flight envelope of the rotor wing; (b) 3D flight envelope colored by SEP of the rotor-wing; (c) the flight envelope from 3D envelope; and (d) the conversion corridor at sea level.
Figure 11.
(a) 3D flight envelope of the rotor wing; (b) 3D flight envelope colored by SEP of the rotor-wing; (c) the flight envelope from 3D envelope; and (d) the conversion corridor at sea level.

Table 1.
Common take-off and landing strategies of V/STOL aircraft [7].
Table 1.
Common take-off and landing strategies of V/STOL aircraft [7].
| Abbreviation | Explanation |
|---|---|
| VTO | Vertical take-off |
| STO | Short take-off |
| FTO | Fixed-wing take-off |
| VL | Vertical landing |
| SL | Short landing |
| FL | Fixed-wing landing |
Table 2.
Definitions of the parameters in the workflow of the calculation.
| Categories of the Parameters | Definitions |
|---|---|
| Flight conditions | AOA, altitude, airspeed |
| Aerodynamics | Density, lift, drag |
| Performance | Required power, thrust, nacelle angle, SEP |
| Constraints | Engine power rating > required power |
| Outputs | Altitude, airspeed, nacelle angle, SEP |
Table 3.
XV-15 key specifications.
| Specifications | Value |
|---|---|
| Rated power of the two engines | 1737.5 kW |
| Wing area | 15.7 m2 |
| Proprotor number | 2 |
| Proprotor diameter | 7.62 m |
| Proprotor solidity | 0.089 |
| Rotational speed | 589 rpm |
| Design weight | 5897 kg |
| Nacelle angle | 0° to 95° |
| α | −20° to 13° |
| α1 | −5° to 5° |
Table 4.
The salient specifications of the rotor-wing aircraft [35].
Table 4.
The salient specifications of the rotor-wing aircraft [35].
| Specifications | Values |
|---|---|
| Engine rating power | 15 kW (each) |
| Wing area | 1.18 m2 |
| Proprotor number | 2 |
| Proprotor diameter | 1.4 m |
| Proprotor solidity | 0.07 |
| Revolutions per minute | 2100 |
| Take-off weight | 70 kg |
| Nacelle angle range | 0° to 95° |
| α | −90° to 13° |
| α1 | −5°to 5° |
Publisher’s Note: MDPI stays neutral with regard to jurisdictional claims in published maps and institutional affiliations. |
© 2022 by the authors. Licensee MDPI, Basel, Switzerland. This article is an open access article distributed under the terms and conditions of the Creative Commons Attribution (CC BY) license (https://creativecommons.org/licenses/by/4.0/).
Share and Cite
MDPI and ACS Style
Ma, T.; Wang, X.; Fu, J.; Hao, S.; Xue, P. Three-Dimensional Flight Envelope for V/STOL Aircraft with Multiple Flight Modes. Aerospace 2022, 9, 691. https://doi.org/10.3390/aerospace9110691
AMA Style
Ma T, Wang X, Fu J, Hao S, Xue P. Three-Dimensional Flight Envelope for V/STOL Aircraft with Multiple Flight Modes. Aerospace. 2022; 9(11):691. https://doi.org/10.3390/aerospace9110691
Chicago/Turabian StyleMa, Tielin, Xiangsheng Wang, Jingcheng Fu, Shuai Hao, and Pu Xue. 2022. "Three-Dimensional Flight Envelope for V/STOL Aircraft with Multiple Flight Modes" Aerospace 9, no. 11: 691. https://doi.org/10.3390/aerospace9110691
Note that from the first issue of 2016, this journal uses article numbers instead of page numbers. See further details here.