Credit Rating as a Mechanism for Capital Structure Optimization: Empirical Evidence from Panel Data Analysis


1
Department of Management Sciences, COMSATS Institute of Information Technology, Abbottabad 22010, Pakistan
2
Department of Management Sciences, COMSATS Institute of Information Technology, Islamabad 44000, Pakistan
*
Author to whom correspondence should be addressed.
Int. J. Financial Stud. 2018, 6(1), 13; https://doi.org/10.3390/ijfs6010013
Submission received: 8 November 2017
/
Revised: 16 January 2018
/
Accepted: 23 January 2018
/
Published: 25 January 2018
Abstract
:This paper empirically examines the significance of credit ratings for optimal capital structure decisions. Non-financial Asian listed companies, evaluated by Standard and Poor’s, are selected from 2000 to 2016. Panel data analysis with pooled ordinary least square (OLS), fixed effect (FE), and generalized method of moment (GMM) estimation techniques are employed to test the effect of each credit rating scale on capital structure choices. For the problem of heteroskedasticity in OLS, the heteroskedastic white consistent variance is used for the best fit of the model. Findings of all estimation techniques show that the relationship between credit rating scales and leverage ratio is a non-linear inverted U shape. High- and low-rated companies have a low level of leverage, whereas mid-rated companies have a high level of leverage. It is evident that costs and benefits of each rating scale have a substantial effect on the behavior of a company’s choices for optimal capital structure. The study suggests that policymakers, investors, and financial officers should consider credit rating as an important measure of financing decisions.
1. Introduction
The inspiration for this investigation started with the perception that an organization’s financial managers, regulatory authorities, investors, and speculators are concerned by credit ratings when making their investment and financing choices. An ideal capital structure is the best proportion of debt and equity of a firm that augments its value. The optimal capital structure of an organization is one that reduces the relative cost of capital by establishing a harmony between the perfect debt-to-equity ratio. Debt financing normally offers the smallest cost of capital because of its tax shield benefits. Deciding an ideal capital structure is a central necessity of any company’s corporate fund division. A couple of years ago organizations in Europe, Asia and around the globe altogether reinforced their capital structure by deleveraging and reducing liquidity risk due to the financial crisis (Frank and Goyal 2003). Today, various outside variables including credit ratings and macroeconomic elements exist as impetuses for a correction of the financing and speculation choices of European, Asian and worldwide firms. The economy is gradually recuperating, credit spreads are still at verifiable lows, and organization balance sheets have been rebuilt. Firms are concentrating on refinancing risk by increasing cash flows to maintain a strategic distance from future emergencies and expanding securities exchange valuations. All these changes have increased the need for the credit rating to measure financial constraints.
The first formal theoretical, as well as an empirical study (Kisgen 2006), maintained the implications of the model that determined the link between credit ratings and capital structure of the firm. The researcher developed a strong hypothesis, i.e., the “credit rating capital structure hypothesis (CR-CS)”. The hypothesis stated that credit ratings are related to the managerial decision for capital structure since CRs are linked to discrete costs (benefits) with different levels of ratings. The CR-CS hypothesis followed by empirical evidence (Kisgen 2009) identified that credit rating decisions must not be considered useful only for a proxy of default to measure capital structure. Rather, they should be considered for attaining important information for discrete costs and benefits that are influential for the cost of capital of a company.
There are a growing number of empirical studies that scrutinize the effects of credit rating changes on the decisions of capital structure (Naeem 2012; Matthies 2013; Wojewodzki et al. 2017). Credit rating agencies have access to various types of information, such as the business plan of firms, capital expenditure, and the dividend policy designed for future that is not provided to investors, etc. Therefore, credit ratings also help to reduce information asymmetry in the financial markets. Furthermore, bank regulation, insurance companies and broker’s investment in bonds are the main drivers for determining a firm’s rating in the bond market (Duff and Einig 2009; Gul and Goodwin 2010; Chen et al. 2013). The interesting factor in these studies is the complete alleviation of the postulation that there could be differences in the capital structure of a firm due to rating levels. However, the rating level differences and leverage level variations can be explored in a detailed argument. To be specific, low-rated firms are more likely to have a low debt ratio because of having a low credit rating. Such firms establish even a higher cost of debt and more agreements in debt contracts. Another researcher (Diamond 1991) also developed the argument that borrowers having low credit rating would have a high cost of capital when compared with highly rated firms. Naeem (2012) presents empirical findings that a low-rated firm can have some restricted agreements due to its incapable financial strength being shown in low ratings. Researchers have analytically proved that investors are also interested in credit ratings, as these ratings contained additional information, which can serve as a signal to the financial health of firms. Despite being the best-qualified group with respect to creditworthiness, many companies are not publicly rated. Still, financial intermediaries and investors can still allocate funds to these companies due to their internal credit risk assessment processes (De Haan 2017).
Studies from numerous surveys revealed that in order to undertake financing decisions, CFOs of listed and privately-held companies consider credit ratings highly relevant, and this holds particularly for debt-based financing choices (Graham and Harvey 1999; Boot et al. 2006). This literature strand has been extended by various features such as the relationship between capital structure decisions and credit rating (Naeem 2012; Ntswane 2014; Kedia et al. 2017), the relationship between ratings and the probability of default, rating transitions, bank internal credit rating systems, and numerous methodological approaches (Anjum 2012; Stepanyan 2014; Angilella and Mazzù 2015; Sanesh 2016).
The information caught by credit rating assessments can be recognized in corporate financing behavior in a few courses, e.g., through the level of credit ratings, changes in credit ratings or extra information related to ratings such as rating outlook or watch status. Moreover, the degree to which credit rating assessments influences capital structure choices can be evaluated directly or inserted into conventional capital structure theories (Duff and Einig 2009; Kisgen and Strahan 2010; Wojewodzki et al. 2017).
The above-mentioned literature review shows that the focus is two-fold: in the first stream, the focus was on the importance of rating changes, which stated that organizations whose ratings are getting worse generally decrease their leverage. Inversely, firms with (possible) upgraded ratings generally choose to increase their debts due to the low cost of capital and better access to external financing.
However, in the second stream, credit assessments are categorized into investment and speculative grade. Firms in an investment-grade category receive benefits by bringing down the cost of capital due to high ratings. Firms in the speculative-grade category have a generally low level of leverage due to the high cost of debts (Cantor 2004; Bolton et al. 2012).
There are just a few examinations that question the importance of credit rating levels for capital structure choices. The relationship between credit rating and the financial constraint is also very important. The sole presence of credit ratings facilitates the access to outside financing. Besides, high credit ratings are required for many financial instruments, e.g., commercial papers. The cost of external financing significantly decreases with higher credit ratings due to the exponential distribution of probabilities of default with respect to different rating categories. Therefore, for optimal capital structure decision, credit rating is an important measure to be considered.
Past studies and examinations characterize firms as per the rated/non-rated or the investment grade/speculative grade criteria. They do not consider the ordinal idea of ratings or appraisals and, thus, do not categorize firms as indicated by various rating levels inside the investment and speculative grade criteria. Hence, some data might not be caught. Generally, past studies apply credit ratings to monetary instruments, e.g., bonds or commercial papers. These ratings may not represent the real reliability of the issuers (firms) of these financial instruments.
Previous literature has emphasized the relevance of credit ratings and capital structure in the US and European markets. The Asian market has not been considered much by previous researchers, which creates a gap in information collection. However, it is adequately demonstrated by a few researchers that the Asian market has a role in various monetary and regulatory changes in the capital markets of the region.
Therefore, this study is focused on analyzing the above-stated limitations of previous studies and efforts to scrutinize the effect of the corporate credit rating scale for capital structure optimization. Non-financial listed Asian corporations are selected throughout the period of 2000–2016. This study focuses on the most important Asian markets such as China, Japan, Hong Kong, Malaysia, Singapore, South Korea, India, Thailand, and Indonesia. From the last 20 years, the high speed of growth observed within these Asian financial sectors plays a crucial role in the development of those countries.
In this paper, we propose a theoretical framework for ideal capital structures considering the costs and benefits of each rating scale. Credit rating is a measure of financial constraint, particularly liquidity risk, and the productivity of firms to create more funds. First, we draw a connection between the corporate credit rating level and the amount of leverage. Next, we inspect the effect of various corporate factors and industry dummies on capital structure–credit rating association. Furthermore, macroeconomic rudiments are equally utilized as a catalyst to measure the genuine relationship of credit rating scales and optimal capital structure.
The key research question is: does a relationship exist between rating levels and optimal capital structure in Asian firms?
To inspect the research question of the study, the following hypothesis is defined:
H1.
With other elements considered equal, it is expected that there is a non-monotonous inverted u-shaped relationship between credit rating scales and level of leverage.
2. Research Methodology
The methodology used in this study is deductive and quantitative in nature, investigating the importance of credit ratings for optimal capital structure. The sample consists of secondary data. For the empirical analysis of this study, all non-financial companies of selected Asian markets are extracted based on industrial classification given by DataStream and are rated by Standard and Poor’s. For each company, the observed period is 2000 to 2016. The total number of non-financial firms, rated by Standard and Poor’s, are 137. Financial firms and real estate firms are excluded from the sample because they have different financial structures. In this study, just the long-term issuer’s rating is used. The utilization of the long-term issuer rating is vital for the investigation as it helps to examine how the total ability to pay debt or obligations impacts the organization’s capital structure choices. To inspect the effect of credit rating scales on the leverage ratio, the coding method is formulated. The coding method consists of the real credit ratings of the companies. Codes from 1 to 6 are assigned to the broad rating category (BCR) and for each rating scale (ICR); codes are assigned from 1 to 16 (see Table 1).
2.1. Conceptual Framework
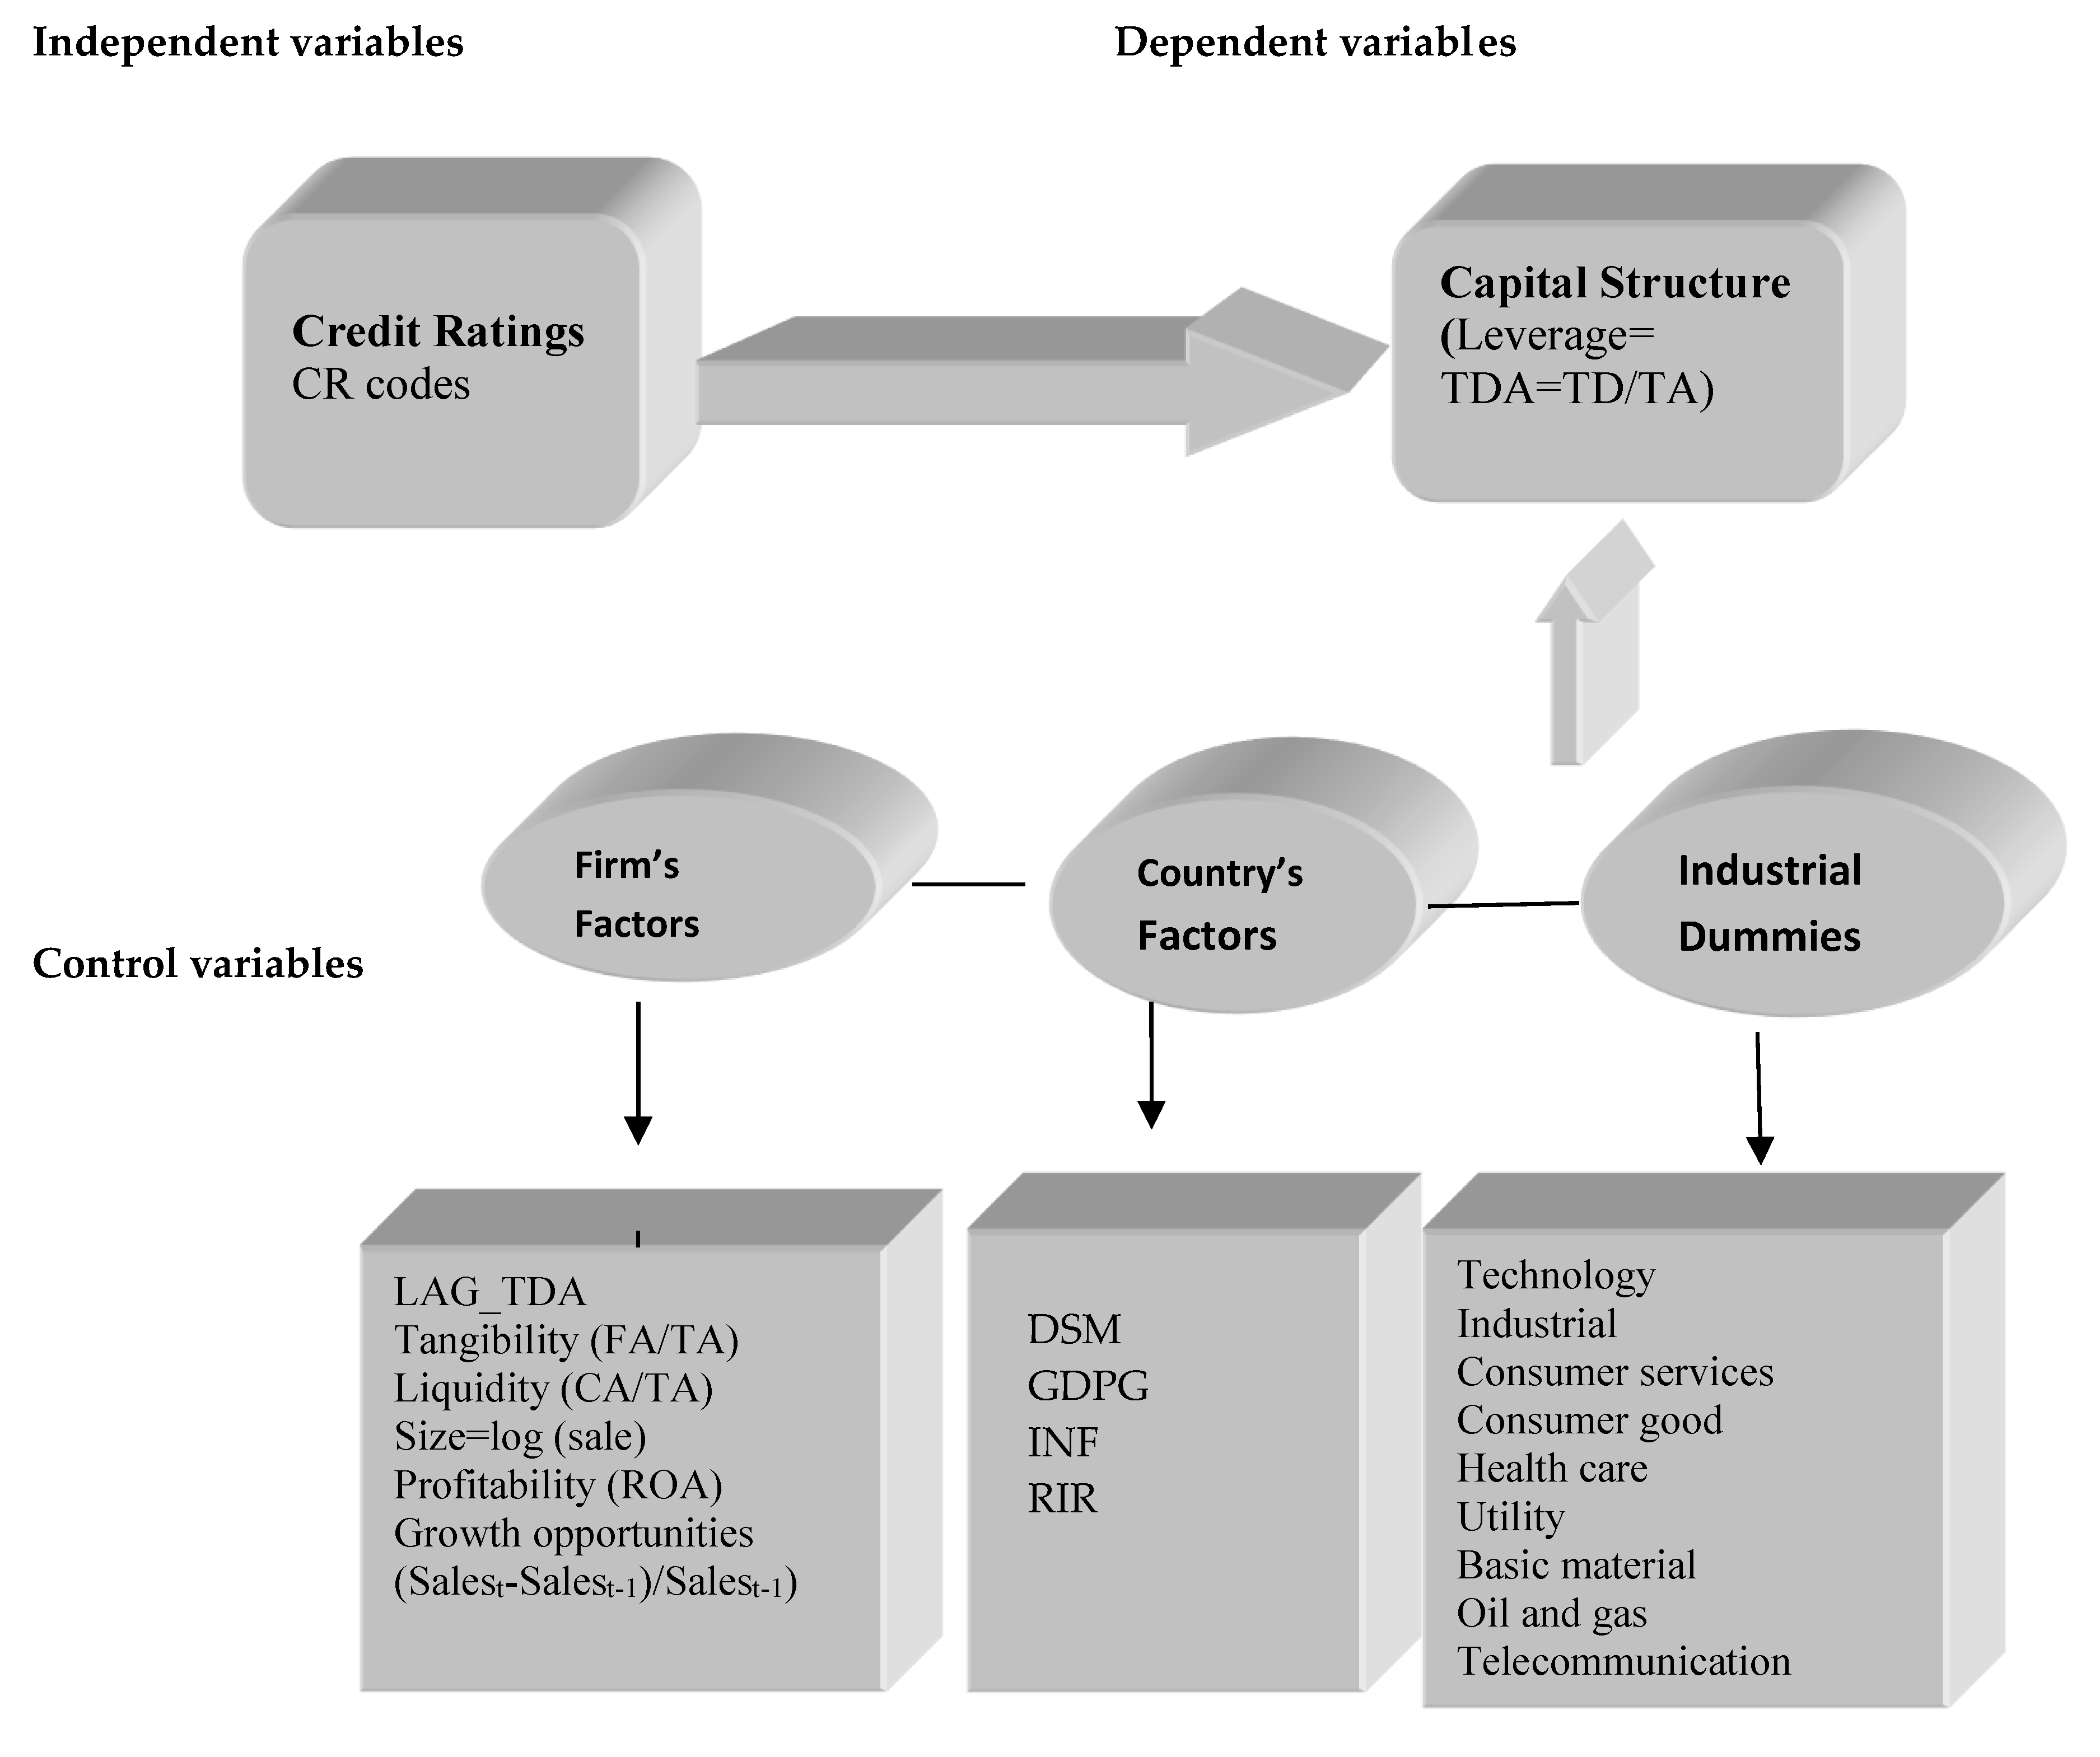
To test the effect of each rating level on the level of leverage ratio, the following dependent, independent and control variables are used. The leverage ratio is the most popular measure of the capital structure; therefore, the dependent variable is a total-debt-to-total-assets ratio (TDA) and is used to measure the leverage. The independent variable is each credit rating scale (ICR) issued by Standard and Poor’s and it is measured by the ordinal coding scheme mentioned above in Table 1. The control variables in the model are the firm’s factors, country factors and industry dummies (ID).
Firm factors (financial ratios) consist of lag of TDA (LAG_TDA), profitability (ROA) measured by return on assets. And tangibility (TANG) measured by fixed assets divided by total assets. Liquidity (LQDT) is equal to current assets divided by total assets. Size (SIZ) is measured by the log of sales. Growth opportunities (GROPE) are measured by () (DataStream).
In our sample, macroeconomic components are utilized to look at how macroeconomic conditions change corporate financing decisions. All country variables in our investigation are time-variant factors over years and they are chosen from the World Bank database. Four macroeconomic variables are used as a catalyst including the domestic stock market (DSM) measured by percentage of market capitalization to GDP growth, GDP growth (GDPG), inflation (INF) measured by the annual growth rate of the GDP implicit deflator, and real interest rate (RIR), (World bank database).
Nine industry dummies are used, such as technology (TECD), industrial (INDSD), consumer services (CSD), consumer good (CGD), health care (HCD), utility (UTILD), basic material (BMD), oil and gas (OGD), and telecommunication (TELD) (DataStream). Figure 1 illustrates the conceptual framework of the study.
2.2. Estimation Techniques
Many prior empirical studies that discuss the association of credit ratings and capital structure have used the pooled OLS method, (Kisgen 2006b, 2009; Mittoo and Zhang 2008; Naeem 2012). Pooled OLS is a traditional econometric regression and is used if the errors are independent of time and individual, so this model is usually restrictive and unrealistic especially due to endogeneity and heteroskedasticity issues in data. Due to the limitations of pooled OLS and the dynamic nature of the capital structure decision, the present study adopted three econometric models to measure the importance of each credit rating level in the capital structure decision, including pooled OLS, fixed effect (FE) approach and generalized method of moments (GMM) estimation. OLS estimator of β0 and β1 is unbiased in small samples but in a large sample, OLS estimation and usual standard errors are neither efficient nor valid, therefore the fixed effect model is used for analyzing the impact of variables that vary over time. The fixed effect model also assumes that time-invariant characteristics are unique, and it is not correlated with other individual characteristics. Moreover, the fixed effect technique removes the effect of time-invariant effects from the independent variables. There are also some limitations in the fixed effect model; if the error term is correlated the FE approach is not efficient. Moreover, if all independent variables are exogenous, then FE estimates will be constant. According to prior studies, dynamic panel models play a significant role in corporate finance research. To overcome the drawbacks in both models this study also utilizes the generalized method of moment (GMM) (Arellano and Bond 1991). Currently, GMM is extensively used for estimating dynamic capital structure decision (Antoniou et al. 2008; Öztekin and Flannery 2012; Cheng 2014; Lu et al. 2015). The two-step GMM is employed in this study. GMM is the best estimation technique for dynamic panel data and generally can be utilized in these situations, i.e., there is heteroskedasticity and autocorrelation, there is fixed individual effect, the independent variables are not totally exogenous and can be related to past events, and the error term and that the data sample has small T time period and large individual N (Cheng 2014).
Based on the abovementioned discussion the following equation is specified for the current study. Lag value of the dependent variable (LAG_TDA) is also included in the model and it helps to solve heteroskedasticity and autocorrelation problem.
TDA is the dependent variable. ICR is the independent variable and ICR2 is the square to ICR. All others are control variables such as firm factors, industry dummies (ID) and macroeconomic variables. εit is the error term.
Antoniou et al. (2008) suggested that the GMM estimator uses all past information of dependent variables as instrument variables and first takes differences to remove the individual effects. When more instruments are introduced, it will improve the efficiency of the estimator. The present study also uses exogenous instruments, growth opportunity (GROPE) and domestic stock market (DSM) with GMM by using the proc panel procedure. For robust evidence, the proc reg procedure is used to fit the model by heteroskedasticity white consistent variance.
3. Results and Discussion
3.1. Descriptive Statistics
The complete, descriptive statistics of the variables are conferred in this section together with the graphical presentation of the debt ratios of Asian corporations. In descriptive statistics, the focus is on the leverage ratio and credit ratings, as they are the main variables of interest of the study. Table 2 shows that average leverage ratio is 25% in Asian companies, meaning that Asian companies avoided a large number of debts in their capital structure. The standard deviation of leverage is 0.177, which shows considerable variation in the sample. Growth opportunities (GROPE) and the domestic stock market (DSM) show huge variation, which can be due to companies from different developed and developing markets, such as Japan, China, India, Malaysia, etc.
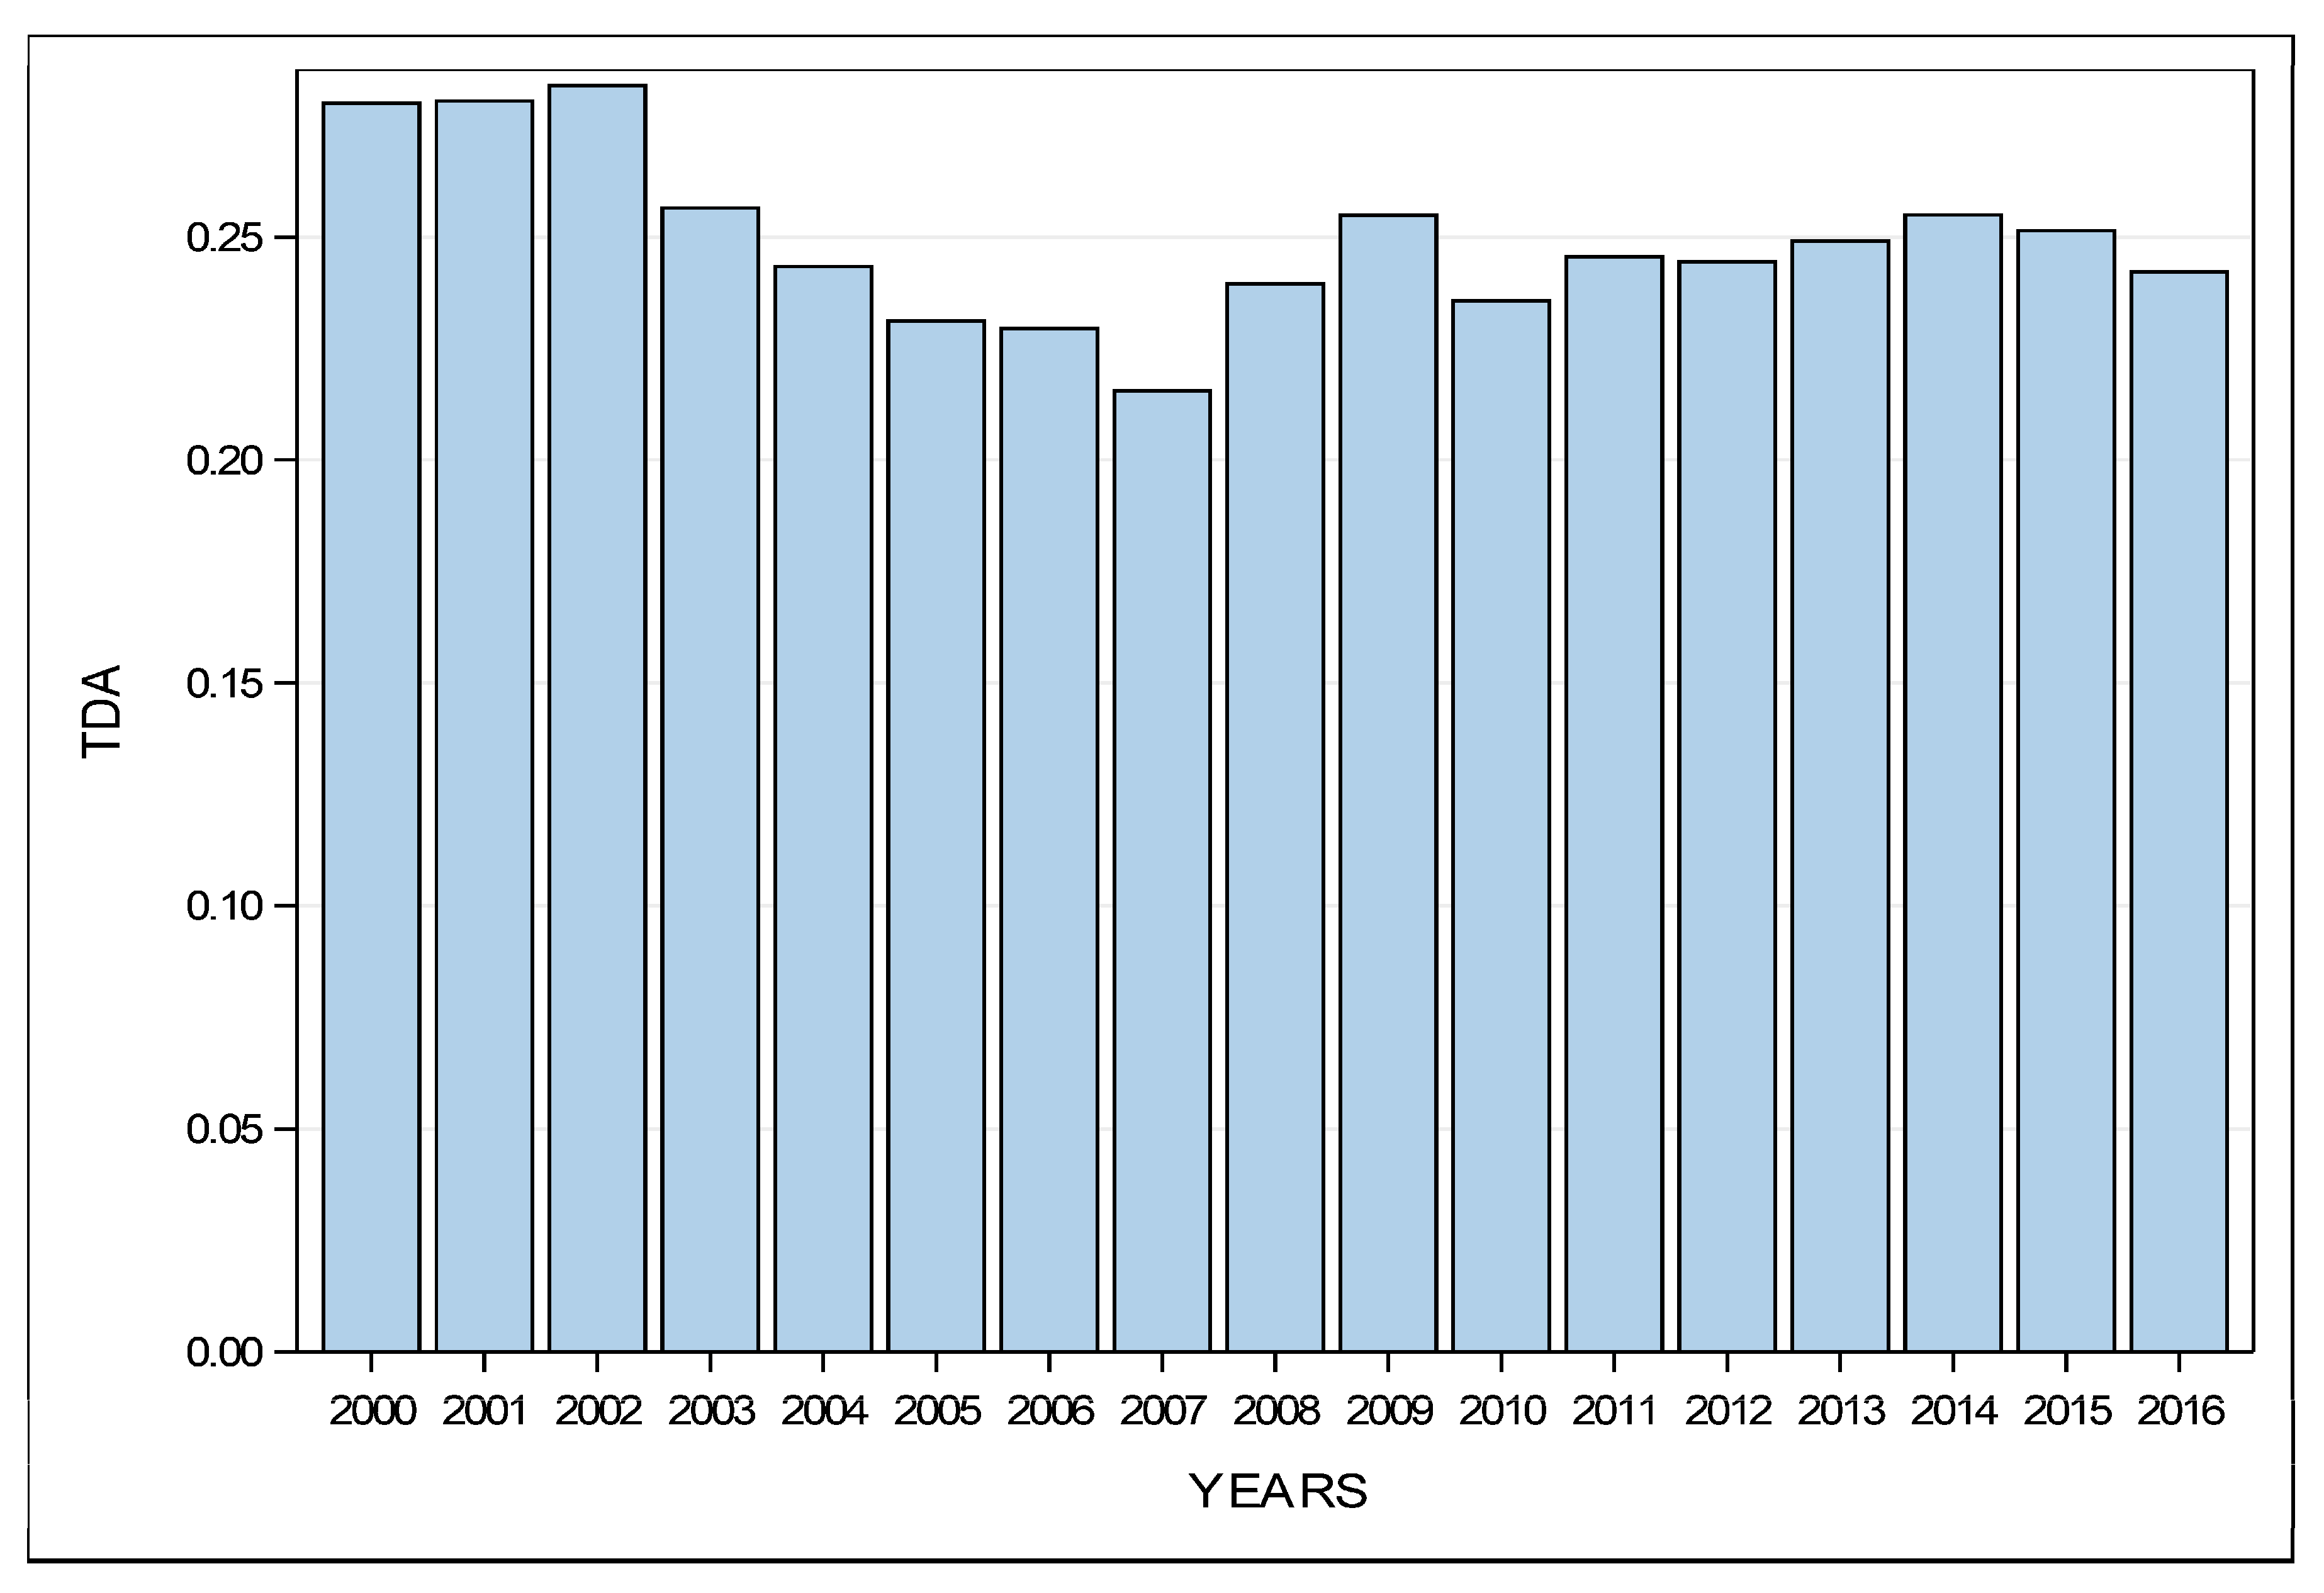
Figure 2 shows the mean leverage ratios of Asian corporations during the sample years. It can be clearly seen that the average leverage ratio (TDA) is comparatively reliable throughout the sample period with slight changes from year to year. From 2000 to 2003 the mean leverage ratio rose throughout the start of the sample years and remained at the 25th percentile (25%) until 2003. One of the reasons for the primary changes is often the decline in the inflation or interest rates throughout those years.
Another argument for marginally expanded statistics in the initial three years of the sample period might be the sample of companies from eight totally different economies. After 2004, there was a little decrease, however, the quantitative proportion stays stable for the succeeding four years (2004–2007). Mean TDA proportion is 21–28%. The most extreme adjustment in the leverage is one percentage point; from year to year that does not propose any primary deviation over the sample years.
Credit ratings and average leverage ratio are shown in Table 3. The firms with top credit rating show lower average debt ratio. Moreover, the amendment in mean leverage ratio relies on the scale of credit rating. As shown in Table 3, average debt ratio is 0.095 at AA+ and at every credit rating level, mean debt ratio changes; however, there are minor changes to the AA+–A+ group, the variation within the average debt ratio rising by 14% points, so more variation is 18% and 20% points to the BBB class and BB+. From BB+ (speculative grade), the average leverage begins to decrease. Therefore, the standard deviation of the speed of borrowing for firms at the primary level is incredibly low, which suggests that these firms not only need to maintain a low level of leverage but also must take care of the level of highest credit rating. As the credit rating decreases, especially for mid-rated companies, the debt ratio increases steadily. At the same time, the standard deviation is also increasing, which suggests that firms have an additional dispersion compared to the high-rated corporations in their capital structure.
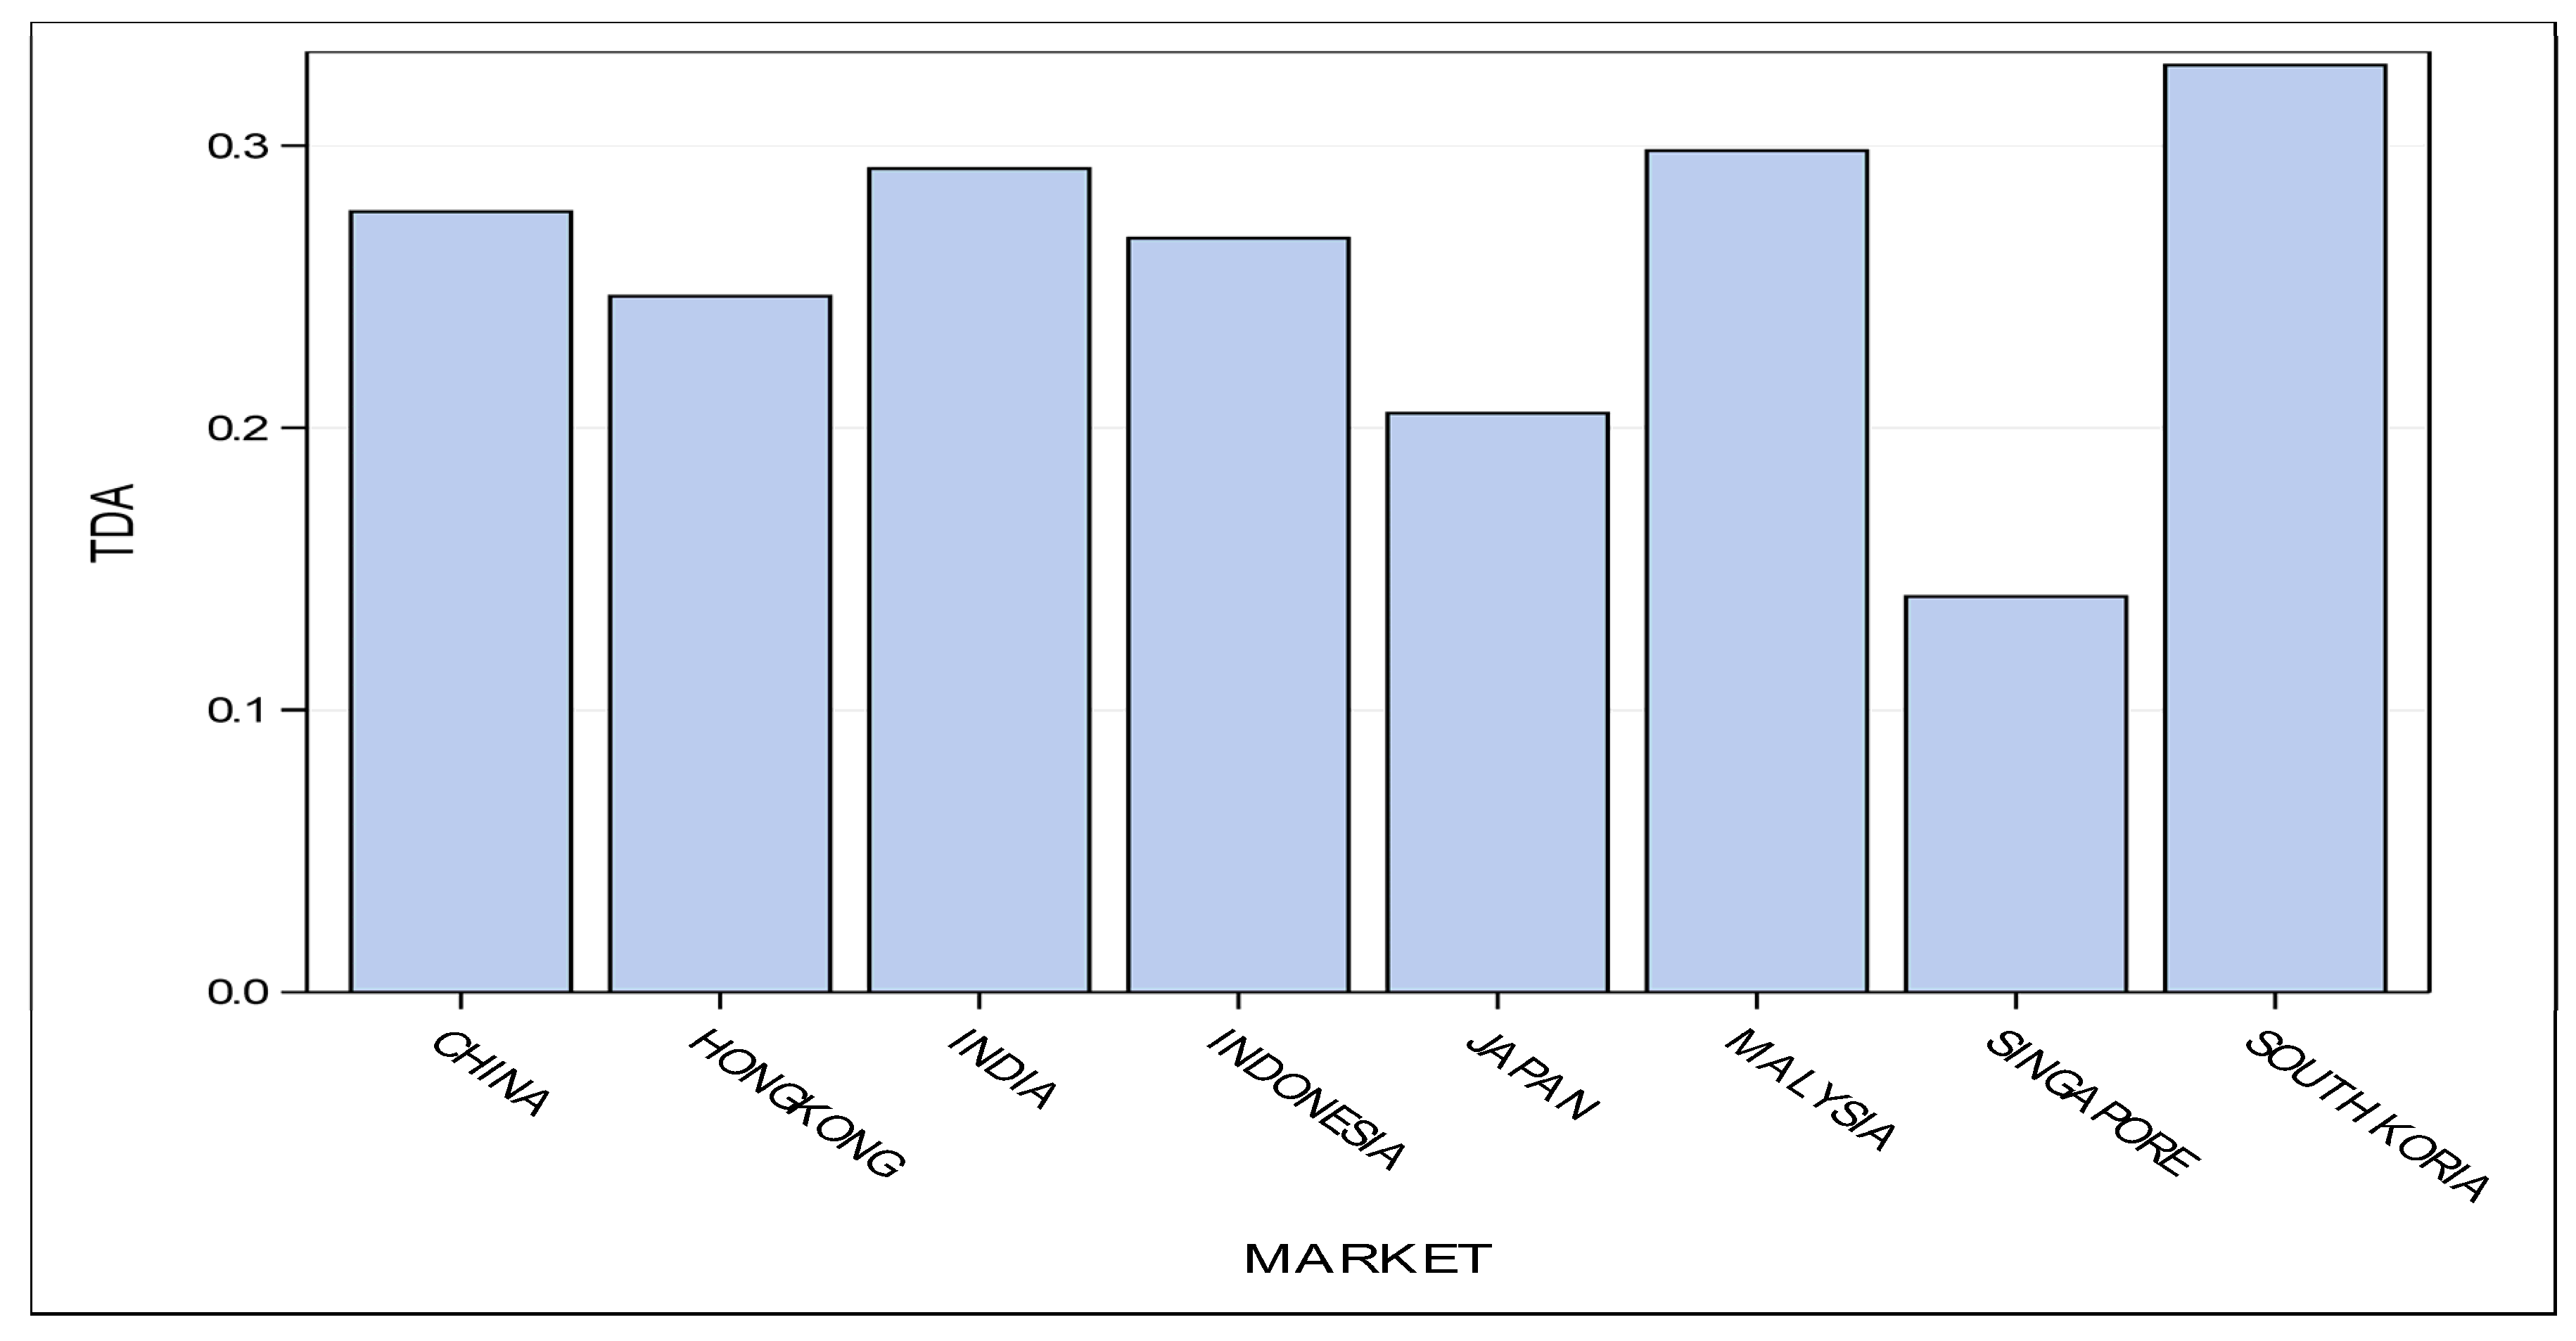
A graphical illustration of leverage ratios with reference to broad and individual credit ratings is presented in Figure 3a,b. Figure 4 is a bar chart that presents the mean leverage ratios of the Asian companies with reference to the Asian market over the sample years.
In Figure 3a,b, there is clearly a non-monotonic, inverted U-shaped pattern of leverage ratio with reference to the credit ratings. It is evident that corporations with low rating scales have a low level of gearing ratio compared with any medium-rated corporation. It indicates that these corporations have restrictive entry into debt markets compared to medium-rated corporations, or such corporations must be compelled to face the high price of debt because of lower credit ratings. Intermediate-rated corporations have a high level of leverage because they enjoyed the low price of debt. High- or top-rated companies have an additional low level of leverage that indicates the preference of the high-rated firm is to take advantage of the high level of credit ratings to grasp additional edges into the money and capital markets. Furthermore, to have a low level of leverage in highest-rated corporations indicates alternative motives for getting highest credit ratings, apart from when entering into debt markets.
Moreover, corporations of Singapore, Japan, and Hong Kong show low leverage ratios as compared to alternative Asian markets in the capital structure of firms. Corporations of South Korea show the highest leverage in their capital structure (see Figure 4).
3.2. Pooled OLS Fixed Effect and GMM
This section presents the pooled OLS, fixed effect, and GMM results. Column 1 in Table 4 is the name of variables. Column 2 presents the results of pooled OLS. Column 3 presents the results of fixed effect model. Column 4 shows the result of GMM model, and column 5 presents the heteroskedasticity white consistent variance for best model fit.
Column 2 shows that R2 is 75%. All variables jointly explain 75% of the variation within the capital structure of rated companies by pooled OLS. The estimate 0.0194 of ICR is positively and significantly related to leverage. However, the estimate −0.0014 of ICR2 is negatively and significantly related to leverage. It indicates a non-linear inverted U-shaped association between the credit ratings and leverage ratio of Asian companies.
After employing the fixed-effect model (FE), R2 increased from 75 to 82%. Findings show that all variables explain 82% variation in capital structure decision. R2 in the fixed effect (FE) model is improved. Each credit rating scale (ICR) shows a positive and significant relationship with a leverage ratio and each rating square (ICR2) shows a negative and significant effect on capital structure. T-values have also increased under the fixed effect model as compared to pooled OLS.
After utilizing heteroskedasticity white consistent variance, R2 increased from 75 to 76% in OLS regression. Credit rating scales show a significant and positive impact on capital structure decision and credit rating square shows a negative and significant relationship with leverage ratio. T-value decreased for ICR and ICR2 after employing HWC variance.
Column 4 in Table 4 presents the results of GMM. The number of the cross-section is 137; time-series length is 17 years. GROPE and DSM are used as instruments. The Sargan test statistic 43.13 (PR = 0.423) shows that the selected instrumental variables are valid and does not show any over-identification problem. Findings from GMM2 show high coefficient values of ICR = 0.08866 and ICR2 = −0.0048 as compared to the results of other estimation techniques. Evidence also shows that each credit rating scale (ICR) has a positive and significant influence on the capital structure and ICR2 also shows negative and significant associations with capital structure.
It is evident from all econometric models that each credit rating scale shows a substantial effect on the capital structure decision of Asian companies. If companies are concerned about each rating scale, their behavior toward capital structure decision will be correlated. All models confirm the non-linear inverted U-shaped pattern between credit ratings and capital structure decision.
The non-linear association between the credit rating and capital structure of firms shows that previous studies by Faulkender and Petersen (2006), and by Bancel and Mittoo (2004) cannot completely explore the advanced association of credit ratings and capital structure of firms. As an example, they empirically proved a negative association of credit ratings with gearing, and they both notice that low-rated companies have high leverage ratios. However, contradictorily with previous studies, the results of the current study recommend that, as with high rated firms, lowest-rated companies even have comparatively low degrees of leverage. Low-rated companies apparently have a greater problem with the expenses implemented by their exacerbated credit ratings. Rating reductions can have comparatively much more serious results on low-rated companies than on top-rated and medium-rated companies. The result shows that low-rated firms favor the low leverage ratio. Another reason may be due to the less developed bond market in Asia.
The institutional and regulative settings of major Asian markets may raise the issues over low ratings e.g., Singapore, Korea, and Malaysia. This kind of finding conflicts with Lemmon et al. (2008) and Al-Najjar and Elgammal (2013), who contend that the rating organizations, regardless of investment grade or in speculative-grade, can have higher access to the debt market and have high amounts of leverage.
High credit rating firms arguably have easier access to the financial market, low cost of capital, favorable conditions in the money market, favorable debt contracts, and access to alternate sources of funding. High-rated firms can even relish the non-financial benefits e.g., reasonable management control in the labor market, worker commitment, and strong client and supplier relationships. Given that highly rated companies, throughout the time of crisis, have gained credibility for being productive and extremely reliable companies, they must maintain their credit rating high as compared to other rated companies.
It ought to be considered that the inclusion of credit ratings in capital structure determinants dissent from ancient trade-off theory. The trade-off theory, which predicts a negative connection between risk and debts, communicated that best credit-rated firms have low probabilities of default, and have high debts. However, the consideration of credit rating costs and benefits are distinct from trade-off theory and proposes that the concern for high-rated benefits will lead toward the low level of leverage in the top-rated companies.
Companies with intermediate credit rating level show sturdy support toward high leverage ratios. This is possible because these firms have higher credit rating levels than low-rated firms; they need less restriction to enter the debt market than low-rated companies. Additionally, middle-rated firms show that they are stable firms with a low probability of default. Overall, the results of this study advocate and confirm the hypothesis that credit ratings have non-monotonic and inverted U-shaped relationship with the capital structures of corporations.
Other proxy measures, including lag of dependent variable, show positive and highly significant association with capital structure decision by all econometric estimations. It is evident that high leverage in previous years can increase leverage in capital structure decisions. Tangibility (TANG) shows negative and significant associations with the leverage ratio. Pooled OLS results show that tangibility is less significant and after employing heteroskedastic consistent variance, tangibility shows an insignificant relationship with leverage. GMM results also show that tangibility is insignificantly related to leverage ratio. Liquidity (LQDT) shows the negative and significant impact on leverage ratio by all econometric estimations. It is evident that high liquidity leads to low level of leverage. Companies prefer low debts when they are highly liquid. Profitability (ROA) shows a negative and significant relationship with leverage ratio in the results of all estimation techniques. It indicates that Asian firms follow a pecking order theory in their capital structure decision. Size (SIZ) shows a significant and positive relationship with leverage ratio in the GMM model and in OLS after utilizing heteroskedastic consistent variance. Pooled OLS and fixed-effect results reveal that size is insignificantly related to leverage ratio. Growth opportunities in the present study show a constant or no relationship with the leverage ratio of Asian companies. This could be due to the different companies from different markets and institutional settings where growth opportunities can fluctuate.
In the present study industrial dummies, including basic material and consumer goods, show a weak significant relationship with leverage in OLS. Meanwhile, utility shows a significant relationship in the fixed effect model and after correcting the heteroskedastic issue in OLS respectively. All other industry dummies show an insignificant relationship with leverage by all econometric estimations.
Gross domestic product (GDP) demonstrates an insignificant association with leverage or capital structure, which can be due to various GDP rates in several countries; organizations in each country behave according to their own environment. The domestic stock market (DSM) demonstrates a negative and significant relationship with leverage in the fixed effect model. Inflation (INF) shows a weak relationship with leverage in the GMM model. Real interest rate (RIR) shows a constant insignificant relationship with leverage in all econometric estimations.
Generally, the results of the present examination give strong support to acknowledge the proposed hypothesis, that the importance of credit ratings costs and benefits create a non-linear inverted U-shaped pattern between credit ratings and capital structures of Asian firms. With respect to the determinants proposed by conventional theories for capital structure, credit ratings appear to have a higher explanatory power for establishing the optimal capital structure of firms. The findings of the control variables reveal that rated organizations can have an alternate capital composition but similar firm factors and country factors.
4. Conclusions
The purpose of the study is to investigate the significance of credit ratings in the capital structure decision of Asian firms. A non-linear inverted U-shaped association of credit ratings with leverage was proposed. Pooled OLS, fixed effect, and GMM econometric techniques are utilized, for robust evidence. For removing heteroskedasticity in OLS, the heteroskedastic white consistent variance is used. Findings of all econometric estimations explicitly reinforce the proposed relationship and reveal that credit rating scales have a non-linear association with the leverage of firms in capital structure choices. Top-rated and low-rated firms obviously own a low degree of leverage and firms with average ratings have high degrees of leverage in their capital structure choices. This is due to the large benefits of maintaining high credit ratings such as more entrance into the commercial paper market, increase creditworthiness into the market, customer and supplier loyalty, etc. A lower-rated firm’s choice for low debt ratio can be due to the high cost of capital, and restricted entry into debt markets. Mid-rated firms have choices to enter into debt market at a low cost of capital because they have fewer chances of bankruptcy and liquidity risk as compared to low-rated firms. Mid-rated firms can also enjoy the benefits of a tax shield due to high leverage in their capital structure. This research also explores that besides credit ratings, liquidity and profitability are important variables in the capital structure decisions of Asian companies.
The paper is unique in terms of definite investigation for the optimal capital structure of firms by testing the influence of individual rating scales on the level of leverage. Therefore, to be more precise, this investigation tests the contemporary utilization of costs and benefits of rating scales in capital structures. This study also suggests that companies should not focus just on ratings and non-ratings aspects, but within rating scales and related costs and benefits, with these rating scales also being crucial for drawing accurate results for establishing optimal capital structures. The prevailing study complements and expands the exploratory research on the relationship of credit ratings and capital structure decision (Kisgen 2006; Faulkender and Petersen 2006). It is asserted by past researchers that credit ratings are helpful for entering into debt market. Consequently, a direct relationship is observed for capital structure and credit rating scales. The study also suggests that credit rating decreases information asymmetries because of the scrutiny by outside rating agencies and the production of detailed firm-level data in their rating reports. Credit ratings can help to identify financial constraints and can be used for investing and financing policies not only at firm level but also at the country level. Further research should be conducted on this topic to explore more ideas. Cross-comparison between European companies and Asian companies can be examined for further insight. Credit ratings issued by different international and local rating agencies can also be used in future research.
Author Contributions
Faiza Sajjad wrote the paper and Muhammad Zakaria supervised and edited the paper.
Conflicts of Interest
The authors declare no conflict of interest.
References
- Al-Najjar, Basil, and Mohammed M. Elgammal. 2013. Innovation and credit ratings, does it matter? UK evidence. Applied Economics Letters 20: 428–31. [Google Scholar] [CrossRef]
- Angilella, Silvia, and Sebastiano Mazzù. 2015. The financing of innovative SMEs: A multicriteria credit rating model. European Journal of Operational Research 244: 540–54. [Google Scholar] [CrossRef]
- Anjum, Sanobar. 2012. Business bankruptcy prediction models: A significant study of the Altman’s Z-score model. Asian Journal of Management Research 3: 212–19. [Google Scholar] [CrossRef]
- Antoniou, Antonios, Yilmaz Guney, and Krishna Paudyal. 2008. The Determinants of Capital Structure: Capital Market-Oriented versus Bank-Oriented Institutions. Journal of Financial and Quantitative Analysis 43: 59–92. [Google Scholar] [CrossRef]
- Arellano, Manuel, and Stephen Bond. 1991. Some Tests of Specification for Panel Carlo Application to Data: Evidence and an Employment Equations. Review Literature and Arts of the Americas 58: 277–97. [Google Scholar] [CrossRef]
- Bancel, Franck, and Usha R. Mittoo. 2004. The Determinants of Capital Structure Choice: A Survey of European Firms. Financial Management 33: 103–32. [Google Scholar] [CrossRef]
- Bolton, Patrick, Xavier Freixas, and Joel Shapiro. 2012. The credit ratings game. Journal of Finance 67: 85–112. [Google Scholar] [CrossRef]
- Boot, Arnoud W. A., Todd T. Milbourn, and Anjolein Schmeits. 2006. Credit ratings as coordination mechanisms. Review of Financial Studies 19: 81–118. [Google Scholar] [CrossRef]
- Cantor, Richard. 2004. An introduction to recent research on credit ratings. Journal of Banking and Finance 28: 2565–73. [Google Scholar] [CrossRef]
- Chen, Hui, Yu Xu, and Jun Yang. 2013. Systematic Risk, Debt Maturity, and the Term Structure of Credit Spreads. Working Paper. Cambridge: National Bureau of Economic Research. [Google Scholar]
- Cheng, Hang. 2014. Determinants of Capital Structure in Asian Firms: New Evidence on the Role of Firm-Level Factors, Industry Characteristics, and Institutions. Unpublished Ph.D. dissertation, University of Leicester, Leicester, UK. [Google Scholar]
- De Haan, Ed. 2017. The financial crisis and corporate credit ratings. Accounting Review 92: 161–89. [Google Scholar]
- Diamond, Douglas W. 1991. Debt Maturity Structure and Liquidity Risk. The Quarterly Journal of Economics 106: 709–37. [Google Scholar] [CrossRef]
- Duff, Angus, and Sandra Einig. 2009. Understanding credit rating quality: Evidence from UK debt market participants. British Accounting Review 41: 107–19. [Google Scholar] [CrossRef]
- Faulkender, Michael, and Mitchell A. Petersen. 2006. Does the source of capital affect capital structure? Review of Financial Studies 19: 45–79. [Google Scholar] [CrossRef]
- Frank, Murray Z., and Vidhan K. Goyal. 2003. Testing the pecking order theory of capital structure. Journal of Financial Economics 67: 217–48. [Google Scholar] [CrossRef]
- Graham, John R., and Campbell R. Harvey. 1999. The Theory and Practice of Corporate Finance: Evidence from the Field on the Survey Questions and Design. Available online: http://ecsocman.hse.ru/data/030/124/1231/Empirich_issled_po_byudzh_i_dr_Graham2000.pdf (accessed on 12 September 2017).
- Gul, Ferdinand A., and John Goodwin. 2010. Short-Term debt maturity structures, credit ratings, and the pricing of audit services. Accounting Review 85: 877–909. [Google Scholar] [CrossRef]
- Kedia, Simi, Shivaram Rajgopal, and Xing Alex Zhou. 2017. Large shareholders and credit ratings. Journal of Financial Economics 124: 632–53. [Google Scholar] [CrossRef]
- Kisgen, Darren J. 2006. Credit ratings and capital structure. The Journal of Finance 61: 1035–72. [Google Scholar] [CrossRef]
- Kisgen, Darren J. 2009. Do Firms Target Credit Ratings or Leverage Levels? Journal of Financial and Quantitative Analysis 44: 1323. [Google Scholar] [CrossRef]
- Kisgen, Darren J., and Philip E. Strahan. 2010. Do regulations based on credit ratings affect a firm’s cost of capital? Review of Financial Studies 23: 4324–47. [Google Scholar] [CrossRef]
- Lemmon, Michael L., Michael R. Roberts, and Jaime F. Zender. 2008. Back to the beginning: Persistence and the cross-section of corporate capital structure. Journal of Finance 63: 1575–608. [Google Scholar] [CrossRef]
- Lu, Yang-Cheng, Yu-Chen Wei, and Tsang-Yao Chang. 2015. The effects and applicability of financial media reports on corporate default ratings. International Review of Economics and Finance 36: 69–87. [Google Scholar] [CrossRef]
- Matthies, Alexander B. 2013. Empirical Research on Corporate Credit-Ratings: A Literature Review. No. 2013-003. SFB 649 Discussion paper. Kiel: Christian Albrechts Universität zu Kiel. [Google Scholar]
- Mittoo, Usha R., and Zhou Zhang. 2008. The capital structure of multinational corporations: Canadian versus U.S. evidence. Journal of Corporate Finance 14: 706–20. [Google Scholar] [CrossRef]
- Naeem, Shammyla. 2012. Financial Structure of UK Firms: The Influence of Credit Rating. Ph.D. dissertation, University of Glasgow, Glasgow, UK; p. 371. [Google Scholar]
- Ntswane, Lesley. 2014. The Impact of Sovereign Credit Ratings on Capital Flows and Financial Markets in Africa. Ph.D. thesis, University of Witswatersrand, Johannesburg, South Africa. [Google Scholar]
- Öztekin, Özde, and Mark J. Flannery. 2012. Institutional determinants of capital structure adjustment speeds. Journal of Financial Economics 103: 88–112. [Google Scholar] [CrossRef]
- Sanesh, C. 2016. The analytical study of Altman Z score on NIFTY 50 Companies. IRA-International Journal of Management & Social Sciences 3: 433–38. [Google Scholar]
- Stepanyan, A. 2014. Altman’s Z-Score in the Airline Business. Case Study of Major U.S. Carriers. Are they Potential Bankruptcy Candidates? International Journal of Advances in Management and Economics 3: 16–24. [Google Scholar]
- Wojewodzki, Michal, Winnie PH Poon, and Jianfu Shen. 2017. The role of credit ratings on capital structure and its speed of adjustment: An international study. European Journal of Finance, 1–31. [Google Scholar] [CrossRef]
Figure 1.
Conceptual Framework.

Figure 2.
Mean leverage ratio of the Asian Firms over the years.

Figure 3.
(a) BCR and Leverage ratio; (b) ICR and Leverage Ratio.

Figure 4.
Asian Markets and Mean Debt Ratios.


Table 1.
Long-term issuer credit ratings and assigned numerical Coding.
| Credit Ratings | Broad Rating Coding | Individual Rating Coding |
|---|---|---|
| AA+ | 1 | 1 |
| AA | 2 | |
| AA− | 3 | |
| A+ | 2 | 4 |
| A | 5 | |
| A− | 6 | |
| BBB+ | 3 | 7 |
| BBB | 8 | |
| BBB− | 9 | |
| BB+ | 4 | 10 |
| BB | 11 | |
| BB− | 12 | |
| B+ | 5 | 13 |
| B | 14 | |
| B− | 15 | |
| CCC+ | 6 | 16 |
Table 2.
Descriptive Statistics.
| Variable | N | Mean | Std Dev | Minimum | Maximum |
|---|---|---|---|---|---|
| TDA | 2327 | 0.253 | 0.177 | 0.0001 | 1.40080 |
| ICR | 2328 | 6.868 | 3.061 | 1.00000 | 15.00000 |
| ICR2 | 2328 | 56.53 | 49.70 | 1.00000 | 225.00000 |
| TANG | 2328 | 2.702 | 25.46 | −0.02472 | 653.42812 |
| LQDT | 2328 | 1.784 | 1.85 | 0 | 32.35000 |
| ROA | 2328 | 3.247 | 10.39 | −239.57 | 52.25000 |
| SIZ | 2327 | 8.316 | 10.81 | 1.05385 | 428.35619 |
| GROPE | 2325 | 383.5 | 18416 | −1.24934 | 888005 |
| GDPG | 2328 | 4.409 | 3.59 | −5.41712 | 17.29328 |
| INF | 2328 | 1.891 | 3.60 | −6.00773 | 20.44746 |
| DSM | 2328 | 255.72 | 372.72 | 14.33362 | 2595 |
| RIR | 2328 | 3.874 | 2.950 | −3.85225 | 13.34719 |
Table 3.
Sample Statistic summary- CR and Leverage.
| CR | N | Mean | Std Dev | Minimum | Maximum |
|---|---|---|---|---|---|
| AA+ | 67 | 0.0950474 | 0.1274033 | 0.000200 | 0.4140000 |
| AA | 70 | 0.1900178 | 0.1393195 | 0.003300 | 0.5150896 |
| AA− | 106 | 0.1575311 | 0.1364458 | 0.000300 | 0.5147793 |
| A+ | 319 | 0.1465916 | 0.1417299 | 0.000400 | 0.6706000 |
| A | 107 | 0.2074267 | 0.1266498 | 0.001200 | 0.6870000 |
| A− | 356 | 0.1867007 | 0.1025817 | 0.000100 | 0.5087000 |
| BBB+ | 515 | 0.3358922 | 0.1288406 | 0.004900 | 0.7409000 |
| BBB | 264 | 0.3793549 | 0.1851309 | 0.000300 | 1.3196000 |
| BBB− | 150 | 0.4624828 | 0.1663307 | 0.100300 | 0.7879000 |
| BB+ | 103 | 0.2621219 | 0.2070806 | 0.001200 | 1.4008000 |
| BB | 57 | 0.2451877 | 0.1432303 | 0.008300 | 0.5209000 |
| BB− | 72 | 0.2576368 | 0.1735113 | 0.000100 | 1.0451000 |
| B+ | 37 | 0.1760136 | 0.1693281 | 0.000000 | 0.7013000 |
| B | 23 | 0.2191968 | 0.0868462 | 0.1184810 | 0.4086000 |
| B− | 81 | 0.0590640 | 0.0995373 | 0.0000240 | 0.5048000 |
Table 4.
Leverage and Credit Rating Scales.
| Variable | Pooled OLS | Fixed Effect | GMM | Hetero White Consistent Variance |
|---|---|---|---|---|
| Intercept | −0.2512 | −0.05469 | −0.22932 | −0.02702 |
| (−2.84) ** | (−0.48) | (−1.98) | (−2.47) | |
| LAG_TDA | 0.784 | 0.475554 | 0.31982 | 0.785 |
| (65.58) *** | (30.01) *** | (12.90) *** | (36.82) *** | |
| ICR | 0.0194 | 0.041967 | 0.08866 | 0.0196 |
| (8.01) *** | (12.33) *** | (6.01) *** | (7.37) *** | |
| ICR2 | −0.00114 | −0.0021 | −0.00481 | −0.00113 |
| (−7.80) *** | (−10.30) *** | (−5.68) *** | (−6.77) *** | |
| TANG | −0.00034 | −0.00058 | 0.000016 | −0.0001 |
| (−3.02) ** | (−4.15) *** | (0.03) | (−0.63) | |
| LQDT | −0.00741 | −0.00667 | −0.00397 | −0.00684 |
| (−6.91) *** | (−5.65) *** | (−8.12) *** | (−4.65) *** | |
| ROA | −0.00144 | −0.00192 | −0.00177 | −0.00147 |
| (−5.05) *** | (−7.14) *** | (−4.36) *** | (−4.28) *** | |
| SIZ | 0.000161 | 0.000135 | 0.000329 | 0.000365 |
| (0.92) | (0.80) | (5.15) *** | (4.29) *** | |
| GROPE | 0 | 0 | 0 | 0 |
| BMD | 0.2566 | 0 | 0.100656 | 0.02650 |
| (2.91) ** | (0.96) | (2.93) ** | ||
| CGD | 0.2532 | 0 | 0.197158 | 0.02565 |
| (2.87) ** | (1.48) | (2.70) * | ||
| CSD | 0.24694 | 0 | 0.028218 | 0.01835 |
| (2.79) ** | (0.17) | (1.59) | ||
| INDSD | 0.2535 | 0.1834 | 0.057949 | 0.02611 |
| (2.88) ** | (2.31) | (0.58) | (3.11) ** | |
| TECD | 0.24033 | 0.04465 | −0.03874 | 0.01031 |
| (2.72) * | (0.40) | (−0.30) | (1.10) | |
| TELD | 0.25461 | 0 | 0.2303 | 0.02650 |
| (2.88) ** | (2.77) ** | (2.83) ** | ||
| UTILD | 0.26982 | 0.30831 | 0.13735 | 0.03754 |
| (3.05) ** | (2.73) ** | (0.75) | (3.40) ** | |
| OGD | 0.2666 | 0 | 0 | 0.03155 |
| (3.01) ** | (2.14) * | |||
| HCD | 0.23119 | 0 | −0.37186 | −0.00117 |
| (2.54) * | (−0.24) | (−0.08) | ||
| GDPG | −0.00058 | 0.00044 | −0.00037 | −0.000512 |
| (−0.99) | (0.44) | (−0.78) | (−0.75) | |
| DSM | 0 | 0 | −0.00004 | −0.0000 |
| (−1.49) | (−0.05) | (−5.40) *** | (−1.43) | |
| INF | 0.001802 | 0.002293 | 0.00316 | 0.00166 |
| (2.53) * | (1.55) | (2.44) * | (1.24) | |
| RIR | 0.000371 | −0.00003 | 0.000025 | 0.00033302 |
| (0.46) | (−0.02) | (0.02) | (0.32) | |
| R2 | 0.75 | 0.82 | 0.76 | |
| Sargan test | 43.13 | |||
| (0.423) | ||||
| AR (m1) | (0.0001) | |||
| (m2) | (0.0069) |
Note: Values in parenthesis are t-values. ***, ** and * indicates that value is statistically significant at 1%, 5% and 10% level of significance, respectively.
© 2018 by the authors. Licensee MDPI, Basel, Switzerland. This article is an open access article distributed under the terms and conditions of the Creative Commons Attribution (CC BY) license (http://creativecommons.org/licenses/by/4.0/).
Share and Cite
MDPI and ACS Style
Sajjad, F.; Zakaria, M. Credit Rating as a Mechanism for Capital Structure Optimization: Empirical Evidence from Panel Data Analysis. Int. J. Financial Stud. 2018, 6, 13. https://doi.org/10.3390/ijfs6010013
AMA Style
Sajjad F, Zakaria M. Credit Rating as a Mechanism for Capital Structure Optimization: Empirical Evidence from Panel Data Analysis. International Journal of Financial Studies. 2018; 6(1):13. https://doi.org/10.3390/ijfs6010013
Chicago/Turabian StyleSajjad, Faiza, and Muhammad Zakaria. 2018. "Credit Rating as a Mechanism for Capital Structure Optimization: Empirical Evidence from Panel Data Analysis" International Journal of Financial Studies 6, no. 1: 13. https://doi.org/10.3390/ijfs6010013
Note that from the first issue of 2016, this journal uses article numbers instead of page numbers. See further details here.