Dynamic Relationships between Price and Net Asset Value for Asian Real Estate Stocks

Department of Real Estate, National University of Singapore, Singapore 117566, Singapore
*
Author to whom correspondence should be addressed.
Int. J. Financial Stud. 2018, 6(1), 28; https://doi.org/10.3390/ijfs6010028
Submission received: 13 November 2017
/
Revised: 6 January 2018
/
Accepted: 9 February 2018
/
Published: 6 March 2018
(This article belongs to the Special Issue Financial Economics)
Abstract
:This paper examines short- and long-term behavior of the price-to net asset value ratio in six Asian public real estate markets. We find mean-reverting behavior of the ratio and spillover effects, where each of the examined public real estate markets correlates with other markets. Additionally, the unexpected shock correlating with the price-to-net asset value ratio in one market has a positive or negative correlation with the ratios of other markets. Our results offer fresh insights to portfolio managers, policymakers, and academic researchers into the regional and country market dynamics of public real estate valuation and cross-country interaction from the long-term and short-term perspectives.
1. Introduction
Asia is an up-and-coming regional hub for real estate investment activities for both direct real estate investments and real estate debt and equity securities. With the growing demand for investment opportunities in real estate assets due to land scarcity and rapid urbanization, recent studies on Asian markets have been targeted at studying real estate financial instruments such as listed real estate investment trusts (REIT) and real estate stocks. Real estate stocks are likely to have higher volatility than stock markets as they combine the investment characteristics of stock and private real estate (Lizieri and Satchell 1997; Conner and Falzon 2004; Liow and Sim 2006)1. Consequently, it is important to better understand the long- and short-term trends in public real estate market volatilities and valuation, as well as in the country and regional context. Such an understanding will aid portfolio decisions and enrich the literature on performance evaluation and corporate finance for real estate (Conner and Falzon 2004). This valuation issue arises because stock prices (Ps) and net-asset values (NAVs)2 appear to be linked in the long run in many Asian economies. However, the performance of listed real estate is also affected by stock market volatilities in the short run.
In adding to the existing knowledge on this topic, in this study we analyze two key aspects of real estate stock valuation and pricing for a sample of six Asian markets (Japan, Hong Kong, Singapore, Malaysia, Thailand, and Philippines) over the last few decades. We first assess the average equilibrium long-term relationship and short-term behavior of real estate stock valuation across the individual markets and a regional Asian market. Our second issue focuses on the correlation structure of P/NAV ratios for their “spillover” and “impulse response” characteristics.
This research adds value to the existing literature in three ways. First, our approach aims at better understanding the long- and short-term dynamics of the P/NAV ratios and their country and regional commonality, using panel co-integration methodology. Second, the multivariate vector auto-regression (VAR) and P/NAV spillover index approach (Diebold and Yilmaz 2012) captures the correlation and co-movement of the P/NAV ratios in each economy. Finally, the generalized impulse response functions indicate how each Asian market responds to the market valuation shocks by other Asian markets in the VAR system. To our knowledge, although previous real estate research has focused on performance analysis and the inter-relationships between private and public real estate markets, relatively little research was conducted on this real estate stock valuation and spillover topic in the regional context, similar to the scope and issues included in this article.
The remainder of the paper is structured as follow. Section 2 provides a brief literature update. Section 3 explains the literature gap and research contribution. In Section 4, the data sample and characteristics are presented. This is followed by Section 5, which briefly explains the research methodologies. A presentation of results and discussion of implications follow, and the final section concludes the study.
2. Brief Literature
This paper is related to several streams of applied real estate corporate finance literature. First, we extend the large literature on corporate valuation and fundamental values. Under the efficient markets hypothesis, current stock price is equal to the value of the future stream of dividends, discounted geometrically back to the present by a constant real interest rate (MacDonald and Power 1995). The corporate fundamental measures include dividends per share (DPS) (Fama and French 1988); dividend growth and long-term earnings per share (EPS) (Campbell and Shiller 1988); and the values of its individual assets and liabilities (NAVs) (Adams and Venmore-Rowland 1989).
Since the valuation of listed real estate stocks is derived from stock market, whereas the underlying properties are appraised in real estate market, public real estate valuation is more related to NAVs (Adams and Venmore-Rowland 1989). The main justification for a NAV basis of valuation, rather than on earnings or dividend basis, rests on the growth potential of the real estate assets held whose values are anticipated to grow over time (Barkham and Ward 1999). In the long run, the performance of listed real estate should be linked to the performance of real estate assets (Lizieri 2013). Mathematically, the relationship between NAV and P is commonly expressed as:3
In Equation (1), if is statistically insignificantly from zero, a long-term relationship expressed by exists. Accordingly, by examining the long-term relation between P and NAV, we are testing if a long-term NAV discount (NAVDISC) (defined as: ) persists in a public real estate market and estimating how fast the dynamic adjustments take place in the short term. The underlying economic motivation is that, in the long run, the relationship between real estate stock performance (P) and the underlying property market (NAV) is much stronger. However, this relationship is “noisy” and there may be persistent deviations (Barkham and Ward 1999; Liow and Li 2006). Overall, these studies find that NAV is an important factor in public real estate valuation, and that share prices deviate from NAV.4
Second, the long-term association between public and private real estate markets lies mainly within the framework of real estate and stock integration and segmentation (Lin and Fuerst 2014). Most of the literature supports the hypothesis that segmentation between stock and direct real estate markets does exist (Quan and Titman 1999; Ling and Naranjo 1999). In contrast, there appears to be a close link between stocks and listed real estate markets (Liow and Yang 2005; Ambrose et al. 2007). Listed real estate is regarded as a hybrid of stock and real estate, since at a fundamental level, stock prices should reflect their underlying real estate asset values in the long run (Lizieri and Satchell 1997; Lin 2013). If that is the case, the public and direct real estate market could have a higher degree of market integration. In this context, real estate stocks are likely to provide a return that should not differ significantly from the return on the underlying real estate assets over a relative long period. However, this is largely an unresolved empirical question since there is a lack of proper economic/finance theory underpinning the controversial question “are real estate stocks properties or stocks?” (Hoesli and Oikarinen 2012).
This research is also an addition to the existing literature on correlation and co-movement of return and volatilities across international public real estate markets However, in contrast to previous studies, our approach targets at understanding better the long-term and short-term dynamics of real estate companies’ valuation multiples (P/NAVs) and their spillover characteristics. The usefulness of the panel co-integration methodology to analyze how the NAV information in each real estate stock market predicts their price fluctuations, or vice-versa, has been proven (Liow and Li 2006). Moreover, in contrast to the bivariate correlation coefficients, the P/NAV spillover index developed in this study captures the correlation and co-movement of the real estate stock valuation premium (or discount) across all Asian countries examined compared to an analysis based on bivariate correlation coefficients. Therefore, the spillover index results can shed light on which investors can benefit from Asian real estate securities diversification by incorporating into their portfolio selections the P/NAV correlation and cross-market interaction. Finally, our generalized impulse response functions examine how each Asian real estate stock market responds to the market valuation shocks by other Asian real estate stock markets. To our knowledge, this line of enquiry is a new feature in real estate corporate research, which has increasingly attracted the attention of global investors and policymaker in today’s globalized environment.
3. Literature Gap and Research Contribution
As can be seen from the above review, there is undoubtedly an interest in the literature that recognizes the link between stock prices and NAV for real estate stocks. However, the valuation interdependence between listed real estate stock prices and NAVs has not been fully explored by employing the powerful panel co-integration methodology, with the notable exception of Liow and Li (2006). This gap will be filled by this paper, in which we also provide panel causality evidence between prices and NAVs.
Although we employ panel co-integration, our paper differs from Liow and Li (2006) in two important respects. First, while the study period of Liow and Li (2006) is from 1995Q1 to 2003Q4, we update their study using a broadly similar dataset that spans from 2004Q1 to 2014Q4. This study period is very meaningful as it allows us to study whether the 2007–2009 global financial and economic crisis has significantly changed the equilibrium valuation relationship between stock prices and NAVs, mainly because of the extreme volatility of the prices of many Asian real estate stocks. Secondly, while Liow and Li (2006) focus on the long-term and short-term behavior of NAV discount/premium in real estate stock valuation, we also examine, for the first time, the characteristics of P/NAV spillovers and impulse response in a regional environment.
Overall, although this real estate stock valuation topic is not original, the current paper makes a distinctive contribution to the spillover literature by investigating regional P/NAV ratio spillovers and cross-market valuation interdependence/interaction in Asian countries, using panel co-integration methodology, a spillover index approach, and generalized impulse response function analysis. The results have important institutional and economic implications that can be adopted and monitored by portfolio managers and policymakers.
4. Sample and Data
Our public real estate companies are sampled from six Asian markets. They are: Japan (JP), Hong Kong (HK), Singapore (SG), Malaysia (MA), Philippines (PH), and Thailand (TH). Generally, real estate is an important asset in these economies and plays a crucial role in individuals’ investment portfolios. These Asian markets are dominated by property developers and construction activities whose corporate cash flows are more volatile in contrast to REITs and other property investment companies, where rental investments dominate. Among them, JP, HK, and SG have a track record of listed real estate companies that play a relatively important role in their respective stock markets. On the other hand, MA, PH, and TH are regarded as emerging economies and need longer to develop their real estate market regulatory framework and market structure.
As of December 2014, there are a total of 301 listed real estate companies from the six countries from Datastream. Further screenings indicate that only 293 property stocks had the full period Augmented Dickey–Fuller (ADF) of I (1) characteristics in their NAV and P series. Finally, the numbers of real estate stocks (without missing NAV and P data) derived are: 21 (TH), 23 (PH), 38 (MA), 12 (SG), 37 (HK), and 27 (JP).5 The period of study is from 2004 Q1 to 2014 Q4.6
Table 1 reports the average quarterly P/NAV and NAVDISC performances for the six selected Asian markets, with Figure 1 displaying the time series changes of the two variables over the same period. NAVDISC is defined as NAV per share less share price, expressed as a percentage of NAV per share. Thus, NAVDISC can be positive (discount) or negative (premium). As reported, while real estate stocks in JP, PH, TH, and HK trade at an average NAV premium (i.e., P/NAV > 1) of between 1.26% (HK) and 89.8% (JP), property stocks in SG and MA report a quarterly P/NAV ratio of 0.874 and 0.600, respectively, over the full period. Except for JP, whose real estate stocks trade consistently at an average “premium” to their underlying NAVs over the last 11 years, property stocks in the other five markets are struck by a NAV discount each in eight (TH), 19 (PH), 23 (HK), 35 (SG), and 42 quarters (MA), respectively. Of the 158 real estate firms, about 66.4% (105 firms) are associated with an average NAV discount (i.e., P/NAV < 1) over the study period. These 105 firms are distributed among HK (23), JP (9), SG (9), MA (35), PH (17), and TH (12).
Overall, the above results agree with the closed-end fund literature that prices fluctuate from NAVs. While the average real estate stocks’ NAV premiums or discounts detected may indicate a form of investor sentiment (which is a function of the market condition) regarding the “growth” potential of Asian public real estate markets (Barkham and Ward 1999), there are many potential reasons why their P/NAV performances deviate from one another. The generalized P/NAV spillover results (to be reported later) will provide fresh insights into the extent of common and idiosyncratic factors that caused the fluctuating P/NAV relationships across the Asian markets.
5. Research Methodology
Four econometric approaches are employed: panel co-integration, factor analysis, generalized spillover index, and generalized impulse response functions. They are briefly explained below.
5.1. Panel Co-Integration Approach
First, the concept of co-integration is appropriate to search for a long-term contemporaneous relation between Ps and NAVs. Moreover, the presence of co-integration leads to the development of an error-correction model (ECM) that describes the systematic disequilibrium adjustment process in the short term.7
Since we have only 44 quarterly time-series observations for each P and NAV series, the traditional Johansen co-integration methodology (Johansen 1991) is not feasible. Instead, we appeal to the innovative work of Pedroni (1995, 1999) on heterogeneous panel co-integration, where each real estate stock is regarded as a member in a N*T panel, where T is the total number of periods (44 quarters) and N is the total number of real estate stocks examined. In this way, the Pedroni’s panel co-integration approach allows information embedded in the individual error terms from all panel members to be combined and tested, as compared to the traditional co-integration methods, where error terms for each series are tested one at a time.8
The panel co-integration tests will be run for all real estate stocks in each market separately (i.e., six panels), as well as for all firms in one (Asian) panel, involving four empirical steps:
- (a)
- Panel unit root tests of Levin et al. (2002) (LLC) and Im et al. (1997) (IPS) to test the null hypothesis of a panel (1).
- (b)
- (c)
- Dynamic OLS panel regression for long-term coefficients and dynamic ECM panel data models for short-term dynamics.
- (d)
- Panel causality tests to examine the causal effects between P and NAV.
5.2. Factor Analysis
For each market, this popular method is conducted on the disaggregated quarterly P/NAV ratios of all real estate firms in each country to identify the number of factors, their factor loadings and factor scores. By using Principal Component analysis and varimax orthogonal rotation method, the covariance structure of the P/NAV ratios is characterized and allowed the relative importance of the local factors in each company and country to be identified. As usual, those common factors with eigenvalues greater than or equal to one are retained (Kaiser 1960). These eigenvalues measure the contribution of the corresponding local factors to explain the cross-sectional variation of all real estate firms’ P/NAV ratios in each country. The first factor for the six markets will be examined for a regional correlation structure. Finally, a weighted-variance P/NAV factor is estimated for each country. The weighted factors are used to implement generalized spillover index and generalized impulse response analyses on the real estate stock dataset.
5.3. Generalized Spillover Index Approach
The generalized VAR model and spillover index approach, developed by Diebold and Yilmaz (2012) in mainstream finance, examines the decomposition of forecast error variance through analyzing the total and directional P/NAV country factor spillovers across the six Asian real estate markets examined, while at the same time the results are invariant to the variable ordering. In our case, the P/NAV factor spillover index results indicate the degree of cross-market valuation interaction (as captured by the share of cross-market error variance in the variance decomposition) relative to the total error variance of the markets examined. One major advantage of this approach is that since the spillover index is based on a multivariate VAR, it can better capture the correlation and co-movement of the real estate companies’ P/NAV factors across all markets, compared to any analysis based on bivariate correlation coefficients. Due to limited number of data observation (44 quarters), the spillover analysis in this study will only cover two aspects: (a) an aggregate spillover index that measures what proportion of the P/NAV factor’s forecast error variances come from spillover; and (b) average net directional spillover indices to identify which real estate markets are dominant market transmitters of P/NAV common factor.
5.4. Generalized Impulse Response Functions
Dynamic analysis of VAR models can also be conducted using impulse response functions. Using a weighted-variance P/NAV factor estimated for each country, we appeal to the generalized impulse response function (GIRF) developed by Pesaran and Shin (1998) to graphically examine the expected response of each P/NAV factor to shocks in the specific P/NAV factor and shocks of other five countries’ P/NAV factors in the system. Similar with the generalized spillover analysis, the GIRFs are invariant to the orders of the P/NAV factors in the VAR system. By providing the time path of the impact of a shock on the future values of all P/NAV factors in the multivariate dynamic system, the GIRF can give better insights into short-term and long-term linkages among the P/NAV factors. Since the resulting impulse responses are invariant to the ordering of the variables in the VAR, this approach gives fresh and robust results. For example, Lee et al. (2013) use the GIRF to examine the extent and magnitude of dynamic relationships among stock, insurance, and bond markets when unexpected shocks occur in their six developed countries.
6. Results and Discussion
6.1. Panel Co-Integration for Individual Real Estate Stock Markets (Six “Panels”)
With the panel unit root tests of LLC and IPS (Table 2) indicate all P and NAV series are integrated of order one, the panel co-integration test results (Table 3) indicate that all seven test statistics are highly significant for JP and TH, with weaker results for SG and HK. For MA and PH, none of the three Group test statistics rejects the null of no panel co-integration. Except for SG’s panel PP rho statistic, all four panel test statistics (including the variance ratio) are statistically significant at least at the 5% level for five country panels. Consequently, for each market, there appear to be long-term P/NAV ratios of different magnitudes. By implication, this P/NAV ratio exhibits mean reversion that can be described by the systematic disequilibrium adjustment process in the short term.
In Table 4, all coefficients for both the pooled and grouped panel DOLS are positive and statistically significant at 1% level for all six markets, implying a strong long-term equilibrium between P and NAV. The long-term, pooled panel DOLS estimates are between 0.479 (PH) and 0.961 (HK). Similarly, the grouped panel OLS long-term estimates are from 0.519 (HK) to 2.188 (MAL). Moreover, all six error-correction terms are statistically negative at the 1% level, ranging between −0.093 (JP) and −0.213 (SIN), which implies that between 9% and 21% of the previous discrepancy between the actual and desired (long-term) P/NAV is corrected in each quarter in the respective real estate stock markets. Except for PH, change in NAV is a significant factor positively influencing real estate stock prices.9
Overall, although there are some disparities in the magnitude of the long-and short-term coefficients across different markets, we may conclude that the hypothesis of no panel co-integration between Ps and NAVs is adequately rejected. By implication, there is a long-term “P/NAV” (or NAVDISC) of different magnitudes in each market and the speeds of returning to equilibrium are heterogeneous. Accordingly, the linearity relationship between P and NAV (Equation (1)) holds under the GFC influence, i.e., the GFC does not have any material effect on the detected linear mean reversion behavior of Asian public real estate.
Finally, the pairwise Granger Causality tests (Table 5) reveal a significant (at the 1% level) bi-directional causation relationship between P and NAV.10 Additionally, there is evidence of bilateral homogenous causality or unilateral homogenous causality detected when using the Dumitrescu and Hurlin (2012) individual coefficient tests. Thus, we may conclude that both P and NAV have predictive lead–lag effects on each other in the short term, with NAV being a stronger predictive candidate in real estate stock valuation.
6.2. Regional Panel Co-Integration (Asian Panel)
In this section, we repeat the various tests on an aggregate Asian panel that includes 158 real estate stocks from all six countries (part (b) of Table 2, Table 3, Table 4 and Table 5). With the I (1) aggregate panel confirmed by the LLC and IPS unit root tests, the Pedroni (1995) panel co-integration test reveals that, except for the insignificant Group PP rho statistic, all other test statistics are at least statistically significant at the 5% level. This implies that, overall, Asian real estate companies’ Ps and NAVs are co-integrated. Then, a statistically significant long-term coefficient of P/NAV, which ranges between 0.849 (pooled panel DOLS) and 1.214 (grouped panel DOLS), is estimated. The resulting ECM term is between −0.001 and −0.119, which implies a slower process of returning to equilibrium at the aggregate panel level than at the individual panel levels. Finally, short-term Ps and NAVs have bilateral causality, as indicated by both versions of causality test results.
6.3. Correlation Structure of P/NAV Ratios
As the numbers in Table 6 indicate, the first eight (HK), six (JP), two (SG), six (MA), five (PH), and four (TH) local factors have eigenvalues greater than one and together explain approximately 83.75%, 86.19%, 79.07%, 83.12%, 76.94%, and 76% of the variations in P/NAV ratios of real estate stocks of the respective countries. Moreover, the first P/NAV local factor for the respective markets explains between 23.38% (TH) and 68.76% (SG) of the total sample variance. The coefficients of the first factor in all markets are large and positive, indicating an important general factor among the real estate stocks as well as having an impact on all real estate stocks’ P/NAVs.
When the first P/NAV local factors of each market are correlated (Table 7), evidence of P/NAV local factor integration is detected between some pairs of Asian markets. Specifically, HK is positively correlated with JP and SG, PH is positively linked to TH, MA is positively correlated with TH and PH, and PH is negatively correlated with HK and JP. To the extent that these results are generalizable, they imply that the Asian markets examined share common risk characteristics in the P/NAV local factor, mainly within the developed and developing market groups. In contrast, some developed and developing markets’ P/NAV factors are negatively correlated. Overall, the results provide some preliminary, but indicative, evidence of significant P/NAV dependence relationships in Asian public real estate markets.
6.4. Generalized P/NAV Factor Spillovers among Markets
Table 8 presents the P/NAV local factor spillover table based on the generalized spillover index approach of Diebold and Yilmaz (2012),11 with an eight-quarter-ahead forecast error decomposition over the full study period.
The aggregate P/NAV factor spillover index, given at the lower right corner of the table, is approximately 58.5%, meaning that, on average, across the six Asian markets examined, almost 59% of the P/NAV factor forecast error variance comes from spillover, due to transmission of prevailing market sentiment leading to divergence from market fundamentals for the selected public real estate markets. In contrast, a lower proportion of the P/NAV factor variation is caused by purely domestic factors, i.e., idiosyncratic dynamics of the domestic P/NAV factor in the past. Overall, we may thus conclude there is a moderate level of cross market P/NAV factor interactions among the markets over the study period, with each of the six Asian markets influencing and being influenced by other markets.
Second, own market’s P/NAV factor spillovers explain the highest share of forecast error variance since the diagonal elements receive higher values compared to the off-diagonal elements. Innovations to the P/NAV factor in JP explain 53.9% of its forecast error variance, while only between 1.5% and 30.5% comes from the other five markets. HK is the most endogenous market, registering the lowest own-market P/NAV factor spillovers of about 31% over the full study period.
Third, according to the “TO others” or “transmission” criteria, the gross directional P/NAV factor spillover indices from a market to others are the highest for PH (86), JP (69), and SG (66). The “FROM others” or “absorption” criterion ranks HK (69), MA (67), and TH (60) as the top three endogenous markets. Additionally, the share in spillover average, which is the average total of spillover transmission and spillover absorption, ranks PH (19.66%), HK (18.66%), and SG (17.66%) the top three markets that contributed to over 55% of the P/NAV factor spillovers across the six Asian markets examined.
Finally, based on the individual markets’ net directional P/NAV factor spillover indices, which measure the net spillovers from a market to all other markets, PH (34) emerges as the dominant transmitter of P/NAV factor spillovers, followed by JP (23) and SG (8); TH (−33), MA (−26), and HK (−7) are the top three net receivers of P/NAV factor spillovers.
6.5. Generalized Impulse Response Functions (GIRFs)
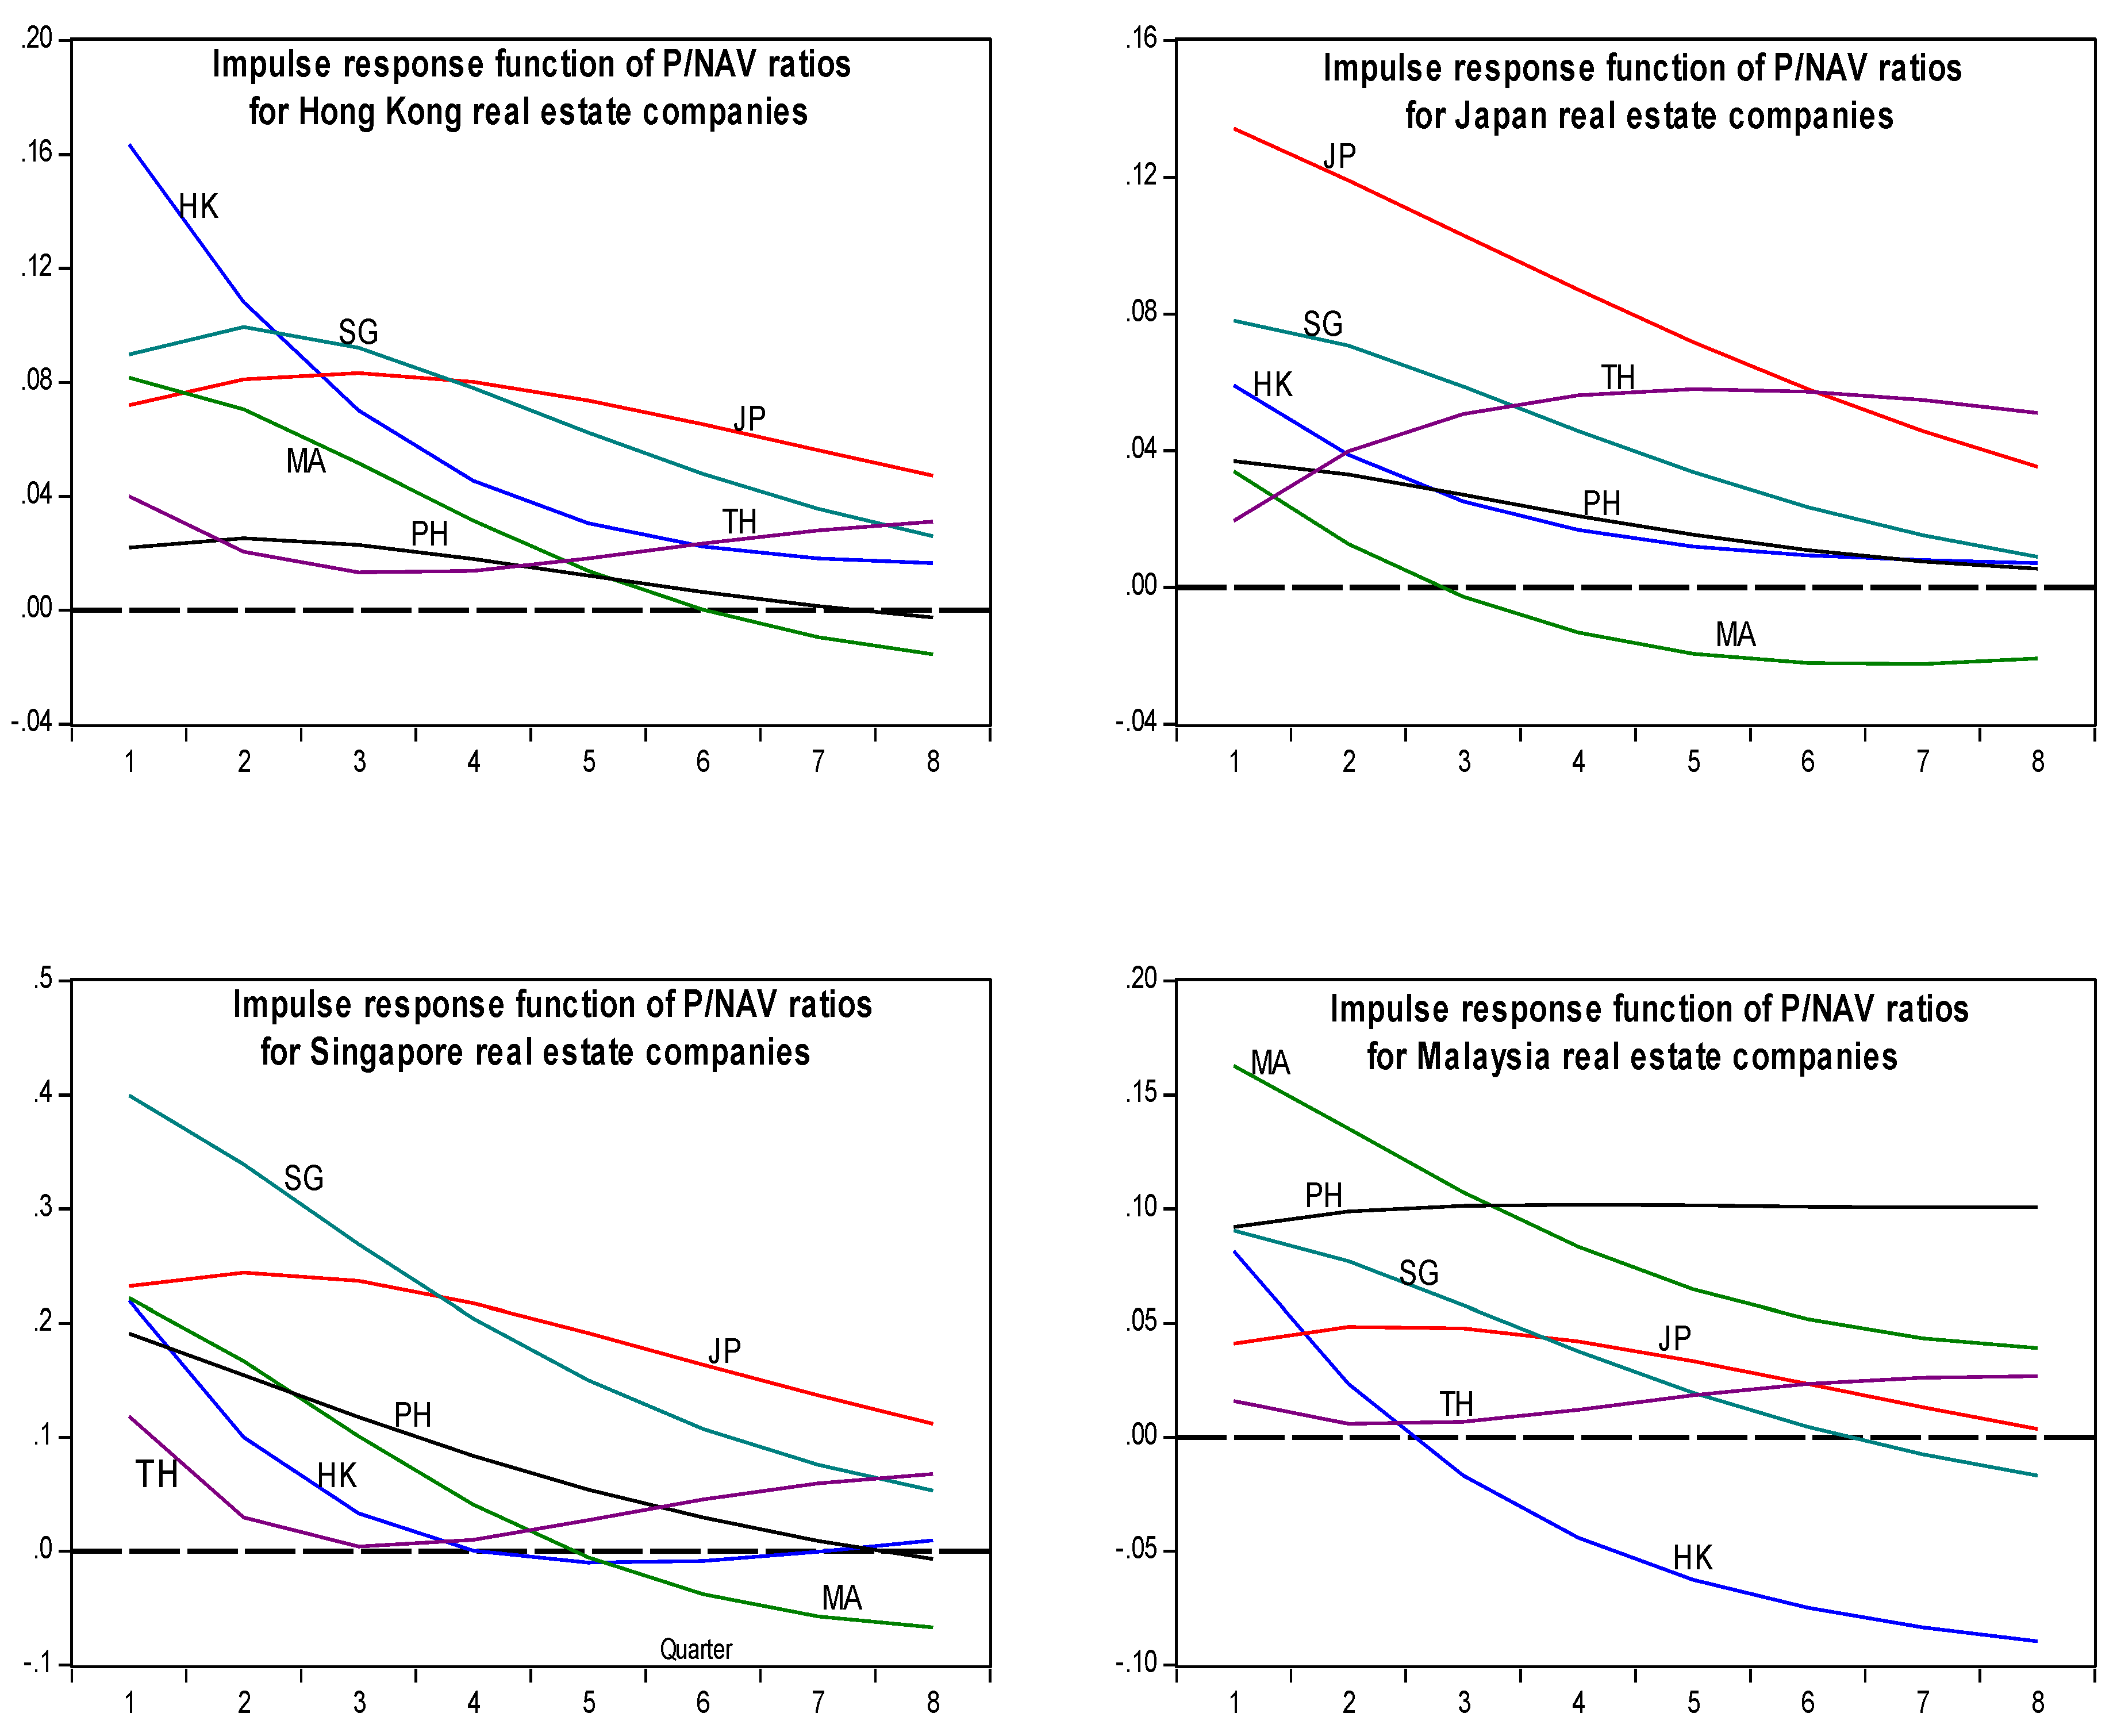
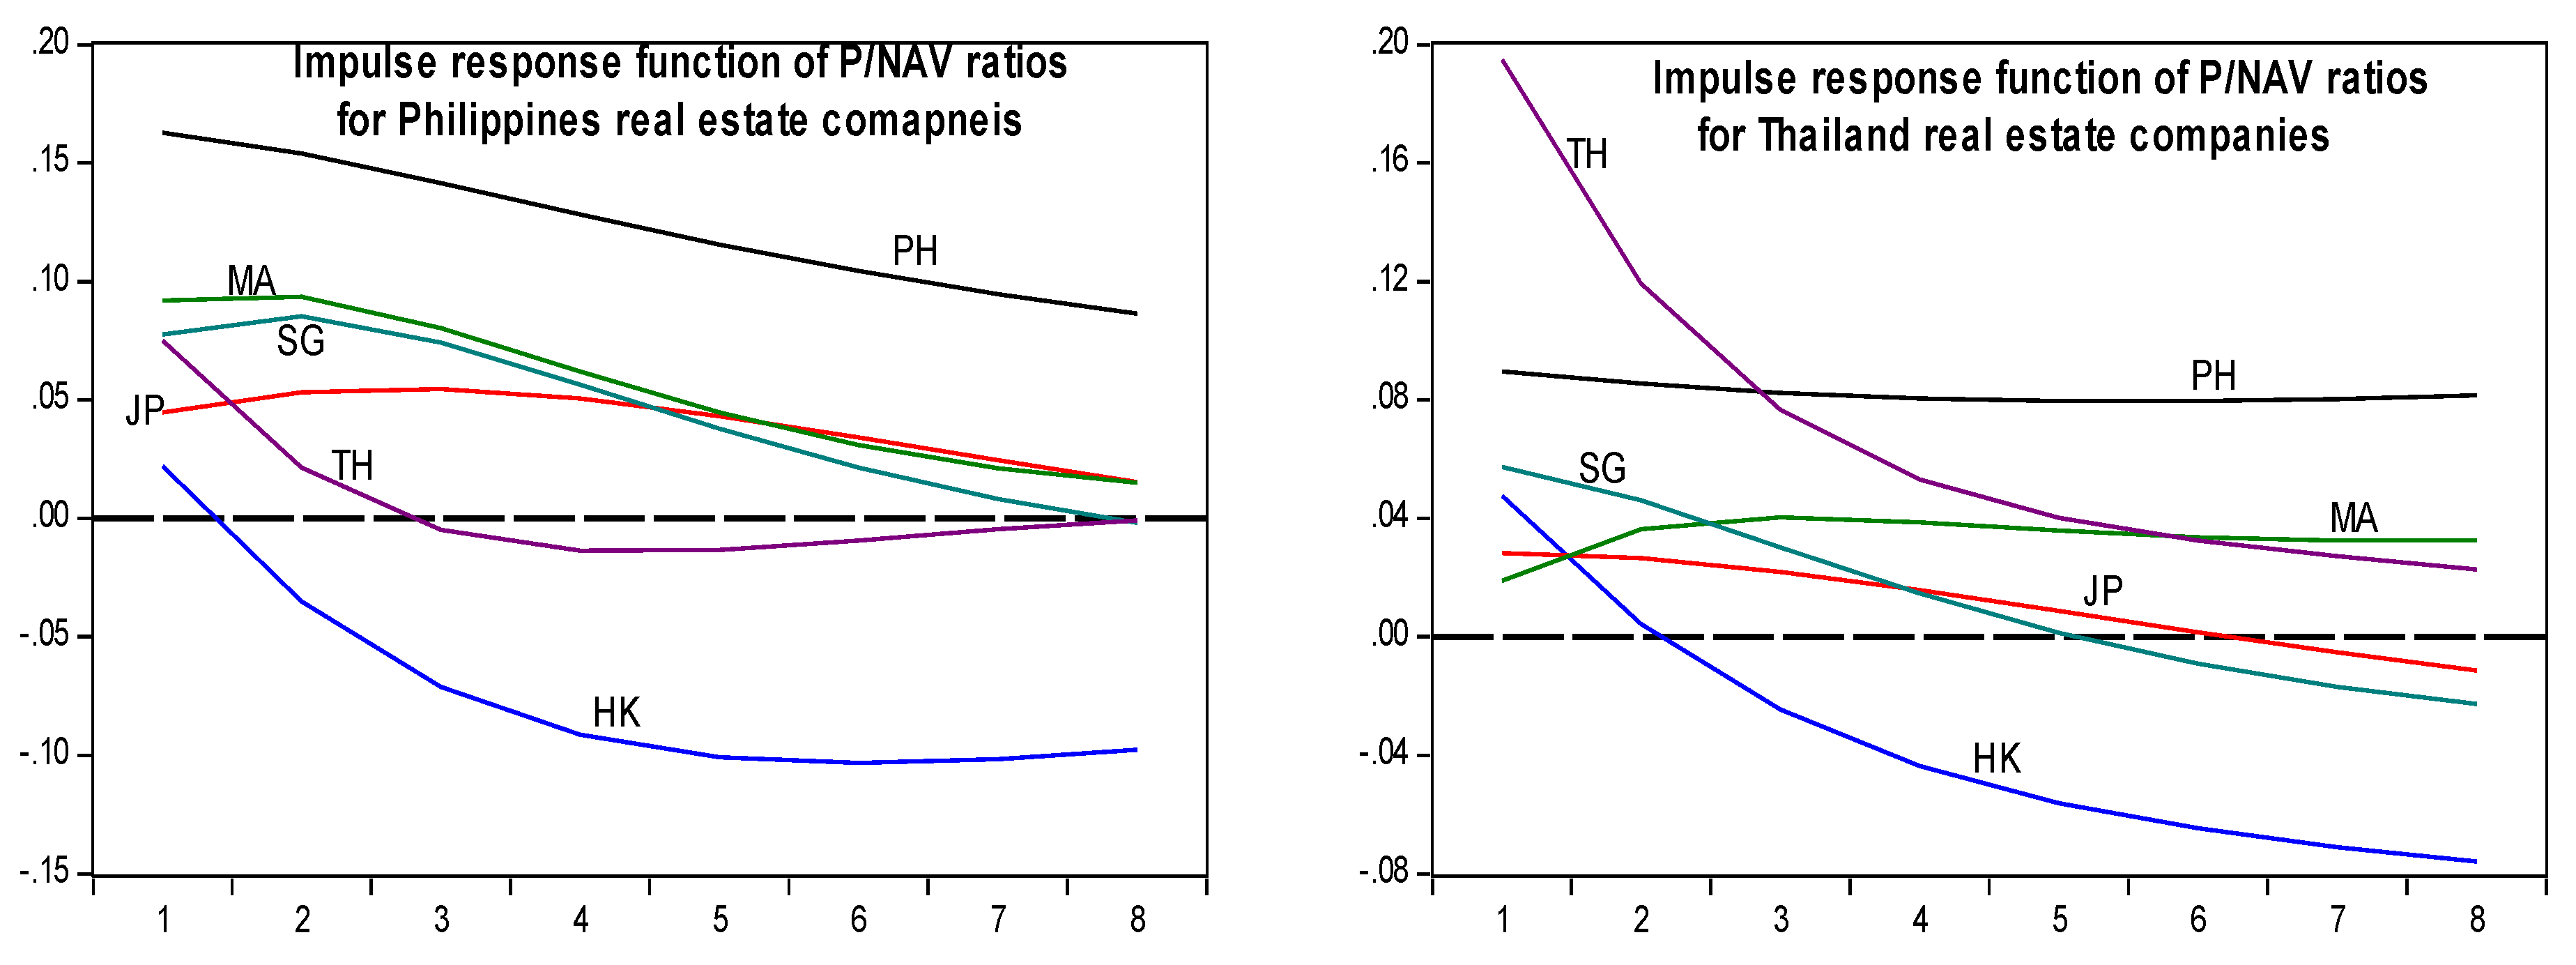
Finally, Figure 2 presents the GIRFs of the P/NAV local factors (weighted variance) in HK, JP, SG, MA, PH, and TH to one standard deviation shocks in P/NAV country factors in HK, JP, SG, MA, PH, and TH over an eight-quarter period. The quarters after the impulse shocks are shown on the horizontal axis and the vertical axis measures the magnitude of the response, whose scale is that 1.0 is equal to one standard deviation.
Beginning with the GIRFs of the P/NAV factor for HK (first plot), we observe a P/NAV factor shocks in SG and JP exerts the greatest positive influence. It initially leads to an immediate and a significant rise of P/NAV up to 1.5 quarters and then declines over time. Similarly, shocks to JP’s P/NAV factor begin with a significant positive effect for about three quarters and then decline at a slower pace than SG. In contrast, shocks to MA’s P/NAV factor cause an immediate drop in HK’s P/NAV factor for about 5.5 quarters before exerting a declining negative influence.
The GIRFs of the other five markets’ P/NAV factors are generally similar to the impulse response paths shown for HK’s P/NAV factors. In agreement with the spillover results reported earlier, own P/NAV factor shocks are relatively persistent and account for a larger portion of the variation in P/NAV factors of the markets concerned. Each Asian market’ P/NA -factor is rather responsive to P/NAV factor shocks from the other five markets. The effects of shocks to the P/NAV factors in other countries are either positive and declining or flattening out; with the patterns and magnitudes of response being different between developed (HK, JP, and SG) and developing (MA, PH, and TH) markets.
Overall, evidence from the GIRFs indicate that the P/NAV factors (and hence NAVDISC factors) of each Asian market may be explained in part by increased P/NAV factors of other markets. Moreover, the GIRFs indicate the unexpected P/NAV factor shocks in one market can have a positive or negative effect on the other markets’ P/NAV factors in the system and reveal how and to what extent the unexpected P/NAV factor shocks influences the linkages among the markets over time.
6.6. Economic Significance of Findings
Our findings have at least three important economic implications for investors, regulators, and corporate management. First, with adequate evidence of panel co-integration and short-term adjustment dynamics, real estate stock prices are rational with respect to their NAVs since prices converge back to the fundamental values of their real estate assets in the long run. As such, the integration of public and direct real estate is found in Asia. Institutional investors can pay more attention to those property stocks with stronger NAVs, as well as assess the differential performances between P and NAV due to lead-lag causality in different periods. Although listed real estate stocks trade at NAVDISC is not uncommon in financial markets, exchange regulators may still need to adopt appropriate control and regulatory measures if the two markets have been in disequilibrium and could still disagree about the value for periods of up to several years.
Second, at the corporate level, the divergence between Ps and NAVs (P/NAV < 1 or P/NAV > 1) may warrant a reassessment of corporate growth opportunities given by its property portfolio. The real estate company concerned may need to realign its real estate portfolio strategy to improve the stock market valuation of its real estate asset portfolio if its existing valuation is consistently associated with net asset value discounts.
Third, our study on the correlation and co-movement of P/NAV ratios broadens investors’ understanding regarding the linkages and predictability of the market valuation of corporate growth across the Asian markets. The factor analysis finds existence and importance of country-specific factors in influencing real estate stocks’ P/NAV ratios. The spillover results provide fresh insights into the extent of common and idiosyncratic factors that caused the NAV discounts/premium across the Asian markets. Additionally, the impulse response functions reveal that the unexpected shocks correlating with the P/NAV ratio in one market can influence the ratios of other markets in either positive and negative directions. For those investors who usually rely on the correlation coefficient as a measure of market interdependence and co-movement, they can improve their portfolio diversification and hedging strategies regarding cross-market information in corporate growth performance and stock market valuation of real estate stocks with these findings.
7. Conclusions
This paper examines the short- and long-term behavior of the P/NAV ratio in six Asian public real estate markets. This topic is timely and important in view of the increasing significance of public real estate investments in many Asian economies in the coming years. There is growing recognition of the important role of real estate, such as its contribution to lower overall portfolio risk, providing high absolute returns and hedging against unexpected inflation or deflation (Hudson-Wilson et al. 2003). Together with the internationalization and globalization of real estate markets that cause stronger integration and more co-movements among many national real estate markets, an in-depth assessment of real estate valuation and stock market pricing has become increasingly important.
The economic significance of the findings is that in these Asian markets real estate stock prices may be rational with respect to their NAVs such that prices can converge back to the fundamental values of their real estate assets in the long run. Compared to the European markets, we expect that NAV may be more important to explain the stock price variations for Asian markets whose performances are tied closely to the underlying direct real estate asset prices that are linked to fast economic development, high population density, and rapid urbanization. Finally, the corollary of our findings is that the degree of integration/segmentation between public and direct real estate markets in the Asian economies studied differs to the extent of allowing investors to have a better diversified mixed-asset portfolio and lower systematic risk.
Although the empirical methodologies employed in this study appear to generate only modest econometric development in academic real estate research, our combined results underscore the complex dynamics of the P/NAV ratio across Asian countries. Similar panel co-integration studies can be extended to European markets that have a more developed institutional and market structure and different risk-return profiles. Additional regional studies (Asian versus non-Asian) are required to explore how common P/NAV factors explain and forecast corporate growth performance from the arbitrage pricing perspective. Finally, future research can compare the performance of REITs, real estate stocks and the general stock market. This will enrich the international real estate literature with respect to the valuation and pricing of public real estate vehicles (REITs and real estate stocks) in the global context.
Acknowledgments
No funding was received for this research.
Author Contributions
Kim Hiang LIOW conceived and developed the research design. Sherry YEO collected and analyzed the data.
Conflicts of Interest
The authors declare no conflict of interest.
References
- Adams, Andrew, and Piers Venmore-Rowland. 1989. Property share valuation. Journal of Property Valuation 8: 127–42. [Google Scholar] [CrossRef]
- Ambrose, Brent W., Dong Wook Lee, and Joe Peek. 2007. Co-movement after joining an index: Spillovers of non-fundamental effects. Real Estate Economics 35: 57–90. [Google Scholar] [CrossRef]
- Barkham, Richard J., and Charles W. R. Ward. 1999. Investor sentiment and noise traders: Discount to net asset value in listed property companies in the U.K. Journal of Real Estate Research 18: 291–312. [Google Scholar]
- Brounen, Dirk, David C. Ling, and Melissa Porras Prado. 2013. Short sales and fundamental value: Explaining the REIT premium to NAV. Real Estate Economics 41: 481–516. [Google Scholar] [CrossRef]
- Campbell, John Y., and Robert J. Shiller. 1988. Stock prices, earnings and expected dividends. Journal of Finance 43: 661–76. [Google Scholar] [CrossRef]
- Conner, Philip, and Robert Falzon. 2004. Volatility differences detween the public and private real estate markets. Briefings in Real Estate Finance 4: 107–17. [Google Scholar] [CrossRef]
- Diebold, Francis X., and Kamil Yilmaz. 2012. Better to give than to receive: Predictive directional measurement of volatility spillovers. International Journal of Forecasting 28: 57–66. [Google Scholar] [CrossRef]
- Dumitrescu, Elena-Ivona, and Christophe Hurlin. 2012. Testing for Granger mon-causality in heterogeneous panels. Economic Modeling 29: 1450–60. [Google Scholar] [CrossRef]
- Engle, Robert F., and C. W. Granger. 1987. Co-integration and error correction: Representation, estimation, and testing. Econometrica: Journal of the Econometric Society 55: 251–76. [Google Scholar] [CrossRef]
- Fama, Eugene F., and Kenneth R. French. 1988. Dividend yields and expected stock returns. Journal of Financial Economics 22: 3–25. [Google Scholar] [CrossRef]
- Hendershott, Patric, Bryan Macgregor, and Michael White. 2003. Explaining real commercial rent using an error-correction model with panel data. Journal of Real Estate Finance and Economics 24: 59–87. [Google Scholar] [CrossRef]
- Hoesli, Martin, and Elias Oikarinen. 2012. Are REITs real estate? Evidence from international sector level data. Journal of International Money and Finance 31: 1823–50. [Google Scholar] [CrossRef]
- Hudson-Wilson, Susan, Frank J. Fabozzi, and Jacques N. Gordon. 2003. Why real estate? Journal of Portfolio Management 29: 12–25. [Google Scholar] [CrossRef]
- Im, Kyung So, M. Hashem Pesaran, and Yongcheol Shin. 2003. Testing for unit roots in heterogeneous panels. Journal of Econometrics 115: 53–74. [Google Scholar] [CrossRef]
- Johansen, Søren. 1991. Estimation and hypothesis testing of co-integration vectors in Gaussian vector autoregressive models. Econometrica: Journal of the Econometric Society 59: 1551–80. [Google Scholar] [CrossRef]
- Kaiser, Henry F. 1960. The application of electronic computers to factor analysis. Educational and Psychological Measurement 20: 141–51. [Google Scholar] [CrossRef]
- Lee, Charles M., Andrei Shleifer, and Richard H. Thaler. 1991. Investor sentiment and the closed-end fund puzzle. The Journal of Finance 46: 75–109. [Google Scholar] [CrossRef]
- Lee, Chien-Chiang, Wei-Ling Huang, and Chun-Hao Yin. 2013. The dynamic interactions among the stock, bond and insurance markets. North American Journal of Economics and Finance 26: 28–52. [Google Scholar] [CrossRef]
- Levin, Andrew, Chien-Fu Lin, and Chia-Shang James Chu. 2002. Unit root tests in panel data: Asymptotic and finite sample properties. Journal of Econometrics 108: 1–24. [Google Scholar] [CrossRef]
- Lin, Pin-Te. 2013. Examining volatility spillover in Asian REIT markets. Applied Financial Economics 23: 1701–05. [Google Scholar] [CrossRef]
- Lin, Pin-Te, and Franz Fuerst. 2014. The integration of direct real estate and stock markets in Asia. Applied Economics 46: 1323–34. [Google Scholar] [CrossRef]
- Ling, David C., and Andy Naranjo. 1999. The integration of commercial real estate markets and stock markets. Real Estate Economics 27: 483–515. [Google Scholar] [CrossRef]
- Liow, Kim Hiang, and Ying Li. 2006. Net asset value discounts for Asian-Pacific real estate companies: Long-run relationships and short-term dynamics. Journal of Real Estate Finance and Economics 33: 363–88. [Google Scholar] [CrossRef]
- Liow, Kim Hiang, and Mong Chuan Sim. 2006. The risk and return profile of Asian listed real estate stocks. Pacific Rim Property Research Journal 12: 283–310. [Google Scholar] [CrossRef]
- Liow, Kim Hiang, and Haishan Yang. 2005. Long-term co-memories and short-run adjustment: Securitized real estate and stock markets. The Journal of Real Estate Finance and Economics 31: 283–300. [Google Scholar] [CrossRef]
- Lizieri, Colin. 2013. After the fall: Real estate in the mixed-asset portfolio in the aftermath of the global financial crisis. Journal of Portfolio Management 39: 43–59. [Google Scholar]
- Lizieri, Colin, and Stephen Satchell. 1997. Interactions between property and equity markets: An investigation of linkages in the United Kingdom 1972–1992. Journal of Real Estate Finance and Economics 15: 11–26. [Google Scholar] [CrossRef]
- MacDonald, Ronald, and David Power. 1995. Stock prices, dividends ansd retention: Long-run relationships and short-run dynamics. Journal of Empirical Finance 2: 135–51. [Google Scholar] [CrossRef]
- Ong, Seow-Eng, and Clark L. Maxim. 1997. A heterogeneous panel co-integration-error correction approach to modelling commercial mortgage backed securities prices. Journal of Property Finance 8: 317–35. [Google Scholar] [CrossRef]
- Pedroni, Peter. 1995. Panel Co-Integration: Asymptotic and Finite Sample Properties of Pooled Time Series Tests with an Application to the PPP Hypothesis. Working paper. Bloomington: Indiana University. [Google Scholar]
- Pedroni, Peter. 1999. Critical values for co-integration tests in heterogeneous panels with multiple regressors. Oxford Bulletin of Economic and Statistics 61: 653–78. [Google Scholar] [CrossRef]
- Pesaran, M. H., and Y. Shin. 1998. Generalized impulse response analysis in linear multivariate models. Economic Letters 58: 17–29. [Google Scholar] [CrossRef]
- Quan, Daniel C., and Sheridan Titman. 1999. Do real estate prices and stock prices move together? An international analysis. Real Estate Economics 27: 183–207. [Google Scholar] [CrossRef]
| 1 | Liow and Sim (2006) find that the ranges of return volatility, measured by the standard deviation of returns, are between 3.48% (USA), 5.93% (UK), 9.52% (Japan), and 26.93% (Indonesia) for the 12 listed real estate indexes. On the other hand, the corresponding range is between 4.40% (USA) and 16.82% (China) for the 12 stock market indexes. In all markets except for China and the USA, real estate indexes have a higher return volatility than the respective stock market indexes. |
| 2 | NAV in the real estate company context represents the underlying value of the real estate ownership along with other assets and adjusted for liabilities and other claims on the company. The price of a listed real estate company is the valuation of the company from the stock market perspective. Similar to an investment trust and other closed-end funds, NAV is the principal basis for valuation of real estate investment companies (Adams and Venmore-Rowland 1989). |
| 3 | P/NAV ratio in the listed real estate context is equivalent to Tobin’s q in the general corporate finance context. |
| 4 | Another related issue in the literature discussed in these studies is why securitized real estate equities traded at NAV discount or premiums. Similar to closed-end funds, there are two types of explanations: rational and behavioral (Lee et al. 1991). Please also consult Barkham and Ward (1999) and Brounen et al. (2013) for explanations as to why real estate stocks/REIT share prices deviate from NAV. Finally, this issue will not be the focus of this study. |
| 5 | To the best of our knowledge and after careful screening, real estate companies in these countries invest, develop, and manage commercial properties. Therefore, the sample is not a clean “real estate investment” sample since Datastream also includes real estate developers and related companies that would normally be valued on an earnings basis but not in relation to their NAVs. This is likely to give rise to one possible source of error in the data and analysis and subsequent interpretation of the results should be viewed with this problem in mind. |
| 6 | The starting point (2004Q1) was the earliest period that all real estate stocks had the P and NAV data. |
| 7 | Empirical tests for co-integration evolve typically around the Engle and Granger (1987) and Johansen (1991) approaches provided that the length of the time series is sufficiently long. |
| 8 | The panel co-integration methodology has been successfully applied by Pedroni (1995) (purchasing power parity); Ong and Maxim (1997) (commercial mortgage-backed security prices); Hendershott et al. (2002) (commercial rent modelling); as well as Liow and Li (2006) (NAVDISC for real estate companies). Please refer to the above references that provides brief mathematical details for the procedures. Finally, we use E-view8 and Rats 8 to implement this empirical work. |
| 9 | The grouped panel dynamic ECM estimates are less economically meaningful, with a statistically insignificant error term for JP and TH and an insignificant short-term NAV coefficient for three country panels (HK, PH, and TH). |
| 10 | The lag lengths of the unrestricted VAR for panel causality test using the SC criterion are: 1 (HK), 5 (JP), 3(MA), 2 (PH), 1 (SG), and 2 (TH). The causality results are not presented for brevity. |
| 11 | Since there are more than one factor for each market, a weighted local variance factor for each of the public real estate markets is estimated. For example, for TH, which has four local factors, the weighted variance factor is estimated as: weighted local variance P/NAV factor for TH market = (V1 × F1 + V2 × F2 + V3 × F3 + V4 × F4)/(V1 + V2 + V3+V4); where V1,…,V4 are the percent of variance for the four factors (F1,…,F4) derived. |
Figure 1.
Net asset value discount/premium and P/NAV of Asian real estate companies.
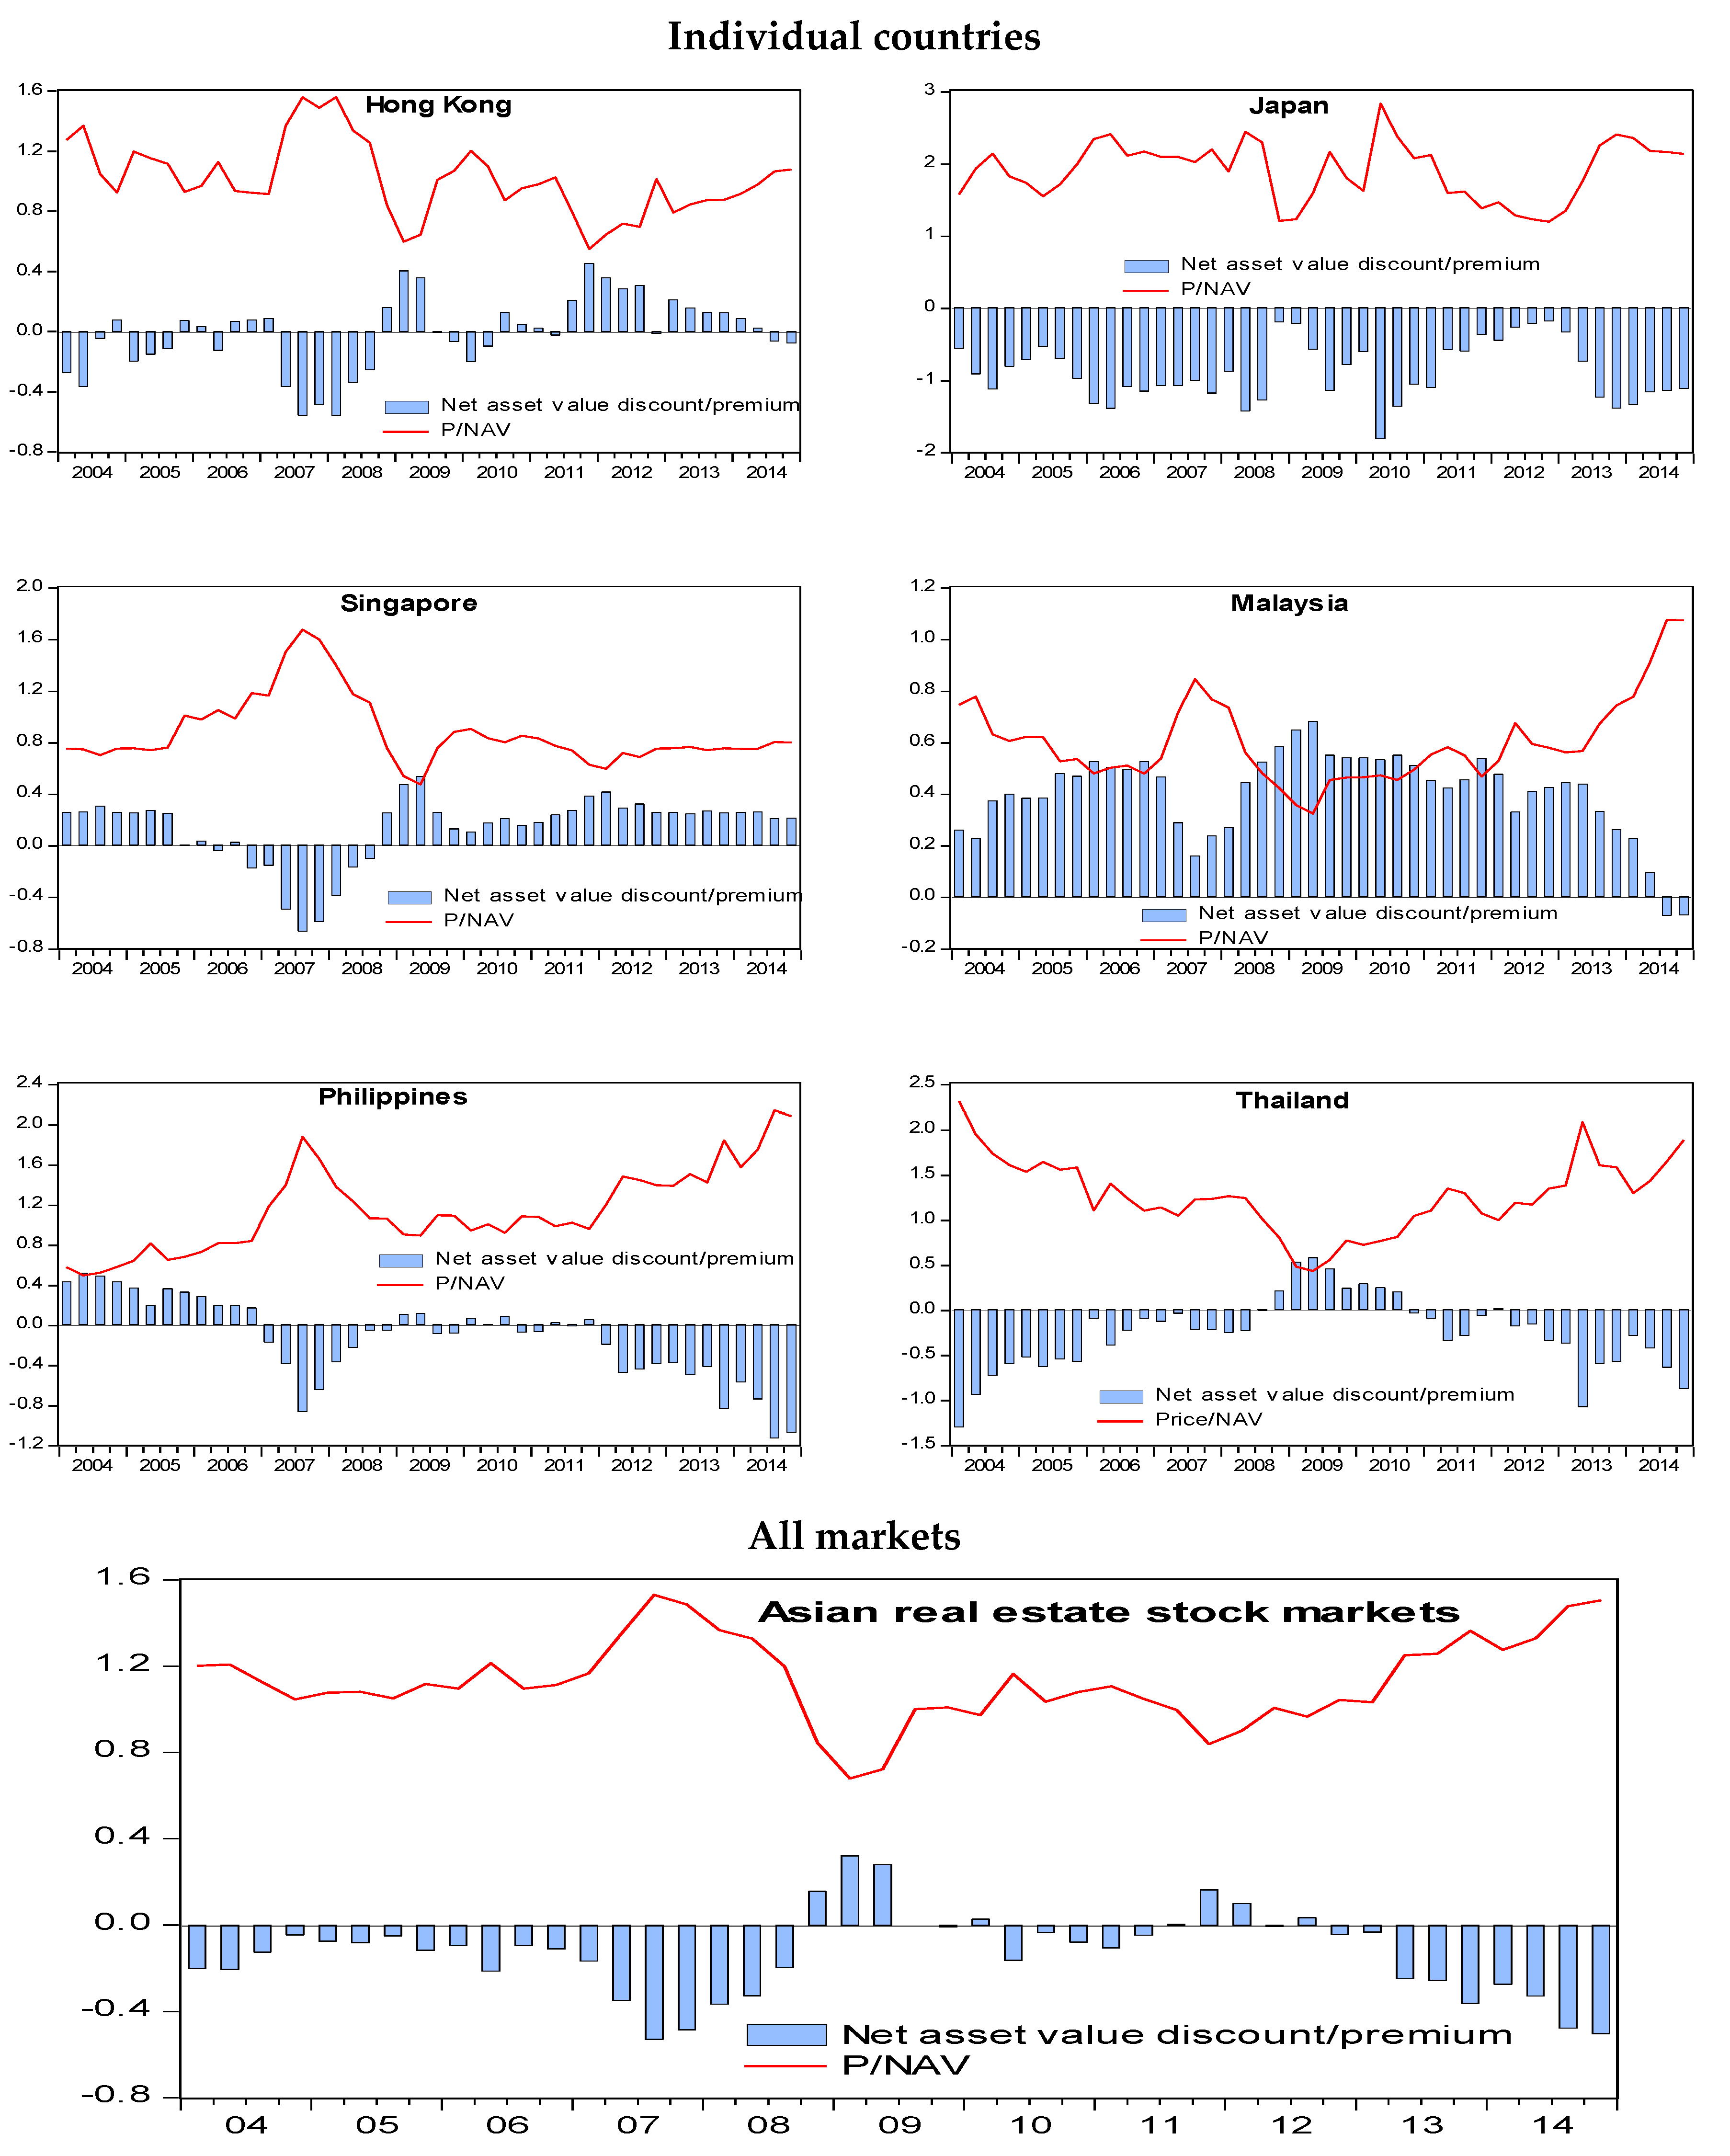
Figure 2.
Generalized impulse response for Asia real estate stock markets, P/NAV ratios, eight-quarter forecast horizon, 2004Q1 to 2014Q4.
Figure 2.
Generalized impulse response for Asia real estate stock markets, P/NAV ratios, eight-quarter forecast horizon, 2004Q1 to 2014Q4.


Table 1.
Average quarterly performance of net asset value discounts/premiums and Price–NAV Ratios of Asian securitized real estate markets: 2004Q1 to 2014Q4.
Table 1.
Average quarterly performance of net asset value discounts/premiums and Price–NAV Ratios of Asian securitized real estate markets: 2004Q1 to 2014Q4.
| Country | Average NAV Discounts/Premiums (%) | No. of Quarters with NAV Premium | No. of Quarters with NAV Discount | Price-NAV Ratio | No of Firms (%) with NAV Premium | No. of Firms (%) with NAV Discount | |
|---|---|---|---|---|---|---|---|
| Mean | Standard Deviation | ||||||
| HK | −1.26 | 123.7 | 21 | 23 | 1.013 | 14 (37.8) | 23 (62.7) |
| JP | −89.80 | 254.1 | 44 | 0 | 1.898 | 18 (66.6) | 9 (33.3) |
| MA | 40.02 | 44.1 | 2 | 42 | 0.600 | 3 (7.9) | 35 (92.1) |
| PH | −13.63 | 180.9 | 25 | 19 | 1.136 | 6 (26.1) | 17 (73.9) |
| SG | 12.61 | 45.9 | 9 | 35 | 0.874 | 3 (25) | 9 (75) |
| TH | −32.99 | 130.4 | 36 | 8 | 1.330 | 9 (42.8) | 12 (57.2) |
Notes: Net asset value discount/premium = (NAV price)/NAV = 1 − price/NAV; − (premium).
Table 2.
Panel unit root test results.
| (a) Country level | |||||||||
| Country | N | Levin, Lin and Chu (LLC) t Stat | Im, Pesaran, and Shin (IPS) W-Stat | ||||||
| P | NAV | ΔP | ΔNAV | P | NAV | ΔP | ΔNAV | ||
| HK | 38 | 0.51 | −1.28 | −16.48 * | −36.72 * | −0.99 | 0.87 | −18.86 * | −35.08 * |
| JP | 27 | 0.52 | −0.94 | −23.11 * | −16.80 * | 0.94 | 0.65 | −22.35 * | −18.54 * |
| MA | 38 | 1.63 | 0.43 | −15.04 * | −20.06 * | −0.31 | 2.27 | −18.86 * | −21.74 * |
| PHI | 23 | 1.29 | −0.41 | −13.35 * | −14.69 * | 0.32 | 0.65 | −16.51 * | −16.65 * |
| SG | 11 | −1.09 | −1.35 | −16.25 * | −11.97 * | 1.51 | 1.21 | −13.41 * | −13.27 * |
| TH | 21 | 0.94 | −0.99 | −7.08 * | −13.44 * | −0.44 | 1.46 | −14.16 * | −16.76 * |
| (b) Regional level | |||||||||
| All | N | Levin, Lin and Chu (LLC) t Stat | Im, Pesaran, and Shin (IPS) W-Stat | ||||||
| P | NAV | ΔP | ΔNAV | P | NAV | ΔP | ΔNAV | ||
| Total | 158 | −0.34 | −1.15 | −32.73 * | −39.63 * | −3.73 * | 3.40 | −41.37 * | −45.17 * |
Notes: (i) The null hypothesis is that there is a unit root in the panel data. (ii) “N” indicates the number of listed real estate companies pooled for each panel data. (iii) LLC ADF t-statistic is the adjusted t-statistic, which follows a standard normal distribution. IPS ADF t-bar statistic is the standardized group mean t-bar statistic, which follows a standard normal distribution. (iv) * Indicates two-tailed significance at the 1% level. (v) The critical values for 5% and 1% level are −1.65 and −2.33, respectively.
Table 3.
Results for panel co-integration test results.
| (a) Country level | ||||||||
| Country | N | Panel Statistics (within Dimension) | Group Statistics (between Dimension) | |||||
| V | PP rho | PP t | ADF t | PP rho | PP t | ADF t | ||
| HK | 38 | 2.18 ** | −2.35 * | −3.81 * | −3.42 * | 1.09 | −1.46 *** | −0.98 |
| JP | 27 | 2.77 * | −5.53 * | −6.51 * | −4.96 * | −2.69 * | −6.11 * | −4.28 * |
| MA | 38 | 3.27 * | −4.19 * | −5.52 * | −5.35 * | 1.26 | −0.95 | −0.29 |
| PHI | 23 | 2.32 ** | −4.15 * | −5.35 * | −5.23 * | 0.74 | −0.89 | −0.96 |
| SG | 12 | 1.89 ** | −1.19 | −2.11 ** | −2.21 ** | −0.88 | −2.41 * | −2.61 * |
| TH | 21 | 3.19 * | −2.71 * | −3.15 * | −2.51 * | −1.53 *** | −3.17 * | −2.69 * |
| (b) Regional level | ||||||||
| All | N | Panel Statistics | Group Statistics | |||||
| V | PP rho | PP t | ADF t | PP rho | PP t | ADF t | ||
| Total | 158 | 5.67 ** | −8.35 * | −11.20 * | −10.15 * | −0.47 | −5.84 * | −5.01 * |
Notes: (i) The null hypothesis is that there is no panel co-integration between P and NAV for the perspective panels. (ii) “N” indicates the number of real estate companies pooled for each panel. (iii) V (non-parametric variance ratio); rho (non-parametric Phillips and Perron (PP) rho statistic); PP t (non-parametric PP t-statistic) and ADF t (parametric ADF t statistic). (iv) *, **, ***; indicates panel co-integration test statistic rejects the null of no co-integration at the 1%, 5%, and 10% significance levels respectively. (v) For the panel variance ratio, the critical values for the 10%, 5%, and 1% levels are 1.29, 1.65 and 2.33; for the other six statistics, the critical values are −1.29, −1.65, and −2.33 for the 10, 5, and 1% levels, respectively.
Table 4.
Results for panel dynamic ordinary least squares test and panel error correction Models: 2004Q1–2014Q4.
Table 4.
Results for panel dynamic ordinary least squares test and panel error correction Models: 2004Q1–2014Q4.
| (a) Country level | |||||||
| Estimators | Parameters | HK | JP | MA | PHI | SG | TH |
| Panel DOLS (Pooled) | Long-Term Coefficient | ||||||
| Coefficient | 0.961 * | 0.826 * | 0.948 * | 0.479 * | 0.797 * | 0.921 * | |
| Standard Error | 0.045 | 0.036 | 0.095 | 0.076 | 0.078 | 0.090 | |
| t-Statistics | 21.410 | 23.260 | 9.810 | 6.270 | 10.250 | 10.240 | |
| Panel Dynamics ECM (Pooled) | Short-Term Dynamics | ||||||
| Short-term Coefficient | 0.066 *** | 0.147 * | 0.197 * | 0.052 | 0.295 ** | 0.142 ** | |
| RESID (−1) | −0.116 * | −0.093 * | −0.130 * | −0.135 * | −0.213 * | −0.117 * | |
| Panel DOLS (Grouped) | Long-Term Coefficient | ||||||
| Coefficient | 0.519 * | 1.224 * | 2.188 * | 1.023 * | 0.599 * | 1.229 * | |
| Standard Error | 0.070 | 0.119 | 0.2755 | 0.338 | 0.208 | 0.148 | |
| t-Statistics | 7.366 | 10.248 | 7.943 | 3.030 | 2.875 | 8.324 | |
| Panel Dynamics ECM (Grouped) | Short-Term Dynamics | ||||||
| Short-term Coefficient | 0.026 | 0.137 * | 0.203 * | 0.044 | 0.258 ** | 0.107 | |
| RESID (−1) | −0.047 * | −6.2 × 10⁻⁵ | −0.009 * | −0.016 * | −0.024 ** | 0.416 | |
| (b) Regional level | |||||||
| Estimators | Parameters | Overall | |||||
| Panel DOLS (Pooled) | Long-Term Coefficient | ||||||
| Coefficient | 0.849 * | ||||||
| Standard Error | 0.023 | ||||||
| t-Statistics | 37.133 | ||||||
| Panel Dynamics ECM (Pooled) | Short- Term Dynamics | ||||||
| Short-Term Coefficient | 0.107 * | ||||||
| RESID (−1) | −0.119 * | ||||||
| Panel DOLS (Grouped) | Long- Term Coefficient | ||||||
| Coefficient | 1.214 * | ||||||
| Standard Error | 0.090 | ||||||
| t-Statistics | 13.489 | ||||||
| Panel Dynamics ECM (Grouped) | Short- Term Dynamics | ||||||
| Short-Term Coefficient | 0.090 * | ||||||
| RESID (−1) | −0.001 *** | ||||||
Notes: *, **, ***; indicates panel co-integration test statistic rejects the null of no co-integration at the 1%, 5%, and 10% significance levels, respectively.
Table 5.
Results for Granger panel causality test between P and NAV: 2004Q1–2014Q4.
| (a) Country level | |||
| Panel Pairwise Granger Causality Tests (Common Coefficients) | |||
| Country/Lag Length | Null Hypothesis: | F-Statistics | |
| HK (lag 1) | P does not Granger Cause NAV | 8.34 * | |
| NAV does not Granger Cause P | 28.88 * | ||
| JP (lag 5) | P does not Granger Cause NAV | 11.05 * | |
| NAV does not Granger Cause P | 16.50 * | ||
| MA (lag 3) | P does not Granger Cause NAV | 0.27 | |
| NAV does not Granger Cause P | 36.55 * | ||
| PHI (lag 2) | P does not Granger Cause NAV | 18.45 * | |
| NAV does not Granger Cause P | 3.39 * | ||
| SG (lag1) | P does not Granger Cause NAV | 4.80 * | |
| NAV does not Granger Cause P | 15.05 * | ||
| TH (lag 2) | P does not Granger Cause NAV | 8.10 * | |
| NAV does not Granger Cause P | 18.83 * | ||
| Pairwise Dumitrescu–Hurlin (2012) Panel Causality Tests (Individual Coefficients) | |||
| Country | Null Hypothesis: | W-Stat | Zbar-Stat |
| HK (lag1) | P does not homogeneously cause NAV | 5.28 * | 4.58 * |
| NAV does not homogeneously cause P | 5.67 * | 5.45 * | |
| JP (lag 5) | P does not homogeneously cause NAV | 15.22 * | 13.2 * |
| NAV does not homogeneously cause P | 12.02 * | 8.9 * | |
| MA (lag 3) | P does not homogeneously cause NAV | 1.76 | −0.98 |
| NAV does not homogeneously cause P | 6.69 * | 12.59 * | |
| PH (lag 2) | P does not homogeneously cause NAV | 2.45 * | 4.33 * |
| NAV does not homogeneously cause P | 1.14 | 0.26 | |
| SG (lag 1) | P does not homogeneously cause NAV | 2.23 | 0.168 |
| NAV does not homogeneously cause P | 4.91 * | 4.14 * | |
| TH (lag 2) | P does not homogeneously cause NAV | 1.67 * | 1.81 * |
| NAV does not homogeneously cause P | 5.19 * | 12.23 * | |
| (b) Regional level | |||
| Panel Pairwise Granger Causality Tests | |||
| Null Hypothesis: | F-Statistics | ||
| Overall/lag 3 | P does not Granger Cause NAV | 32.09 * | |
| NAV does not Granger Cause P | 89.20 * | ||
| Pairwise Dumiterscu–Hurlin Panel Causality Tests | |||
| Null Hypothesis: | W-Stat | Zbar-Stat | |
| Overall /lag 3 | P does not homogeneously cause NAV | 4.9 * | 7.65 * |
| NAV does not homogeneously cause P | 6.57 * | 15.13 * | |
(i) The null hypothesis is that X does not homogeneously cause Y and vice versa. The respective lag lengths are determined using SC criterion. (ii) *, indicates two-tailed significance at the 1% significance level.
Table 6.
Proportion (%) of real estate companies’ P/NAV variance explained by factors extracted.
| Factor | Hong Kong | Japan | Singapore | Malaysia | Philippines | Thailand |
|---|---|---|---|---|---|---|
| 1 | 27.19 | 32.83 | 68.76 | 26.45 | 36.38 | 23.38 |
| 2 | 11.91 | 20 | 10.31 | 20.94 | 13.68 | 19.96 |
| 3 | 11.16 | 13.53 | 12.79 | 13 | 18.29 | |
| 4 | 10.2 | 8.23 | 12.52 | 9.96 | 14.38 | |
| 5 | 9.16 | 6.07 | 7.49 | 3.91 | ||
| 6 | 6.69 | 5.53 | 2.93 | |||
| 7 | 4.48 | |||||
| 8 | 2.95 | |||||
| Total | 83.75 | 86.19 | 79.07 | 83.12 | 76.94 | 76 |
Notes: 1. The number of real estate companies included in the factor analysis: 37 (Hong Kong), 27 (Japan), 11 (Singapore), 38 (Malaysia), 23 (Philippines), and 20 (Thailand). 2. For each market, the quarterly P/NAV ratios from 2004Q1 to 2014Q4 are subject to maximum-likelihood factor analysis, with varimax rotation and Kaiser normalization. 3. The number of P/NAV common factors extracted are: eight (Hong Kong), six (Japan), two (Singapore), six (Malaysia), five (Philippines), and four (Thailand).
Table 7.
Correlations of first local P/NAV factors of each market: 2004Q1 to 2014Q4.
| Country | HK | JP | SG | MA | PH | TH |
|---|---|---|---|---|---|---|
| HK | 1 | 0.694 *** | 0.589 *** | −0.153 | −0.401 *** | −0.238 |
| JP | 0.572 *** | 1 | 0.117 | 0.035 | −0.343 ** | −0.090 |
| SG | 0.638 *** | 0.179 | 1 | −0.074 | −0.063 | −0.243 |
| MA | 0.138 | 0.400 *** | 0.116 | 1 | 0.670 *** | 0.515 *** |
| PH | −0.350 ** | −0.416 *** | 0.098 | 0.019 | 1 | 0.825 *** |
| TH | −0.121 | 0.093 | −0.331 ** | 0.098 | 0.510 *** | 1 |
Notes: each cell above the diagonal contains the Pearson correlation coefficient (parametric), each cell bow the diagonal includes the Spearman rank correlation coefficient (non-parametric). ***, ** indicates two-tailed significance at the 1% and 5% levels, respectively.
Table 8.
Generalized P/NAV spillovers across Asia real estate stock markets: eight-step forecast horizon, VAR (1), 2004Q1 to 2014Q4.
Table 8.
Generalized P/NAV spillovers across Asia real estate stock markets: eight-step forecast horizon, VAR (1), 2004Q1 to 2014Q4.
| SG | PH | TH | JP | HK | MA | “FROM” Others | |
|---|---|---|---|---|---|---|---|
| SG | 42.4 | 9.1 | 2.5 | 30.5 | 5.9 | 9.7 | 58 |
| PH | 9.3 | 47.9 | 2.9 | 6.2 | 22 | 11.7 | 52 |
| TH | 4.6 | 34.5 | 40.2 | 1.5 | 13.7 | 5.5 | 60 |
| JP | 16.4 | 4.9 | 16.5 | 53.9 | 5.4 | 2.9 | 46 |
| HK | 26.9 | 1.8 | 3.1 | 26.2 | 31.2 | 10.7 | 69 |
| MA | 8.9 | 35.8 | 1.6 | 4.8 | 15.5 | 33.3 | 67 |
| ‘’TO” others | 66 | 86 | 27 | 69 | 62 | 41 | 351 |
| TOTAL | 108 | 134 | 67 | 123 | 94 | 74 | 58.50% |
| ‘’FROM” others | 58 | 52 | 60 | 46 | 69 | 67 | |
| Net spillovers | 8 | 34 | −33 | 23 | −7 | −26 | |
| Share in spillover transmission | 18.80% | 24.50% | 7.69% | 19.66% | 17.66% | 11.68% | |
| Share in spillover absorption | 16.52% | 14.81% | 17.09% | 13.11% | 19.66% | 19.09% | |
| Share in spillover average | 17.66% | 19.66% | 12.39% | 16.38% | 18.66% | 15.38% |
Source: Diebold and Yilmaz (2012) and authors’ estimation.
© 2018 by the authors. Licensee MDPI, Basel, Switzerland. This article is an open access article distributed under the terms and conditions of the Creative Commons Attribution (CC BY) license (http://creativecommons.org/licenses/by/4.0/).
Share and Cite
MDPI and ACS Style
LIOW, K.H.; YEO, S. Dynamic Relationships between Price and Net Asset Value for Asian Real Estate Stocks. Int. J. Financial Stud. 2018, 6, 28. https://doi.org/10.3390/ijfs6010028
AMA Style
LIOW KH, YEO S. Dynamic Relationships between Price and Net Asset Value for Asian Real Estate Stocks. International Journal of Financial Studies. 2018; 6(1):28. https://doi.org/10.3390/ijfs6010028
Chicago/Turabian StyleLIOW, Kim Hiang, and Sherry YEO. 2018. "Dynamic Relationships between Price and Net Asset Value for Asian Real Estate Stocks" International Journal of Financial Studies 6, no. 1: 28. https://doi.org/10.3390/ijfs6010028
Note that from the first issue of 2016, this journal uses article numbers instead of page numbers. See further details here.