Abstract
Using DCC-GARCH model, this paper finds that, since 1990, the relationship between crude oil prices and the US dollar index is time-varying, demonstrating a process of ‘very weak correlation—negative correlation—enhanced negative correlation—weakening negative correlation’, but the existing research does not provide enough reasonable explanation. Therefore, this paper proposed a ‘key mediating factors’ hypothesis which points out that whether there is a common ‘key mediating factor’ is important source of the time-varying relationship between two assets. We argue that market trend and financial market sentiment undertook the role of ‘key mediating factor’ during the period of the 2002 to the financial crisis and financial crisis to 2013, while other periods lack the ‘key mediating factors’.
JEL Classification:
C52; G17; Q43
1. Introduction
As two important financial assets, the relationship between oil and the US dollar is always an important subject of the international financial market. If there is a stable negative correlation between two assets, investors can take hedge strategies to diversify investment; if the negative relationship is time-varying, the hedge strategy can only be used in certain period; if the correlation is weak, investment diversification cannot achieve the aim of risk diversification.
Many scholars have conducted extensive research on the relationship between crude oil prices and US dollar exchange rates through different methods. Overall, these studies indicate that the two assets have a negative relationship, but the degree of correlation is dynamic. For example, Yousefi and Wirjanto (2004), and Cifarelli and Paladino (2010) suggest that the dollar exchange rate and oil prices have a negative relationship. Mensah et al. (2017) examine the long-run dynamics between oil price and the bilateral US dollar exchange rates for six oil-dependent economies before and after the 2008 Global Financial Crises and finds that the inverse correlation between oil price and exchange rate is more obvious for countries which rely most on oil export earnings especially in the post crisis period. Wu et al. (2012) use dynamic copula GARCH model and note that the relationship between the dollar index and oil prices changes over time. The correlation was weak prior to 2003, but became negatively correlated and this negative relationship was strengthened gradually after 2003. Reboredo et al. (2014) find that there is a weak negative relationship between oil prices and major currencies’ (dollar, euro, Australian dollar, British pound, Canadian dollar, etc.) exchange rates before the crisis. In addition, as the time scales grow longer, the degree of correlation gets smaller, and the negative relationship between oil prices and dollar exchange rate increases significantly on all time scales after the financial crisis. Coudert and Mignon (2016) even find the negative relationship holds most of the time but turns positive when the dollar hits very high values, as in the early 1980s. Some studies discuss which one (US dollar exchange rate or oil prices) is dominant, but have not got consensus. Krichene (2005), Zhang et al. (2008) and Cheng (2008) believe that it is US dollar exchange rate that leads to oil price fluctuations. McLeod and Haughton (2018) deem that US real effective exchange rate (REER) is the key indicator which influences the move direction of future oil prices. However, Lizardo and Mollick (2010) argue that crude oil prices help explains US dollar changes in the long run. Reboredo et al. (2014) note that there is an interdependence phenomenon after financial crisis. Chen et al. (2016) find that oil price shocks (supply or demand shocks) can explain about 10–20% of long-term variations in US dollar exchange rates and find the explanation is much bigger after global financial crisis.
Why is there a negative relationship between the US dollar and oil prices? Existing interpretations mainly emphasize two aspects, one is the denomination effect, which emphases crude oil is denominated in US dollar, that the change in the nominal effective exchange rate (NEER) of US dollar affects the import price of oil in other currencies, thus affecting the global oil demand and crude oil prices (Krichene 2005; Jawadi et al. 2016); another is the portfolio effect, which emphases that the depreciation of US dollar will lead to a decline in dollar asset yields, leading to investors turning to oil and other assets in their portfolio, resulting in upward of crude oil prices and a negative relationship, vice versa (Kaufmann and Ullman 2009).
Although the existing literature points out some channels through which US dollar exchange rate and oil price influence each other, these analyses cannot explain why the relationship is time-varying. Such as when the hedge strategy is effective; why the negative relationship is weak during some periods, while it is strong in other periods.
In contrast to the existing studies on this topic, the present study proposes a mechanism of ‘key mediating factors’ for the first time, so as to better explain why US dollar exchange rate and crude oil show a dynamic relationship. We believe that, relative to the previous studies, a more likely explanation is mechanism of ‘key mediating factors’: in a certain period, one or more key mediating factors have important impact on both US dollar and crude oil, leading to opposite movements of two assets, as the impact of the two is time-varying, which makes the correlation time-varying. In some other periods, however, there is no such a key mediating factor, and the two assets’ price fluctuation is driven by individual respective factors, which leads to a weak correlation between the two.
2. Data and Empirical Model
2.1. Data
We select Brent crude oil futures and dollar index as proxies for crude oil price and US dollar exchange rate from Wind Info1, which is a leading financial information service provider of China. Let be Brent crude oil yield, is the US dollar index yield, sample range from 2 January 1990 to 31 December 2016, and we get a total of 6972 observations. Table 1 shows basic descriptions of data. The means of and are around zero which means Brent crude oil yield and US dollar index yield are around zero. The skewness is less than zero and the kurtosis is more than 3, which indicates that variables are skeweddistribution with fat-tailed and leptokurtic. The Jarque–Bera Statistic is much bigger than the normal distribution which is conforming to the situation in financial market.

Table 1.
Statistical description of variables.
Figure 1 shows the evolution of Brent crude oil price and the dollar index since 1990. During the period of 1990–1995, the dollar index fluctuated frequently but oil price hardly fluctuated. Then during the 1995–2002 period, the dollar index rose sharply, but oil price rose within a narrow range. There does not seem to be a strong correlation between them before 2002, while it showed a significant negative relationship after 2002. The rise of dollar index was accompanied by a decline in oil prices, and the dollar index fell corresponds to the rise of oil prices. However, we still need more accurate ways to detect the correlation between them.
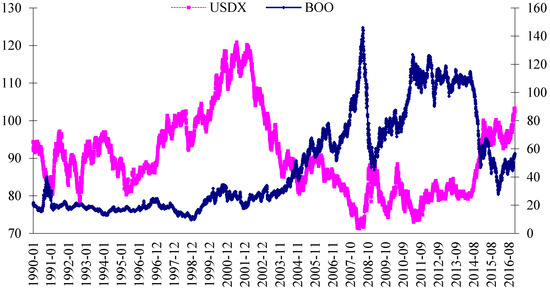
Figure 1.
Movement of Brent crude oil prices and the US dollar index. Source: Wind Info, left axis for US dollar index, and the right axis for Brent crude oil price.
2.2. DCC–GARCH Method
Engel’s (2002) DCC-GARCH Model is widely used to analyze the relationship among different markets as it can calculate dynamic correlation effectively, and we use this model to judge the correlation between oil price and dollar index at different times.
Defining and as oil yield and dollar index yield separately. Set the equation of two assets’ average yield as
In Equation (1), stands for the yield mean vector of oil and dollar index. Set
In Equation (2), stands for the information set of (t − 1) period that is the new interest of return on i (i = 1, 2) asset obey multivariate normal distribution with mean as 0 and covariance matrix as Ht.
stands as 2 × 2 time-varying correlation matrix, stands as 2 × 2 diagonal matrix of conditional standard deviation of GARCH Model. Then,
Engel (2002) uses a two-stage method to estimate, by estimating the univariate GARCH equation in the first stage and obtains the conditional standard deviation. Then in the second stage, apply to get standardized residuals in order to calculate conditional correlation coefficient.
Set , , then the Dynamic correlation structure equation is
stands as 2 × 2 time-varying covariance matrix of , stands as unconditional covariance matrix of . and are DCC coefficients, and . As the corner of is not necessarily 1, correlation Matrix is got in the process of standardization.
In Equation (7), , and the element within is , , while key element is , which reflect the conditional correlation of two asset returns.
Quasi-maximum likelihood method is used as estimation method, and the log-likelihood values is
2.3. Empirical Results
We firstly take unit root and heteroskedasticity test on each yield before applying DCC-GARCH model. According to the test’s result, the yields of all variables passed the unit root test, and ARCH-LM test values are significant at 1% level of confidence during 1, 6, 10, and 20 periods respectively, while ARCH-LM test is not significant when applying the GARCH Model, which verifies the suitability of GARCH Model. Due to space limitation, the exact results are omitted.
Table 2 gives DCC-GARCH empirical results. All GARCH term coefficients are significant at the 1% level, , are close to 1, indicating that the conditional variance with high sustainability. DCC parameters and are at the 1% level significantly, and is close to 1, indicating that the dynamic conditional correlation is a mean reverting.
Table 2.
DCC estimation results.
Figure 2 shows the movement of dynamic condition correlation between Brent oil and US Dollar index, and the correlation coefficient is time-varying. Prior to 2002, the DCC coefficient fluctuated around zero, and the fluctuation range was concentrated in [−0.1, 0.1] range. This describes that within this period, the correlation is relatively low. From 2002, a negative relationship has been established, DCC coefficient dropped from 0 to around −0.15 in 2002–2004, and maintained at about −0.20 until July 2008. There was a significant decline since August, 2008, which dropped to below −0.4 by 2009, and fluctuated between [−0.30, −0.45] before June 2013. After June 2013, the correlation coefficient increased sharply and tended to zero, and the negative relationship weakened significantly. Overall, since 1990, the relationship between oil and the dollar is time-varying, experiencing a “very weak correlation—negative correlation—enhanced negative correlation—weakening negative correlation” process.
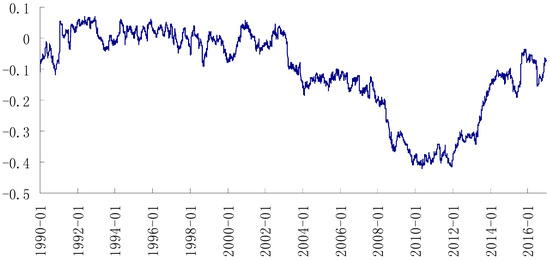
Figure 2.
The dynamic conditional correlation between Brent oil price and US dollar index.
3. Hypothesis and Explanation of ‘Key Mediating Factors’
Our empirical results further confirm that even if the sample period is extended to the period after financial crisis, the relationship between crude oil prices and the dollar is time-varying, which is consistent with previous literatures (Wu et al. 2012; Reboredo et al. 2014; Coudert and Mignon 2016). However, since the previous studies did not provide adequate explanations to why the correlation is time-varying, this paper proposes a hypothesis of ‘key mediating factors’. We believe that: (1) although the price of crude oil and the dollar are influenced by different factors, such as monetary policy of United States and the EU (Anzuini et al. 2012; Ratti and Vespignani 2016), the global overall demand (Kilian 2009), OPEC and non-OPEC oil production (Demirer and Kutan 2010; Golombeka et al. 2018), the inventory of crude oil and petroleum products (Bu 2014; Kilian and Lee 2014), price of alternative products such as shale oil (Killian 2016; Behar and Ritz 2017), geopolitical events that influence the price of crude oil (Martina et al. 2011; Karali and Ramirez 2014; Chen et al. 2016), financial market or investor sentiment (Tang and Wei 2012; Qadan and Nama 2018), in a certain period, there exist a ‘key mediating factor’ that has a significant impact on both US dollar exchange rate and crude oil price simultaneously, and in the opposite direction, making the two demonstrate a negative relationship. As the impact of the ‘key mediating factor’ is time-varying, leading the correlation between the two strong or weak in different periods; (2) key mediating factors in different periods are not the same; (3) in some period, there is no such key mediating factor, in such a case, the fluctuation of the two assets price is mainly driven by individual factors, resulting in a weak correlation. The specific mechanism is shown in Figure 3.
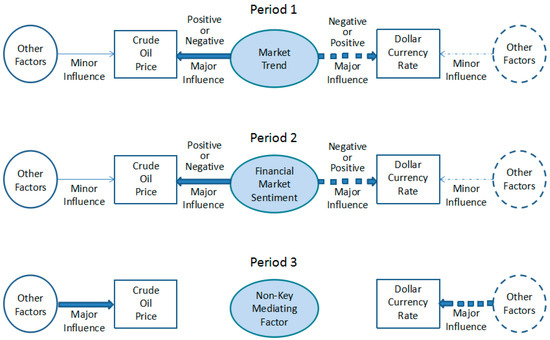
Figure 3.
Mechanism diagram of ‘key mediating factors’ hypothesis.
According to history of financial market in the 1990s, we believe that there are two factors that have served as the key mediating factor since 2002, one is market trend and another is financial market sentiment. While in the period before 2002 and after 2013, there is a lack of corresponding ‘key mediating factor’.
3.1. Market Trend
Asset price always show certain trend characteristics in some period, which will affect investors’ expectations, and then affect the relationship between different assets’ price. We argue that the important reason for negative correlation between US dollar and crude oil from 2002 to 2008 financial crisis is that, dollar and oil prices show a clear opposite trend during this period. Specifically, the dollar underwent a long-term downward trend, while commodities (including crude oil) experienced a ‘super cycle’.
As early as 1999, before the official circulation of euro within the EU Members, many economists have already begun to discuss the possible impact of euro on the international status of the dollar and its value. As a representative view, Richard and Rey (1998) believe that the euro’s emergence will increase the depth of European financial markets, reduce transaction costs, improve the attractiveness of euro assets, and increase the proportion of euro use in trade and reserve assets. Thus, the dollar’s international status will be impacted, and dollar value will fall. After 1 January 2002, the market recognition of the international status of euro has been further improved. Euro continuously appreciated against dollar, not only individual investors took a positive view of euro, many central banks such as bank of Japan and the Federal Reserve also use euro to replace dollar to achieve foreign reserves diversification. Although euro came through short-term depreciation against dollar, the euro continued appreciating until the 2008 financial crisis and its international status rose continually. Since euro has largest weight (57.6%) in dollar index calculations, dollar depreciation trend against the euro also brought a trend decline in dollar index.
Long-term downward dollar index corresponds to persistent rise of commodities, including crude oil. Many studies have shown that the reason of oil’s ‘super cycle’ is multiple, including the increment in global demand represented by emerging markets, global loose monetary policy, supply control, and financial speculation (Büyükşahin and Harris 2011; Cifarelli and Paladino 2010; Fattouh and Scaramozzino 2011; Erten and Ocampo 2012). The increase of oil prices and other commodity prices let market participants form asustained rise expectation. Fattouh and Scaramozzino (2011) pointed out that most market participants believed that long-run equilibrium price of oil was between $20 and $22 before oil prices start to rise at 2003, but then many participants began to think oil’s long-run equilibrium price will continue to upward. In fact, the market was flooded with all kinds of predictions and reports about rising oil prices, such as Goldman Sachs advocated a ‘super rise’ theory before the financial crisis, which suggests that crude oil price will continue to rise substantially as supply of crude oil is limited and demand for oil in non-OECD countries will continue to grow. Until 6 May 2008, Goldman Sachs reports still claimed that WTI crude oil prices could rise to $200 a barrel in next two years, and the ‘super rise’ cycle would continue. The expectation reversed suddenly after the financial crisis, for example, Merrill Lynch forecasted that oil prices could fall to $25 a barrel in 2009 if the impact of the economic recession in United States, Europe, and Japan spread to China. Goldman Sachs also pointed out that the oil price in the first quarter of 2009 would fall to $30 a barrel, and the annual average price would fall to $45 a barrel in a research report from December 2008.
Erten and Ocampo (2012) argue that the rise in commodity prices makes investors believe financial trading on commodities has become an important way to hedge in portfolio. When the market has opposite expectations about the trend of two assets’ price, this will lead investors to form a hedge strategy in financial markets. They will take a long position in one market and a short position in another, leading to a negative relationship between two assets. Especially once the market believes that this negative relationship becomes a law, participants will reinforce hedge strategy. This explains why after 2002, the relationship between the dollar and oil is negative, even if oil or dollar fluctuate in the reverse direction, the negative relationship still remain. While after the 2008 financial crisis, market expectations about the dollar and oil price trends reversed, although this reversal was caused by market panic, the hedge strategy was still useful by inertia, which further reinforced the negative relationship.
3.2. Financial Market Sentiment
After the outbreak of the financial crisis in 2008, market sentiment has become a key factor affecting the dollar exchange rate and oil prices. Many scholars noticed that the panic in financial markets has a direct impact on dollar exchange rate, particularly in turbulent time, he US dollar is considered a ‘safe haven’ currency. Cairns et al. (2007) believe that due to the dollar’s own international status and its advantage on global mobility and acceptability, many foreign investors hold the dollar as a safe asset, especially compared with currencies of developing and emerging countries. When market is in turmoil, the stability of earnings is significantly more important. Ranaldo and Söderlind (2007) note that increased risk, the decline of stock market and the ‘safe haven’ currency’s appreciation are directly related. McCauley and McGuire (2009) has a detailed analysis on how financial market volatility and the risk appetite’s decline lead all types of investors to buy dollar and dollar assets (particularly U.S. Treasury bonds) in the initial period of financial crisis, and results in substantial appreciation of the dollar. These studies have shown that global risk appetite and financial market volatility will directly affect US dollar exchange rate.
We take the VIX index as a measure to financial market panic, and market panic has already started to rise since August 2007 and kept rising rapidly after the Lehman Brothers bankruptcy in August 2008. Supported by government bailout, Fed’s QE policy, FX swap line among central banks, the market panic eased, but the European debt crisis still triggered market anxiety. Especially in April 2010 and August 2011, Greece, Spain, Portugal, Italy, and other European countries got in trouble in sovereign debt default. However, under the help of European Central Bank and the IMF, European debt crisis has moderated and VIX index also declined. Figure 4 show that there is a significant positive correlation between VIX and dollar index.

Figure 4.
Dollar index, Brent crude oil and VIX index. Note: Left axis is dollar index, right axis is Brent crude and the VIX.
In contrast with the dollar, relationship between VIX and oil prices is negative significantly. When the market panics rose, the oil prices fell; and when the market panics eased, the oil prices rose. This is mainly due to two reasons: first, after the financial crisis, the rising or falling of market panics reflects the pessimistic and optimistic sentiment of market towards future macro-economy. Future macroeconomic deterioration or improvement will reduce or increase oil demand, leading to a decline or rise in crude oil price; second, after 2000, the financialization of commodity markets (including crude oil) grows fast. The price of oil and other commodities are mainly determined by financial markets, especially by futures markets (Tang and Wei 2012; Cheng and Wei 2013), financial investment and speculation has become an important factor in oil prices. Market panic will lead investors to short oil assets and invest in safe assets. When the market calms and investors’ risk appetite strengthens, market investors tend to sell safe assets and buy oil assets, leading oil prices to rise. These two forces combined together, making a negative correlation between the oil price and VIX index. Furthermore, Figure 5 shows the dynamic correlation coefficients between the VIX index calculated by the above DCC-GARCH method and the US dollar index and crude oil price respectively.
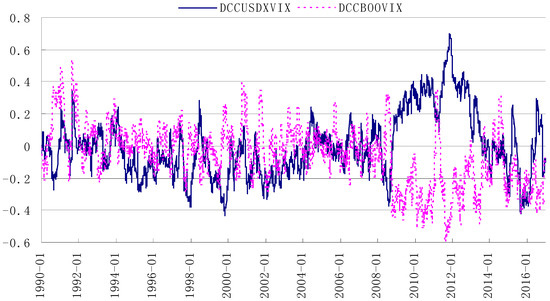
Figure 5.
The DCC coefficients between VIX with dollar index and Brent crude oil.
We can see that after the 2008 financial crisis, the DCC coefficient of dollar index and crude oil price with VIX is positive and negative respectively, and the value increased significantly until 2013, when the correlation comes to zero. This means that VIX index became the ‘key mediating variable’ after financial crisis.
Before the financial crisis, the overall relationship between the dollar index and the VIX index is not significant, and only when the VIX index fluctuated sharply, there was a negative correlation, which was obviously different with post-financial crisis period (Figure 5). Before the financial crisis, VIX fluctuated significantly in the following four periods: 1990–1991 years; October to December 1997; the second half of 2001 to the first half of 2003; and the second half of 2007 to the first half of 2008. Except for the second half of 2007 to the first half of 2008, DCC coefficients of the other three periods are negative, and DCC coefficients tend to zero when the VIX index calmed down. In the second half of 2007 to the first half of 2008, there is neither a significant positive nor a negative relationship. This paper argues that this is mainly due to difference of reasons which led to VIX change. In 1990 to 1991, the reason of market volatility was the United States’ attack on Iraq; from October 1997 to December due to the Asian financial crisis; the second half of 1998 was due to the United States long-term asset management company (LTCM) crisis; and from the second half of 2001 to the first half of 2003 was due to the United States ‘9/11’ terrorist attacks and bankruptcy of Enron, WorldCom, and other companies. As the market panic mainly stems from the US’s domestic problems, participants in the foreign exchange market are more likely to regard the rise of VIX index as a ‘local’ problem in the United States, leading dollar fell in FX market. With the VIX index declined, investors considered the United States’ ‘local’ problems to have been alleviated, they expected that the dollar would appreciate in the short term, and caused the dollar’s exchange rate to rise. Since there is no global level financial or economic crisis before 2008, VIX index reflects ‘local’ features in US financial markets mainly. The US dollar’s ‘safe haven’ feature does not appear and this results in weak correlation between dollar and VIX index, and even shows a short-term negative relationship in some periods.
The outbreak of the financial crisis and subsequent debt crisis in Europe made VIX index not only reflect the problems of United States financial markets, but also to a large extent reflect investors’ expectation of global financial market stability. Figure 6 verifies that the fluctuation of VIX was mainly triggered by some non-US incidents after a global financial crisis, such as the European Sovereign Debt Crisis and stock market crash and sudden depreciation of RMB in China. The rise or fall of the VIX index stimulates the risk aversion or risk-taking preference of the market participants, which leads to a significant positive relationship between VIX index and USD index. When the crisis gradually passes away, the overall market sentiment calms down again, and the relationship between the two tends to zero again.
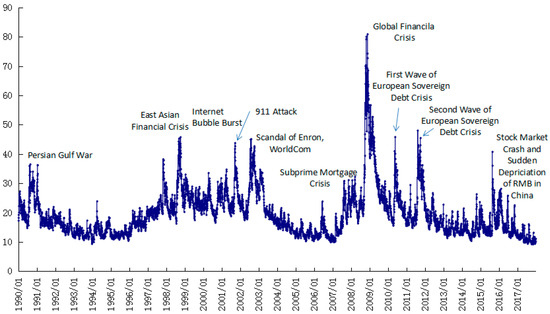
Figure 6.
The evolution of VIX and corresponding incidents.
Similarly, before the financial crisis, the correlation between oil prices and the VIX index is also not significant (Figure 5), except for the time period 1990 to1991, which shows a significant positive correlation. In other periods, even in some period of time with VIX volatility, the relationship between the two is also not significant. The root cause of the positive relationship during 1990 to 1991 was that at that time important Middle East oil-producing countries, such as Iraq and Kuwait, were under war. On the one hand, the market is worried about the impact of oil supply; on the other hand, the United States’ large-scale military action triggered panic in the financial market, making people take a short position on the dollar, resulting in a negative relationship between them. Similarly, with the financial crisis passed away, VIX index gradually becomes stable, and the correlation once again tends to zero.
It is particularly important to note that, from July 2014, the US dollar index and oil prices showed an opposite trend, with oil prices falling sharply, and the US dollar index continuing to rise, seemingly showing a negative correlation. However, in fact, the dynamic correlation coefficient of the two did not tend to be negative, but tend to be zero. It shows that the appreciation of the US dollar and the fall in the international oil prices are not completely corresponding, and the opposite of the overall trend is only a coincidence or short-term phenomenon. This paper argues that this is also in line with the theory of ‘key mediating variables’. The decline in international oil prices is mainly affected by Saudi Arabia’s refusal to reduce oil production, geopolitical tensions between Russia, Europe, and the United States, slowing economic growth in China, and increasing shale gas oil production. The rise of the US dollar index is mainly due to the fact that recovery of US economy makes the Fed exit QE, while Bank of Japan and European Central Bank implement a new round of QE. Therefore, there is no common ‘key mediating factor’. In addition, due to crude oil prices falling suddenly, the market has not formed a long-term, steady downward trend expectation; therefore, there is obvious hedge strategy in financial market. The fluctuation of crude oil and US dollar is affected by their respective factors, lacking the common ‘key mediating factor’, which leads to a weak correlation.
It can be said that the market expectation and the hedge strategy are the mediating factors of the negative relationship in the period when the market trends are obvious. In the period of financial crisis, financial market sentiment is the main mediating factor of the negative relationship. While, during non-crisis periods and when market trends are not obvious, there is no key mediating factor that simultaneously impact two assets, making the correlation very weak.
4. Conclusions
By employing the DCC-GARCH model, we find that after 1990, the dynamic relationship between oil prices and the dollar index is time-varying, and experienced “very weak—negative relationship—negative relationship enhancement—weak” process. Before 2002, the correlation was weak; since 2002, a negative relationship was established and continued to strengthen; after the 2008 financial crisis, the negative relationship further increased and maintained at a high level until 2013; after 2013, the correlation was weakened again. The main cause of this time-varying relationship is whether intermediary variables exist or not, which has a major impact on the two market volatility at the same time. Specifically, from 2002 to 2008, oil prices and the dollar index respectively showed a significant rise and decline trend, triggered a market hedge strategy; after the breakout of the global financial crisis, financial market sentiment has become intermediary of negative relationship as crude oil and US dollar were seen as risky and risk-aversion asset separately; and the lack of a common key mediating factors led to a weak correlation in other periods.
As this article mainly focuses on the relationship between oil prices and the US dollar index and main factors behind this relationship, future studies need more refined research to deepen the understanding of the relationship between the two. For example: the interdependence and causality between the dollar and oil prices within a certain period, how ‘index transaction’ specifically affects oil price fluctuations and interacts with the foreign exchange market, how monetary policy (especially Fed’s monetary policy) affects US dollar exchange rate and oil prices, etc. These are possible future research directions.
Author Contributions
This paper is together accomplished by J.L., Y.S. and X.X.; X.X. conceived the idea and designed the structure of the paper; Y.S. collected and analyzed the data and technical details; J.L. wrote the draft of Section 1 and Section 3, while X.X. wrote Section 2 and Section 4; J.L. made a final revision of the whole paper.
Funding
This research received no external.
Conflicts of Interest
The authors declare no conflict of interest.
References
- Anzuini, Alessio, Marco J. Lombardi, and Patrizio Pagano. 2012. The Impact of Monetary Policy Shocks on Commodity Prices. Bank of Italy Working Paper, No. 851. Roma, Italy. [Google Scholar]
- Behar, Alberto, and Robert A. Ritz. 2017. OPEC vs. US shale: Analyzing the shift to a market-share strategy. Energy Economics 63: 185–98. [Google Scholar] [CrossRef]
- Bu, Hui. 2014. Effect of inventory announcements on crude oil price volatility. Energy Economics 46: 485–94. [Google Scholar] [CrossRef]
- Büyükşahin, Bahattin, and Jeffrey H. Harris. 2011. Do Speculators Drive Crude Oil Futures? Energy Journal 32: 167–202. [Google Scholar] [CrossRef]
- Cairns, John, Corrinne Ho, and Robert N. McCauley. 2007. Exchange Rates and Global Volatility: Implications for Asia-Pacific Currencies. BIS Quarterly Review, 41–52. [Google Scholar]
- Chen, Hao, Hua Liao, Bao-Jun Tang, and Yi-Ming Wei. 2016. Impacts of OPEC’s political risk on the international crude oil prices: An empirical analysis based on the SVAR models. Energy Economics 57: 42–49. [Google Scholar] [CrossRef]
- Cheng, Kevin C. 2008. Dollar depreciation and commodity prices. In World Economic Outlook (April 2008). Washington: IMF, pp. 48–50. [Google Scholar]
- Cheng, Ing Haw, and Xiong Wei. 2013. The Financialization of Commodity Markets. NBER Working Paper No. 19642. Cambridge, MA, USA: NBER. [Google Scholar]
- Cifarelli, Giulio, and Giovanna Paladino. 2010. Oil price dynamics and speculation: A multivariate financial approach. Energy Economics 32: 363–72. [Google Scholar] [CrossRef]
- Coudert, Virginie, and Valérie Mignon. 2016. Reassessing the empirical relationship between the oil price and the dollar. Energy Policy 95: 147–57. [Google Scholar] [CrossRef]
- Demirer, Rıza, and Ali M. Kutan. 2010. The behavior of crude oil spot and futures prices around OPEC and SPR announcements: An event study perspective. Energy Economics 32: 1467–76. [Google Scholar] [CrossRef]
- Engle, Robert F. 2002. Dynamic Conditional Correlation—A Simple Class of Multivariate GARCH Models. Journal of Business and Economic Statistics 20: 339–50. [Google Scholar] [CrossRef]
- Erten, Bilge, and Jose Antonio Ocampo. 2012. Super-cycles of commodity prices since the mid-nineteenth century. DESA Working Paper, No. 110. New York, NY, USA: United Nations Department of Economic and Social Affairs. [Google Scholar]
- Fattouh, Bassam, and Pasquale Scaramozzino. 2011. Uncertainty, Expectations, and Fundamentals: Whatever Happened to Long-Term Oil Prices? Oxford Review of Economic Policy 27: 186–206. [Google Scholar] [CrossRef]
- Golombeka, Rolf, Alfonso A. Irarrazabal, and Lin Ma. 2018. OPEC’s market power: An empirical dominant firm model for the oil market. Energy Economics 70: 98–115. [Google Scholar] [CrossRef]
- Jawadi, Fredj, Waël Louhichi, Hachmi Ben Ameur, and Abdoulkarim Idi Cheffou. 2016. On oil-US exchange rate volatility relationships: An intraday analysis. Economic Modelling 59: 329–34. [Google Scholar] [CrossRef]
- Karali, Berna, and Octavio A. Ramirez. 2014. Macro determinants of volatility and volatility spillover in energy markets. Energy Economics 46: 413–421. [Google Scholar] [CrossRef]
- Kaufmann, Robert, and Ben Ullman. 2009. Oil prices, speculation, and fundamentals: Interpreting causal relations among spot and futures prices. Energy Economics 31: 550–58. [Google Scholar] [CrossRef]
- Kilian, Lutz. 2009. Not All Oil Price Shocks Are Alike: Disentangling Demand and Supply Shocks in the Crude Oil Market. American Economic Review 99: 1053–69. [Google Scholar] [CrossRef]
- Kilian, Lutz, and Thomas K. Lee. 2014. Quantifying the speculative component in the real price of oil: The role of global oil inventories. Journal of International Money and Finance 42: 71–87. [Google Scholar] [CrossRef]
- Killian, Lutz. 2016. The Impact of the Shale Oil Revolution on U.S. Oil and Gasoline Prices. Review of Environmental Economics and Policy 10: 185–205. [Google Scholar] [CrossRef]
- Krichene, Noureddine. 2005. A Simultaneous Equations Model for World Crude Oil and Natural Gas Markets. IMF Working Paper WP/05/32. Washington, DC, USA: IMF. [Google Scholar]
- Lizardo, Radhamés A., and André V. Mollick. 2010. Oil price fluctuations and U.S. dollar exchange rates. Energy Economics 32: 399–408. [Google Scholar] [CrossRef]
- Martina, Esteban, Eduardo Rodriguez, Rafael Escarela-Perez, and Jose Alvarez-Ramirez. 2011. Multiscale entropy analysis of crude oil price dynamics. Energy Economics 33: 936–47. [Google Scholar] [CrossRef]
- McCauley, Robert, and Peter McGuire. 2009. Dollar Appreciation in 2008: Safe Haven, Carry Trades, Dollar Shortage and Overhedging. BIS Quarterly Review, 85–93. [Google Scholar]
- McLeod, Roger C. D., and Andre Yone Haughton. 2018. The value of the US dollar and its impact on oil prices: Evidence from a non-linear asymmetric cointegration approach. Energy Economics 70: 61–69. [Google Scholar] [CrossRef]
- Mensah, Lord, Pat Obi, and Godfred Bokpin. 2017. Cointegration test of oil price and US dollar exchange rates for some oil dependent economies. Research in International Business and Finance 42: 304–11. [Google Scholar] [CrossRef]
- Qadan, Mahmoud, and Hazar Nama. 2018. Investor sentiment and the price of oil. Energy Economics 69: 42–58. [Google Scholar] [CrossRef]
- Ranaldo, Angelo, and Paul Söderlind. 2007. Safe Haven Currencies. Swiss National Bank Working Papers No. 17. Zurich, Switzerland. [Google Scholar]
- Ratti, Ronald A., and Joaquin L. Vespignani. 2016. Oil prices and global factor macroeconomic variables. Energy Economics 59: 198–212. [Google Scholar] [CrossRef]
- Reboredo, Juan Carlos, Miguel A. Rivera-Castro, and Gilney F. Zebende. 2014. Oil and US dollar exchange rate dependence: A detrended cross-correlation approach. Energy Economics 42: 132–39. [Google Scholar] [CrossRef]
- Richard, Portes, and Helene Rey. 1998. Euro vs. dollar, Will the euro replace the dollar as the world currency? Economic Policy April: 306–42. [Google Scholar]
- Tang, Ke, and Xiong Wei. 2012. Index Investment and the Financialization of Commodities. Financial Analysts Journal 68: 54–74. [Google Scholar] [CrossRef]
- Wu, Chih-Chiang, Huimin Chung, and Yu-Hsien Chang. 2012. The economic value of co-movement between oil price and exchange rate using copula-based GARCH models. Energy Economics 34: 270–82. [Google Scholar] [CrossRef]
- Yousefi, Ayoub, and Tony S. Wirjanto. 2004. The empirical role of the exchange rate on the crude-oil price formation. Energy Economics 26: 783–99. [Google Scholar] [CrossRef]
- Zhang, Yue-Jun, Ying Fan, Hsien-Tang Tsai, and Yi-Ming Wei. 2008. Spillover effect of US dollar exchange rate on oil prices. Journal of Policy Modeling 30: 973–91. [Google Scholar] [CrossRef]
| 1 | Wind Information Co., Ltd (Wind Info) is a leading integrated service provider of financial data, information, and software. It has built up a substantial, highly-accurate, first-class financial database, which includes stocks, funds, bonds, FX, insurance, futures, derivatives, commodities, and macroeconomic and financial news. The company’s data are frequently quoted by Chinese and English media, in research reports, and in academic theses. More details about Wind Info, see website: http://www.wind.com.cn/en/aboutus.html. |
© 2018 by the authors. Licensee MDPI, Basel, Switzerland. This article is an open access article distributed under the terms and conditions of the Creative Commons Attribution (CC BY) license (http://creativecommons.org/licenses/by/4.0/).