Article

Do Firm’s Organisational Slacks Influence the Relationship between Corporate Lobbying and Corporate Financial Performance? More Is Not Always Better

Faculty of Economics and Management, Universiti Putra Malaysia; Selangor 43400, Malaysia
Int. J. Financial Stud. 2019, 7(1), 2; https://doi.org/10.3390/ijfs7010002
Submission received: 20 August 2018 / Revised: 14 December 2018 / Accepted: 19 December 2018 / Published: 28 December 2018
(This article belongs to the Special Issue Sustainability and Corporate Financial Environment)

Abstract

:
A political involvement in any organisation has often proved to be profitable for such firms that are seeking support and favourable regulatory conditions. Though many studies have investigated the effect of the corporate lobbying activities on the organisations, no clear results have been achieved. In this study, we have investigated the lobbying expenditure of some of the most famous United States (US)-based companies, which support the U.S. government during 2007–2016. Primarily, we tested the relationship between the corporate lobbying and the Corporate Financial Performance (CFP), with the help of a dynamic panel data analysis, which is based on the System Generalised Methods of the Moment (SYS-GMM). The results of this study indicated that the corporate lobbying did not increase the probability of gaining more support from the government in comparison to the firms that did not use any lobbying techniques. Furthermore, the findings showed that corporate lobbying is a component of the zero-sum political agenda that cannot be accurately evaluated and does not contribute towards the improvement of the CFP. This study introduced the important component of organisational slack and noted that the corporate lobbying could significantly destroy the CFP if the organisational slack was high.

1. Introduction

Lobbying, of any type, is always used for acquiring some political advantage in the United States (US). Even the Congressional historical records have stated that the American Revolutionary veteran groups lobbied the Congress during the 1790s, which was much before any primary lobbying-related regulations were implemented in 1876 (Byrd 1991). Currently, the growth and the scale of the lobbying practices are very substantial. In the USA, the political campaign costs have increased significantly. The report submitted by The Centre for Responsive Politics (https://www.opensecrets.org/lobby/) stated that the lobbying costs that were spent by the various organisations in 2016 were >$3.2 billion, where the Top-5 firms were responsible for 40% of the overall costs. Amongst the Top-5 companies, Gump et al. spent ≥$36 million, followed by the Podesta Group ($24 million), Van Scoyoc Associates ($21 million), Holland and Knight ($19 million), and the Squire Patton Boggs ($18 million). Many organisations partake in lobbying. In comparison to the alternative techniques of seeking a political influence, like the contributions made by the corporate Political Action Committees (PACs), many organisations used the lobbying activities to acquire a political advantage (Chen et al. 2015). The corporate lobbying involves the various political activities that are employed by the corporations to influence the legislators at different governmental levels. At the federal level, the corporate lobbying includes any form of communication which is made on the behalf of the client to the various members of the Congress, like the staffers, White House staff, The President, or other high-level employees regarding the modification, formulation, or the adoption of any legislative decision (The Centre for Public Integrity).1 This was controlled by the Lobbying Disclosure Act of 1995.
Many economists have stated that the firms that lobbied for political connections could acquire many economic benefits (Roberts 1990; Stratmann 2005; Fisman 2001; Jayachandran 2006; Faccio and Parsley 2009; Hochberg et al. 2009; Igan et al. 2009; Richter et al. 2009; Cooper et al. 2010; Yu and Yu 2011; Hill et al. 2013). Also, Richter et al. (2009) suggested that an important factor that led to corporate lobbying included the desire to acquire subsidies for the R and D sector, which was considered to be a very risky investment when compared to the capital investment. Earlier studies indicated that engaging in any political process could act as insurance against the economic crisis. Faccio et al. (2006) noted that the firms that had a political connection in 35 countries were very likely to derive government bailouts during economic distress as compared to the non-connected organisations. The rationale behind this observation was that, since the government actions and regulations directly affected the company’s business condition, political lobbying could help the companies to derive important information regarding the regulatory agenda, acquire political information for altering their business decisions in time, and encourage (or discourage) the regulatory decisions that could be beneficial (or detrimental) to the company, if possible. Due to regular communication, this information helps the government make better decisions. However, corporate lobbying acts as an instrument by the organisations for interfering in the policy formation process, which directly affects the lobbying interests. For instance, the various companies involved in the controversies, scandals, or lawsuits (like Phillip Morris, WorldCom, Enron, and Halliburton) had spent a lot of money on lobbying (Chen et al. 2015).
It is very surprising that the various empirical studies ignored the effect of corporate lobbying on the financial performance of the organisation. Lobbying was seen to be the biggest type of political involvement in corporate America. With regards to its financial effect, corporate lobbying was 20-times higher than the PAC or the soft-money contribution made every election cycle. Furthermore, many corporations, business-related groups, or trade associations are responsible for the huge amount of money spent on lobbying. Many individual organisations also spend a lot of money every year. Additionally, many researchers, investigating the corporate political activities, have investigated the different types of expenditures by the corporate-affiliated PACs. This also involved the problem of limited variation and a narrow political activity, i.e., sponsorship of the PACs (Andres 1985; Masters and Keim 1985; Grier and Munger 1991; Grier et al. 1994; Humphries 1991; McKeown 1994; Mitchell et al. 1997). In their study, Milyo et al. (2000) described the “inordinate attention to the PACs”, by stating that the data regarding the contribution was available and the PACs could be linked easily to their industrial or corporate sponsors. Furthermore, Sabato (Morris and Sabato 1984) noted that the PACs are formed by the groups that are not capable of establishing a governmental affair or a legislative lobbying department. On the other hand, many companies have a good lobbying division and no PAC. Brasher and Lowery (2006) warned that this type of investigation was narrow and suggested that the empirical studies regarding the PAC behaviour could not be generalised, but they should have focused more on corporate lobbying. Ansolabehere et al. (2003) observed that the major distinction was that since the PAC finances are because of individual contributions and not by corporations, the PAC expenditure cannot be considered as ‘corporate’. However, corporate lobbying is considered to be a corporate expense, which helps in improving the firm’s performance. Hence, many corporations indulge in corporate lobbying. Similar to the alternative techniques of acquiring political influence, like the PAC contribution, lobbying is another popular method that is used by the corporations for exercising the political strategies (Chen et al. 2015). Based on these parameters, in this study, we have focused on the effect of the corporate lobbying on the financial performance of the corporations.
Here, we have also determined the dominating effect amongst the above-mentioned countervailing forces, and the circumstances surrounding it. Firstly, we have analysed the corporate lobbying expenses and compared them to the PAC contributions. We attempted to determine the causal effects of the corporate lobbying on the Corporate Financial Performance (CFP). We analysed all of the firms from which they could obtain the financial data, including many firms that were not very politically active. This helped us to derive the benefits from the data’s panel structure, which helped us further control the various time-invariant and firm-specific variables after we had compared the firms that lobbied and those that did not. A few researchers (Nichols 2007; Angrist and Pischke 2010) stated that this technique was used for addressing the bias that occurred because of unobserved confounders, which were commonly seen in the studies that rely solely on the observational data. This study also used another identification strategy, wherein another moderating variable was introduced for examining the effect of the organisation’s slack on the association between the CFP and corporate lobbying. Here, we evaluated the impact of the lobbying activities on the CFP, while controlling the inherent endogeneity by using many alternative methods.
We have also postulated that the total costs (or benefits) of the corporate lobbying varied with regards to the organisational slack. The slack resources included the spare assets and the capabilities of the company, which could be reclaimable for the re-deployment. It also includes the hidden and underutilised spare resources that can be reused and recaptured for many tasks. Though several governmental policies and regulations affect the firms, the marginal advantage derived due to the lobbying activities can be determined by the different factors that affect the demand and supply of the firm’s products or services. Hence, every lobbying activity shows a different effect on the CFP. Very few studies used this approach. In this study, we examined the association between the corporate lobbying activities and the CFP based on organisational slack.
We used the data from various Fortune magazines’ American Most Admired Corporation (AMAC) firms for a 10-year period (2007–2016) and evaluated whether the corporate lobbying was advantageous to the shareholders. We also determined if the organisational slack controlled the association between the CFP and the corporate lobbying. This study showed no significant relationship between the CFP and the corporate lobbying activities. Furthermore, this neutral association could also be partially due to the fact that the lobbying expenditure by the company was unable to provide a few tangible benefits or helped the firm acquire additional governmental contracts and improved the probability of getting the bill passed in the Congress. This indicated that agency expenditure (i.e., an inefficient use of the corporate funds) for the lobbying activities dominated the strategic benefits of the lobbying. Secondly, we also noted the positive relationship between the lobbying activities and the organisational financial slack on the CFP that firms’ organisational slack acts as a moderator of the impacts of corporate lobbying on performance; firms that are efficient in utilizing their available resources will be able to register better links between corporate lobbying and firm performance.
These findings showed significant implications. Firstly, the results indicated that the lobbying costs were higher than the benefits, thereby supporting the agency’s perspective in comparison to the stewardship viewpoint. Secondly, the results highlighted the endogenous and dynamic nature of the association between the CFP and the lobbying activities. These results suggested that the control of the endogeneity was important for investigating the effect of the various lobbying activities. Thirdly, we noted that the impact of the lobbying activities was heterogeneous for the firms and that the moderating variable of organisational slack could enhance the relationship between the CFP and the lobbying activities.
The remaining paper is organised in the following manner: Section 2 includes the literature review and the hypothesis development, whereas Section 3 discusses all the acquired data and the methodology used. Section 4 and Section 5 describes and analyses all of the empirical results, while the discussions and conclusions are presented in Section 6 and Section 7.

2. Literature Review and the Hypotheses Development

2.1. Literature Review

Many lobbying activities help in seeking protection against the foreign competition. In his study, Schuler (1996) has stated that the lobbying activities in the U.S. steel industry helped to shape the trade policy. Also, Gawande and Bandyopadhyay (2000) mentioned that the U.S. protection pattern was influenced by the lobbying expenditure and the lobbying competition, thus, the protection was ‘sold’. Lee and Baik (2010) made a similar argument where they stated that the companies that were engaged in the lobbying activities could buy trade protection against the foreign competition. Many academic institutions also engaged in lobbying activities. De Figueiredo and Silverman (2006) noted that, during particular circumstances, the academic institutions acquired an average return of $11–36 for every dollar that was spent for lobbying. Lastly, many firms (and/or the associated individuals) that contributed to the various political campaigns and acquired significant subsidies from the successful administration had to face several allegations (i.e., Solyndra incident). On the other hand, no conclusive empirical evidence is present, which shows the relationship between the lobbying activities and the CFP. Many studies have shown a negative/positive or neutral relationship between the lobbying activities and the CFP.

2.1.1. Positive Association

According to Chen et al. (2015) and Brown (2016), lobbying could positively affect the CFP, wherein the organisations engaging in the lobbying activities could derive better returns in comparison to the firms that did not. Hill et al. (2013)noted that the shareholders incorporated the lobbying activities pursued by the managers in the share prices of the company. Alexander et al. (2009) showed that the firms that lobbied for the American Jobs Creation Act (2004) acquired $11–$36 for every dollar that was spent for lobbying. De Figueiredo and Silverman (2006) provided an empirical evidence for this scenario, wherein a majority of the educational institutions did not receive any return for their corporate lobbying activities. Fisman (2001) used a novel event study-based approach for investigating the 1997 Indonesian financial crisis and estimating the effect of the political connections on the Indonesian firms. The researcher noted that the politically-connected companies could derive benefits due to their connections. Many studies have indicated that the political connections helped the companies to acquire additional benefits, like regulatory reforms (Stigler 1971), a better tax regime (De Soto 1989), and a preferential treatment by the various government-owned organisations (Backman 1999).

2.1.2. Negative Association

Many studies provided empirical evidence that supported this negative association. Furthermore, the political connections and lobbying activities also have many detrimental effects on the companies, especially during political turmoil. For instance, Gul (2006) noted that, after the occurrence of the Asian financial crisis, the politically connected companies in Malaysia had to pay a higher audit fee in comparison to their non-connected associates. The researcher stated that the Malaysian government could not financially support the politically-connected firms after this financial crisis. Aggarwal et al. (2012) observed that the companies which donated funds to the political candidates had to face many cash-flow issues, which showed long-term negative effects. The researchers also noted that these donating companies engage in a higher acquisition, which was characterised by a lower return in comparison to other acquisitions that were made by the non-donating companies. Hadani and Schuler (2013) also observed that the company’s political investments were negatively associated with the market value of the company and the returns on the sales. The researchers claimed that the personal managerial bias and imperatives, in addition to the firm-level profit-maximising objectives, drove the company’s political behaviour. Aggarwal et al. (2012) measured the political activities of the companies, but excluded the lobbying activities, whereas Hadani and Schuler (2013) combined all political activities, like the lobbying and the different PACs. The lobbying expenditure and the political donations are different forms of political investment with regards to their influence and scale of expenditure (Yu and Yu 2011; Aggarwal et al. 2012). Coates (2012) also observed a negative effect of the lobbying activities on the corporate value.

2.1.3. No Impact or a Mixed Outcome

Two studies did not observe any relationship between the CFP and the corporate lobbying. In one study, Ansolabehere et al. (2004) did not observe any benefit from the various campaign donations, whereas Hersch et al. (2008) stated that the lobbying activities did not generate any financial capital. Two studies determined multiple outcomes and noted a mixed outcome. Faccio et al. (2006) mentioned that the politically connected firms could pursue the bailout policies in their favour, but they showed a poor operational performance. Tu et al. (2013) observed that, although the connected firms had to a pay a lower premium than the other firms during the privatisation, they showed a lower stock and operating performance during the post-privatisation period.

2.2. Organisational Slack

The basic organisational slack definition presented by Bourgeois (1981) and which has been used by many other studies (Meyer 1982; Sharfman et al. 1988), stated that:
‘Slack includes the potential or actual resources which help any organisation successfully adapt to changes. It also provides a means for the organisations to adopt certain strategies to the external environments’.
(p. 30)
These resources comprise a surplus of inputs, such as labour and equipment, which are not functioning at maximum level due to unwise investments in technology know-hows that could have generated better profits and incomes (Meyer 1982; Tan 2003). The definition by Bourgeois (1981) indicates that companies may amass slack resources for future use in case of any environmental changes. Furthermore, these slack resources help organisations to waive short-term returns in support of longer-term profits by generating avenues for chasing current and future competitive prospects (Sharfman et al. 1988). This is because slack resources can be used in an elective fashion for determining competitive and market prospects, although some researchers consider these slack resources unnecessary (Dimick and Murray 1978). However, some organisational slack could be beneficial to the company, wherein a company can develop a financial cushion that can shield the company against any cash flow deficiency or unexpected losses (Rajagopalan and Spreitzer 1997).
Slack resources can help firms to implement strategies for improving efficiency and profitability and to prosper in the long run (Nystrom et al. 2002; Tan and Peng 2003; Adams and Lamont 2003; Bogetoft and Hougaard 2004), because such resources, although not optimally deployed, can provide the mechanisms for effective learning, thereby providing the potential for further enhancements of alignment skills (Levinthal and March 1993). Sharfman et al. (1988) point out that slack resources are especially important during turbulent times since slack resources can buffer the technical cores of corporations during such turbulence (Moreno et al. 2009). This is because slack resources offer organisations a surplus of time as well as the possibility of experimenting with these resources (Geppert 1996). Together, these studies support the notion of Bourgeois (1981), who states that slack represents resource cushions that can be used to counteract threats as well as develop opportunities.
The emerging concept of slack in financial resources was introduced in Barnard’s (Barnard 1938) ‘inducement-contribution ratio’ scheme. Nevertheless, the model failed to secure recognition, until Cyert and March (1963) applied the financial resource slack concept to management models and practices. Organisational slack was utilised to describe the strategic and political behaviours of top management teams (Bourgeois and Singh 1983), their risk-taking behaviours (Bromiley 1991; Palmer and Wiseman 1999; Singh 1986; Wiseman and Bromiley 1996), environmental initiatives (Bowen 2002), and the performances of firms (Greenley and Oktemgil 1998). Discretionary organisational resources enable firms to develop slack (Seifert et al. 2004) and organise uncommitted resources into outputs (Nohria and Gulati 1996). For an organisation with various slack resources (i.e., excess labour and raw material, excessive work-in-process inventories, surplus productive or plant capacity), the most discretionary of slack resource types would be the excess or slack in financial resources (Austin et al. 1996). Slack in financial resources is defined in this research as utilisable financial capital that could be diverted or else allocated by an organisation in pursuit of its goals (George 2005). Such capital is typically denoted by measures of the capital at hand (namely, net profits after optional expenses and taxes), which is normally treated as a key corporate monetary resource (Austin et al. 1996). The available literature on societal engagement contends that measures of profitability remain the strongest indicators of the “availability of resources for the potential funding of social and environmental investments” (Julian and Ofori-dankwa 2013, p. 1321). Nonetheless, there is a continuing argument on the ideal level of organisational slack, since some academics believe that a ‘surplus of slack’ is linked to a lack of competence (Wu and Tu 2007).
The idea of the organisational slack was based on the concept of the inducement-contribution ratio, which was initially proposed by Barnard (1938). Cyert and March (1963) were the first to apply this concept to the management-related theories and practices. Organisational slack can be defined as the resources that are acquired by an organisation and are not included in the necessary expenditure. On the other hand, some resources have to be used in an unrestricted manner. This also includes many techniques in which the energy and the resources are used for pursuing some organisational objectives that can be channelled into many other things. If the resources have to be considered as slack, then they must be easily visible to the company manager and should be deployable during need. However, other resources are more recoverable and visible, while some are not. Also, different slacks require a different level of flexibility and discretion. As the discretionary level of the resources increases, they are used in many scenarios and contingencies, and they also provide a broader range of tools that can be used by the managers (Sharfman et al. 1988). Conversely, the less discretionary resources are used as a protection in some scenarios, i.e., during rising demands or an excess capacity. Finally, organisational slack is a capital-based firm resource (i.e., human resource, physical, financial, and organisational), which is used by the firms for implementing strategies and improving the organisational efficiency and/or the effectiveness. It is also used as a mechanism for effective learning, which provides a potential for enhancing the alignment skills.
Many studies showed that the firms having higher organisational slacks could engage in some political activities (Schuler and Rehbein 1997) and derive the associated benefits (Hillman et al. 2004). Also, the slack resources were seen to significantly affect the corporate political activities, like lobbying. Furthermore, studies observed that the organisations were more probable to follow the legitimate practices if they had higher financial resources (Seifert et al. 2004). If the organisations aim to influence the different legislatures and lobby for acquiring legitimacy from the administration, then, the firms with a better performance and/or higher slack resources were very likely to mobilise the resources and use them for lobbying.
The organisational slack resources can be measured using a ratio of free cash flow (FCF) to revenue, for approximating the organisation’s liquidity (Griffin and Mahon 1997). Cash flow was considered to be more suitable to measure organisational slack as compared to accounting return in this study, since cash flow denotes the uncommitted money that is accessible for corporate lobbying and other discretionary activities. Numerous companies have profit but lack cash flow (George 2005). Here, this study converted the FCF value to its log value. This variable was generally skewed and it could violate the assumption of normality. This study used the DataStream database for determining the FCF value and the formula is as follows:
FCF = (net profit + interest expenses + non-cash expenses) − increase in the working capital − capital expenditure
Organisational slack = FCF/total of net sales

2.3. Hypotheses Development

2.3.1. Corporate Lobbying and the Firm Performance

According to the stewardship theory, corporate lobbying is an integral component of the organisational strategy. This theory also states that the corporate political activities must positively affect the company’s profits. Based on this theory, the lobbying expenditure has a higher Return on Investment (ROI). In their study, Alexander et al. (2009) mentioned that, under specific circumstances, lobbying generated a 22% ROI. Empirical evidence showed that firms, which conduct lobbying-related activities for achieving a specific goal, are generally successful. Many individuals or groups who are affected by the current or the pending governmental activities or legislations provide vital information to the government about the various lobbying activities. This information helps the government to make better and informed decisions. Some studies noted this relationship in other scenarios. Richter et al. (2009) observed that the lobbying was related with a low corporate tax rate in a majority of the publicly-traded companies. Lee and Baik (2010) noted that the disbursements provided by the U.S. government to the domestic firms in the anti-dumping petition were related to the lobbying activities. Bonardi et al. (2006) investigated some U.S. electric utilities and noted that the firm’s lobbying activities were related to the permitted rate of returns by the Public Utilities Commission (PUCs). According to Brown (2016), the lobbying activities were associated with a high Return on Assets (ROA), Return on Invested Capital (ROIC), and a Return on Equity (ROE) in some of the Fortune-500 firms. Hence, we proposed that:
Hypothesis 1.
Corporate lobbying has a positive effect on the CFP.

2.3.2. Corporate Lobbying, Organisational Slack, and CFP

In this study, we also investigated the effect of the organisational slack on the association between the CFP and the lobbying activities. As mentioned above, the slack resources are described as excessive resources that generate some organisational output (Nohria and Gulati 1996). The buffer argument stated that the presence of organisational slack is related to the increase in the corporate lobbying. The proponents of the slack theory argued that this encouraged the strategic behaviour, helped the companies adapt to the new environment, fostered a long-term thinking, and helped in the exploration of many uncertain investment opportunities, which would otherwise not be used (Burgeois and Singh 1983; Rajagopalan and Spreitzer 1997). A higher organisational slack is related to high data acquisition costs and difficulty in monitoring, while economists agreed that lobbying protected the company’s benefits. Hence, many companies conduct lobbying for acquiring the governmental support and surviving in the market (Melitz 2005). Some researchers (Richter 2010; Houston et al. 2014) stated that the political influence increases the firm’s access to the debt and the equity finance. Hence, many firms lobby for improving their access to the capital. The availability of the organisational slack is an important criterion for developing a corporate political strategy. The bigger firms have the necessary slack resources for conducting corporate lobbying and influencing the legislators at different governmental levels. Also, firms with a higher organisational slack can exploit the scale economy-related benefits and generate a significant effect on the CFP. Hence, we proposed that:
Hypothesis 2.
Corporate lobbying is more positively related to the CFP when the firms have a high organisation slack and less positively when organisation slack levels are low.

3. Data and Empirical Design

3.1. Data and Sample Selection

In this study, we have focused solely on America’s Most Admired Companies (AMAC), since the data for such companies is very easily available. A new list for the Fortune companies is established every year in March (in 2017, 341 companies listed) and the data was collected for a period between 2007 and 2016. We collected lobbying expenditure data for the period between 2007 and 2016 for the firms from the Centre for Responsive Politics (CRP). The CRP is a non-profit group that operates in Washington D.C. and studies the effect of lobbying activities on the legislative procedure. This group maintains a public access database for the lobbying expenditure and campaign contribution at www.opensecrets.org. The CRP also provides the lobbying expenditure of the publicly-traded firms. This study manually compared the data for all the firms for determining which of the firms were included in the Fortune list for 2007–2016. In order to avoid from the error of sample selection bias, this study does not need a balanced panel. Therefore, the number of firms in our sample dataset varies from year to year and the estimation approach uses as many observations as available. Besides, to exploit the dynamic dimension of our database (i.e., to include the lagged dependent variable) we have to observe firms over at least five consecutive years. We combined the data with the DataStream for extracting the public firm-related data. As the CRP did not use any company identifiers, we manually verified the names of all public firms for ensuring that the CRP lobbying and DataStream data matched and excluded those firms that were without provide complete information. Finally, due to a lack of relevant data for the CFP and lobbying expenditure, eventually, this decreased the sample population to 134 firms. Our final unbalanced panel sample comprises 2494 observations over the 2007–2016 periods.

3.2. Empirical Design

Here, we developed a dynamic panel model of the lagged levels for the dependent variables and have used the two-step Generalised Methods of the Moment (GMM) technique (Blundell and Bond 1998; Blundell et al. 2001) along with the error correction system (Windmeijer 2005). The use of this methodology could be justified based on the fact that the conventional fixed effects estimator was biased when the lagged dependent variable was used as a regressor. Furthermore, this technique also takes into consideration the probable endogeneity of a few dependent variables. The researchers stated that the alternative consistent estimators having a lagged dependent variable are valid only if the explanatory variables are exogenous.
They also used a novel methodology, i.e., system-GMM, for two main reasons. First, it is possible that the CFP is endogenous and it affects the corporate lobbying activities that are conducted and it is also simultaneously affected by the corporate lobbying. Second, many relevant factors motivate the corporate lobbying; however, they are not included or observed in the model. All these factors include various intangibles like the management quality and the company attitude. In this model, we considered that the ROA, ROE, and ROA were endogenous, since these factors responded to the changes in the corporate lobbying variable, which was pre-determined. Furthermore, the system-GMM method shows the minimal bias and the highest precision when the N factor in the data (in our study refers to the number of the firms) is high and the series is moderately or very persistent, in comparison to other commonly used estimators, i.e., a fixed or differing effects (Soto 2009).
Corporate lobbying requires a lot of expenditure within a short period of time, while the results with respect to governmental support are realised later (Chen et al. 2015). This delay in the gain of the lobbying activities indicates that the lobbying initiatives require significant internal or external changes with regards to their restructuring and reorganising, to help the firms become more familiar with the novel corporate political strategies. The dynamic effects can be incorporated in the panel data model by including the lagged dependent variable. This was seen to be a common strategy that was used by several researchers who investigated the firm performance in the industrial organisations (Chen et al. 2015; Keele and Kelly 2006). The introduction of a lagged dependent variable indicates that the standard estimators are highly inconsistent. The consistent estimators are determined with the help of the GMM approach, which was described earlier (Arellano and Bond 1991). It converts the equation into the differences and then applying a lagged value of the endogenous variables as tools, wherein the instrument number differs for every time period. This procedure was used for deriving the estimates of the dynamic model, with the help of the Stata ver. 15.0. These GMM estimates are seen to be inconsistent if no serial correlation exists. This problem is also noted in the model that was based on the second-order serial correlation seen in the first difference model. Furthermore, we have also reported a diagnostic test for the first and the second order serial correlation, along with the Hansen test for instrumental validity.

3.3. Corporate Lobbying and CFP

This study used the empirical model, described below, for investigating the relationship between the CFP and corporate lobbying.
CFP = αPrio_CFPit + β1Corporate_Lobbyingit + β2Firm_Sizeit + β3Leverageit + β4Advertisment_Intensityit + β5Revenueit + Year_Effectsit + εit
Corporate lobbying is the variable of interest, which is present on the right-hand side of the model. The ln Lobbying refers to the natural logarithm of the total expenditure (in dollars) of the firm’s lobbying activities in the given year. Firm performance is the dependent variable. For understanding the behaviour between a dependent (i.e., CFP) and an independent variable (i.e., corporate lobbying), it is important to apply appropriate techniques for measuring the dependent variable and determining its actual effect. If it is not measured properly, then the effect will not be clear. CFP can be measured using two techniques, i.e., accounting (market-based) or economic performance measures. Here, this study has used accounting-based measures, like the Return on Assets (ROA) and the Return on Equity (ROE), to measure CFP.
The first measure included the ROA, which was commonly used in other studies (Coles et al. 2008; Adams and Ferreira 2009; Masulis and Mobbs 2011). ROA was defined as the company’s operating income divided by the total assets. The main dependent variable includes the natural logarithm of the ROA. It also describes the organisation’s profitability and assesses the management’s ability to create revenue by using the firm’s assets. ROA represents the competent manner in which the company resources are used for generating income. It also presents the efficiency of the company’s management in generating an income from its resources (Khrawish 2011). Wen (2010) stated that a high ROA indicates the efficiency of a company in utilising its funds.
ROE is a different financial value that indicates the amount of the income that was generated by the company in comparison to a total of the shareholder equity that was capitalised or recorded on the company’s financial statement. It indicates the rate of the return made on the various resources invested by the stakeholders in the bank. Furthermore, ROE is a way to determine the efficient manner in which the company management utilises the shareholders’ resources. Hence, a better ROE value indicates the efficient utilisation of the shareholders’ investment. For measuring the robustness, this study used a second measure of the CFP, i.e., ROIC, which was defined as the company’s operating income divided by the total equity.
This study used a comprehensive set of various control variables noted in the literature that were associated with the CFP. The firm size could be defined as a natural logarithm of the total assets. We also calculated the leverage as a ratio of the book value of the long-term debt to the total assets. The earlier firm profitability was measured based on the lagged CFP (i.e., lagged ROA, lagged ROE, or a lagged ROIC). The adverting intensity refers to the expense scaled by the total assets. We also used the reputation index as a control variable, as the sample was derived from the AMAC, which could significantly affect the CFP (Sánchez and Sotorrío 2007).

3.4. Effect of Organisational Slack on the Relationship between the Corporate Lobbying and CFP

The researchers used another model for testing the effect of the different company characteristics on the association between the CFP and the corporate lobbying.
CFP = αPrio_CFPit + β1Corporate_Lobbyingit + β3Slackit + β2(Corporate_Lobbying*Slack)it + β3Firm_Sizeit + β4Leverageit + β5Advertisment_Intensityit + β6Revenueit + Year_Effectsit + εit
We used the factor analysis for characterising the major firm attributes, i.e., organisational slack. Thereafter, we included the interaction between the variables for corporate lobbying and organisational slack in the empirical analysis for determining the differential effect of the lobbying on the CFP. We also calculated the organisational slack using the free cash flow and the sale amount. Many other studies used the CFP as a precursor of the slack resources, instead of the measure of the slack alone (Singh 1986; Sharfman et al. 1988). Buchholtz et al. (1999) disapproved of the use of the accounting returns for measuring the slack resources based on the fact that the income and the profit margin cannot reveal the number of the firm’s resources, which were committed, and how much was available for discretionary purposes. We agreed that the profits are not indicative of the firm’s slack resources, and hence, we have proposed that the cash flow must capture the concept of the resources that are available for the discretionary purpose. The cash flow can be defined as the firm’s operative income, which is determined before the depreciation and minus the nondiscretionary expenditure, like the interest on the debt, taxes, or dividends (Lehn and Poulsen 1989). Thereafter, we derived the measure of the operational complexity based on the advertisement intensity, firm size, and leverage (Coles et al. 2008). Subsequently, we used the reputation index as a control variable, as the sample was collected from the AMAC, and this could significantly affect the CFP.

4. Empirical Results

Table 1 and Table 2 present the descriptive statistics for the variables used in this study. The researchers noted that the relationship between these variables had a statistical significance (based on the t-value) and fulfilled the expectations of this study. This could be seen from the control variables that were associated with the other variables. Moreover, the correlation matrix showed that all of the study variables did not show the problem of multicollinearity as they showed a value ≥0.80. Also, the analysis of the Variance Inflation Factors (VIF) (1.48) showed no multicollinearity issue in this data, as the VIF values were further away from the maximal threshold value, i.e., 10.

4.1. Testing the Effect of the Corporate Lobbying on the CFP

Here, this study has presented the empirical results of the association between the CFP and corporate lobbying in 2 steps. In Step 1, we have provided a direct evidence regarding the dynamic relationship of the corporate lobbying and CFP (i.e., ROA, ROE, and ROIC); and, in Step 2, they directly tested the interactive effect of the organisational slack and corporate lobbying on the CFP. Table 3, Table 4 and Table 5 present the static and dynamic results, along with the fixed effect model and the system-GMM results for the ROA, ROE, and the ROIC, which were estimated using the corporate lobbying for evaluating the effect after overlooking the dynamic corporate lobbying–CFP relation and heterogeneity. The results were validated for the misspecification tests (i.e., Hansen test for other restrictions along with a second-order serial correlation test, i.e., AR 2 test), which helped in confirming the appropriateness of using the system-GMM model specification. Furthermore, the positive and significant coefficient for the lagged dependent variable validated the persistence of the CFP, which was seen to significantly rely on its past value. As shown in Table 3, Table 4 and Table 5, the positive and significant coefficient for the lagged dependent variable for the system-GMM was present between the fixed effects and the pooled OLS. Similar results were noted earlier (Bond et al. 2001), where the researchers applied an effective and unbiased system GMM. Hence, in this study, we used the system-GMM two-step2 estimator for all calculations and the Hansen test for the other restrictions. Thus, we concluded that the system-GMM was an effective model specification. Irrespective of the estimation technique used, the control variables showed the following effect on the CFP (i.e., ROA, ROE, and ROIC). The total revenue of firms showed a positive effect on the CFP. We observed a negative effect of the total asset and the leverage on the CFP. We also noted a mixed relationship between the advertising intensity and the CFP.
The model that was used in the study defines the measures for corporate lobbying. As seen in the study, a few biases can arise if the researchers overlooked the dynamic corporate lobbying-CFP relationship (i.e., fixed-effects model) and the unobservable heterogeneity (i.e., pooled OLS model). As shown in Table 3, a positive relationship (based on the OLS estimate—model 1 and 3, based on fixed-effects estimate—model 2) was noted between the corporate lobbying and ROA, while a neutral relationship was seen between the system-GMM (model 5) and the dynamic fixed-effects model (model 4). On the other hand, Table 4 and Table 5 also showed same results, with a significant relationship between corporate lobbying and ROE and ROIC for all models. Hence, the dynamics must be considered before determining the CFP and the corporate lobbying relationship. As biased results could be generated with the help of the OLS estimate and the fixed-effects model, the researchers have highlighted these system-GMM results. With regards to the relationship between the CFP and the corporate lobbying, the ROA, ROE, and ROIC were unaffected by corporate lobbying. The resultant data did not show any effect on the H1, indicating that there was no effect of the corporate lobbying on the CFP. Thus, the researchers verified the presence of a neutral relationship between the CFP and the corporate lobbying activities. Similar results were noted in the earlier empirical studies (Ansolabehere et al. 2004; Cao et al. 2018; Faccio et al. 2006; Hersch et al. 2008).

4.2. Testing the Interactive Effect of Corporate Lobbying and the Organisational Slack on CFP

This study has also investigated the interactive effects of the corporate lobbying and the organisational slack on the CFP. Table 6, Table 7 and Table 8 show the regression analysis for the system-GMM estimator. The Arellano and Bond test for autocorrelation supported the overall model validity, as it provided evidence for the presence of the 1st-order autocorrelation (ar1) and the absence of the second-order autocorrelation (AR2), whereas the Hansen test supported the consistency of all GMM instruments. It could be seen that this estimation controlled the potential correlation between the regressors and the unobserved factors. Table 6, Table 7 and Table 8 present the results for the conventional determinants of the financial performance (i.e., ROA, ROE, and ROIC). Furthermore, the CFP was seen to be unaffected by the corporate lobbying.
Table 6, Table 7 and Table 8 present the results of the regression model that was used for investigating the proposed hypotheses. In both the tables, the interactions occurring between the organisational slack and the corporate lobbying along with their effect on the CFP were determined using Model 3 in Table 6, Table 7 and Table 8. We relied on the Model 3 for testing Hypothesis 2, since it was a completely specified model that accurately depicted the effects of every variable. The model includes the interaction term between corporate lobbying and organisational slack. According to Brambor et al. (2006), it is not necessary to interpret the individual term of the corporate lobbying and organisational slack, since these coefficients are not our main concern. Hypothesis 2 was proposed for predicting whether the organisational slack could positively moderate the association between the corporate lobbying and the CFP. When the organisational slack increased, the positive relationship between the CFP and the corporate lobbying also became stronger. However, the findings of this study showed an opposite result that the organisational slack negatively moderated this relationship and do not support the Hypothesis 2. As seen in the Model 3 in Table 6, Table 7 and Table 8 for the ROA, ROE, and ROIC, a significant and negatively coefficient was noted for the interaction between the organisational slack and the corporate lobbying (βROA = −0.567, p value < 0.10; βROE = −6.905, p value < 0.10; βROIC = −1.356, p value < 0.05). These results showed that the detrimental effect of the corporate lobbying on the CFP when interacting with organisational slack. This finding is inconsistent with Hypothesis 2.
Furthermore, a significant interaction was noted between the financial slack and corporate lobbying. A further exploration of this effect has been described in Figure 1 and Figure 2. Based on the Model 3 results shown in Table 6, Table 7 and Table 8, we applied the Aiken et al. (1991) strategy for plotting all significant interactive effects (p-value lower than 0.05) for depicting the moderating effects properly. Figure 1, Figure 2 and Figure 3 illustrate the effect of the corporate lobbying on the corporate lobbying for the 2 levels (i.e., low and high) of organisational financial slack. A standard deviation value that was greater or lesser than the mean could indicate the higher or lower level of all moderating variables, respectively.
As shown in Figure 1, when the corporate lobbying increased by a value of 1 standard deviation lower than the mean to 1 value above the mean, the ROA decreased from 3.31 to 2.93 in the case of the firms with a high level of organisational slack, whereas the ROA increased from 2.86 to 3.18 for the firms with a low level of organisational slack. In other words, when the corporate lobbying expenditure increased from 1 standard deviation value below the mean to 1 value above the mean, the ROA for the firms with a higher slack showed an 16.06% decrease, whereas, in the case of the firms with a lower slack, the ROA increased by 15.32%. Hence, Figure 1 showed that the effect of the corporate lobbying varied from low to high, while the corporate lobbying and ROA relationship shifted from negative to positive. The organisational slack moderated the effect of the corporate lobbying on the CFP, and a strong negative relationship could be seen between the parameters in the case of the companies with a higher level of organisational slack.
With regards to the moderation effect, Figure 1 showed the negative effect of the corporate lobbying on the ROA when the organisational slack was high. On the other hand, this relationship was positive when the level of organisational slack was low. These results verified the moderating effect of the organisational slack; while the interaction pattern between the parameters was seen to be inconsistent when compared to the prediction. Thus, the Hypothesis 2 could not be proved. Similar results are explained in Figure 2 and Figure 3 for ROE and ROIC, respectively, thus support this view on corporate lobbying by demonstrating that the effect of corporate lobbying is negative when organisational slack is high, but positive when organisational slack is low. In conclusion, based on the meaning of ROA, ROE, and ROIC, our findings indicate that firms with high corporate lobbying are expected to achieve high profit when organisational slack is low.

5. Selection Bias

In order to correct for potential selection bias, a Heckman Two-Step procedure was estimated (Heckman 1979). The Heckman model is warranted when samples are non-random and there is a chance that omitted variables from a broader sample of firms will bias results. In the two-step procedure, the first equation is a selection equation where the control variables are regressed on the selection variable, in this case, corporate lobbying, the result is a correction factor, known as the Inverse Mills Ratio (Bascle 2008). The Mills coefficient is then added to the original equation as an additional right-hand variable to adjust for the selection bias. However, if the Inverse Mills Ratio coefficient is insignificant (p > 0.05), then there is no selection bias, and the original results are unbiased due to selection. In both Heckman equations, the Inverse Mills Ratio was insignificant (Lamda = −4.707, p = 0.071 for corporate lobbying), and therefore, selection bias is not present in the included sample.

6. Discussion

There has been an increasing interest in the lobbying and other political activities of the various organisations. Till date, the academics and the financial press have focused primarily on the weaker measure of the political activities, i.e., PAC contributions. However, the PAC contributions are a very small percentage of the total corporate political activities. Furthermore, as they are made by the individuals, they cannot be included as corporate expenses. This study has noted that the lobbying expenses are the biggest type of corporate political activity in America. This is determined by the number of the companies that are engaged and the amount of money spent. These factors showed that the lobbying activities were significantly higher than the corporate PACs and the soft money donations (banned). Therefore, this study used the publicly-accessible data about the corporate lobbying activities for investigating the financial effect of the corporate political activities.
This study examined the relationship between the CFP and the corporate lobbying activities with an aim to determine the moderating role of organisational slack. Many recent studies have indicated that the relationship between the corporate lobbying and the CFP was slightly positive, however, some researchers stated that further investigation was necessary for clarifying the role played by the omitted variables that could interfere in the relationship. This debate is still open and new models are required, which can address these issues. This study has tried to explain the lobbying activity interface after analysing the role played by organisational slack.
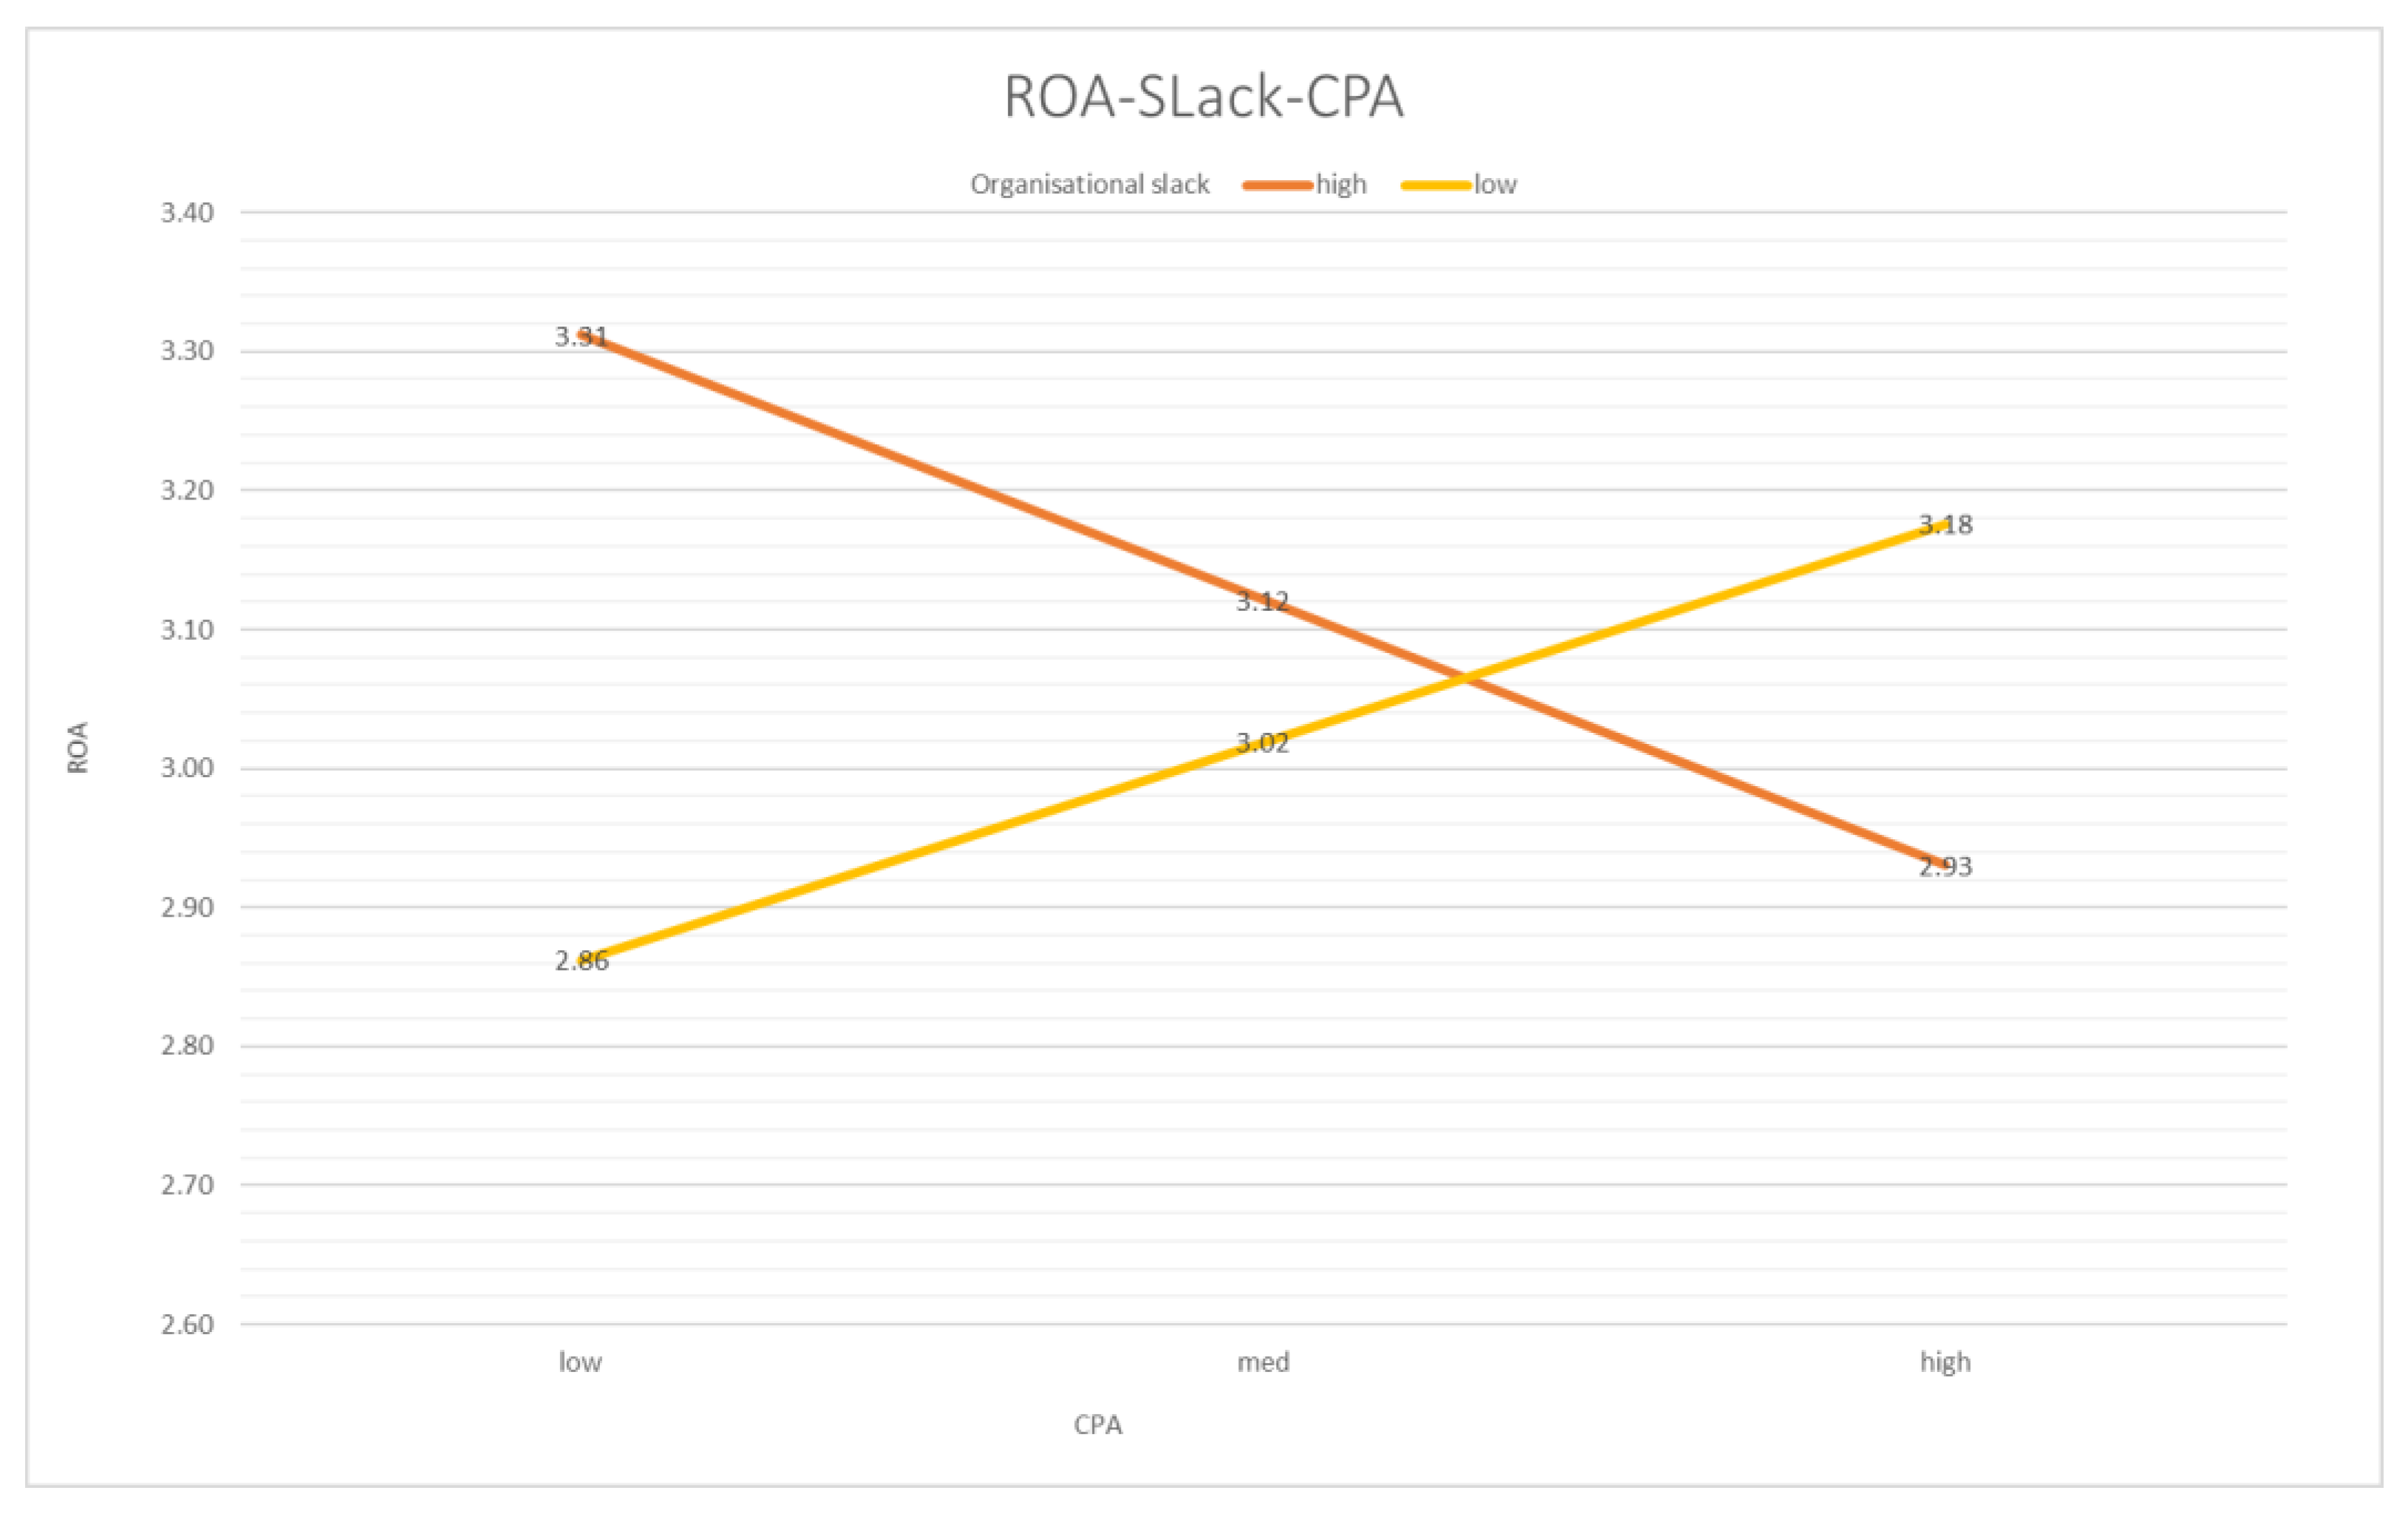
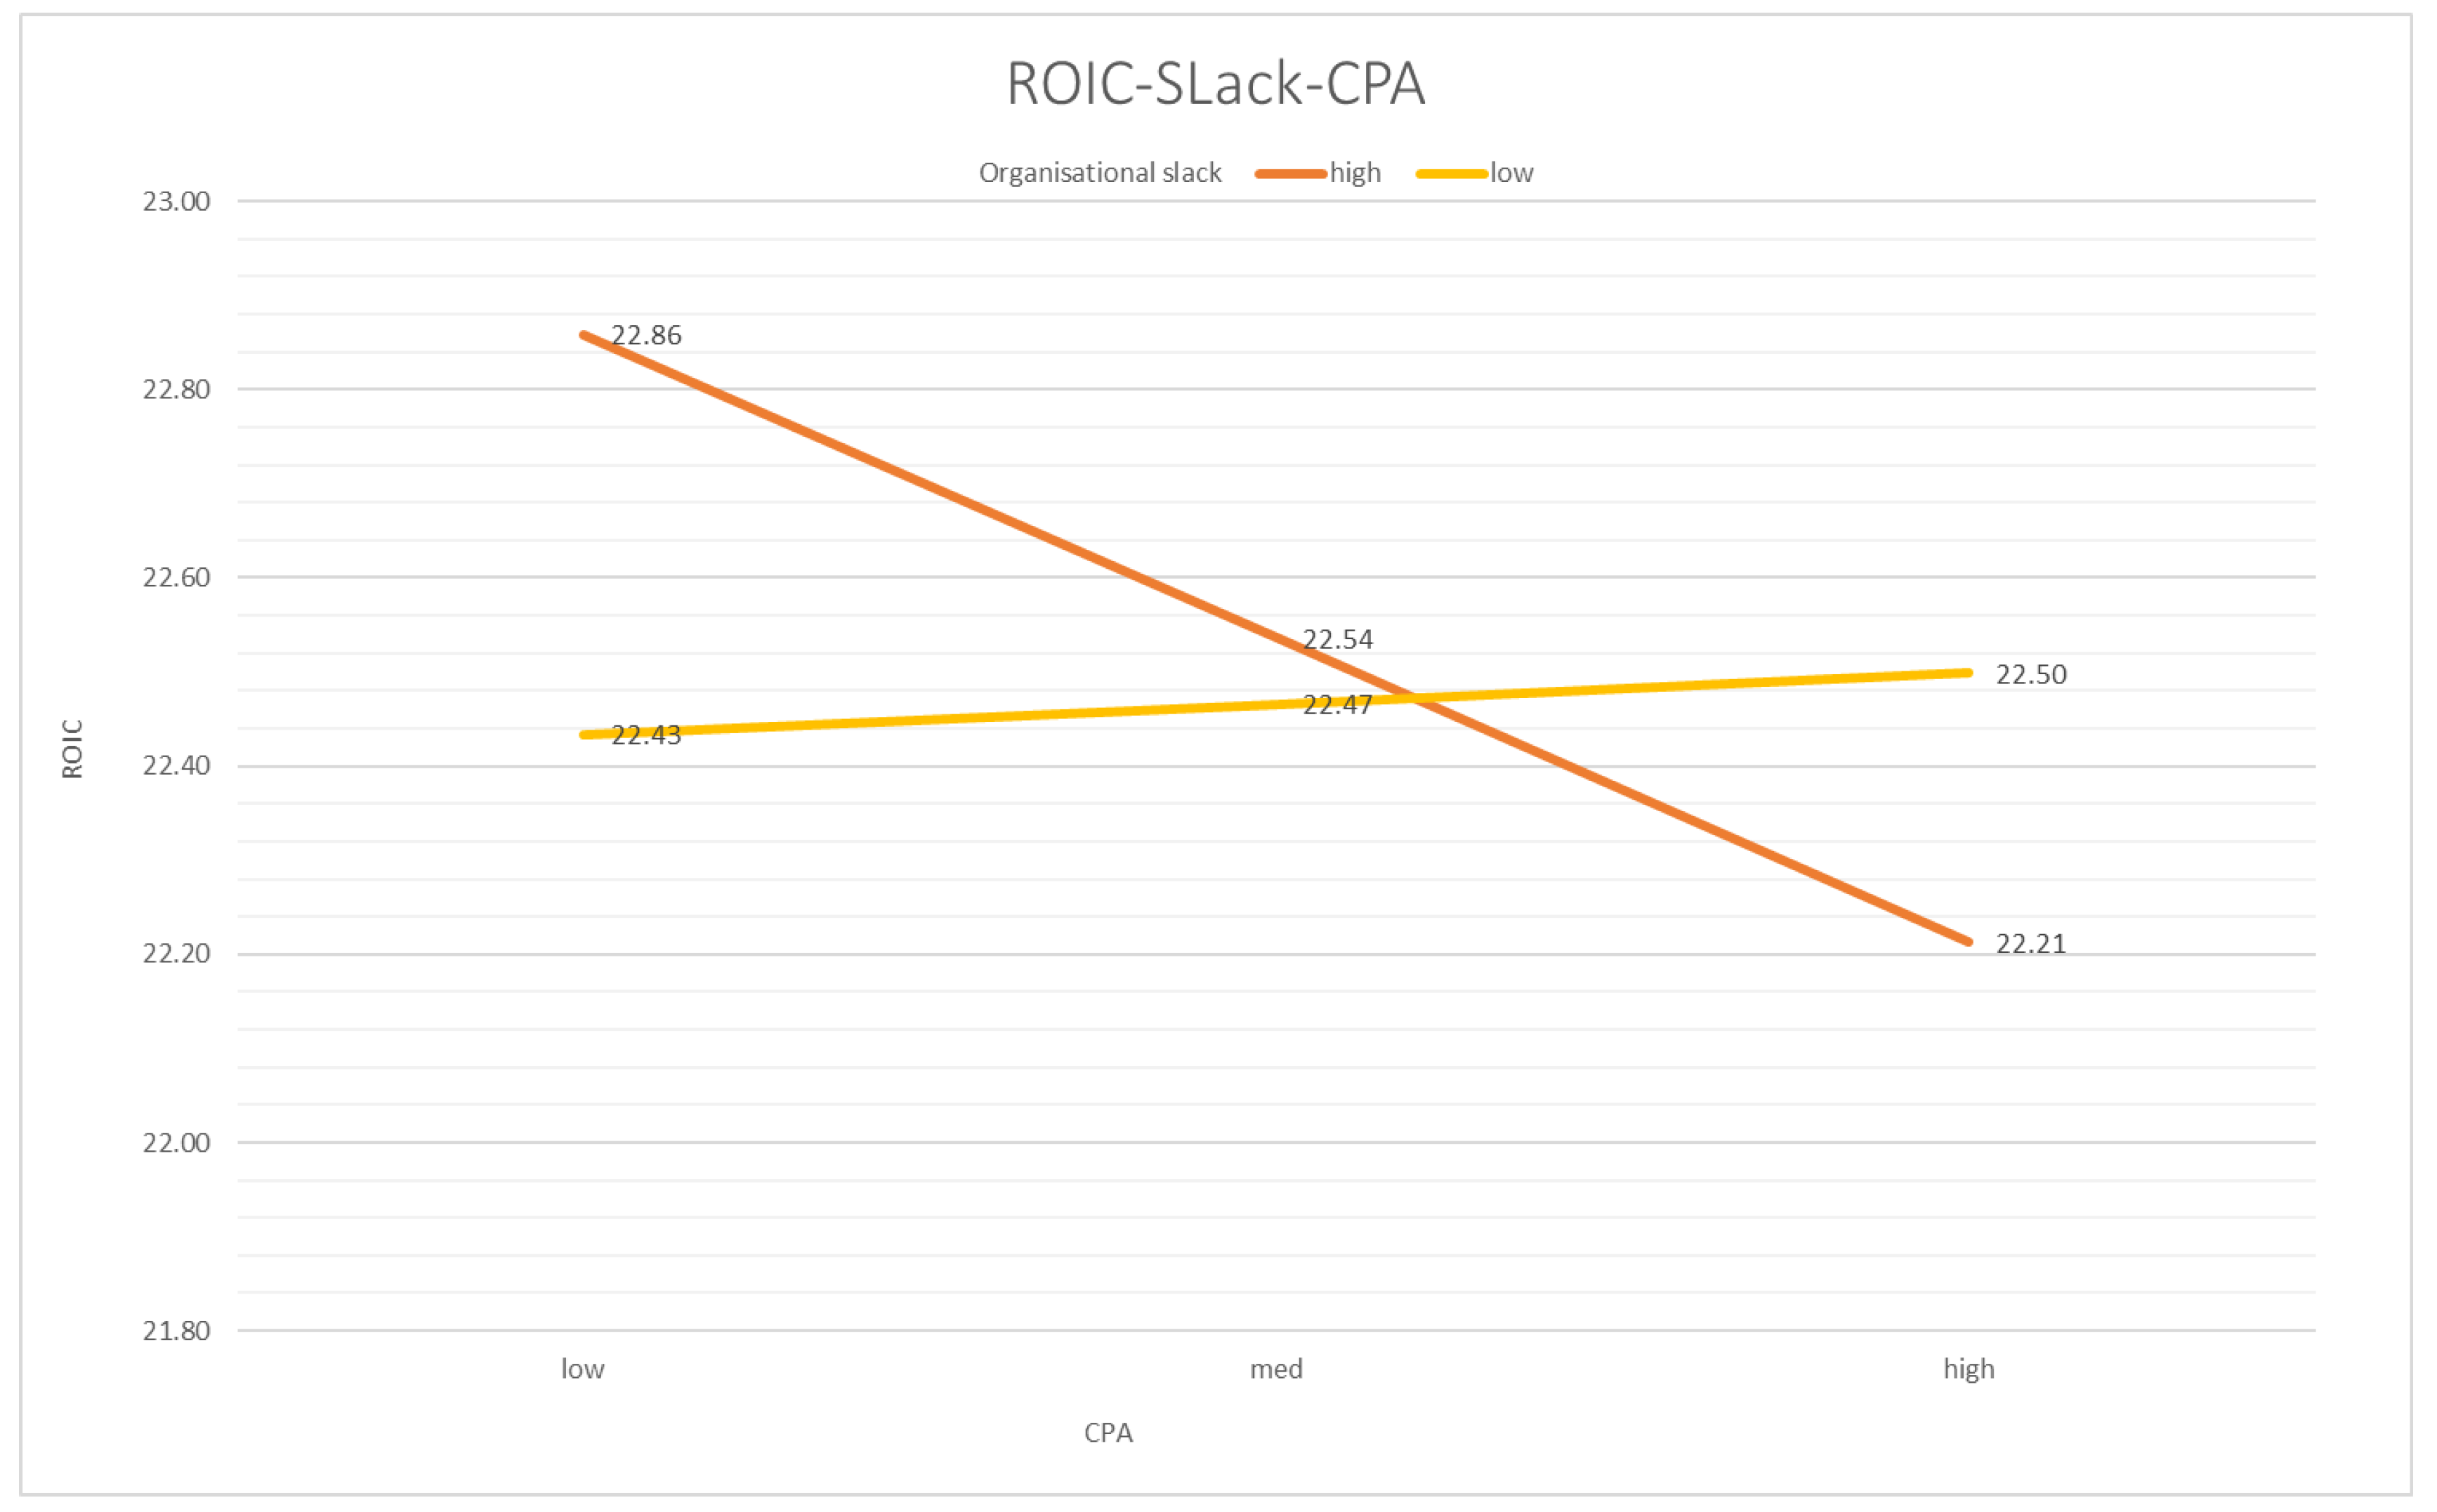
This study has presented several results describing the relationship between the corporate lobbying and the CFP. Firstly, while taking into consideration the dynamic data for the system-GMM estimation and regression, the researchers noted that the lobbying expenses were not significantly correlated with the CFP. Secondly, this study investigated the two-way interaction between the lobbying and the organisational slack, after using the CFP as a dependent variable. The results showed that organisational slack negatively interacts with the corporate lobbying, which indicates the synergy. Also, the interaction between the corporate lobbying and logistic slack generated a detrimental effect on the CFP, thereby rejecting H2. These results were robust to the different measures of the CFP, i.e., ROA or ROIC.
All of the results in this study have contributed to the theory in many ways. We noted that the corporate lobbying does not necessarily improve the CFP, which was explained using the political market theory, as it emphasised on the political competition, suggesting that the corporate lobbying activities could be an important component of the zero-sum political game, which cannot be accurately evaluated. This political marketplace theory regards corporate lobbying as an exchange in the policy arena that occurs between the policy demanders, like various interest groups or firms, on one hand, and the legislators, policy suppliers, regulators, etc. on the other hand (Bonardi et al. 2006). Many firms compete with one another for limited access to public officials (Hillman and Hitt 1999). Due to the increasing number of political rivals, the specific firms find it difficult to forward a particular public policy agenda successfully (Hall and Wayman 1990; Baumgartner et al. 2009). Similar results were noted by Baumgartner et al. (2009), who stated that the lobbying expenditure was not related to the public policy success. They also concluded that they could not observe any relationship between the resources and the policy results.
To explain further, though some managers believe that they can alter the political scenario, in actual reality, the firms cannot successfully predict the decisions of the policymakers, since policymaking involves personal, party, state, national, or media influences (Keim 2001). This factor, along with the rational decisions of the corporate decision-makers, increases the strategic uncertainty related to the corporate lobbying or its ability to produce the desired outcome, like an improved CFP (Hart 2010). Due to this uncertain influence, the corporate lobbying was seen to be less successful than what is presumed.
In this paper, we have extended the contingency theory to include corporate lobbying and the CFP. The contingency theory claims that external and internal factors have an impact on organisational structure and management. In this perspective, we applied this theory to demonstrate that corporate lobbying is highly situational determined firm performance and organisational slack as influential factor. The contingency theory has highlighted the significance of obtaining a fit or a congruency between the corporate lobbying and the level of organisational slack of the firm. The idea of organisational slack as an important driver of corporate lobbying originates from behavioural theory. As shown by this study, the amount of organisational benefits that can be obtained from corporate lobbying is contingent on the organisational slack when the resources level is low. Firms with low slack might see political activities as the only solution to rectify their financial woes (Hillman et al. 2004). We argued that firms with limited organisational slack have the potential of increasing their profits through lobbying on public policy protection, for instance through high tariffs for imported goods using the “infant industry protection” argument, but do not have the purchasing power. The level of organisational slack of a firm may influence its decision to seek political favours. The lesser a firm is in slack, the more sensitive it is to government’s policies. Firms may seek political favor or intervention when trying to secure a government project and may ask for a subsidy.

Limitations and Future Research

Similar to other studies, this paper also has some limitations. Firstly, as the data used here was historical, the causalities could not be easily surmised. Though we have tested all of the equations within the model that showed a delayed effect on the political activity (reverse of the proposed hypothesis), they noted no evidence regarding this relationship. This raises a few questions regarding the causal relationships described in the empirical studies without experimentation. Secondly, since this field is very concentrated, the number of companies included was very small (N = 134). Though the estimations can be improved in this panel data set (N = 1294), increasing the sample size would be better. The future studies will have many techniques at their disposal for improving the published literature and determining the perfect category in which this study can be fit. This could be done by qualitatively studying the relationship that exists between the firm-level lobbying and the CFP. For instance, a massive case study can be carried out in many industries for expanding the scope of the corporate lobbying literature. This project would be empirical and also based on a theory. This phenomenon has not been researched in this area.

7. Conclusions

In this study, we investigated organisational slack as a main contingency that controls the effects of corporate lobbying on CFP. We argued that firms with low organisational slack will seek a political solution to their limited resources. We find that the relationship between corporate lobbying and CFP is negatively moderated by organisational slack. With these results, this study emphasizes the importance of examining organisational slack in understanding the firm’s performance implications of corporate lobbying and covers the way for a comprehensive understanding of contingencies when corporate lobbying is financially beneficial.

Funding

This research was funded by Universiti Putra Malaysia grant number GP-IPS 9536600.

Conflicts of Interest

The author declares no conflict of interest.

References

  1. Adams, Renee B., and Daniel Ferreira. 2009. Women in the boardroom and their impact on governance and performance. Journal of Financial Economics 94: 291–309. [Google Scholar] [CrossRef]
  2. Adams, Garry L., and Bruce T. Lamont. 2003. Knowledge management systems and developing sustainable competitive advantage. Journal of Knowledge Management 7: 142–54. [Google Scholar] [CrossRef]
  3. Aggarwal, Rajesh K., Felix Meschke, and Tracy Yue Wang. 2012. Corporate political donations: Investment or agency? Business and Politics 14: 1–38. [Google Scholar] [CrossRef]
  4. Aiken, Leona S., Stephen G. West, and Raymond R. Reno. 1991. Multiple Regression: Testing and Interpreting Interactions. Thousand Oaks: Sage. [Google Scholar]
  5. Alexander, Raquel, Stephen W. Mazza, and Susan Scholz. 2009. Measuring rates of return for lobbying expenditures: An empirical analysis under the American Jobs Creation Act. Journal of Law and Politics 25: 401–57. [Google Scholar]
  6. Andres, Gary J. 1985. Business involvement in campaign finance: Factors influencing the decision to form a corporate PAC. PS: Political Science & Politics 18: 213–20. [Google Scholar]
  7. Angrist, Joshua D., and Jörn-Steffen Pischke. 2010. The credibility revolution in empirical economics: How better research design is taking the con out of econometrics. Journal of Economic Perspectives 24: 3–30. [Google Scholar] [CrossRef]
  8. Ansolabehere, Stephen, John M. De Figueiredo, and James M. Snyder Jr. 2003. Why is there so little money in US politics? Journal of Economic Perspectives 17: 105–30. [Google Scholar] [CrossRef]
  9. Ansolabehere, Stephen, James M. Snyder Jr., and Michiko Ueda. 2004. Did firms profit from soft money? Election Law Journal 3: 193–98. [Google Scholar] [CrossRef]
  10. Arellano, Manuel, and Stephen Bond. 1991. Some tests of specification for panel data: Monte Carlo evidence and an application to employment equations. The Review of Economic Studies 58: 277–97. [Google Scholar] [CrossRef]
  11. Austin, James, Walter Cohn, and John Quelch. 1996. Pathways to business success in sub-Saharan Africa. Journal of African Development 2: 57–76. [Google Scholar]
  12. Backman, Michael. 1999. Asian Eclipse: Exposing the Dark Side of Business in Asia. Hoboken: Wiley. [Google Scholar]
  13. Barnard, Chester I. 1938. The Functions of the Executive. Cambridge: Harvard University Press. [Google Scholar]
  14. Bascle, Guilhem. 2008. Controlling for endogeneity with instrumental variables in strategic management research. Strategic Organization 6: 285–327. [Google Scholar] [CrossRef] [Green Version]
  15. Baumgartner, Frank R., Jeffrey M. Berry, Marie Hojnacki, David C. Kimball, and Beth L. Leech. 2009. Lobbying and Policy Change: Who Wins, Who Loses, and Why. Chicago: University of Chicago Press. [Google Scholar]
  16. Blundell, Richard, and Stephen Bond. 1998. Initial conditions and moment restrictions in dynamic panel data models. Journal of Econometrics 87: 115–43. [Google Scholar] [CrossRef]
  17. Blundell, Richard, Stephen Bond, and Frank Windmeijer. 2001. Estimation in dynamic panel data models: Improving on the performance of the standard GMM estimator. In Nonstationary Panels, Panel Cointegration, and Dynamic Panels. Bingley: Emerald Group Publishing Limited, pp. 53–91. [Google Scholar]
  18. Bogetoft, Peter, and Jens Leth Hougaard. 2004. Super efficiency evaluations based on potential slack. European Journal of Operational Research 152: 14–21. [Google Scholar] [CrossRef]
  19. Bonardi, Jean-Philippe, Guy L. F. Holburn, and Richard G. Vanden Bergh. 2006. Nonmarket strategy performance: Evidence from US electric utilities. Academy of Management Journal 49: 1209–28. [Google Scholar] [CrossRef]
  20. Bond, Stephen, Anke Hoeffler, and Jonathan Temple. 2001. GMM Estimation of Empirical Growth Models. Oxford: Economics Group, Nuffield College, University of Oxford. [Google Scholar]
  21. Bourgeois, L. Jay, III. 1981. On the measurement of organizational slack. Academy of Management Review 6: 29–39. [Google Scholar] [CrossRef]
  22. Bourgeois, L. Jay, III, and Jitendra V. Singh. 1983. Organizational Slack and Political Behavior Among Top Management Teams. In Academy of Management Proceedings. No. 1. Briarcliff Manor: Academy of Management, August, vol. 1983, pp. 43–47. [Google Scholar]
  23. Bowen, William. 2002. An analytical review of environmental justice research: what do we really know? Environmental Management 29: 3–15. [Google Scholar] [CrossRef] [PubMed]
  24. Brambor, Thomas, William Roberts Clark, and Matt Golder. 2006. Understanding interaction models: Improving empirical analyses. Political Analysis 14: 63–82. [Google Scholar] [CrossRef]
  25. Brasher, Holly, and David Lowery. 2006. The corporate context of lobbying activity. Business and Politics 8: 1–23. [Google Scholar] [CrossRef]
  26. Bromiley, Philip. 1991. Testing a causal model of corporate risk taking and performance. Academy of Management Journal 34: 37–59. [Google Scholar]
  27. Brown, Richard S. 2016. Lobbying, political connectedness and financial performance in the air transportation industry. Journal of Air Transport Management 54: 61–69. [Google Scholar] [CrossRef]
  28. Buchholtz, Ann K., Allen C. Amason, and Matthew A. Rutherford. 1999. Beyond resources: The mediating effect of top management discretion and values on corporate philanthropy. Business & Society 38: 167–87. [Google Scholar]
  29. Bourgeois, L. Jay, III, and Jitendra V. Singh. 1983. Organizational slack and political behavior within top management groups. Paper presented at Academy of Management Annual Meeting, Dallas, TX, USA, August 14–17; pp. 43–49. [Google Scholar]
  30. Byrd, Peter. 1991. British Defence Policy: Thatcher and Beyond. London: Philip Allan. [Google Scholar]
  31. Cao, Zhiyan, Guy D. Fernando, Arindam Tripathy, and Arun Upadhyay. 2018. The economics of corporate lobbying. Journal of Corporate Finance 49: 54–80. [Google Scholar] [CrossRef]
  32. Chen, Hui, David Parsley, and Ya-Wen Yang. 2015. Corporate lobbying and firm performance. Journal of Business Finance & Accounting 42: 444–81. [Google Scholar]
  33. Coates, John C., IV. 2012. Corporate politics, governance, and value before and after citizens united. Journal of Empirical Legal Studies 9: 657–96. [Google Scholar] [CrossRef]
  34. Coles, Jeffrey L., Naveen D. Daniel, and Lalitha Naveen. 2008. Boards: Does one size fit all? Journal of Financial Economics 87: 329–56. [Google Scholar] [CrossRef]
  35. Cooper, Michael J., Huseyin Gulen, and Alexei V. Ovtchinnikov. 2010. Corporate political contributions and stock returns. The Journal of Finance 65: 687–724. [Google Scholar] [CrossRef]
  36. Cyert, Richard M., and James G. March. 1963. A Behavioral Theory of the Firm. Englewood Cliffs: Prentice-Hall, Inc., vol. 2, pp. 169–87. [Google Scholar]
  37. De Figueiredo, John M., and Brian S. Silverman. 2006. Academic earmarks and the returns to lobbying. The Journal of Law and Economics 49: 597–625. [Google Scholar] [CrossRef]
  38. De Soto, H. 1989. The Other Path. New York: Harper & Row, p. 17133. [Google Scholar]
  39. Dimick, David E., and Victor V. Murray. 1978. Correlates of substantive policy decisions in organizations: The case of human resource management. Academy of Management Journal 21: 611–23. [Google Scholar]
  40. Faccio, Mara, and David C. Parsley. 2009. Sudden deaths: Taking stock of geographic ties. Journal of Financial and Quantitative Analysis 44: 683–718. [Google Scholar] [CrossRef]
  41. Faccio, Mara, Ronald W. Masulis, and John J. McConnell. 2006. Political connections and corporate bailouts. The Journal of Finance 61: 2597–635. [Google Scholar] [CrossRef]
  42. Fisman, Raymond. 2001. Estimating the value of political connections. American Economic Review 91: 1095–102. [Google Scholar] [CrossRef]
  43. Gawande, Kishore, and Usree Bandyopadhyay. 2000. Is protection for sale? Evidence on the Grossman-Helpman theory of endogenous protection. Review of Economics and Statistics 82: 139–52. [Google Scholar] [CrossRef]
  44. George, Gerard. 2005. Slack resources and the performance of privately held firms. Academy of Management Journal 48: 661–76. [Google Scholar] [CrossRef]
  45. Geppert, Mike. 1996. Paths of managerial learning in the East German context. Organization Studies 17: 249–68. [Google Scholar] [CrossRef]
  46. Greenley, Gordon E., and Mehmet Oktemgil. 1998. A comparison of slack resources in high and low performing British companies. Journal of Management Studies 35: 377–98. [Google Scholar] [CrossRef]
  47. Grier, Kevin B., and Michael C. Munger. 1991. Committee assignments, constituent preferences, and campaign contributions. Economic Inquiry 29: 24–43. [Google Scholar] [CrossRef]
  48. Grier, Kevin B., Michael C. Munger, and Brian E. Roberts. 1994. The determinants of industry political activity, 1978–1986. American Political Science Review 88: 911–26. [Google Scholar] [CrossRef]
  49. Griffin, Jennifer J., and John F. Mahon. 1997. The corporate social performance and corporate financial performance debate: Twenty-five years of incomparable research. Business & Society 36: 5–31. [Google Scholar]
  50. Gul, Ferdinand A. 2006. Auditors’ response to political connections and cronyism in Malaysia. Journal of Accounting Research 44: 931–63. [Google Scholar] [CrossRef]
  51. Hadani, Michael, and Douglas A. Schuler. 2013. In search of El Dorado: The elusive financial returns on corporate political investments. Strategic Management Journal 34: 165–81. [Google Scholar] [CrossRef]
  52. Hall, Richard L., and Frank W. Wayman. 1990. Buying time: Moneyed interests and the mobilization of bias in congressional committees. American Political Science Review 84: 797–820. [Google Scholar] [CrossRef]
  53. Hart, David M. 2010. Political theory of the firm. In Oxford Handbook of Business and Government. Edited by David Coen, Wyn Grant and Graham Wilson. Oxford: Oxford University Press, pp. 173–90. [Google Scholar]
  54. Heckman, James J. 1979. Sample selection bias as a specification error. Econometrica 47: 153–61. [Google Scholar] [CrossRef]
  55. Hersch, Philip, Jeffry M. Netter, and Christopher Pope. 2008. Do campaign contributions and lobbying expenditures by firms create “political” capital? Atlantic Economic Journal 36: 395–405. [Google Scholar] [CrossRef]
  56. Hill, Matthew D., G. Wayne Kelly, G. Brandon Lockhart, and Robert A. Van Ness. 2013. Determinants and effects of corporate lobbying. Financial Management 42: 931–57. [Google Scholar] [CrossRef]
  57. Hillman, Amy J., and Michael A. Hitt. 1999. Corporate political strategy formulation: A model of approach, participation, and strategy decisions. Academy of Management Review 24: 825–42. [Google Scholar] [CrossRef]
  58. Hillman, Amy J., Gerald D. Keim, and Douglas Schuler. 2004. Corporate political activity: A review and research agenda. Journal of Management 30: 837–57. [Google Scholar] [CrossRef]
  59. Hochberg, Yael V., Paola Sapienza, and Annette Vissing-Jørgensen. 2009. A lobbying approach to evaluating the Sarbanes-Oxley Act of 2002. Journal of Accounting Research 47: 519–83. [Google Scholar] [CrossRef]
  60. Houston, Joel F., Liangliang Jiang, Chen Lin, and Yue Ma. 2014. Political connections and the cost of bank loans. Journal of Accounting Research 52: 193–243. [Google Scholar] [CrossRef]
  61. Humphries, Craig. 1991. Corporations, PACs and the strategic link between contributions and lobbying activities. Western Political Quarterly 44: 353–72. [Google Scholar] [CrossRef]
  62. Igan, Deniz, Prachi Mishra, and Thierry Tressel. 2009. A Fistful of Dollars: Lobbying and the Financial Crisis. Washington, DC: International Monetary Fund, Research Department. [Google Scholar]
  63. Jayachandran, Seema. 2006. The jeffords effect. The Journal of Law and Economics 49: 397–425. [Google Scholar] [CrossRef]
  64. Julian, Scott D., and Joseph C. Ofori-dankwa. 2013. Financial resource availability and corporate social responsibility expenditures in a sub-Saharan economy: The institutional difference hypothesis. Strategic Management Journal 34: 1314–30. [Google Scholar] [CrossRef]
  65. Keele, Luke, and Nathan J. Kelly. 2006. Dynamic models for dynamic theories: The ins and outs of lagged dependent variables. Political Analysis 14: 186–205. [Google Scholar] [CrossRef]
  66. Keim, Gerald. 2001. Managing business political activities in the USA: Bridging between theory and practice. Journal of Public Affairs: An International Journal 1: 362–75. [Google Scholar] [CrossRef]
  67. Khrawish, Husni Ali. 2011. Determinants of commercial banks performance: Evidence from Jordan. International Research Journal of Finance and Economics 81: 148–59. [Google Scholar]
  68. Lee, Seung-Hyun, and Yoon-Suk Baik. 2010. Corporate lobbying in antidumping cases: Looking into the continued dumping and subsidy offset act. Journal of Business Ethics 96: 467–78. [Google Scholar] [CrossRef]
  69. Lehn, Kenneth, and Annette Poulsen. 1989. Free cash flow and stockholder gains in going private transactions. The Journal of Finance 44: 771–87. [Google Scholar] [CrossRef]
  70. Levinthal, Daniel A., and James G. March. 1993. The myopia of learning. Strategic Management Journal 14: 95–112. [Google Scholar] [CrossRef]
  71. Masters, Marick F., and Gerald D. Keim. 1985. Determinants of PAC participation among large corporations. The Journal of Politics 47: 1158–73. [Google Scholar] [CrossRef]
  72. Masulis, Ronald W., and Shawn Mobbs. 2011. Are all inside directors the same? Evidence from the external directorship market. The Journal of Finance 66: 823–72. [Google Scholar] [CrossRef]
  73. McKeown, Timothy J. 1994. The epidemiology of corporate PAC formation, 1975–1984. Journal of Economic Behavior & Organization 24: 153–68. [Google Scholar]
  74. Melitz, Marc J. 2005. When and how should infant industries be protected? Journal of International Economics 66: 177–96. [Google Scholar] [CrossRef]
  75. Meyer, Alan D. 1982. Adapting to environmental jolts. Administrative Science Quarterly 27: 515–37. [Google Scholar] [CrossRef] [PubMed]
  76. Milyo, Jeffrey, David Primo, and Timothy Groseclose. 2000. Corporate PAC campaign contributions in perspective. Business and Politics 2: 75–88. [Google Scholar] [CrossRef]
  77. Mitchell, Neil J., Wendy L. Hansen, and Eric M. Jepsen. 1997. The determinants of domestic and foreign corporate political activity. The Journal of Politics 59: 1096–113. [Google Scholar] [CrossRef]
  78. Moreno, Antonia Ruiz, Luis Miguel Molina Fernandez, and Francisco Javier Lloréns Montes. 2009. The moderating effect of slack resources on the relation between quality management and organisational learning. International Journal of Production Research 47: 5501–23. [Google Scholar] [CrossRef]
  79. Morris, Thomas R., and Larry Sabato. 1984. Virginia Government and Politics: Readings and Comments. Richmond: Virginia Chamber of Commerce. [Google Scholar]
  80. Nichols, Austin. 2007. Causal inference with observational data. Stata Journal 7: 507. [Google Scholar]
  81. Nohria, Nitin, and Ranjay Gulati. 1996. Is slack good or bad for innovation? Academy of Management Journal 39: 1245–64. [Google Scholar] [CrossRef]
  82. Nystrom, Paul C., Keshavamurthy Ramamurthy, and Alla L. Wilson. 2002. Organizational context, climate and innovativeness: adoption of imaging technology. Journal of Engineering and Technology Management 19: 221–47. [Google Scholar] [CrossRef]
  83. Palmer, Timothy B., and Robert M. Wiseman. 1999. Decoupling risk taking from income stream uncertainty: A holistic model of risk. Strategic Management Journal 20: 1037–62. [Google Scholar] [CrossRef]
  84. Rajagopalan, Nandini, and Gretchen M. Spreitzer. 1997. Toward a theory of strategic change: A multi-lens perspective and integrative framework. Academy of Management Review 22: 48–79. [Google Scholar] [CrossRef]
  85. Richter, Ulf Henning. 2010. Liberal thought in reasoning on CSR. Journal of Business Ethics 97: 625–49. [Google Scholar] [CrossRef]
  86. Richter, Brian Kelleher, Krislert Samphantharak, and Jeffrey F. Timmons. 2009. Lobbying and taxes. American Journal of Political Science 53: 893–909. [Google Scholar] [CrossRef]
  87. Roberts, John. 1990. Postmodernism, Politics and Art. Manchester: Manchester University Press. [Google Scholar]
  88. Roodman, David. 2009. How to do xtabond2: An introduction to difference and system GMM in Stata. The Stata Journal 9: 86–136. [Google Scholar] [CrossRef]
  89. Sánchez, José Luis Fernández, and Ladislao Luna Sotorrío. 2007. The creation of value through corporate reputation. Journal of Business Ethics 76: 335–46. [Google Scholar] [CrossRef]
  90. Schuler, Douglas A. 1996. Corporate political strategy and foreign competition: The case of the steel industry. Academy of Management Journal 39: 720–37. [Google Scholar]
  91. Schuler, Douglas A., and Kathleen Rehbein. 1997. The filtering role of the firm in corporate political involvement. Business & Society 36: 116–39. [Google Scholar]
  92. Seifert, Bruce, Sara A. Morris, and Barbara R. Bartkus. 2004. Having, giving, and getting: Slack resources, corporate philanthropy, and firm financial performance. Business & Society 43: 135–61. [Google Scholar]
  93. Sharfman, Mark P., Gerrit Wolf, Richard B. Chase, and David A. Tansik. 1988. Antecedents of organizational slack. Academy of Management Review 13: 601–14. [Google Scholar] [CrossRef]
  94. Singh, Jitendra V. 1986. Performance, slack, and risk taking in organizational decision making. Academy of Management Journal 29: 562–85. [Google Scholar]
  95. Soto, Marcelo. 2009. System GMM Estimation with a Small Sample. UFAE and IAE Working Papers 780.09. Bellaterra: Unitat de Fonaments de l′Anàlisi Econòmica (UAB) and Institut d′Anàlisi Econòmica (CSIC). [Google Scholar]
  96. Stigler, George J. 1971. The theory of economic regulation. The Bell Journal of Economics and Management Science 2: 3–21. [Google Scholar] [CrossRef]
  97. Stratmann, Thomas. 2005. Some talk: Money in politics. A (partial) review of the literature. In Policy Challenges and Political Responses. Boston: Springer, pp. 135–56. [Google Scholar]
  98. Tan, Justin. 2003. Curvilinear relationship between organizational slack and firm performance: Evidence from Chinese state enterprises. European Management Journal 21: 740–49. [Google Scholar] [CrossRef]
  99. Tan, Justin, and Mike W. Peng. 2003. Organizational slack and firm performance during economic transitions: Two studies from an emerging economy. Strategic Management Journal 24: 1249–63. [Google Scholar] [CrossRef]
  100. Tu, Guoqian, Bingxuan Lin, and Feng Liu. 2013. Political connections and privatization: Evidence from China. Journal of Accounting and Public Policy 32: 114–35. [Google Scholar] [CrossRef]
  101. Wen, W. 2010. Ownership Structure and Bank Performance in China: Does Ownership Concentration Matter? (October 30, 2010). Available online: https://ssrn.com/abstract=1747655 (accessed on 27 December 2018).
  102. Windmeijer, Frank. 2005. A finite sample correction for the variance of linear efficient two-step GMM estimators. Journal of Econometrics 126: 25–51. [Google Scholar] [CrossRef]
  103. Wiseman, Robert M., and Philip Bromiley. 1996. Toward a model of risk in declining organizations: An empirical examination of risk, performance and decline. Organization Science 7: 524–43. [Google Scholar] [CrossRef]
  104. Wu, Jianfeng, and Rungting Tu. 2007. CEO stock option pay and R&D spending: A behavioral agency explanation. Journal of Business Research 60: 482–92. [Google Scholar]
  105. Yu, Frank, and Xiaoyun Yu. 2011. Corporate lobbying and fraud detection. Journal of Financial and Quantitative Analysis 46: 1865–91. [Google Scholar] [CrossRef]
1
Reported by the Centre for Public Integrity.
2
Estimations were carried out using the Stata module Xtabond2 developed by Roodman (2009). System GMM was implemented as a one-step estimator with Windmeijer-corrected cluster-robust errors.
Figure 1. Effects of CPA on ROA: Contingent on Organisational Slack.
Ijfs 07 00002 g001
Figure 2. Effects of CPA on ROE: Contingent on Organisational Slack.
Ijfs 07 00002 g002
Figure 3. Effects of CPA on ROIC: Contingent on Organisational Slack.
Ijfs 07 00002 g003
Table 1. Descriptive statistics.
VariableUnit of MeasurementObsMeanStd. DevMinMax
lnroaLog Net income before extraordinary items to total asset of firm12943.7620.1700.0004.404
lnroeLog Net income before extraordinary items to total equity of firm12945.4880.1890.0006.620
lnroicLog Net income before extraordinary items to total equity and debt of firm12944.1470.2030.0004.814
lncpaLog of total amount of lobbying to total net sales of firm12947.4191.834−2.30310.635
lnfreecashLog Free cash flow to total of net sales12945.3830.1670.0006.216
lnlevLong term debt of firms to total equity12941.1350.6600.1136.899
lntotalassetLog of total asset of firm129410.4601.2677.28213.632
lnadvLog advertising expenses to total net sales of firm12452.8160.788−0.7134.775
Notes: All statistics are based on original data values.
Table 2. Correlation.
lnroalnroelnroiclncpalnfreecashlnlevlntotalassetlnadv
lnroa1
lnroe0.332 ***1
lnroic0.7260.400 ***1
lncpa0.153 ***0.088 ***0.162 ***1
lnfreecash0.099 ***0.0380.080 ***0.0051
lnlev−0.265 ***−0.112−0.117 ***0.101 ***−0.088 ***1
lntotalasset−0.072 ***−0.027−0.093 ***0.315 ***0.0090.205 ***1
lnadv0.0390.0020.021−0.076 ***0.0740.096 ***−0.0051
Notes: All statistics are based on original data values. The p-values ***, ** and * indicate significance at 1%, 5%, and 10% levels, respectively.
Table 3. Corporate lobbying and Corporate Financial Performance (CFP) (Return on Assets (ROA)) (N = 134 firms; T = 10; period = 2007–2016).
StaticDynamic
OLSFixed EffectOLSFixed EffectSyetem GMM
VariablesModel 1Model 2Model 3Model 4Model 5
lnroat−1 0.326 **0.257 **0.131 ***
(0.146)(0.129)(0.0329)
lncpa0.0202 ***0.02620.00911 ***0.00952 ***−0.00583
(0.00617)(0.0164)(0.00301)(0.00339)(0.00383)
lnlev−0.0710 ***−0.0605 ***−0.0468 ***−0.0513 ***−0.0290 ***
(0.00819)(0.0131)(0.0138)(0.0140)(0.0109)
lntotalasset−0.0117 ***−0.0176 **−0.00964 ***−0.0101 *−0.0164
(0.00330)(0.00826)(0.00345)(0.00551)(0.0202)
lnadv0.0182 ***0.005340.0166 ***0.0158 **−0.0287
(0.00561)(0.00902)(0.00549)(0.00687)(0.0225)
YearYesYesYesYesYes
Constant3.806 ***3.838 ***2.558 ***2.853 ***3.599 ***
(0.0455)(0.0983)(0.561)(0.493)(0.261)
Observations12451245111411141114
R-squared0.132 0.334
Number of code 134 134134
AR1 −3.420 (0.001)
AR2 0.300 (0.761)
Hansen Test 15.680 (0.547)
Difference Hansen Test 1.600 (0.809)
Notes: The standard errors are reported in parentheses, except for Hansen test, AR (1), AR (2), and Difference-in-Hansen which are p-values. ***, ** and * indicate significance at 1%, 5%, and 10% levels, respectively. Time dummies are included in the model specification, but the results are not reported to save space. System GMM model is estimated by using the Blundell and Bond (1998) dynamic panel system GMM estimations and Roodman (2009)—Stata xtabond2 command.
Table 4. Corporate lobbying and CFP (ROE) (N = 134 firms; T = 10; period = 2007–2016).
StaticDynamic
OLSFixed EffectOLSFixed EffectSyetem GMM
VariablesModel 1Model 2Model 3Model 4Model 5
lnroet−1 0.3160.316 ***0.339 ***
(0.303)(0.0878)(0.0215)
lncpa0.0112 ***0.01070.00725 **0.00725 ***0.00135
(0.00176)(0.00327)(0.00366)(0.00242)(0.00361)
lnlev0.0113−0.001780.01030.0103−0.0540
(0.0450)(0.0656)(0.0456)(0.0411)(0.0380)
lntotalasset−0.0117 ***−0.0114−0.00920−0.00920 **0.00238
(0.00435)(0.00749)(0.00615)(0.00452)(0.0152)
lnadv0.00193−0.0005050.001310.00131−0.0837 **
(0.00381)(0.00755)(0.00420)(0.00572)(0.0388)
YearYesYesYesYesYes
Constant5.524 ***5.541 ***3.762 **3.796 ***3.881 ***
(0.0284)(0.0512)(1.653)(0.510)(0.210)
Observations12451245111411141114
R-squared0.026 0.117
Number of code 134 134134
AR1 −1.11 (0.268)
AR2 0.970 (0.330)
Hansen Test 17.85 (0.598)
Difference Hansen Test 2.39 (0.664)
Notes: The standard errors are reported in parentheses, except for Hansen test, AR (1), AR (2), and Difference-in-Hansen which are p-values. ***, ** and * indicate significance at 1%, 5%, and 10% levels, respectively. Time dummies are included in the model specification, but the results are not reported to save space. System GMM model is estimated by using the Blundell and Bond (1998) dynamic panel system GMM estimations and Roodman (2009)—Stata xtabond2 command.
Table 5. Corporate lobbying and CFP (Return on Invested Capital (ROIC)) (N = 134 firms; T = 10; period = 2007–2016).
StaticDynamic
OLSFixed EffectOLSFixed EffectSyetem GMM
VariablesModel 1Model 2Model 3Model 4Model 5
lnroict−1 0.395 ***0.352 **0.119 ***
(0.144)(0.143)(0.0351)
lncpa0.0249 ***0.03120.0104 ***0.0109 **−0.00384
(0.00702)(0.0209)(0.00390)(0.00480)(0.00407)
lnlev−0.0342 ***−0.0401 *−0.0201−0.0233−0.0373 ***
(0.0129)(0.0239)(0.0140)(0.0174)(0.0140)
lntotalasset−0.0228 ***−0.0281 ***−0.0169 ***−0.0176 ***−0.0758 **
(0.00401)(0.0105)(0.00505)(0.00659)(0.0298)
lnadv0.0127 *−0.003020.0125 **0.0122−0.0507 **
(0.00693)(0.0123)(0.00621)(0.00864)(0.0234)
YearYesYesYesYesYes
Constant4.253 ***4.299 ***2.569 ***2.789 ***4.672 ***
(0.0538)(0.122)(0.619)(0.605)(0.374)
Observations12451245111411141114
R-squared0.076 0.302
Number of code 134 134134
AR1 −1.11 (0.268)
AR2 0.970 (0.330)
Hansen Test 17.85 (0.598)
Difference Hansen Test 2.39 (0.664)
Notes: The standard errors are reported in parentheses, except for Hansen test, AR (1), AR (2), and Difference-in-Hansen which are p-values. ***, ** and * indicate significance at 1%, 5%, and 10% levels, respectively. Time dummies are included in the model specification, but the results are not reported to save space. System GMM model is estimated by using the Blundell and Bond (1998) dynamic panel system GMM estimations and Roodman (2009)—Stata xtabond2 command.
Table 6. Effects of corporate lobbying and organisational slack on the variable financial performance (ROA) (N = 134 firms; T = 10; period = 2007–2016).
System GMM
VariablesModel 1Model 2Model 3
lnroat−10.337 ***0.333 ***0.230 ***
(0.0519)(0.0505)(0.0642)
lncpa −0.002273.043 *
(0.00308)(1.613)
lnfreecash−0.00568−0.005284.512 *
(0.00613)(0.00620)(2.400)
(lncpa*lnfreecash) −0.567 *
(0.300)
lnlev−0.0281 ***−0.0277 ***−0.0396 **
(0.0103)(0.0103)(0.0164)
lntotalasset0.004320.004120.00473
(0.0222)(0.0221)(0.0233)
lnadv−0.0476 **−0.0455 **−0.0693 ***
(0.0204)(0.0208)(0.0252)
Year−0.00609−0.00660−0.0113
(0.0162)(0.0162)(0.0201)
Constant2.642 ***2.664 ***−21.15
(0.343)(0.342)(12.89)
Observations111411141114
Number of code134134134
AR1−4.13 (0.000)−4.10 (0.000)−4.16 (0.000)
AR20.72 (0.472)0.71 (0.480)0.23 (0.818)
Hansen Test31.59 (0.064)30.90 (0.480)21.35 (0.318)
Difference Hansen Test6.76 (0.239)8.30 (0.140)4.12 (0.532)
Number of instrument353535
Notes: All models are estimated by using the Blundell and Bond (1998) dynamic panel data system GMM estimations and Roodman (2009)—Stata xtabond2 command. The standard errors are reported in parentheses, except for Hansen test, AR (1), AR (2), and Difference-in-Hansen which are p-values. ***, ** and * indicate significance at 1%, 5%, and 10% levels, respectively. Time dummies are included in the model specification, but the results are not reported to save space. The instruments employed in the first-differenced equation are two or more lags of the levels of the endogenous variables, while one lag of the first-difference of the endogenous variables is used as instrument in the difference equation.
Table 7. Effects of corporate lobbying and organisational slack on the variable financial performance (ROE) (N = 134 firms; T = 10; period = 2007–2016).
System GMM
VariablesModel 1Model 2Model 3
lnroet−10.117 ***0.104 ***0.0671 **
(0.0123)(0.0124)(0.0270)
lncpa −0.00025437.16 *
(0.00826)(21.35)
lnfreecash−0.00106−0.0014055.16 *
(0.00982)(0.00945)(31.70)
(lncpa*lnfreecash) −6.905 *
(3.973)
lnlev−0.180 ***−0.203 ***−0.296 ***
(0.0194)(0.0230)(0.0646)
lntotalasset−0.155 *−0.125−0.0240
(0.0837)(0.0885)(0.141)
lnadv−0.190 ***−0.143 *−0.145
(0.0661)(0.0772)(0.133)
YearYesYesYes
Constant7.169 ***6.829 ***−290.1 *
(0.983)(1.023)(170.2)
Observations111411141114
Number of code134134134
AR1−1.10 (0.270)−1.10 (0.2.73)−1.74 (0.081)
AR20.48 (0.630)0.33 (0.740)−1.29 (0.196)
Hansen Test21.02 (0.458)18.66 (0.544)7.51 (0.991)
Difference Hansen Test8.30 (0.414)6.47 (0.264)1.74 (0.884)
Number of instrument353535
Notes: All models are estimated by using the Blundell and Bond (1998) dynamic panel data system GMM estimations and Roodman (2009)—Stata xtabond2 command. The standard errors are reported in parentheses, except for Hansen test, AR (1), AR (2), and Difference-in-Hansen which are p-values. ***, ** and * indicate significance at 1%, 5%, and 10% levels, respectively. Time dummies are included in the model specification, but the results are not reported to save space. The instruments employed in the first-differenced equation are two or more lags of the levels of the endogenous variables, while one lag of the first-difference of the endogenous variables is used as instrument in the difference equation.
Table 8. Effects of corporate lobbying and organisational slack on the variable financial performance (ROIC) (N = 134 firms; T = 10; period = 2007–2016).
System GMM
VariablesModel 1Model 2Model 3
lnroict−10.307 ***0.305 ***0.106 **
(0.058)(0.061)(0.064)
lncpa −0.00027.289 **
(0.003)(2.987)
lnfreecash−0.003−0.00310.810 **
(0.007)(0.007)(4.439)
(lncpa*lnfreecash) −1.356 **
(0.556)
lnlev−0.031 *−0.032 **−0.076 ***
(0.016)(0.0159)(0.0195)
lntotalasset−0.0495−0.042−0.022
(0.031)(0.031)(0.038)
lnadv−0.061 ***−0.059 ***−0.075 **
(0.020)(0.023)(0.032)
ConstantNo3.550 ***−53.840 **
(0.493)(23.900)
Year YesYesYes
Observations111411141114
Number of code134134134
AR1−3.89 (0.000)−3.92 (0.000)−4.34 (0.000)
AR2−0.48 (0.634)−0.48 (0.635)−1.60 (0.110)
Hansen Test26.87 (0.108)27.04 (0.0.078)19.46 (0.303)
Difference Hansen Test6.17 (0.290)8.06 (0.153)2.18 (0.824)
Number of instrument353535
Notes: All models are estimated by using the Blundell and Bond (1998) dynamic panel data system GMM estimations and Roodman (2009)—Stata xtabond2 command. The standard errors are reported in parentheses, except for Hansen test, AR (1), AR (2), and Difference-in-Hansen which are p-values. ***, ** and * indicate significance at 1%, 5%, and 10% levels, respectively. Time dummies are included in the model specification, but the results are not reported to save space. The instruments employed in the first-differenced equation are two or more lags of the levels of the endogenous variables, while one lag of the first-difference of the endogenous variables is used as instrument in the difference equation.

