
Tool Wear and Life Span Variations in Cold Forming Operations and Their Implications in Microforming


Abstract
:1. Introduction
2. Tool-Life Variations and Methods to Predict Tool-Life
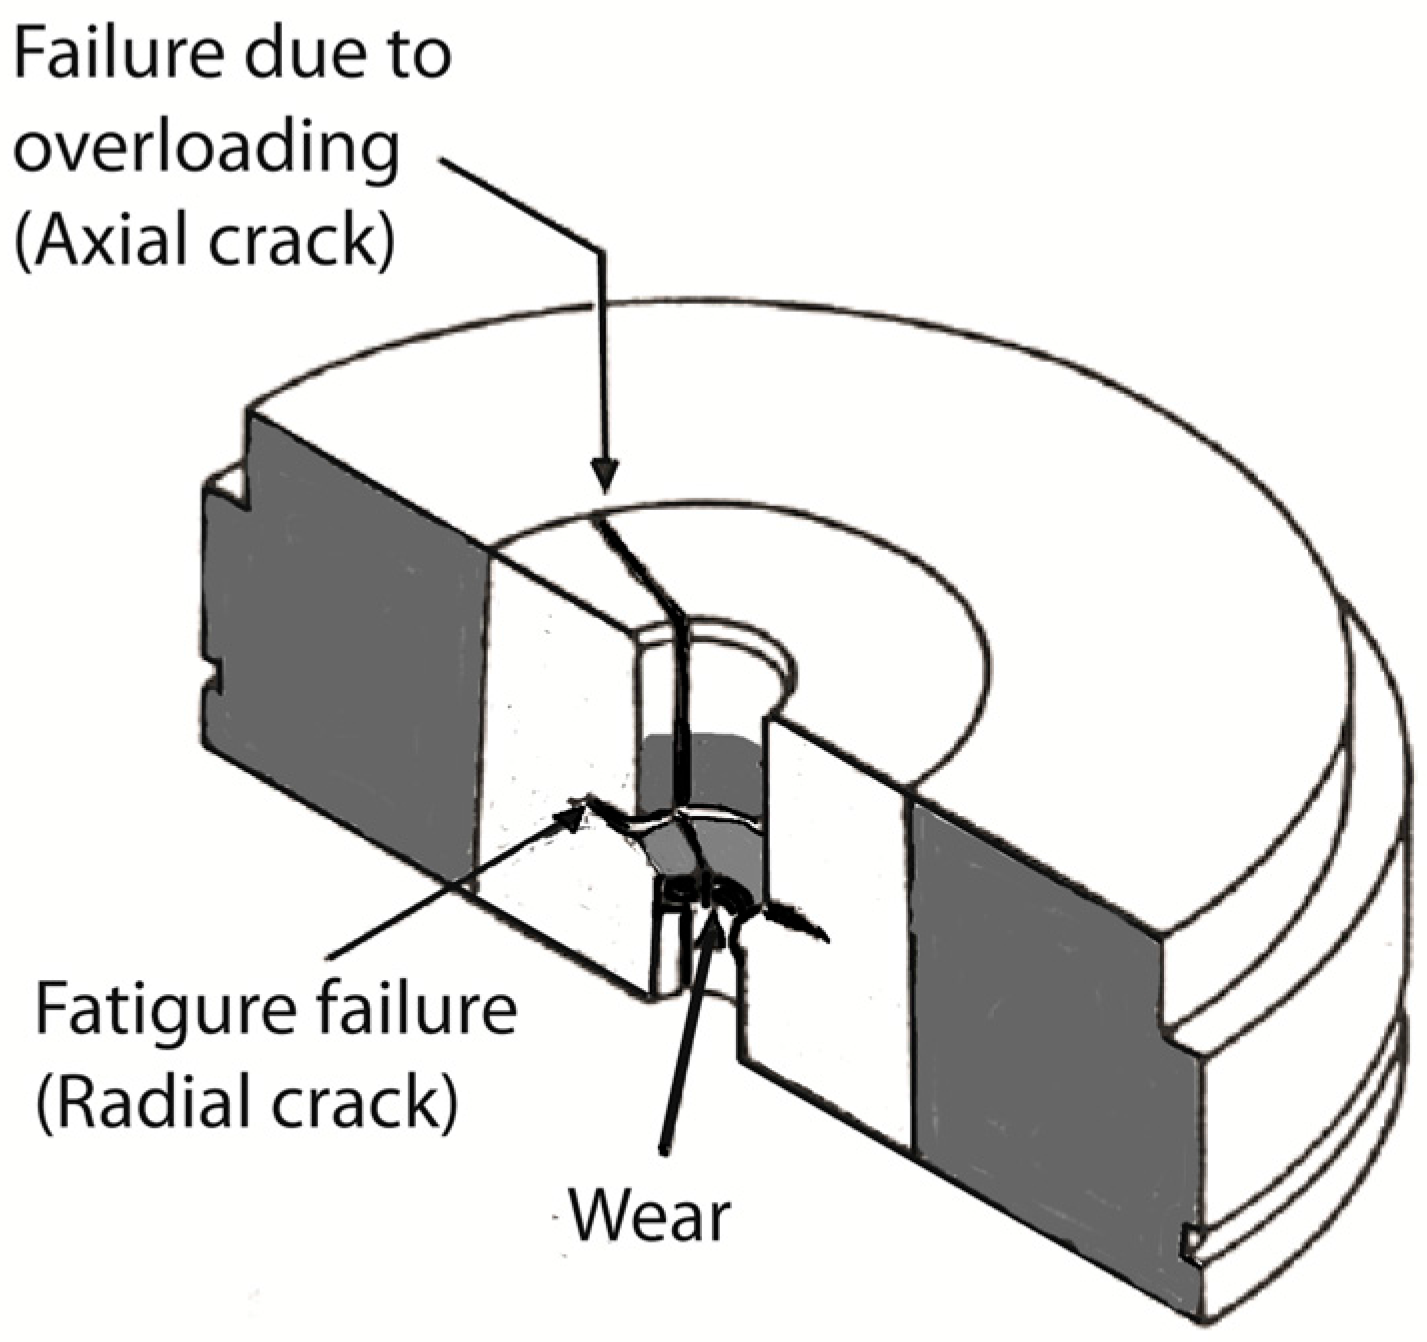
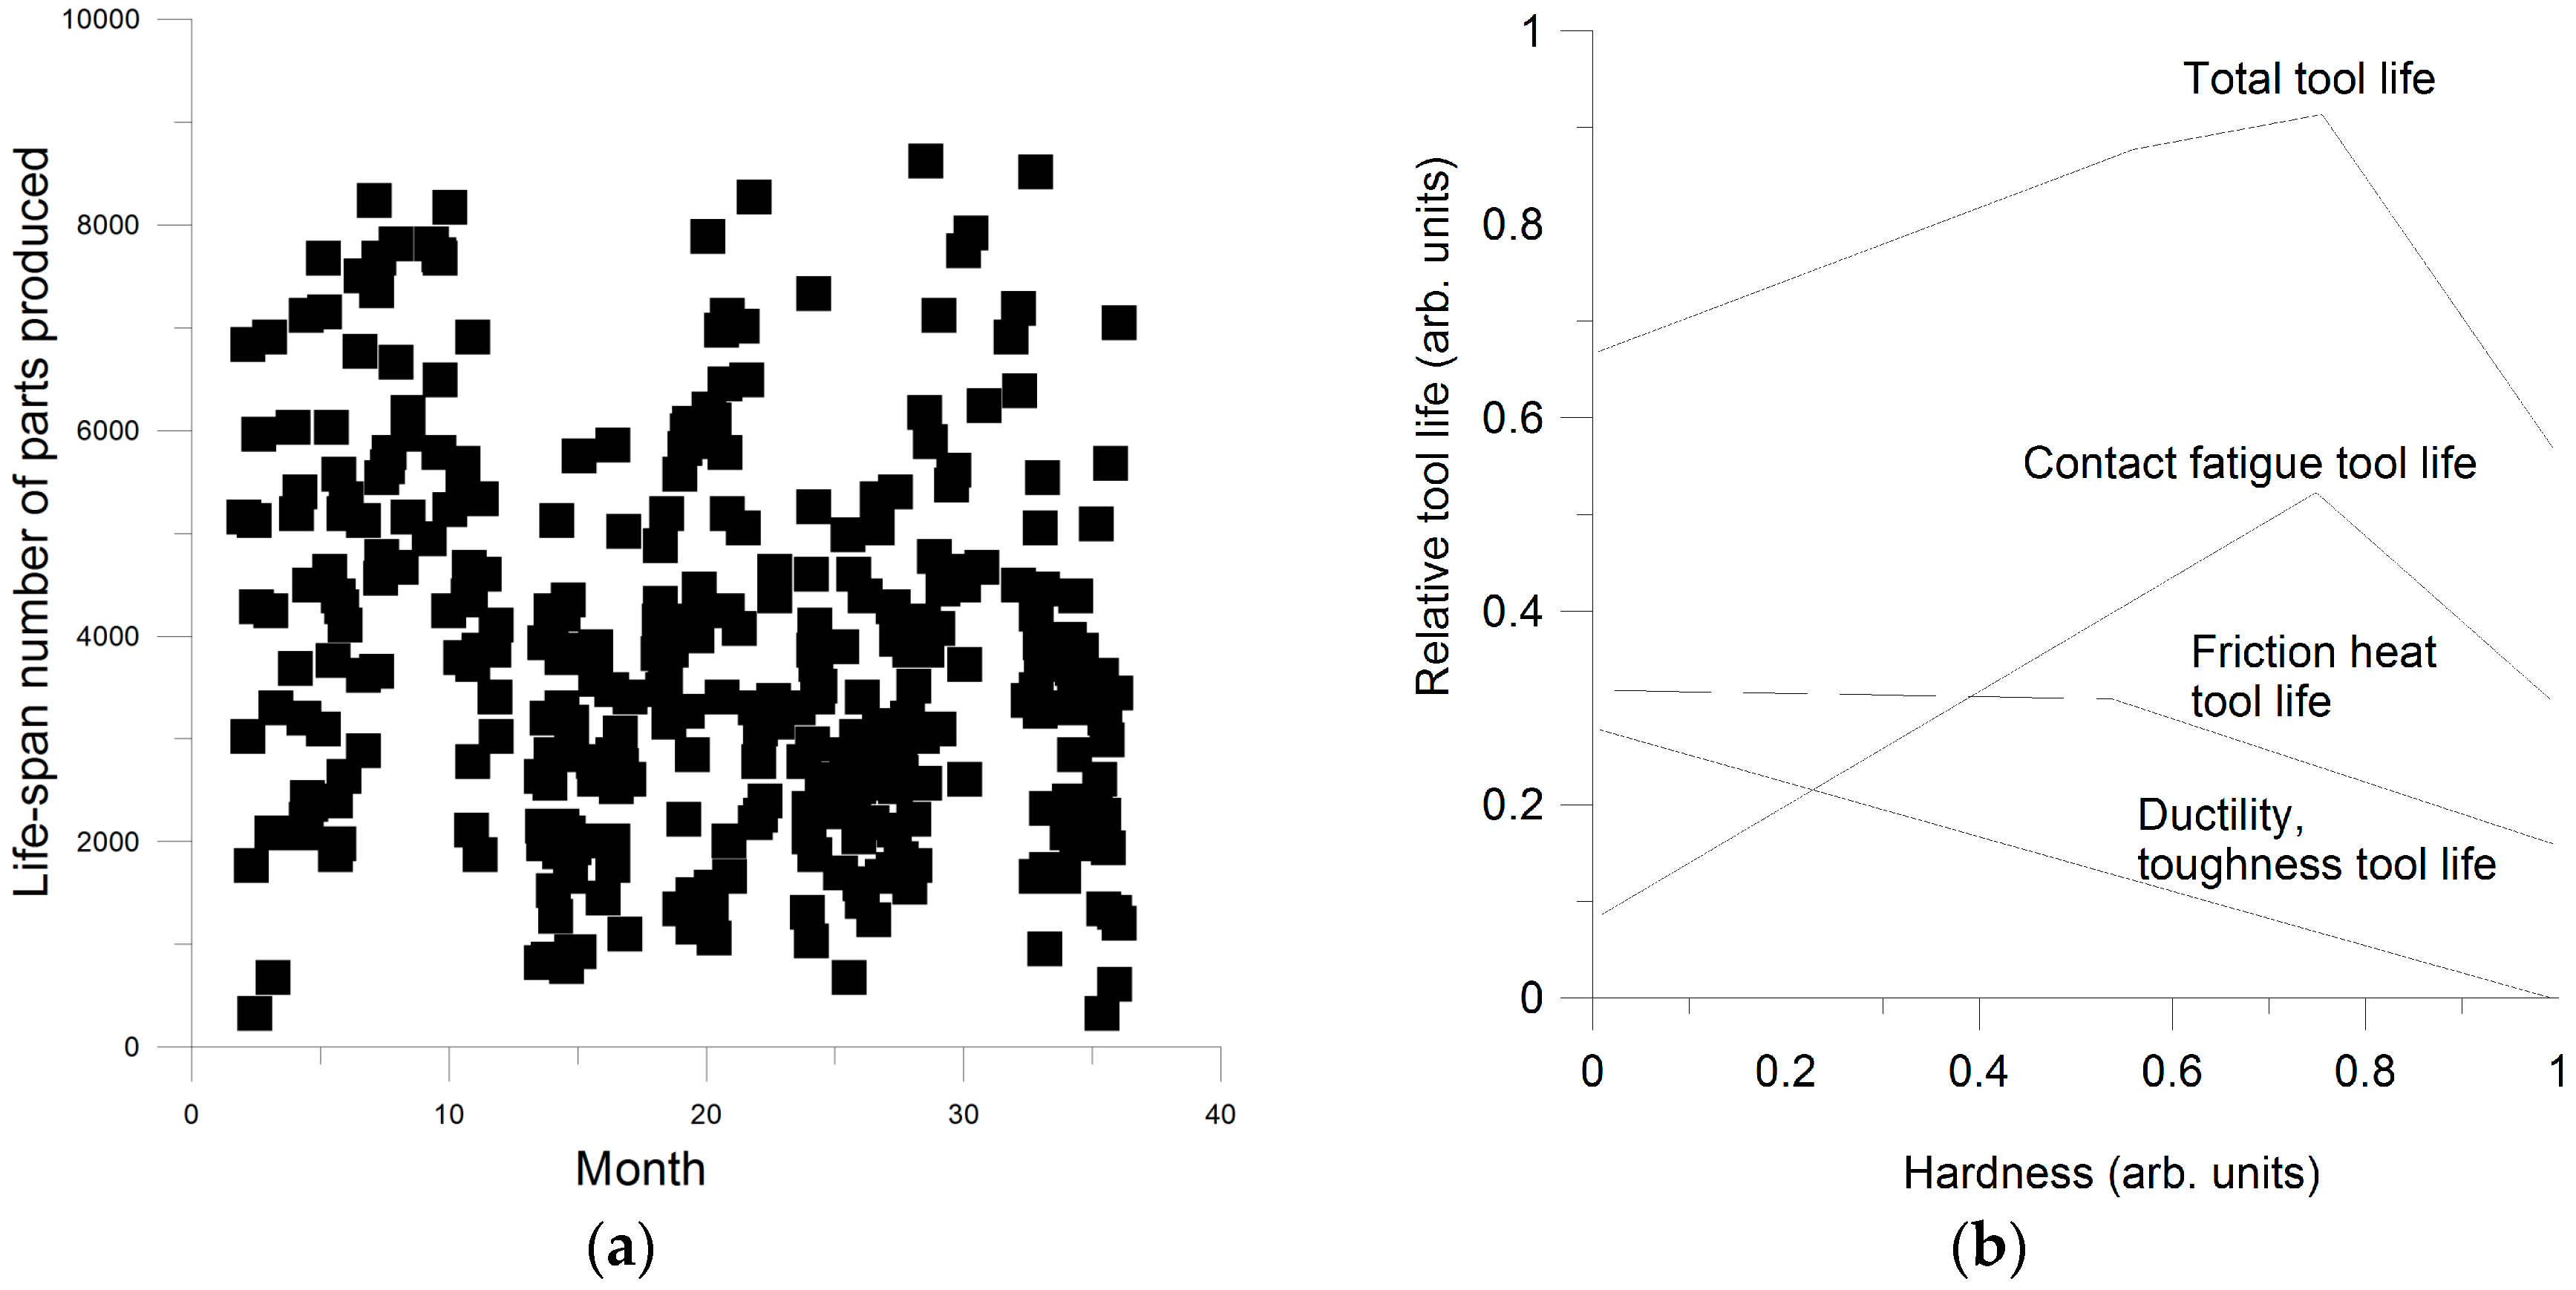
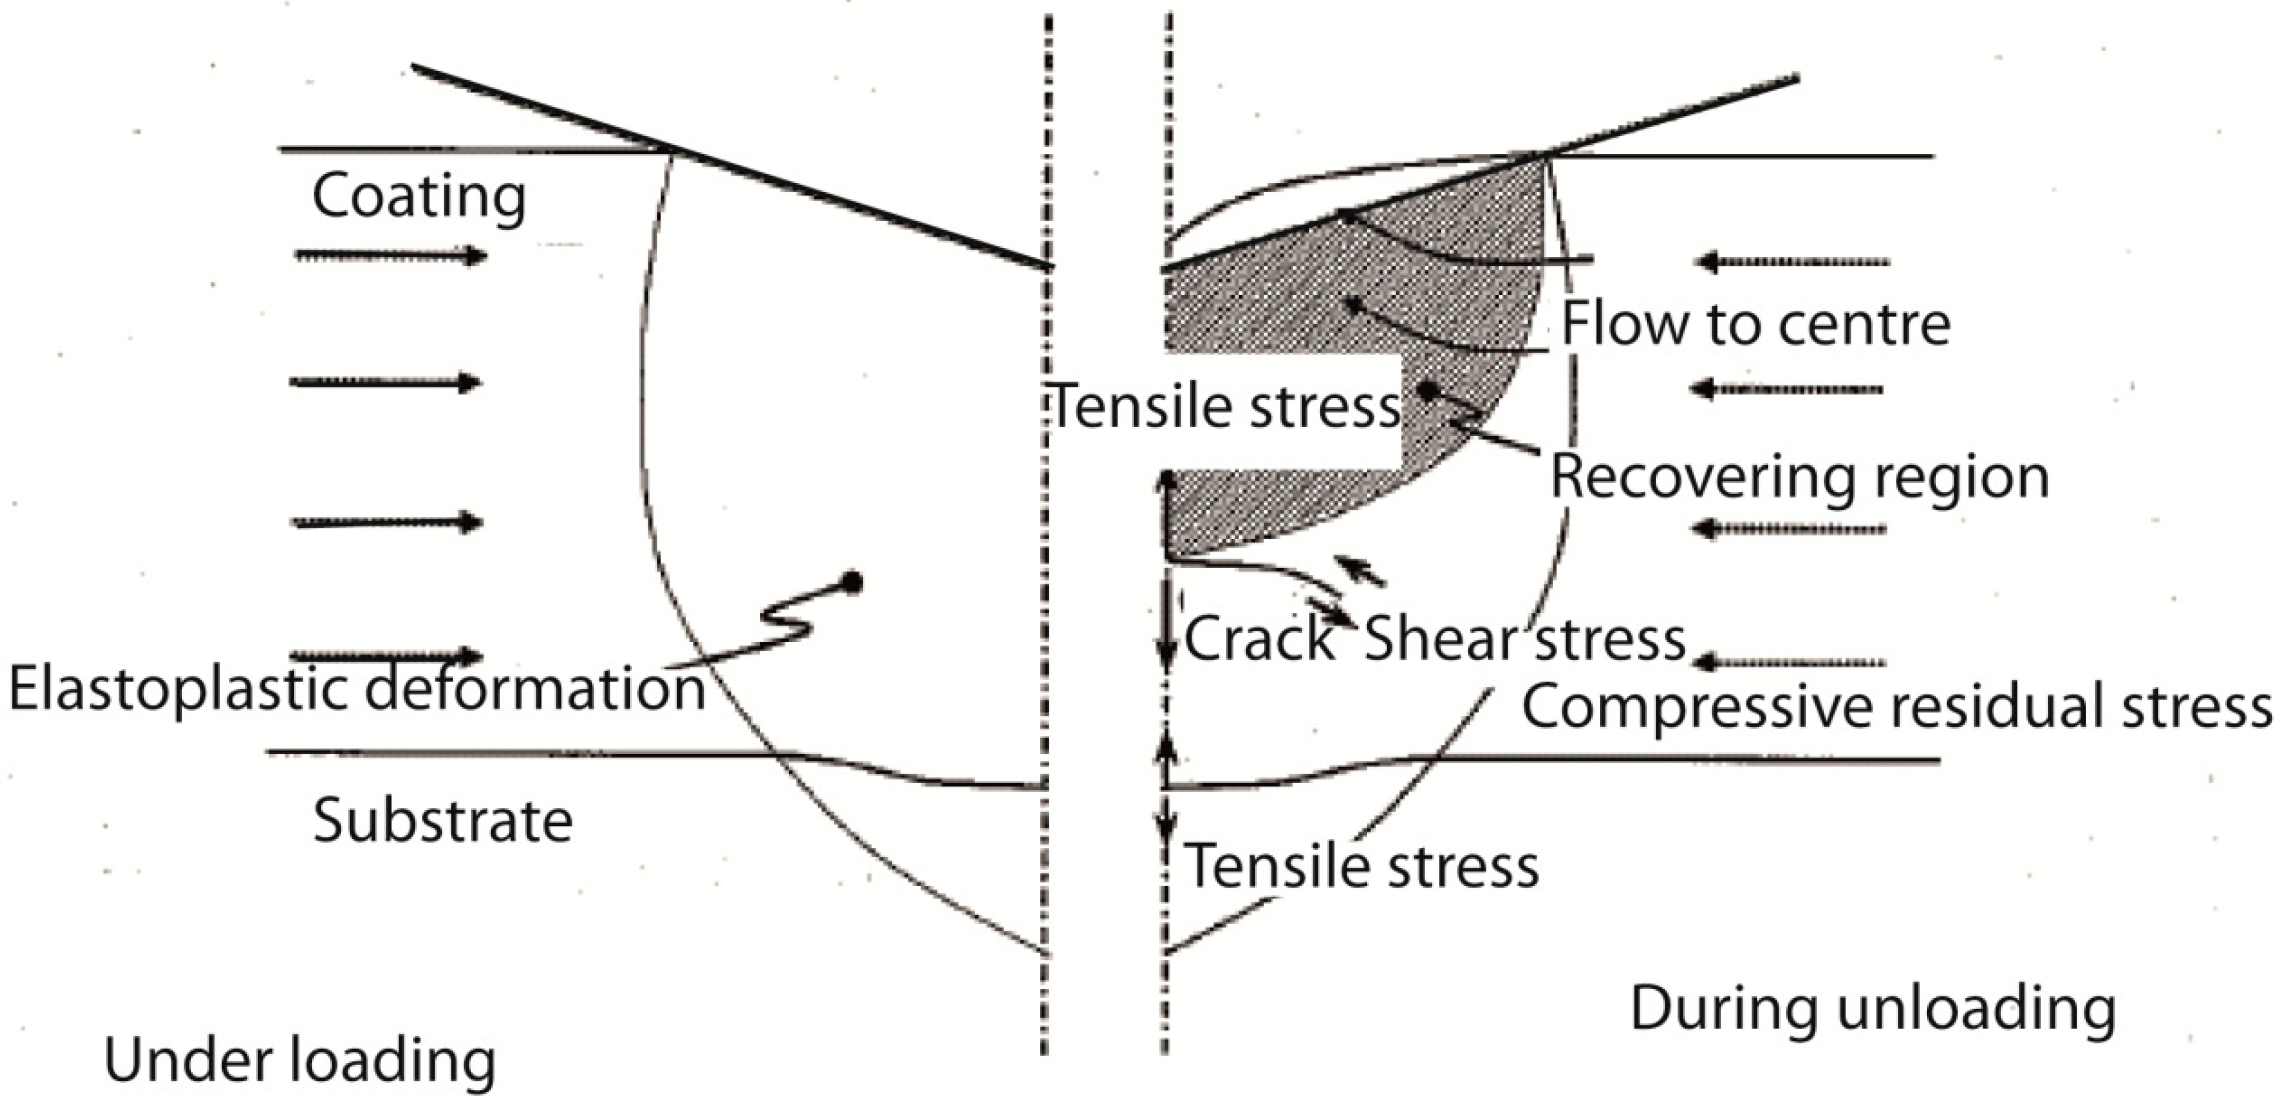
2.1. Observed Tooling Life Span Variation and Failure
- Accurately analyze and measure the tool material properties
- This involves understanding of the influence of the carbides and inclusions and their type, size and size distribution as well as clustering effects to evaluate their effects on:
- Fatigue crack initiation and growth
- Wear rates
- Accurately understand the influence of the surface conditions in the tooling
- Influence of the residual and overlay stresses in the tool surface
- Influence of surface finishing
- Influence of the type of coating and coating properties
- Understand how to characterize properties
- Capability to characterize the base material to be able to describe the nature and origin of the tool material property variation
- Capability to characterize the surface coating properties
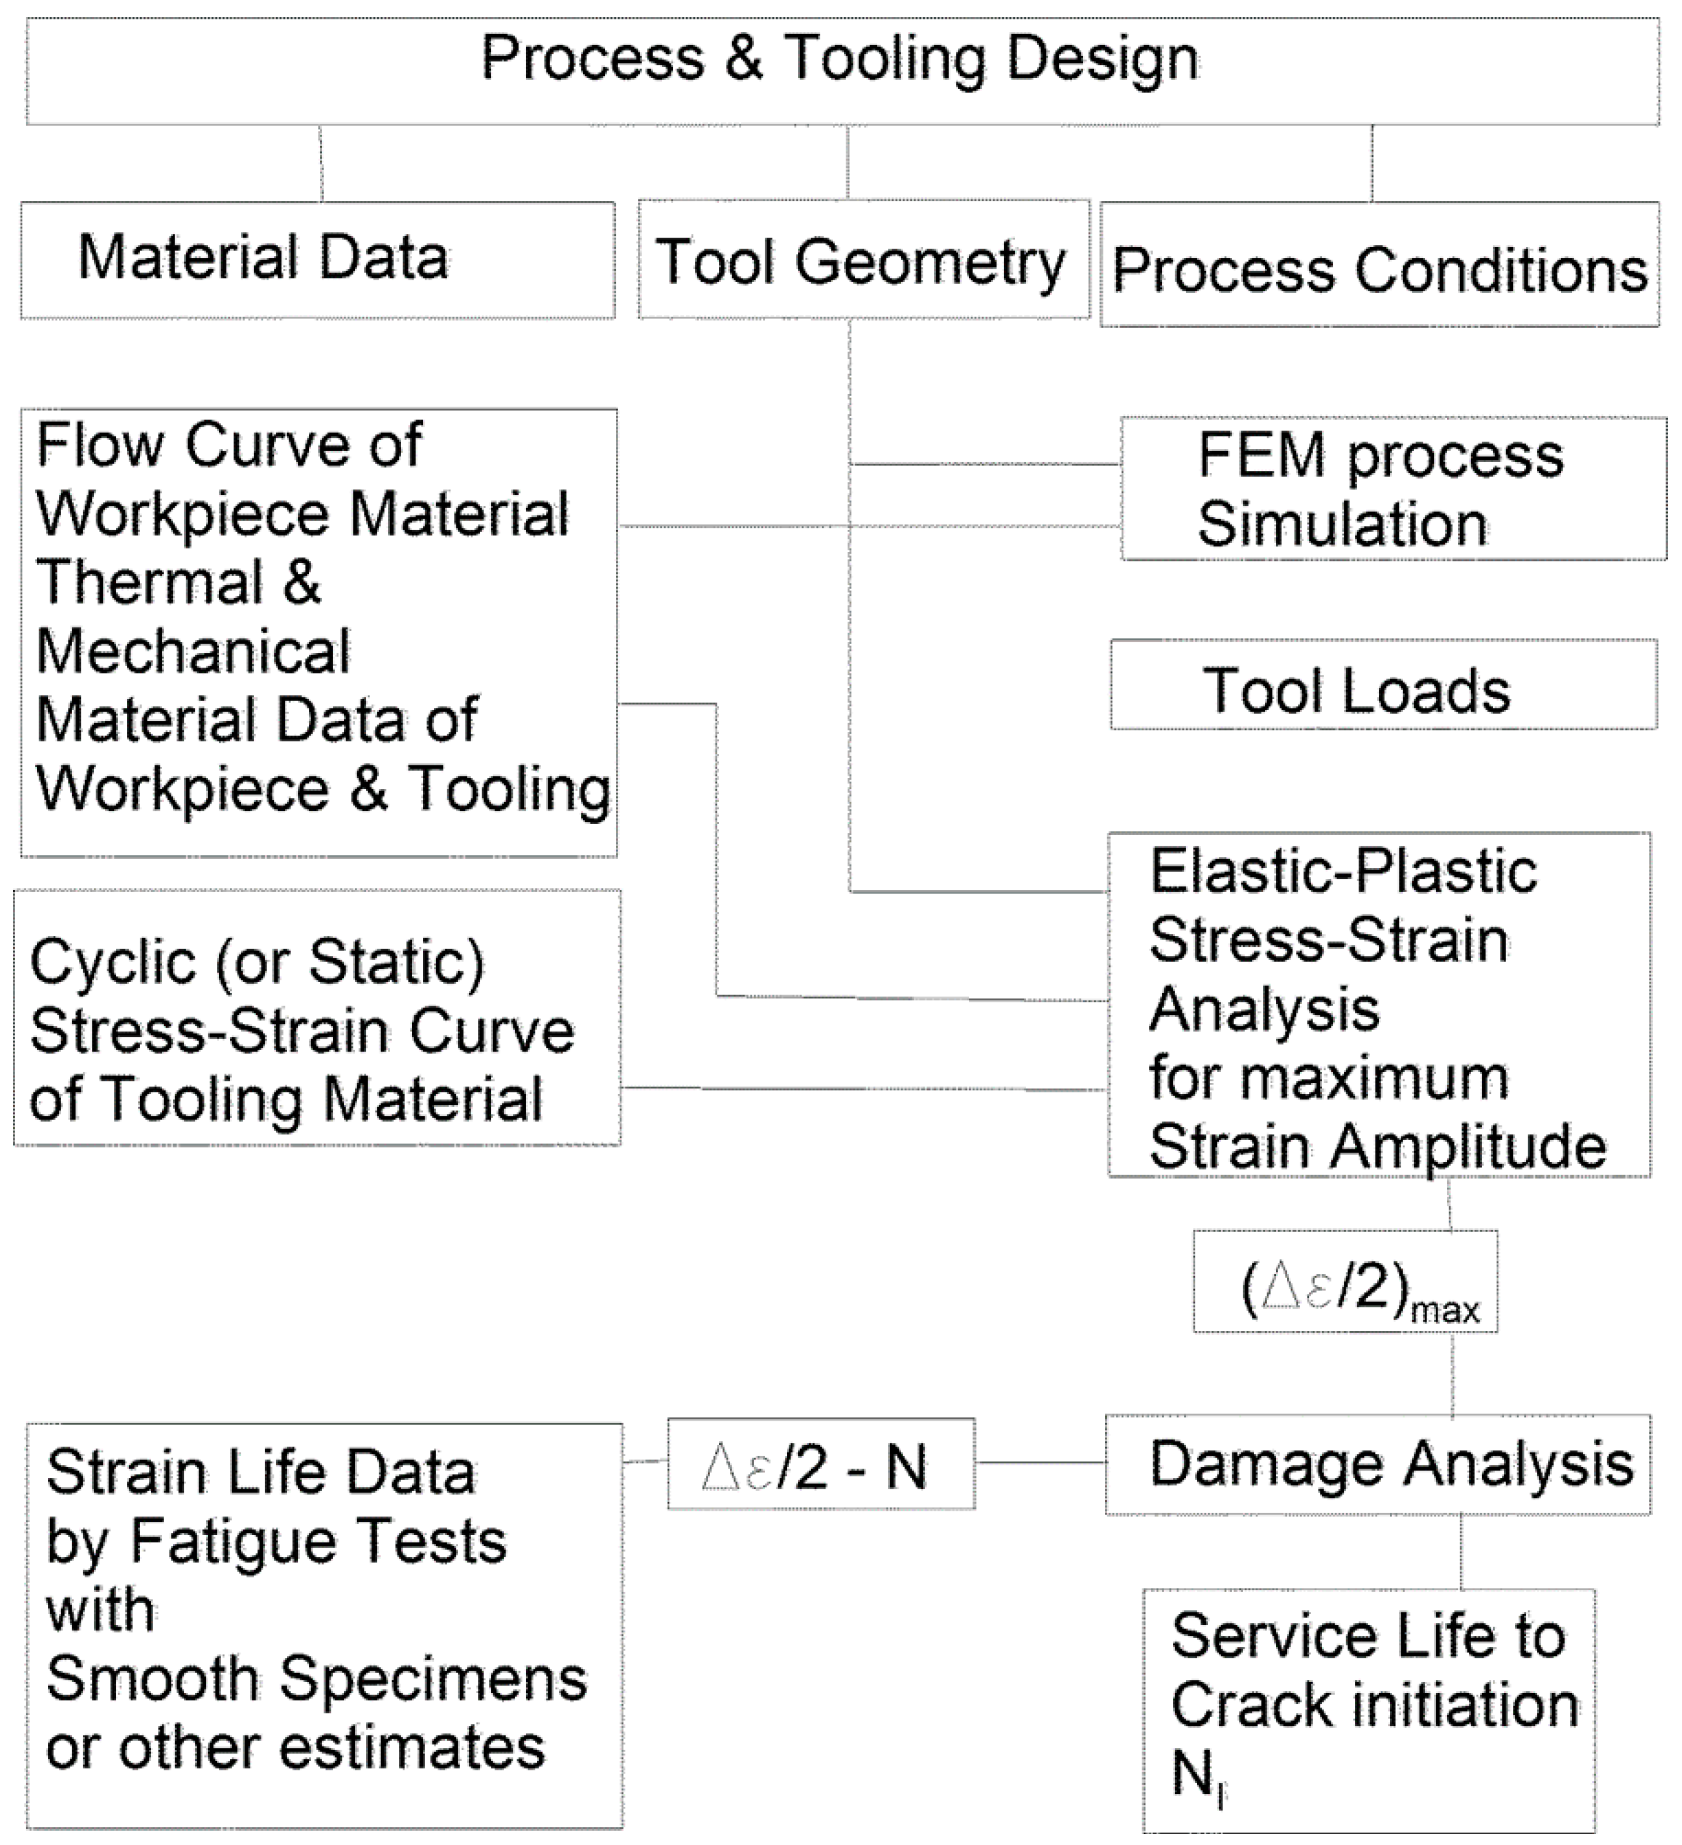
2.2. Principal Schemes for Simulation and Prediction of Tool Life
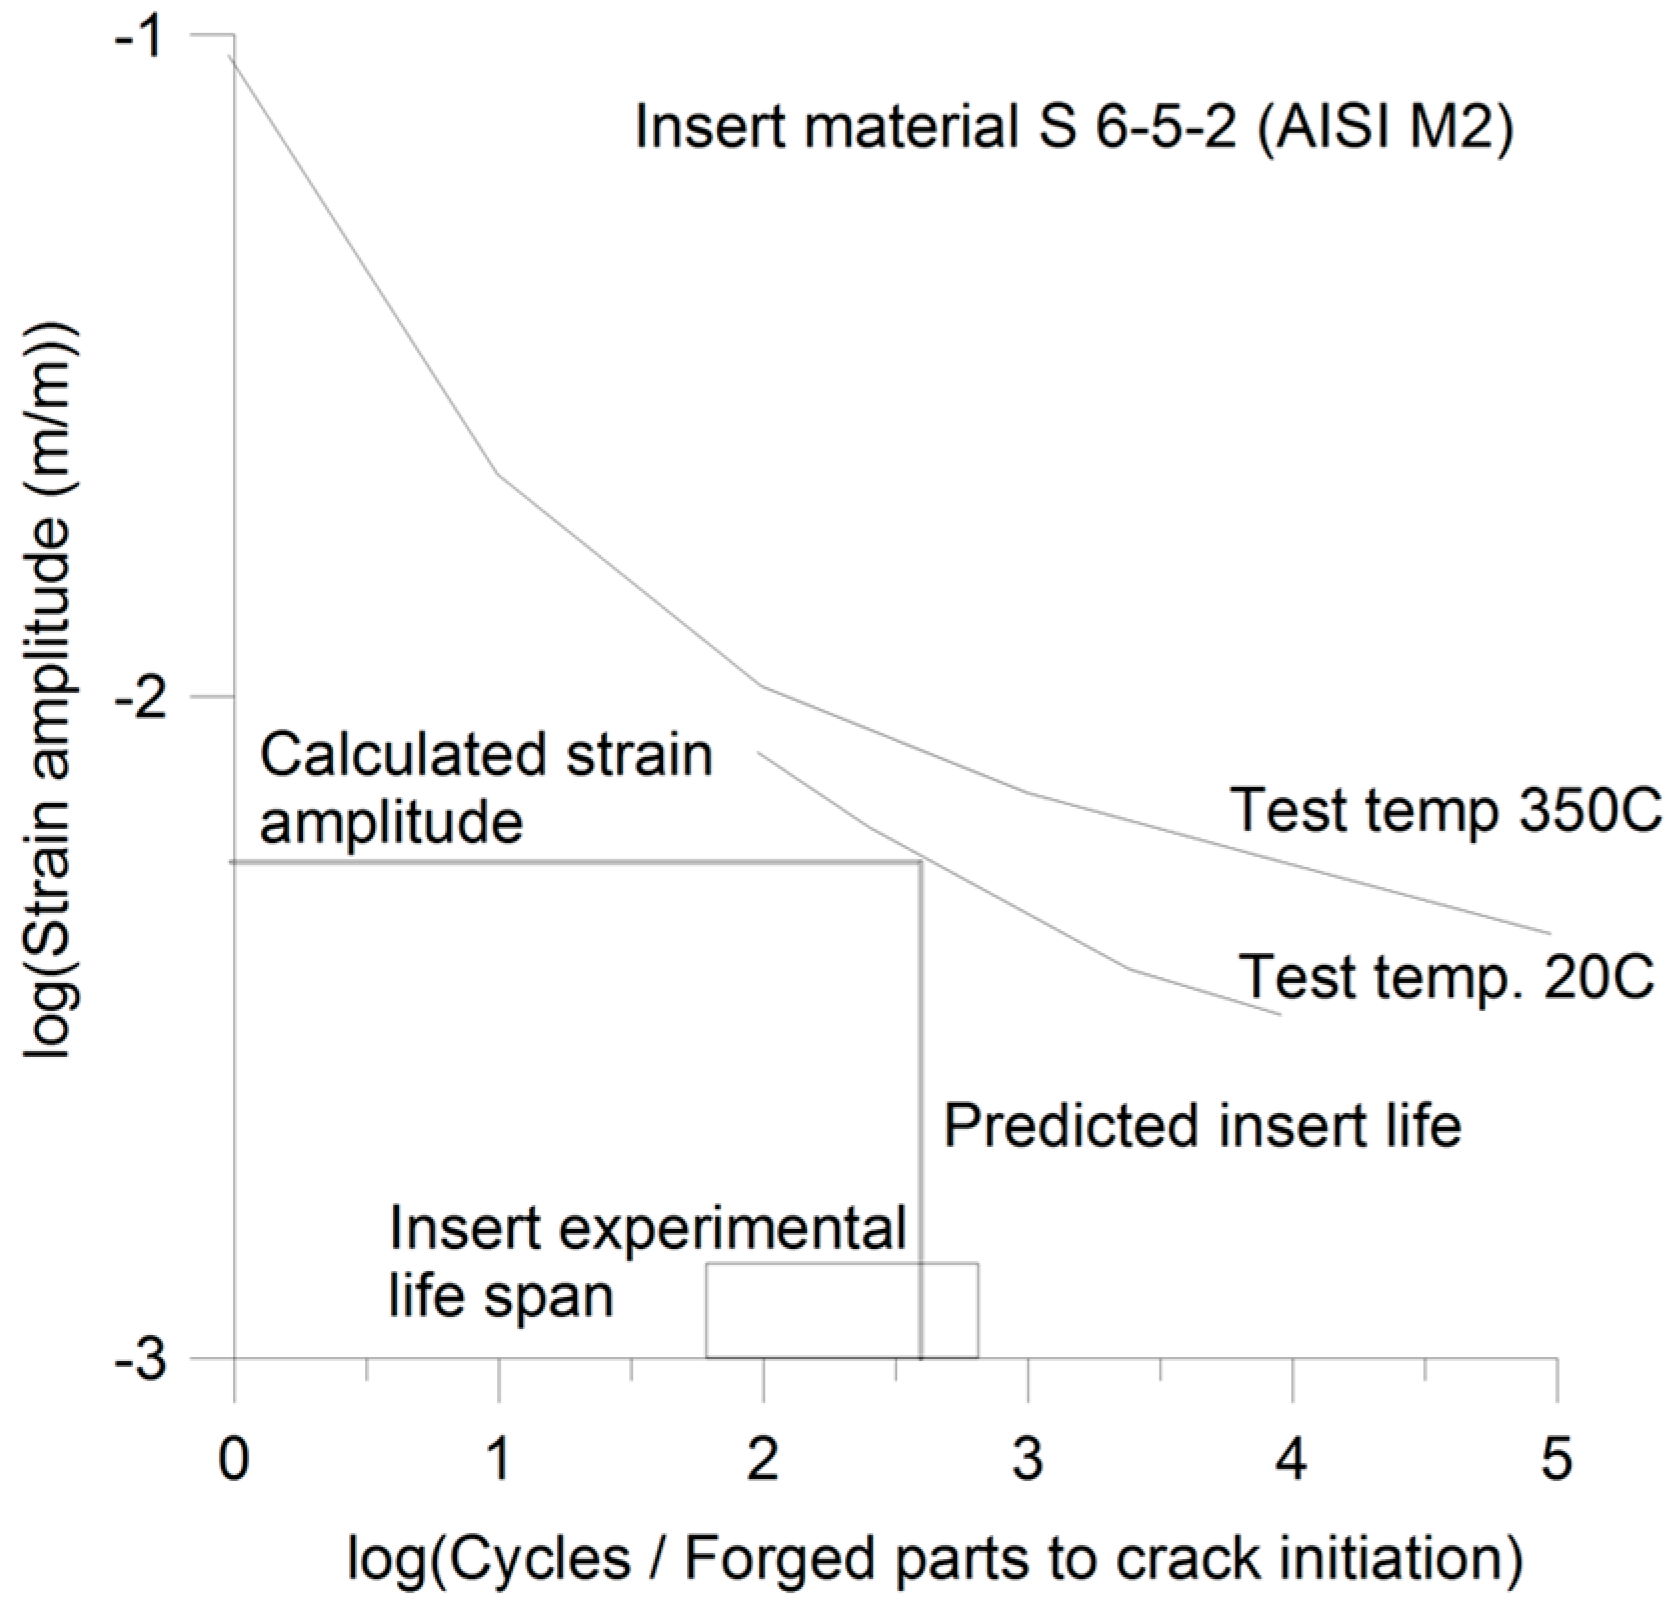
2.2.1. Fatigue Life Modeling
- Tool load (contact stress distribution at the die-workpiece interface).
- FE based elastic-plastic stress-strain analysis (stress-strain curve required).
- A minimum of two loading cycles to determine the cyclic response of the tooling at the highest loaded zone.
2.2.2. Wear Life Modeling
3. Material Properties and Implications for Tool-Life
- the determination of load and
- the determination of strength
- the deviations from perfect geometry;
- uncertainties in the state of pre-stressing of the die;
- uncertainties in the strength of the material; and
- deviations from ideal surface conditions.
- quantifying the stochastic characteristics of primary parameters of influence, such as for example the surface topography;
- establishing the distribution functions of load and strength; and
- determining the failure probability and its evolution.
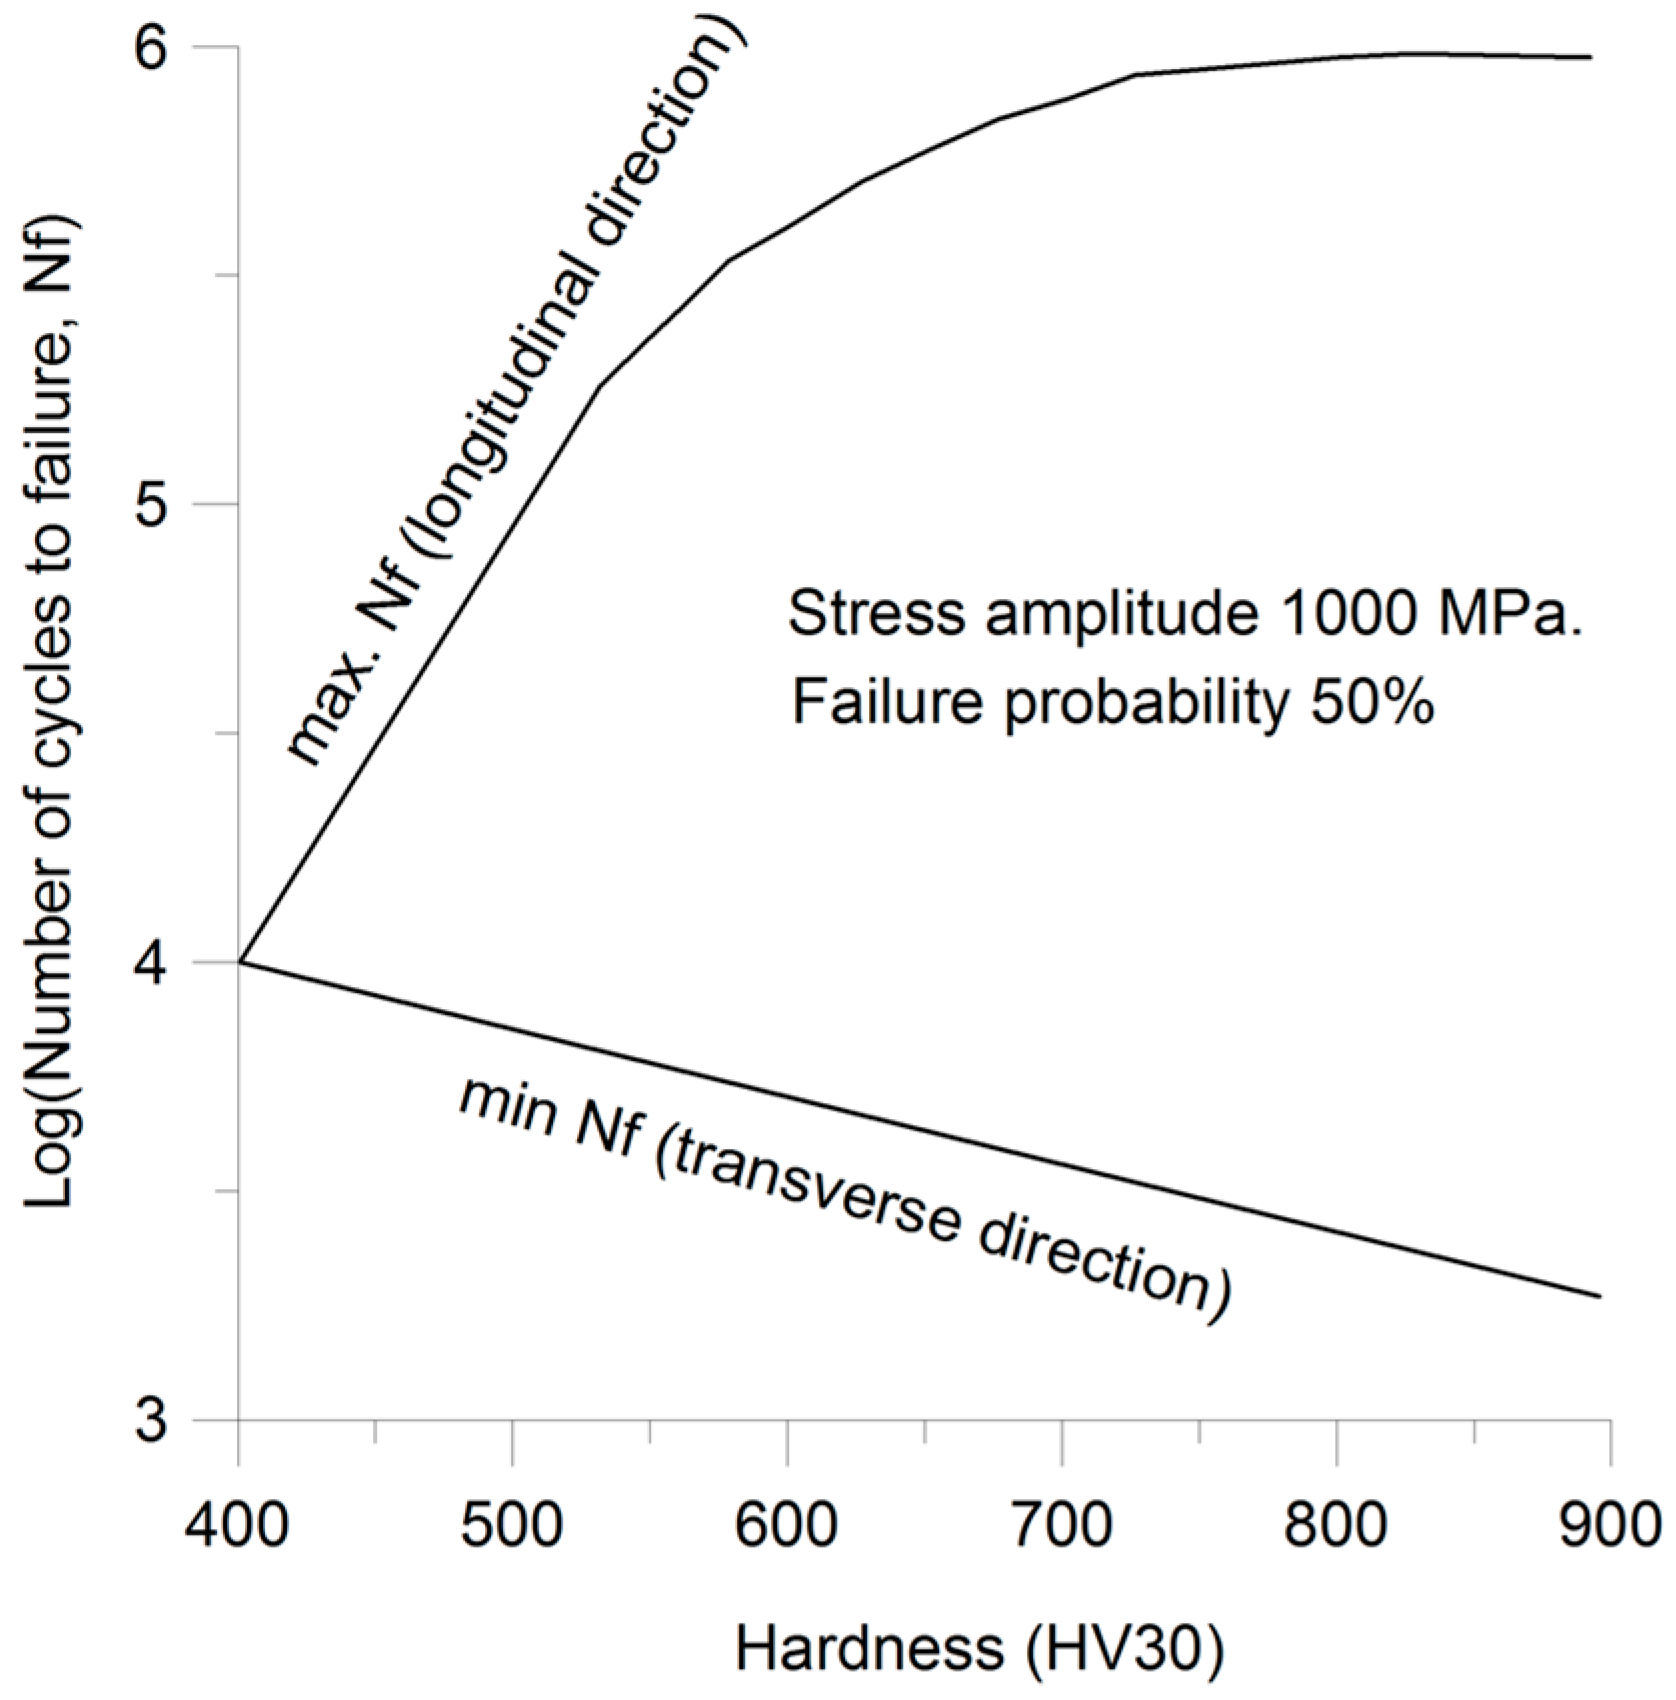
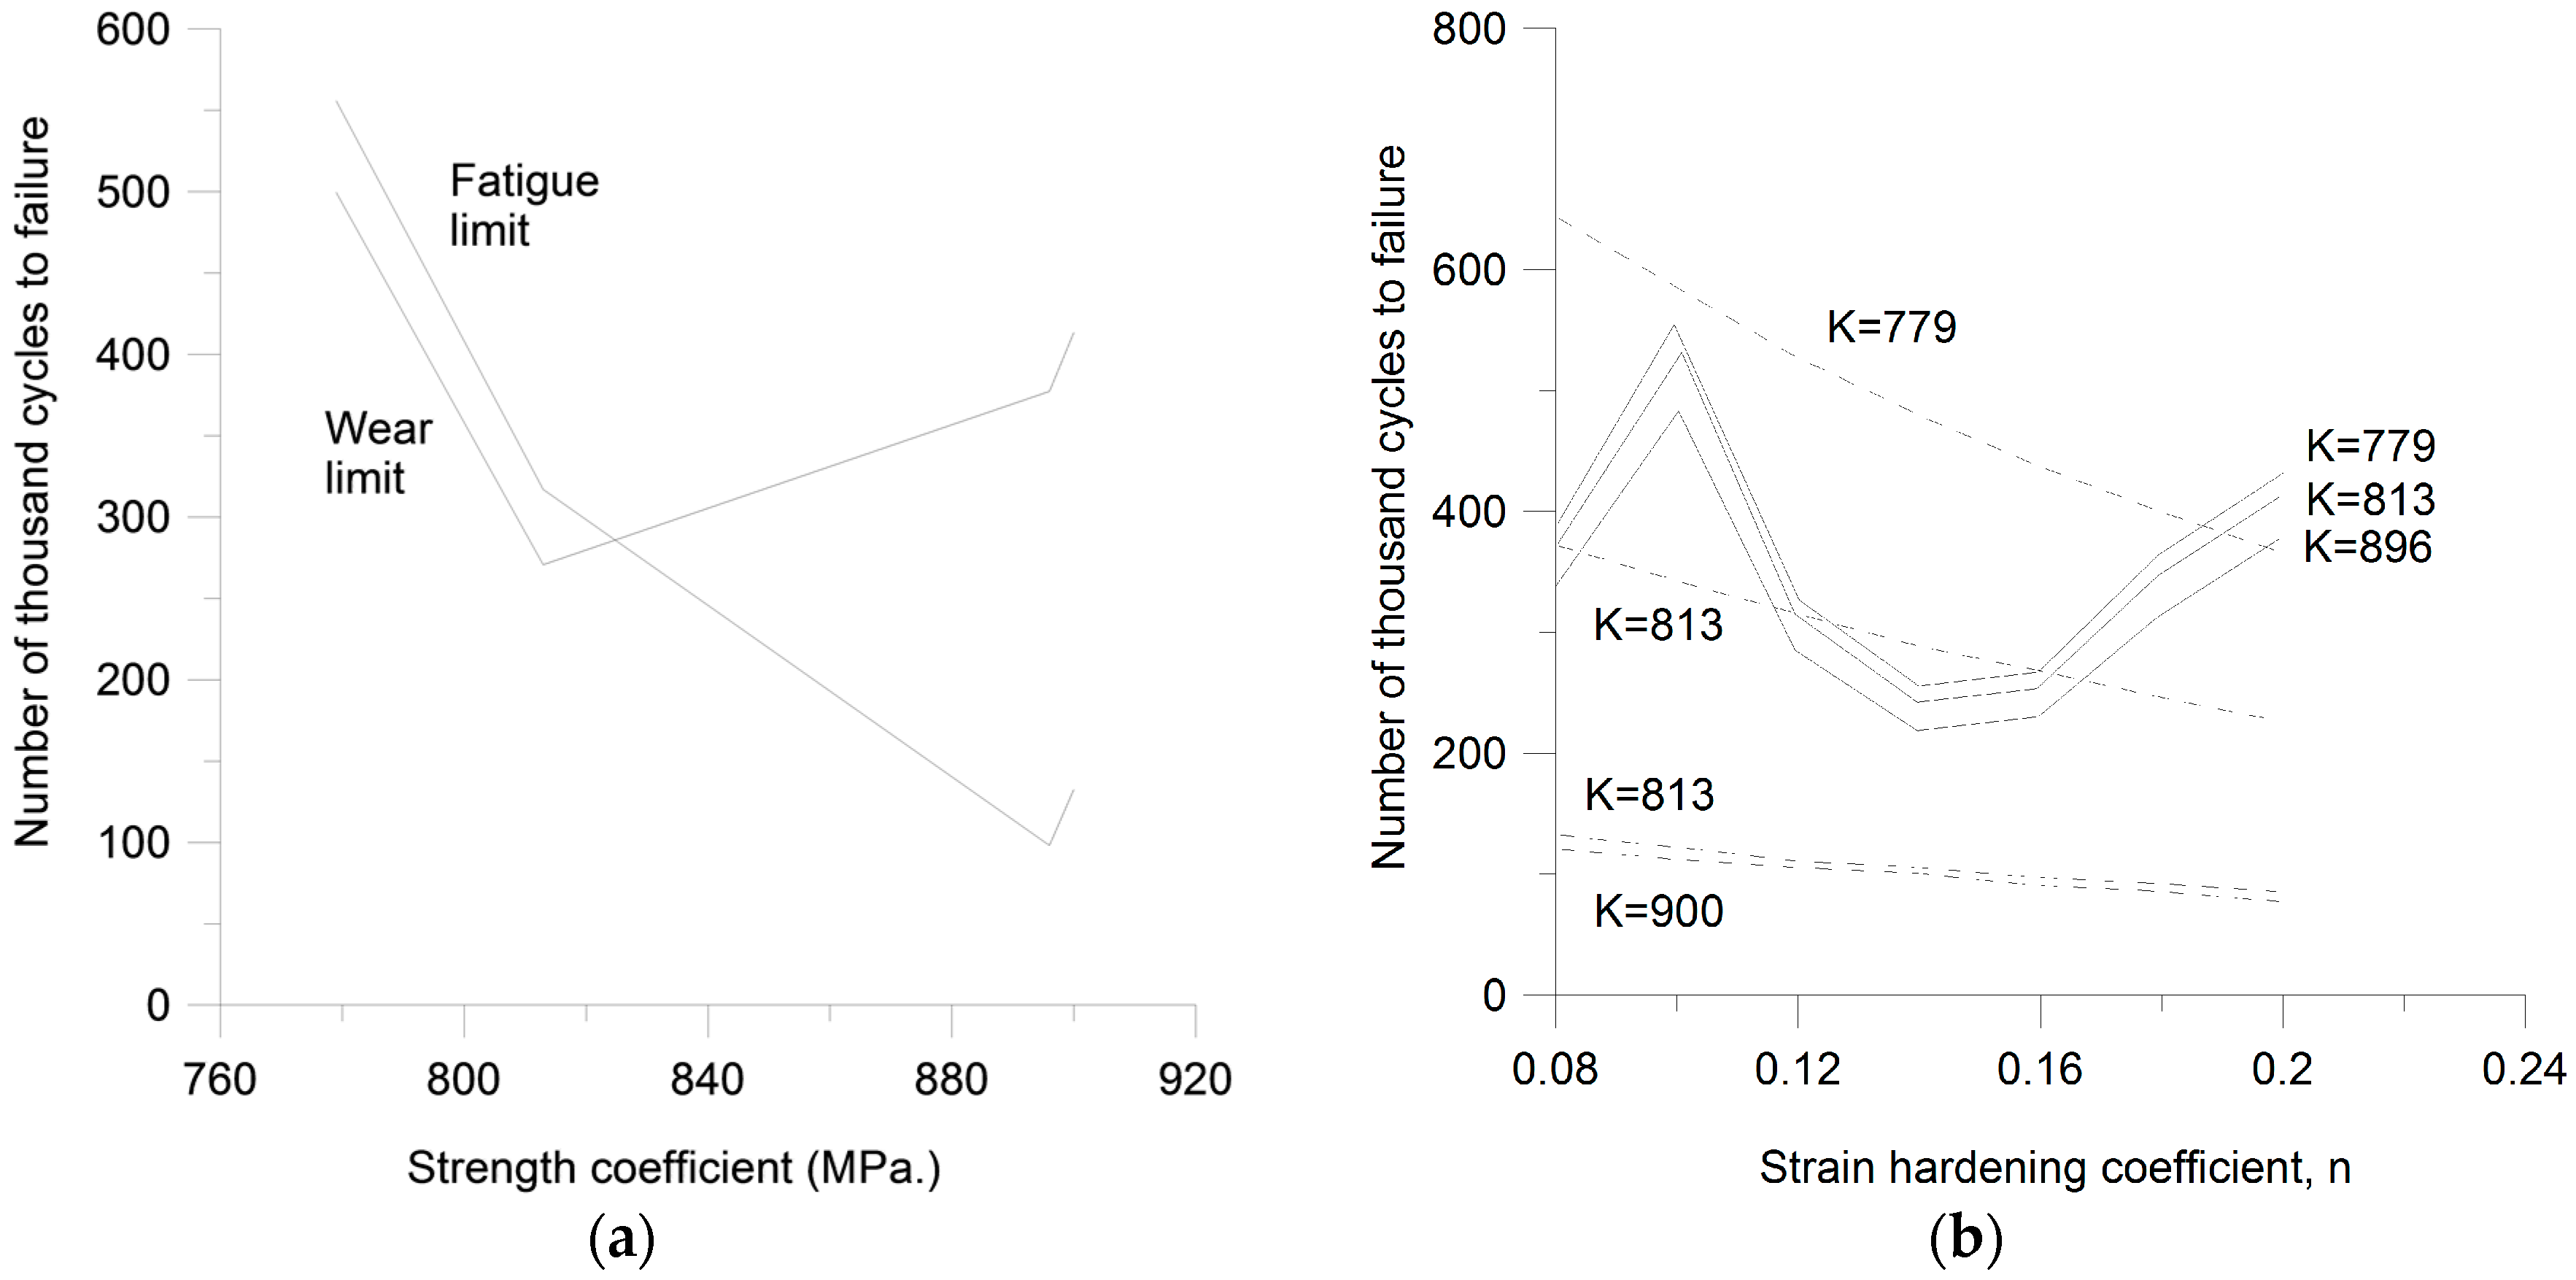
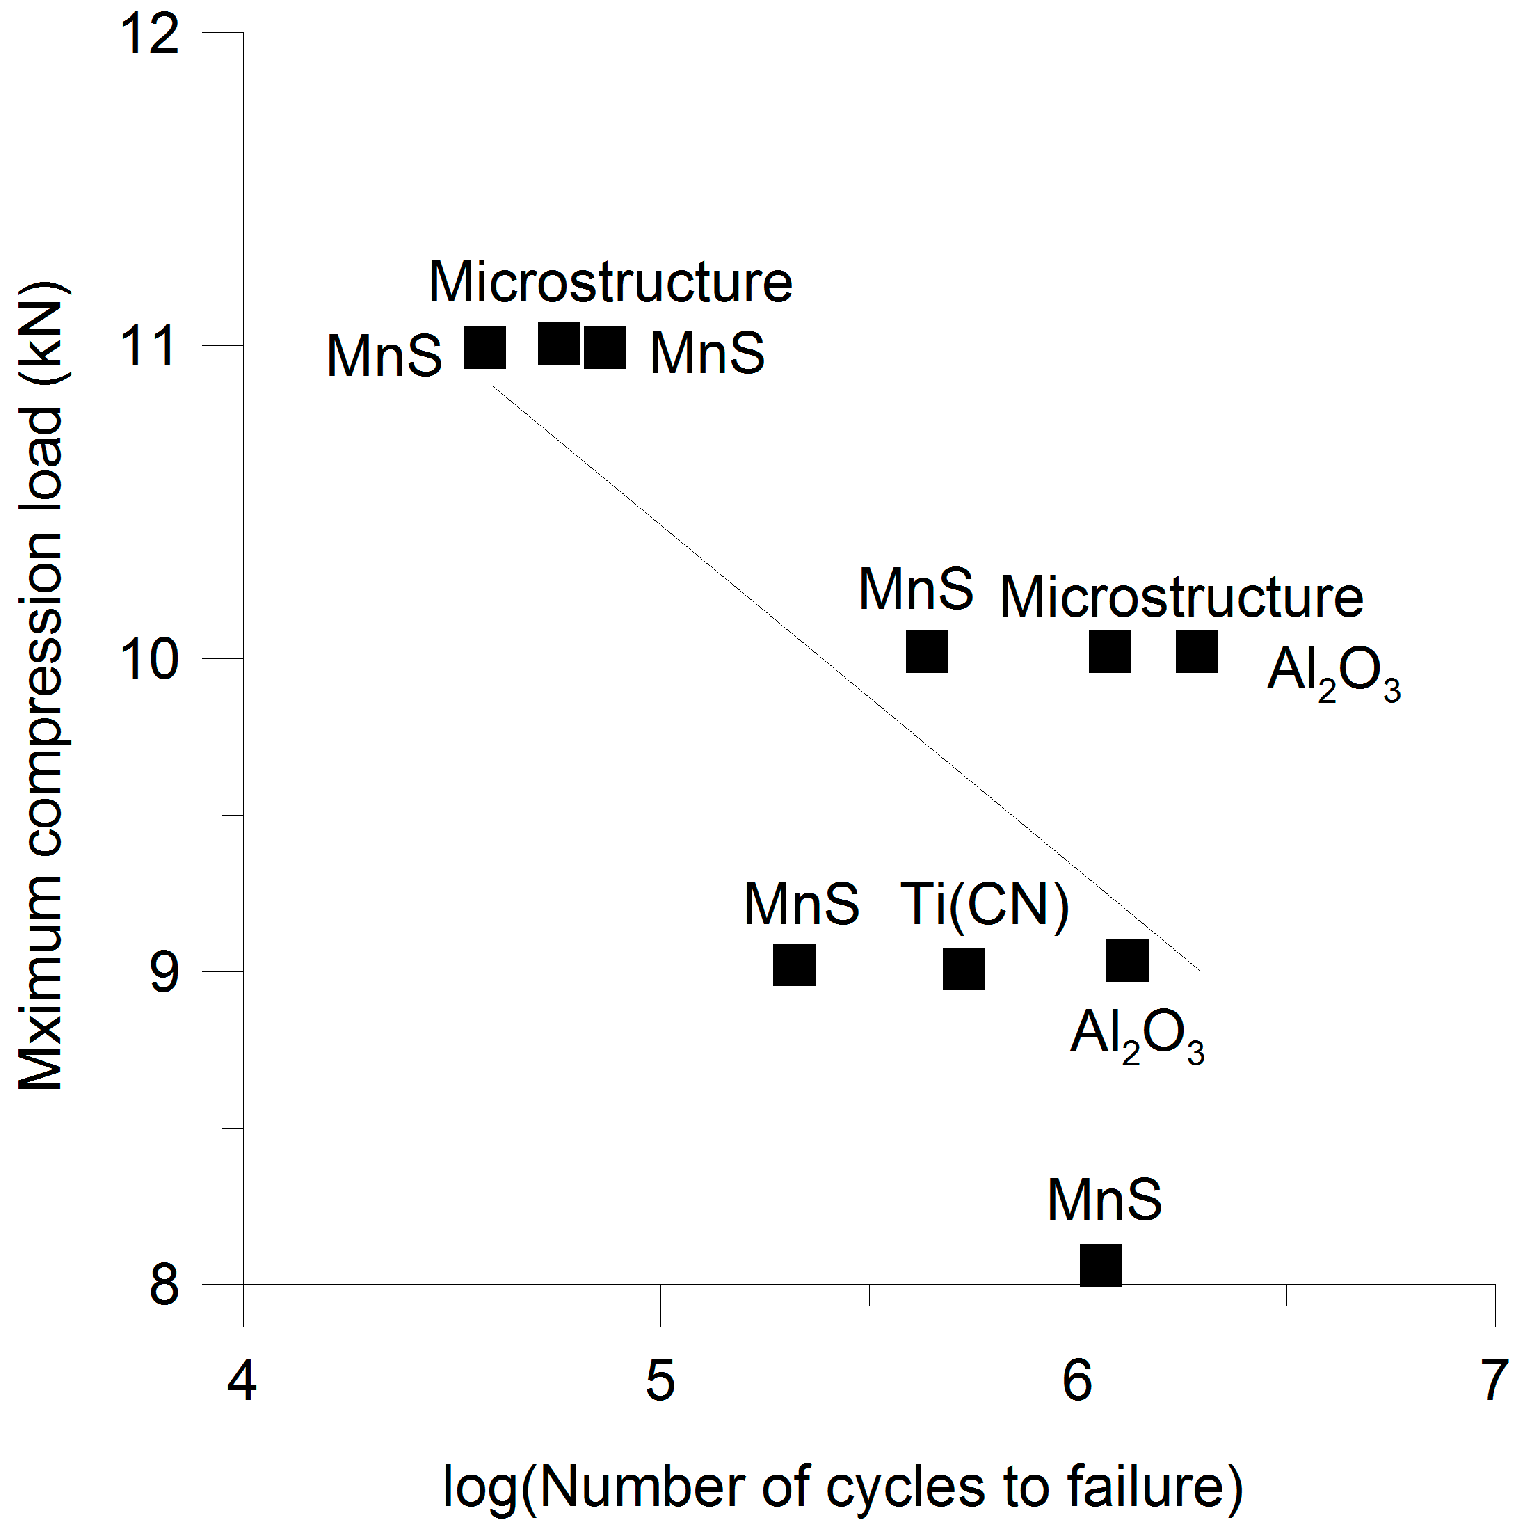
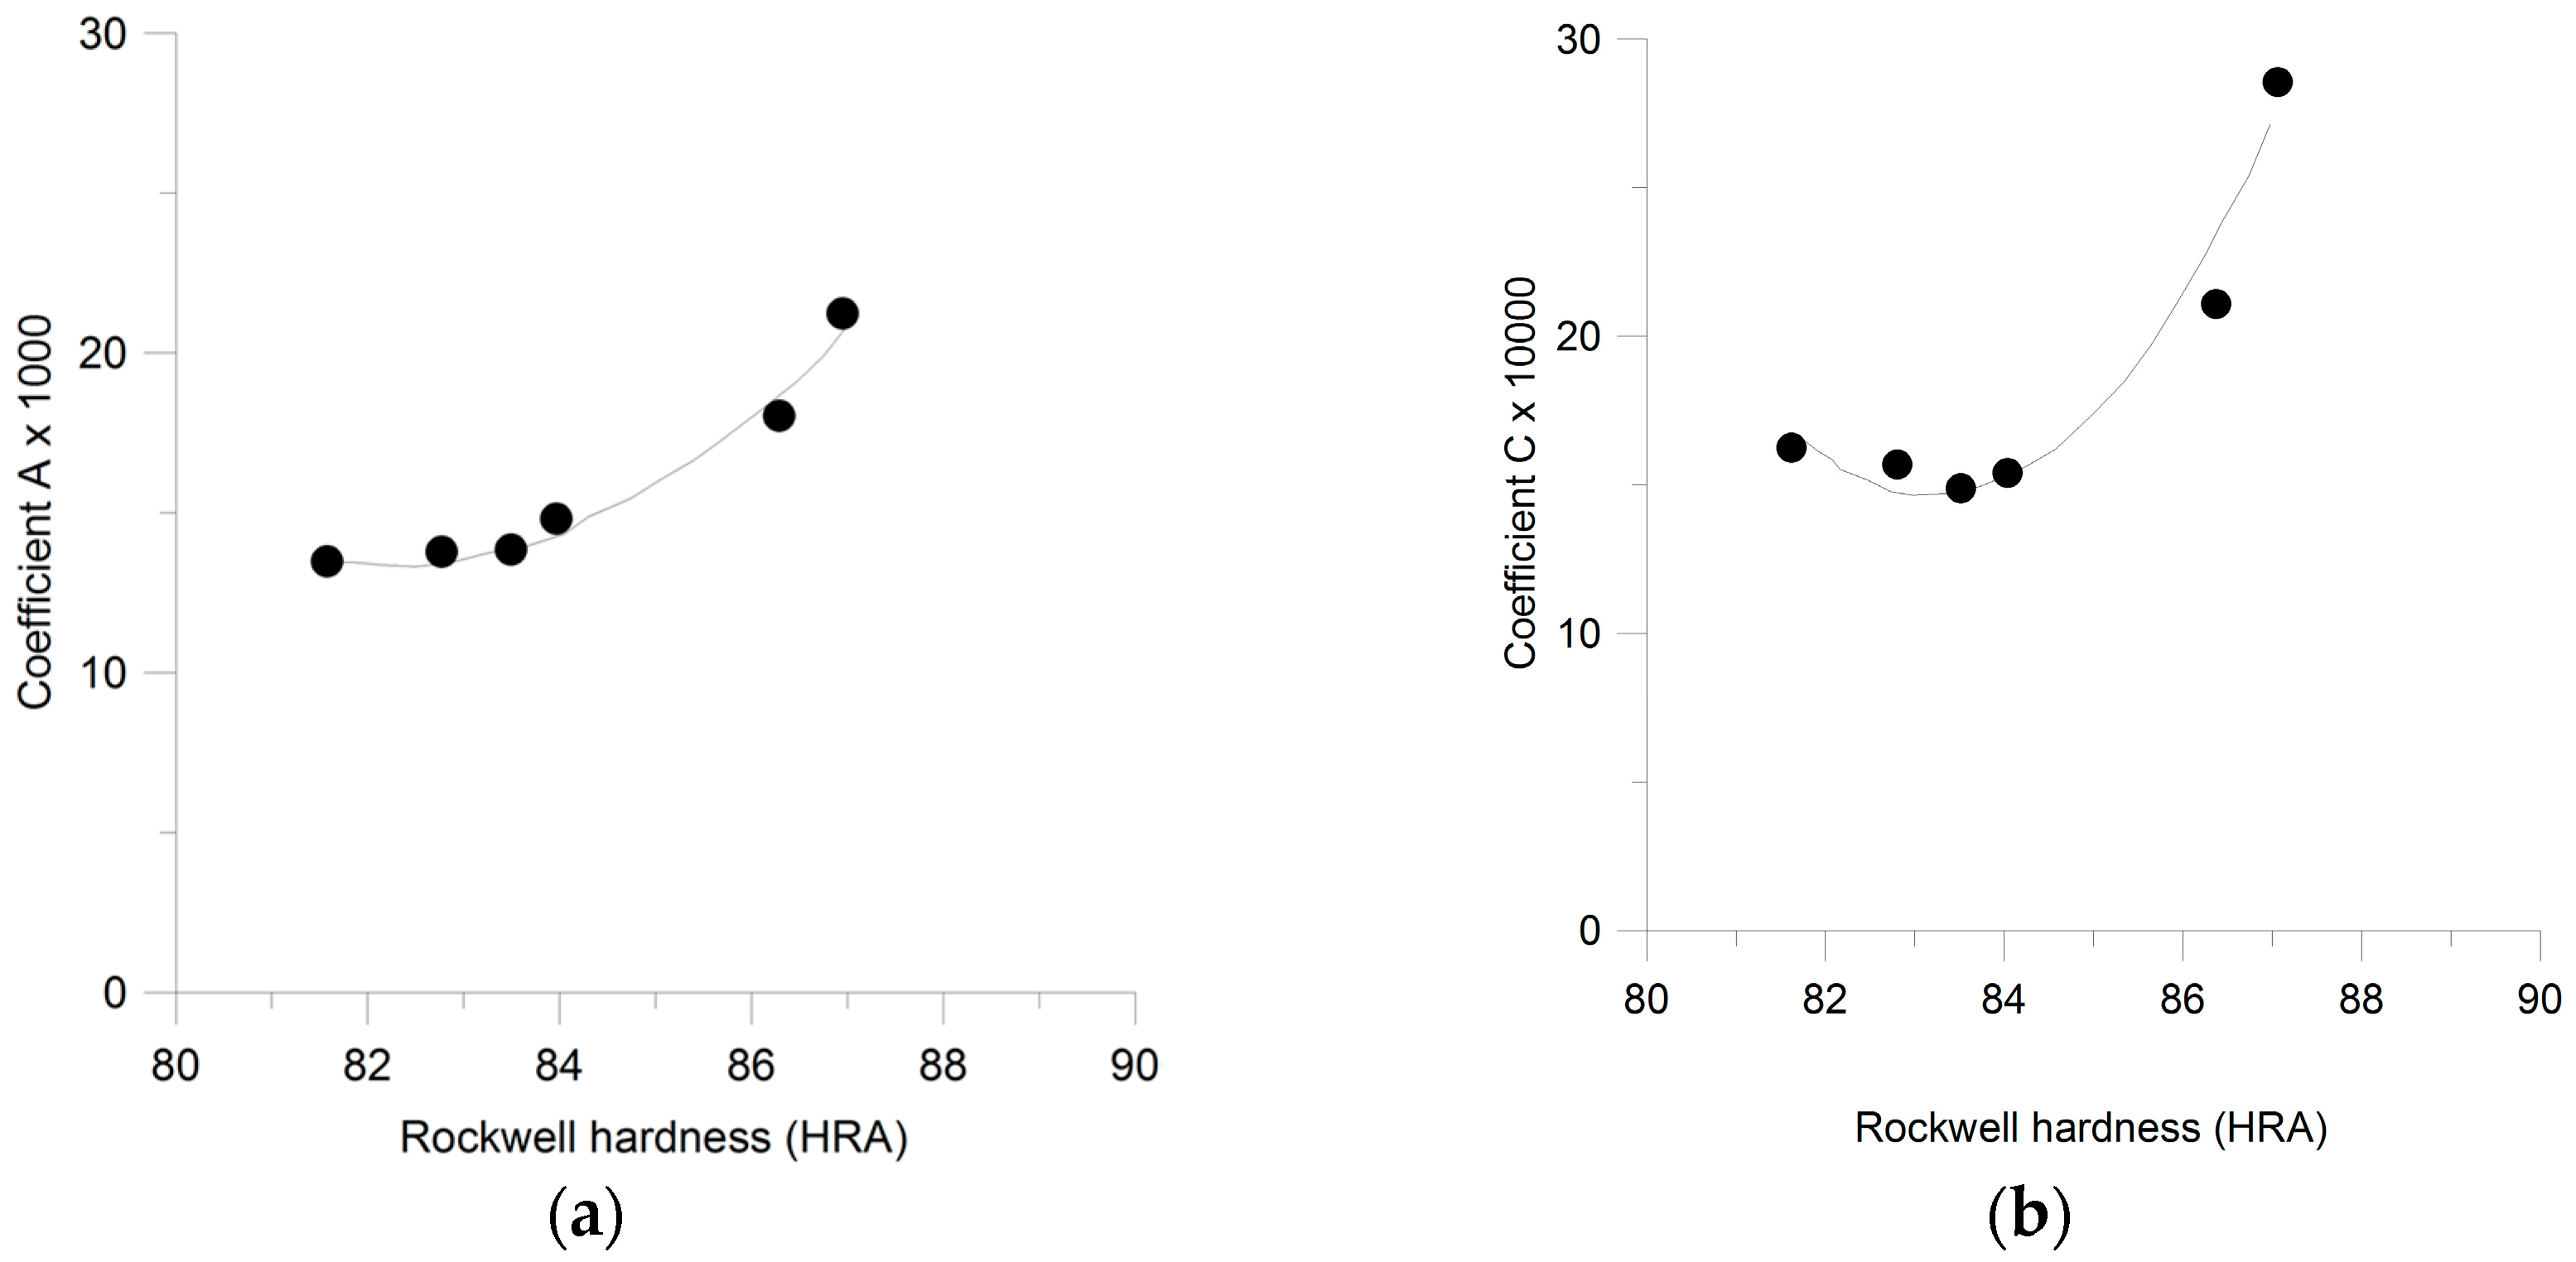
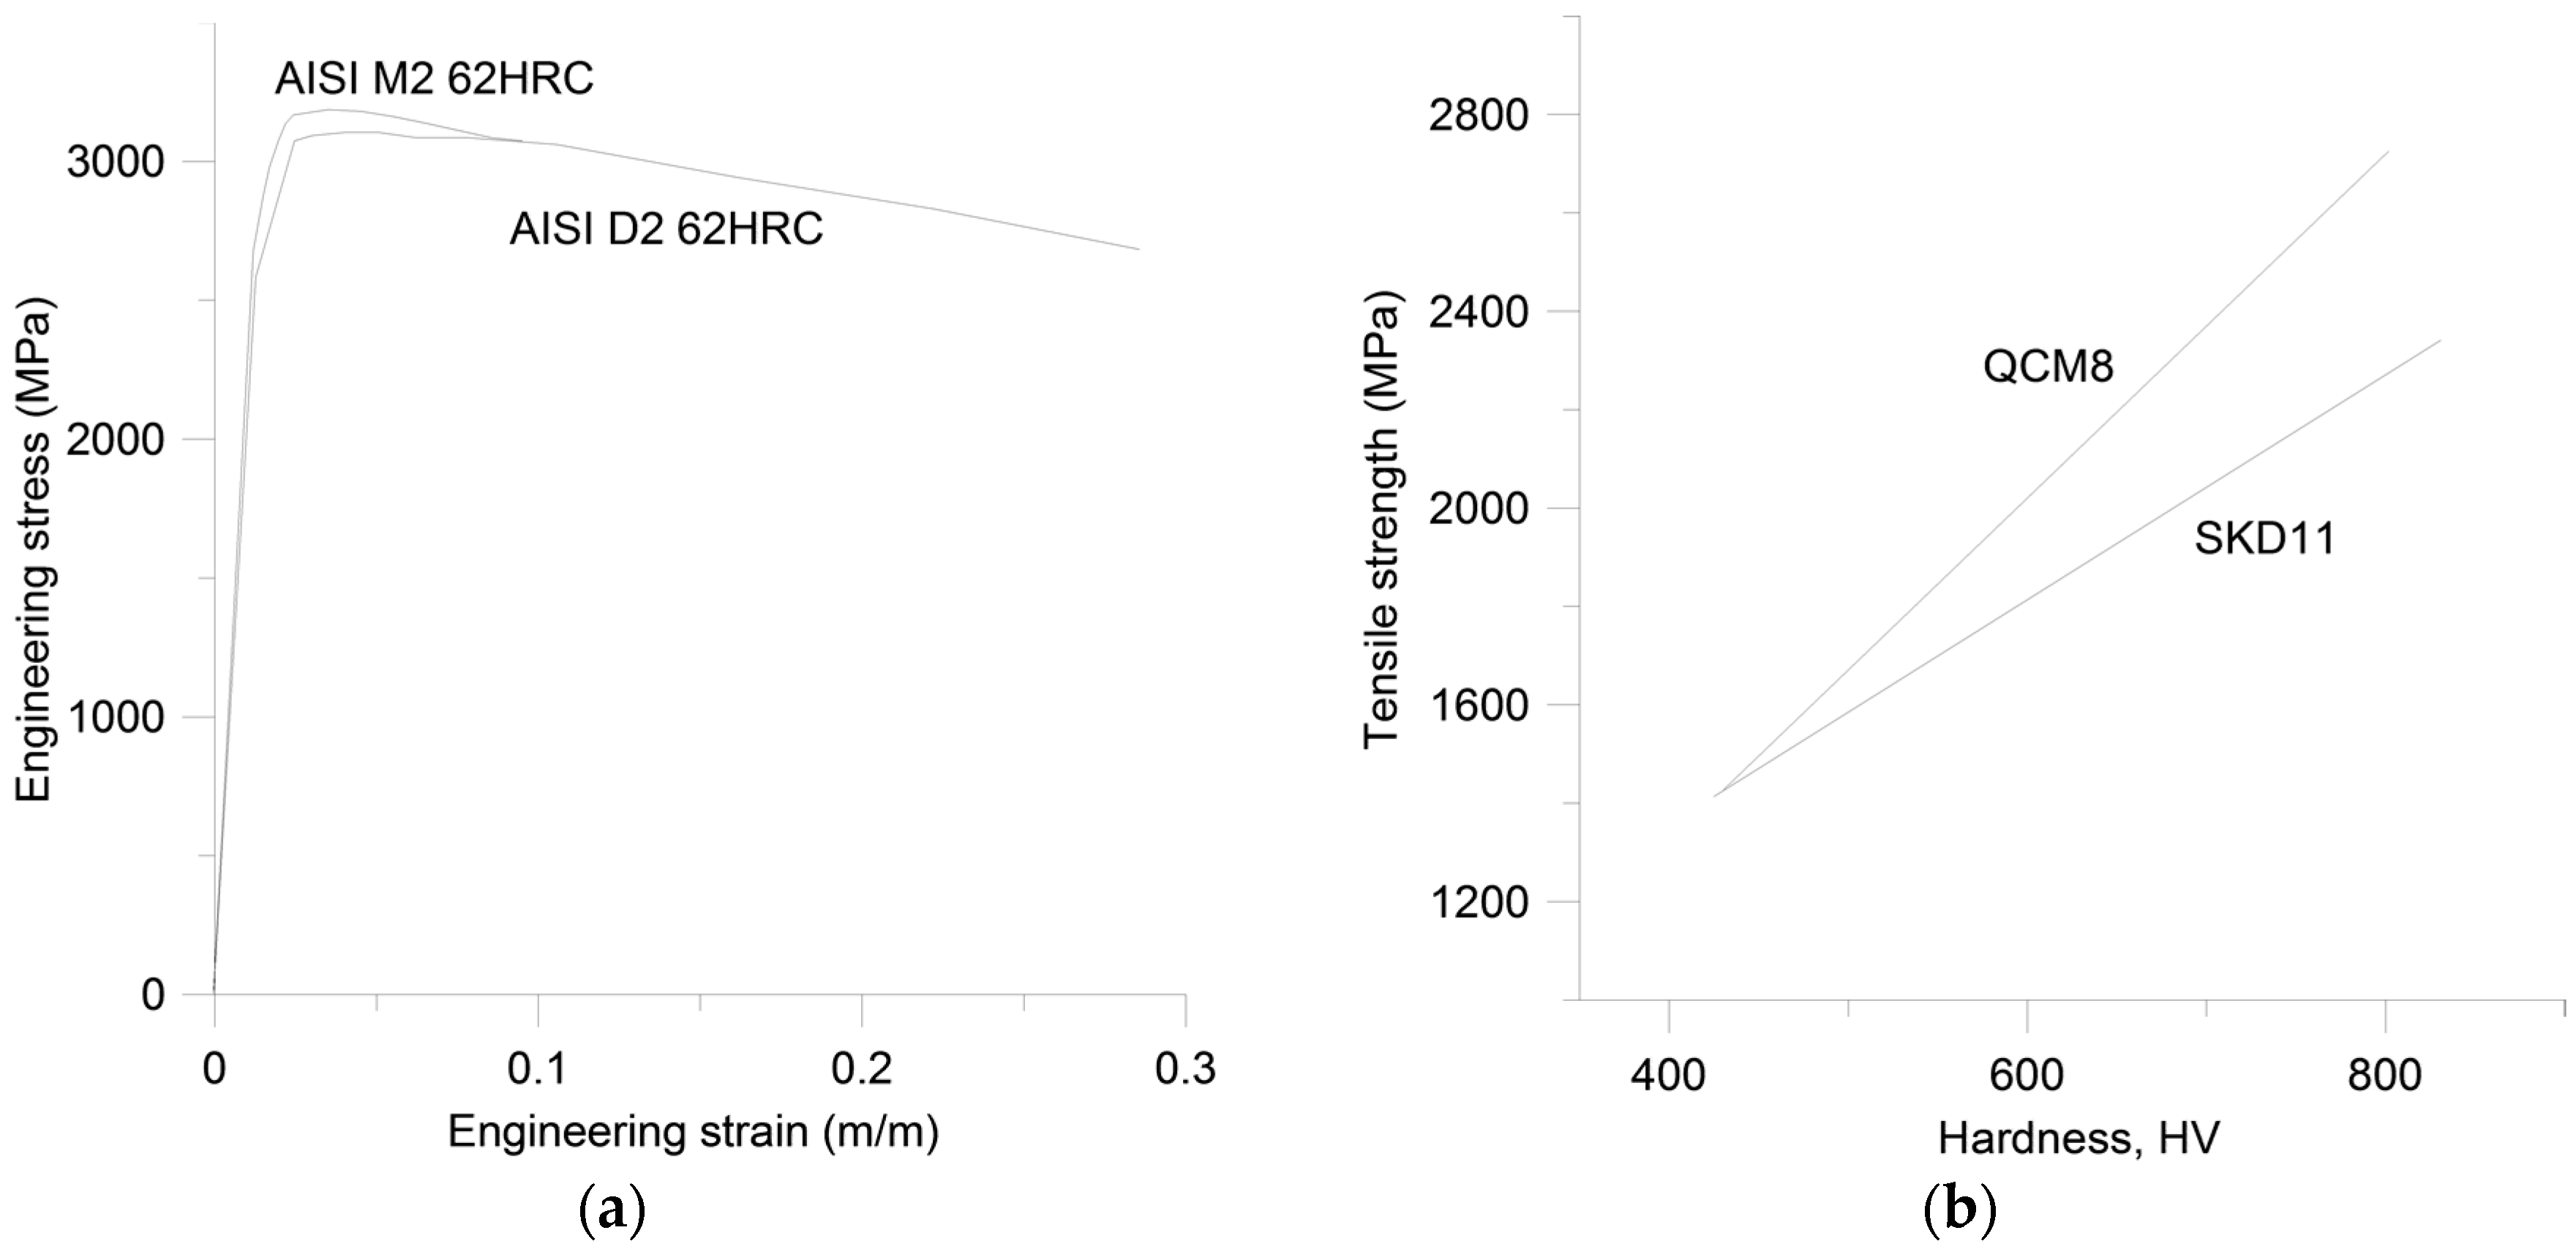
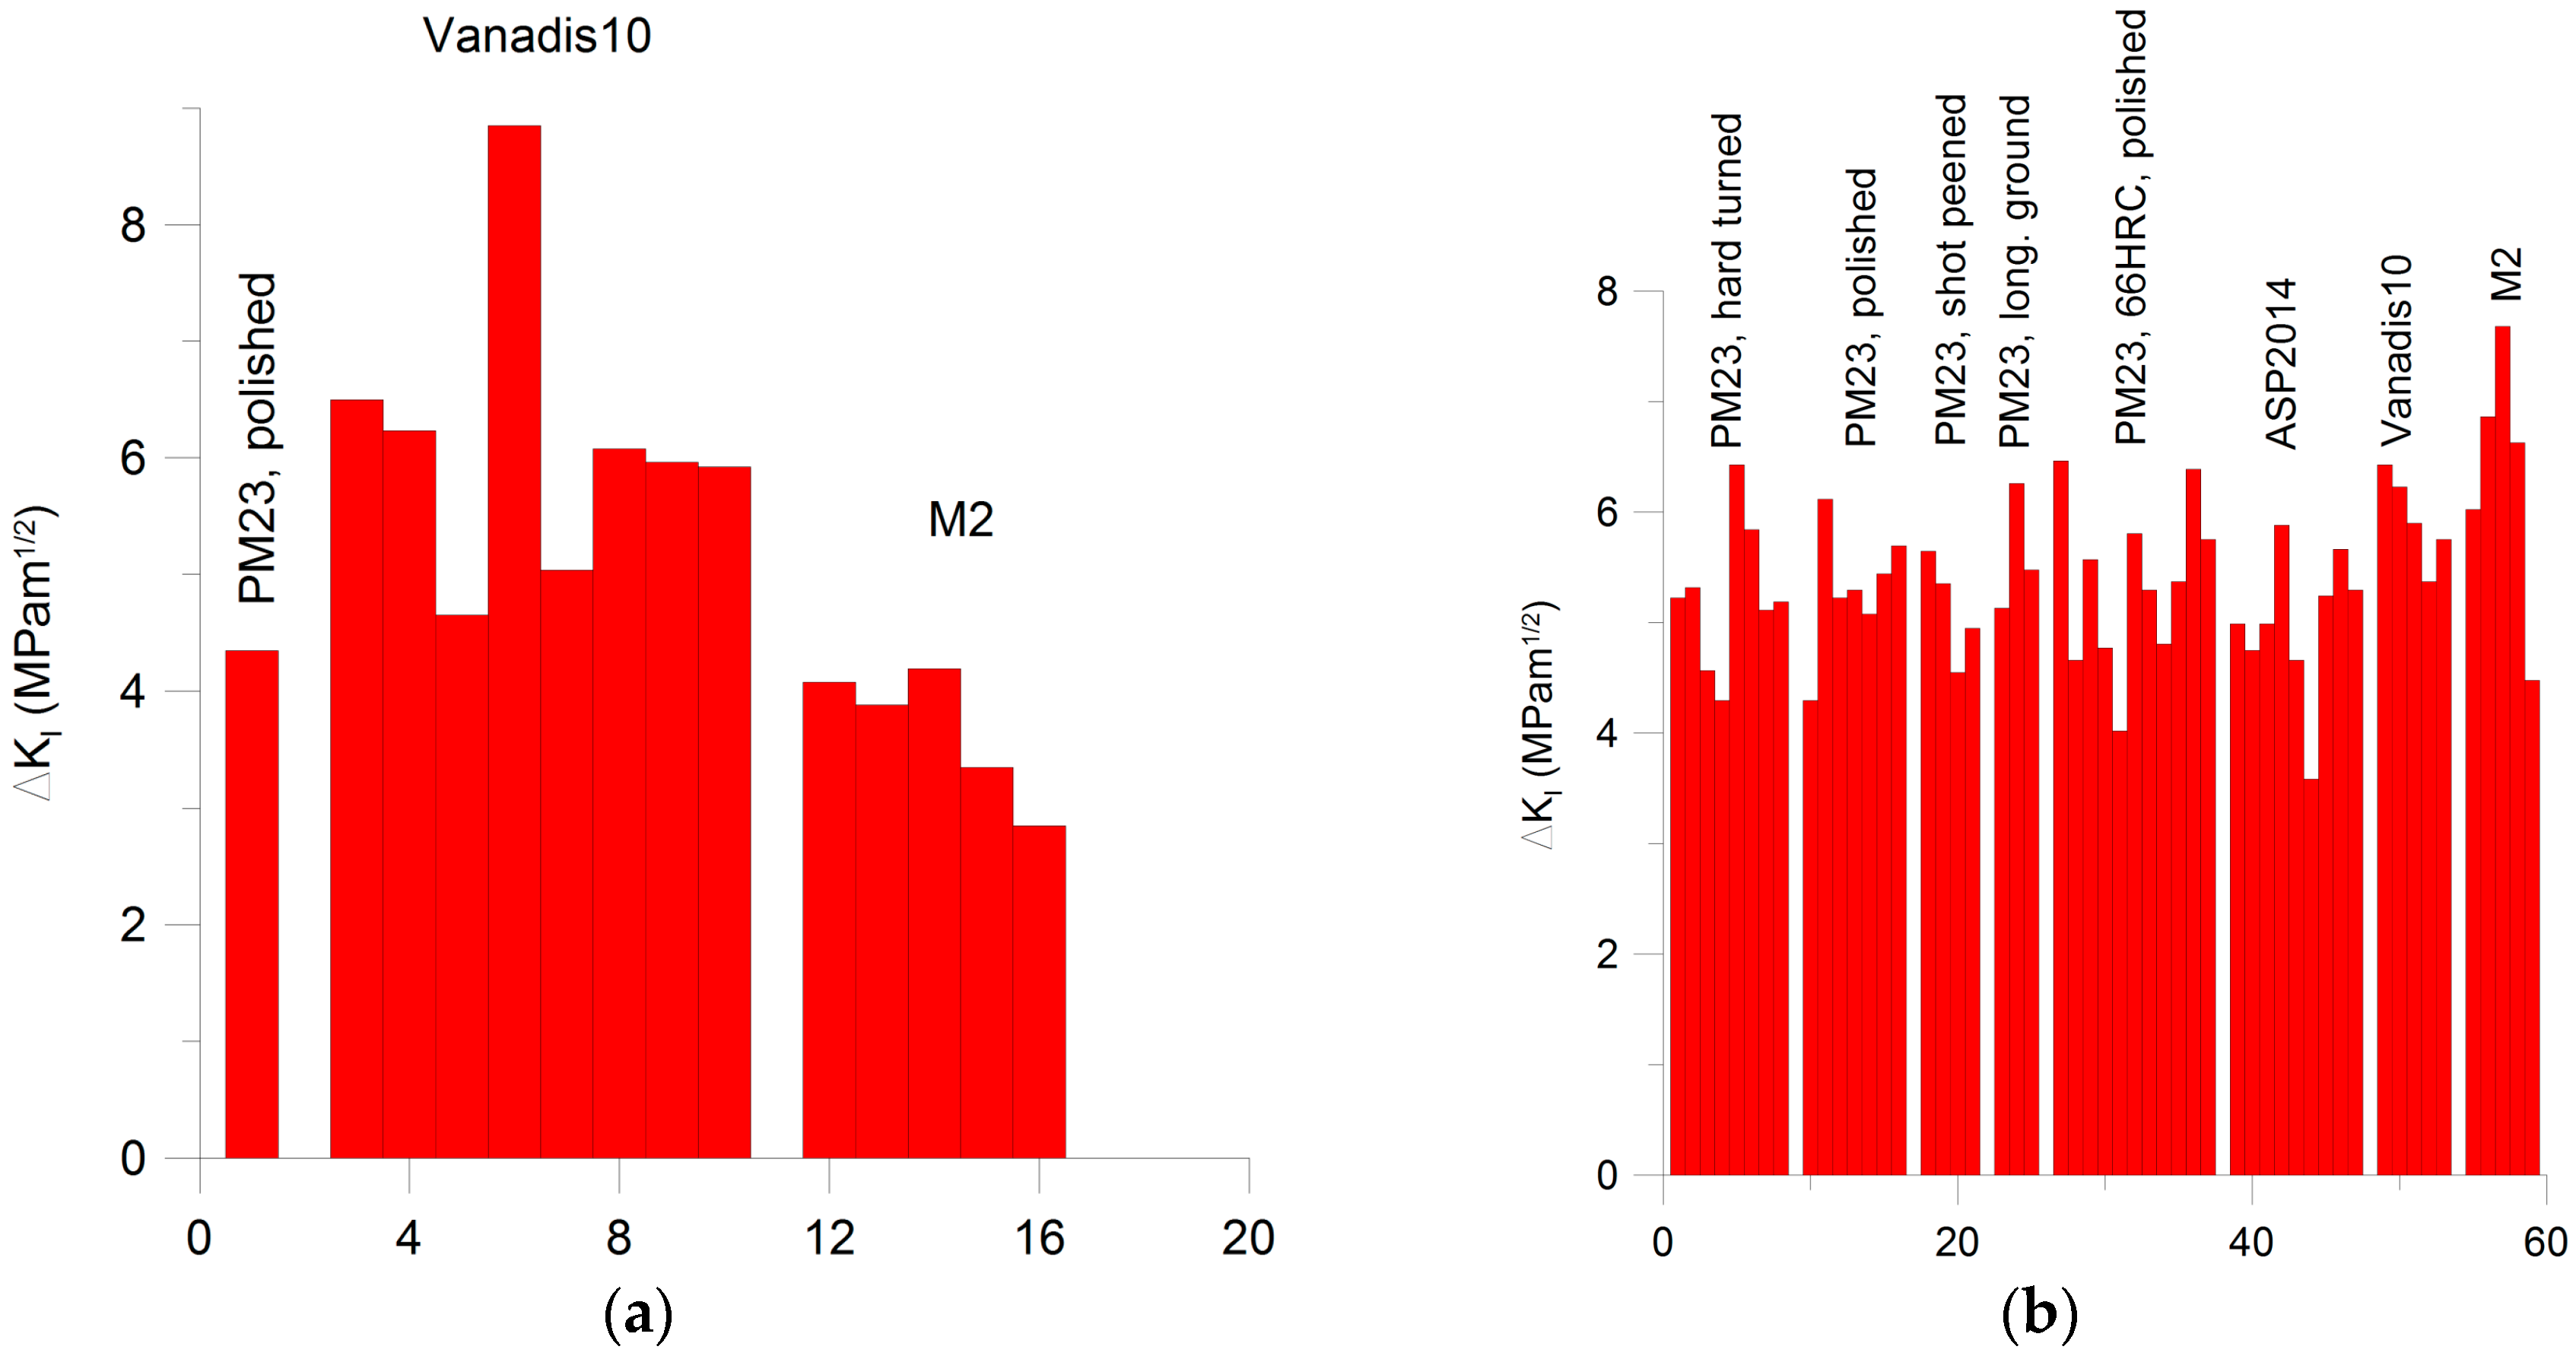
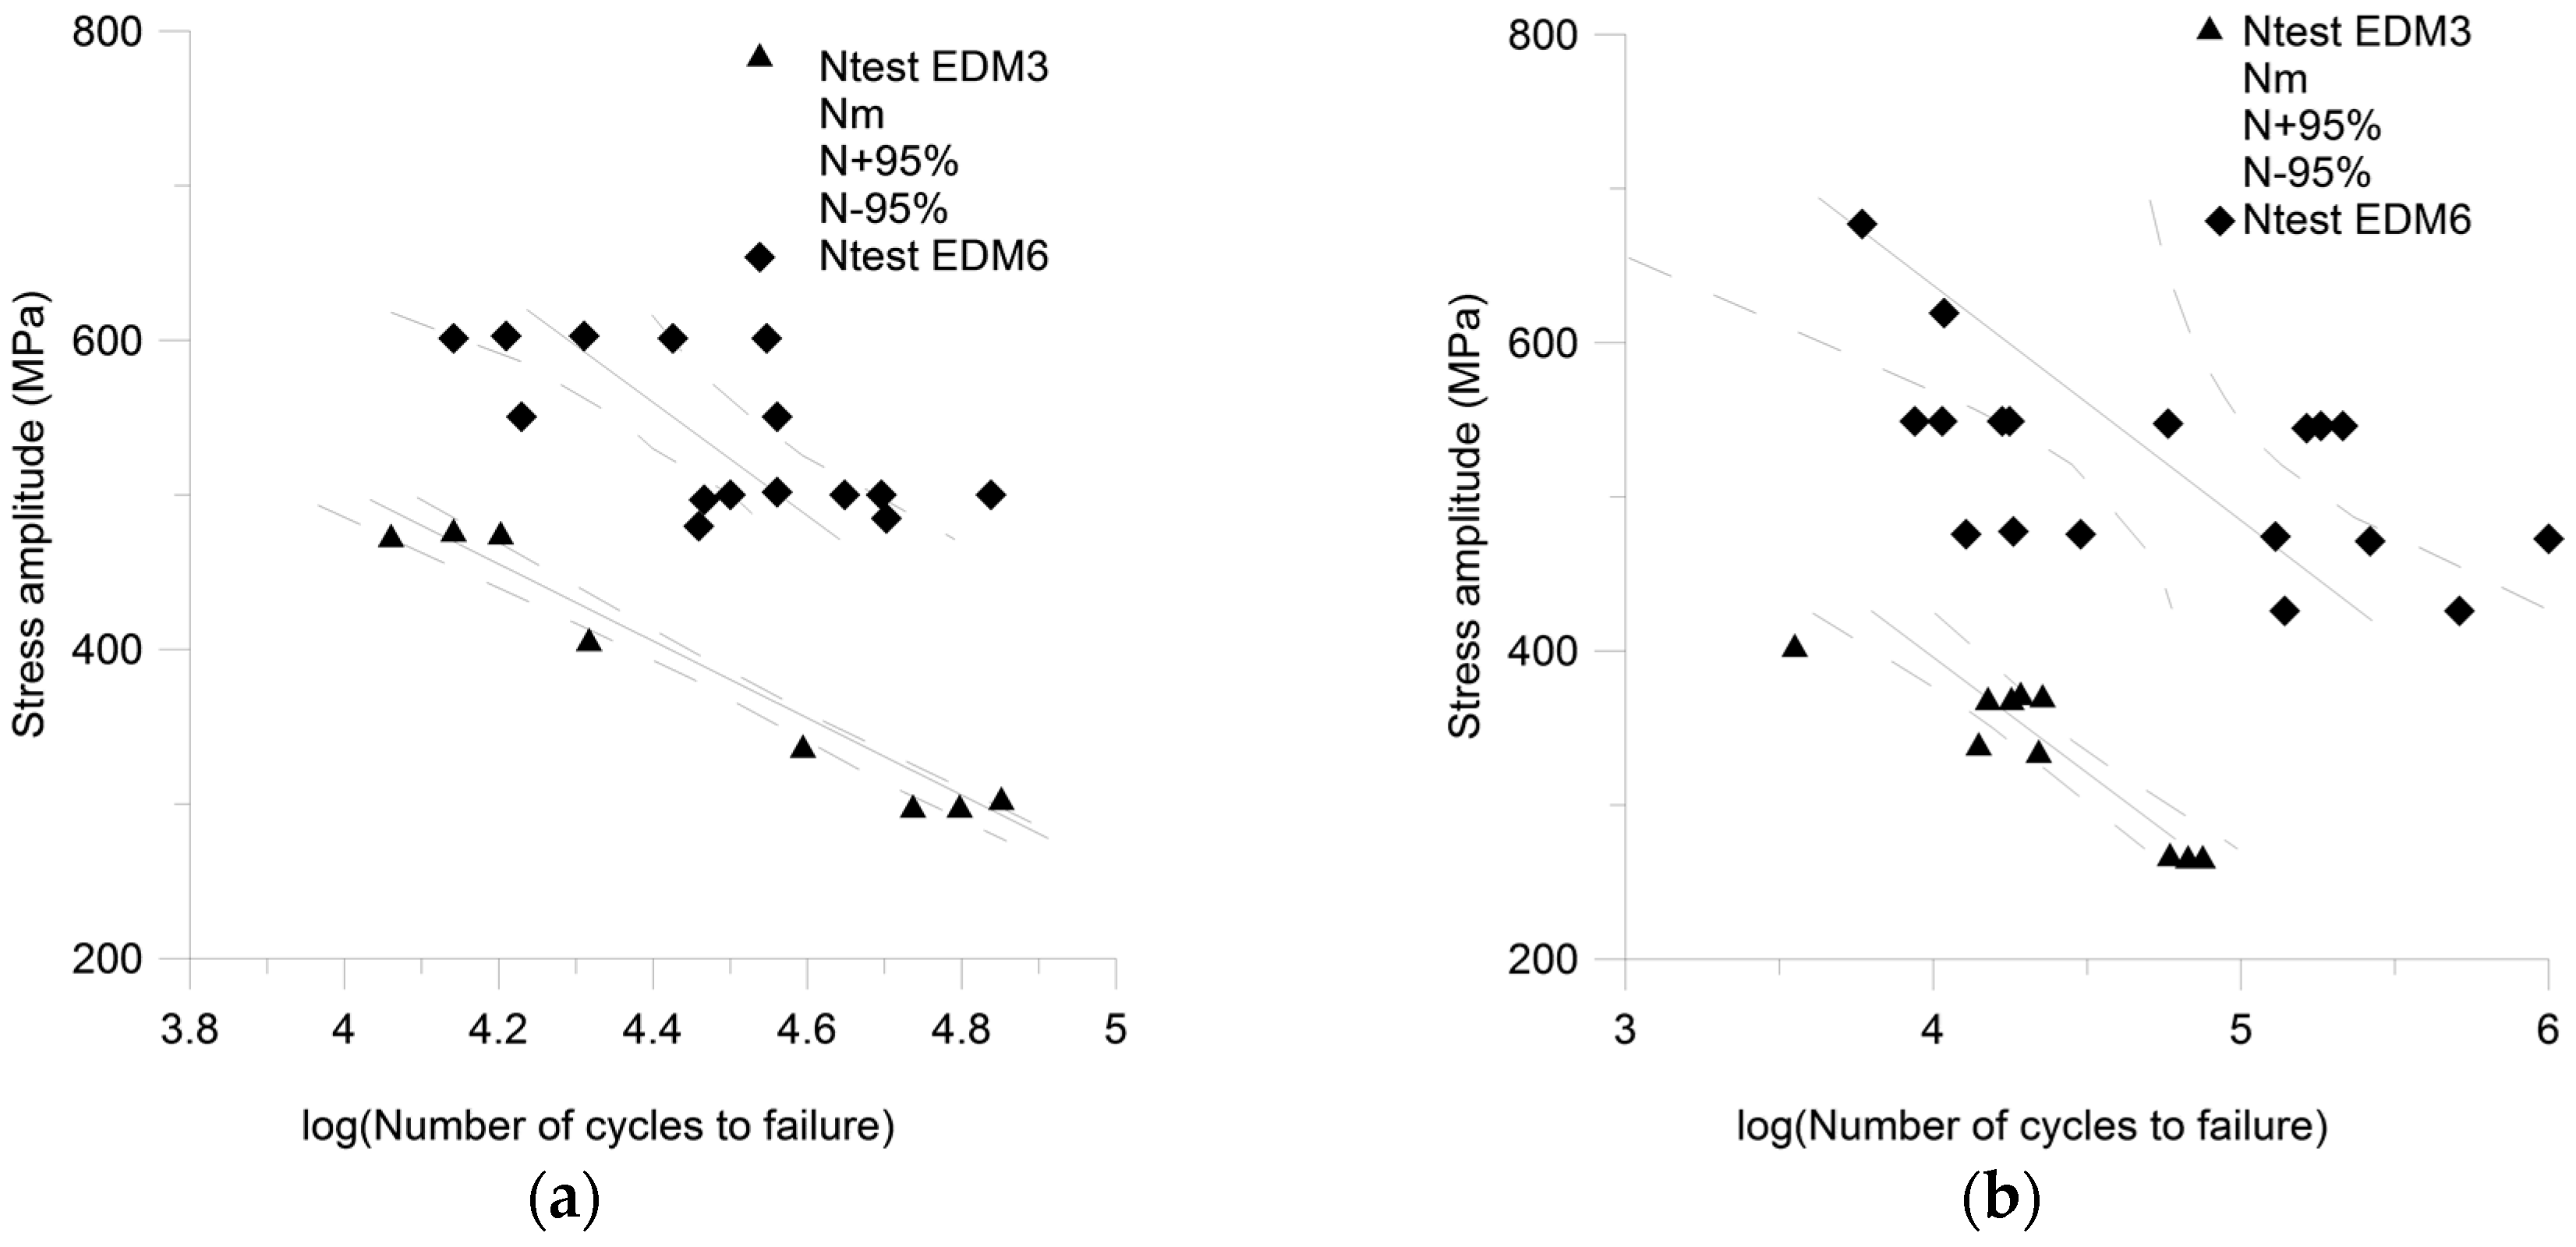
3.1. Material Fatigue Resistance
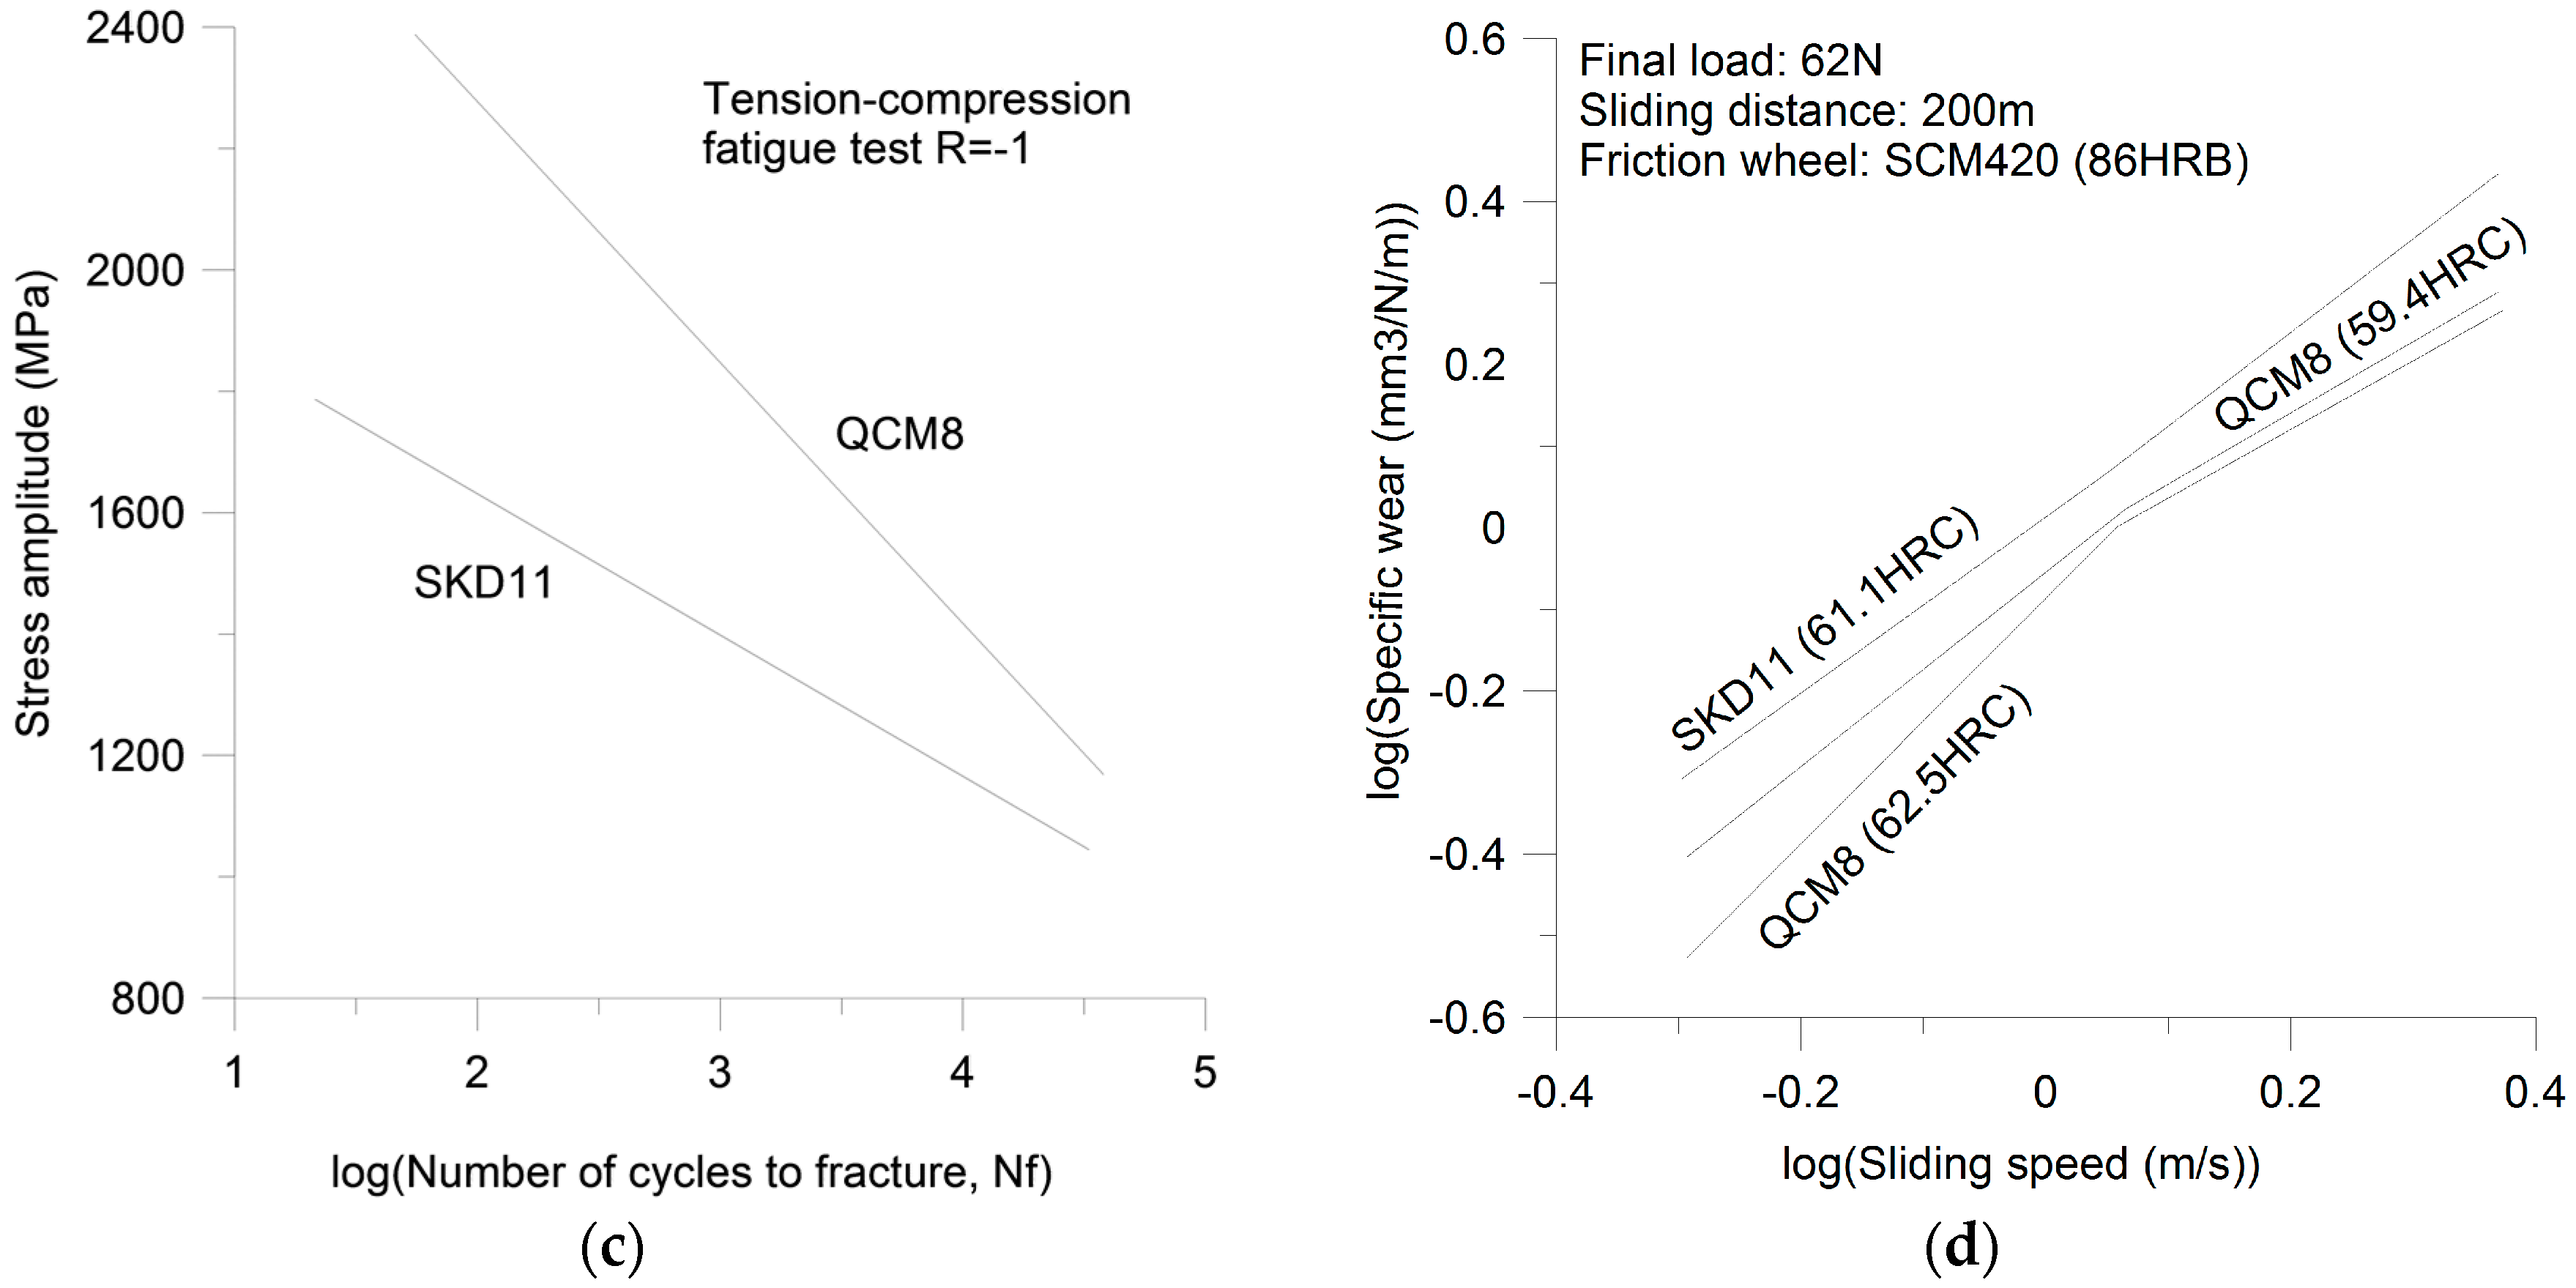
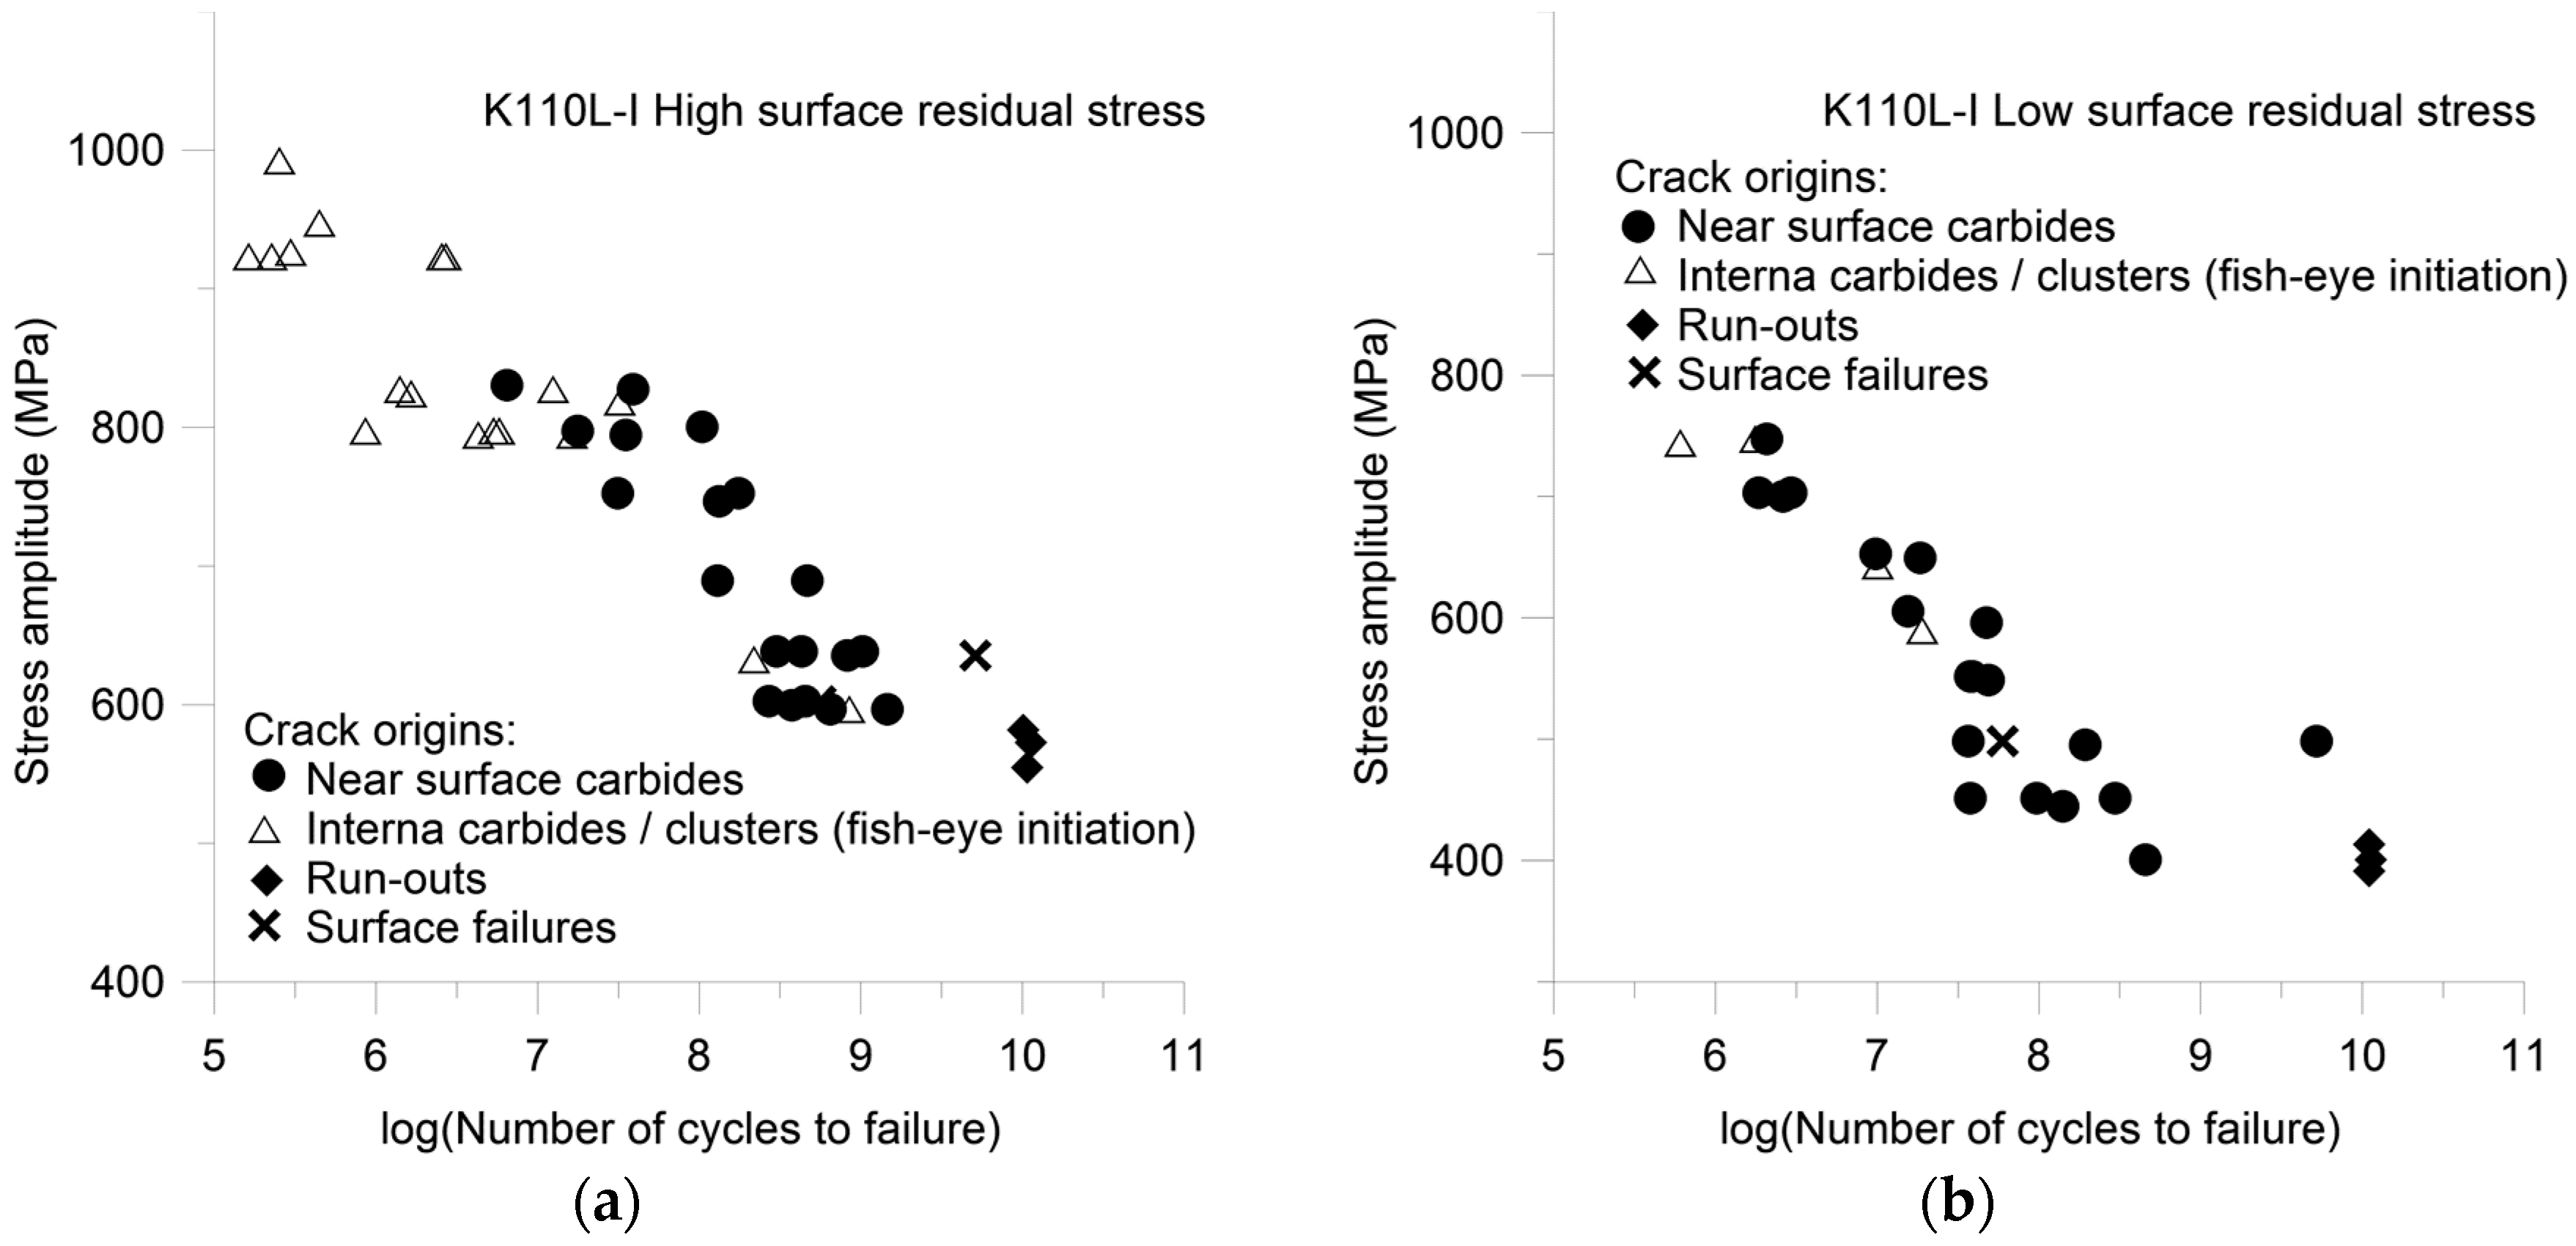
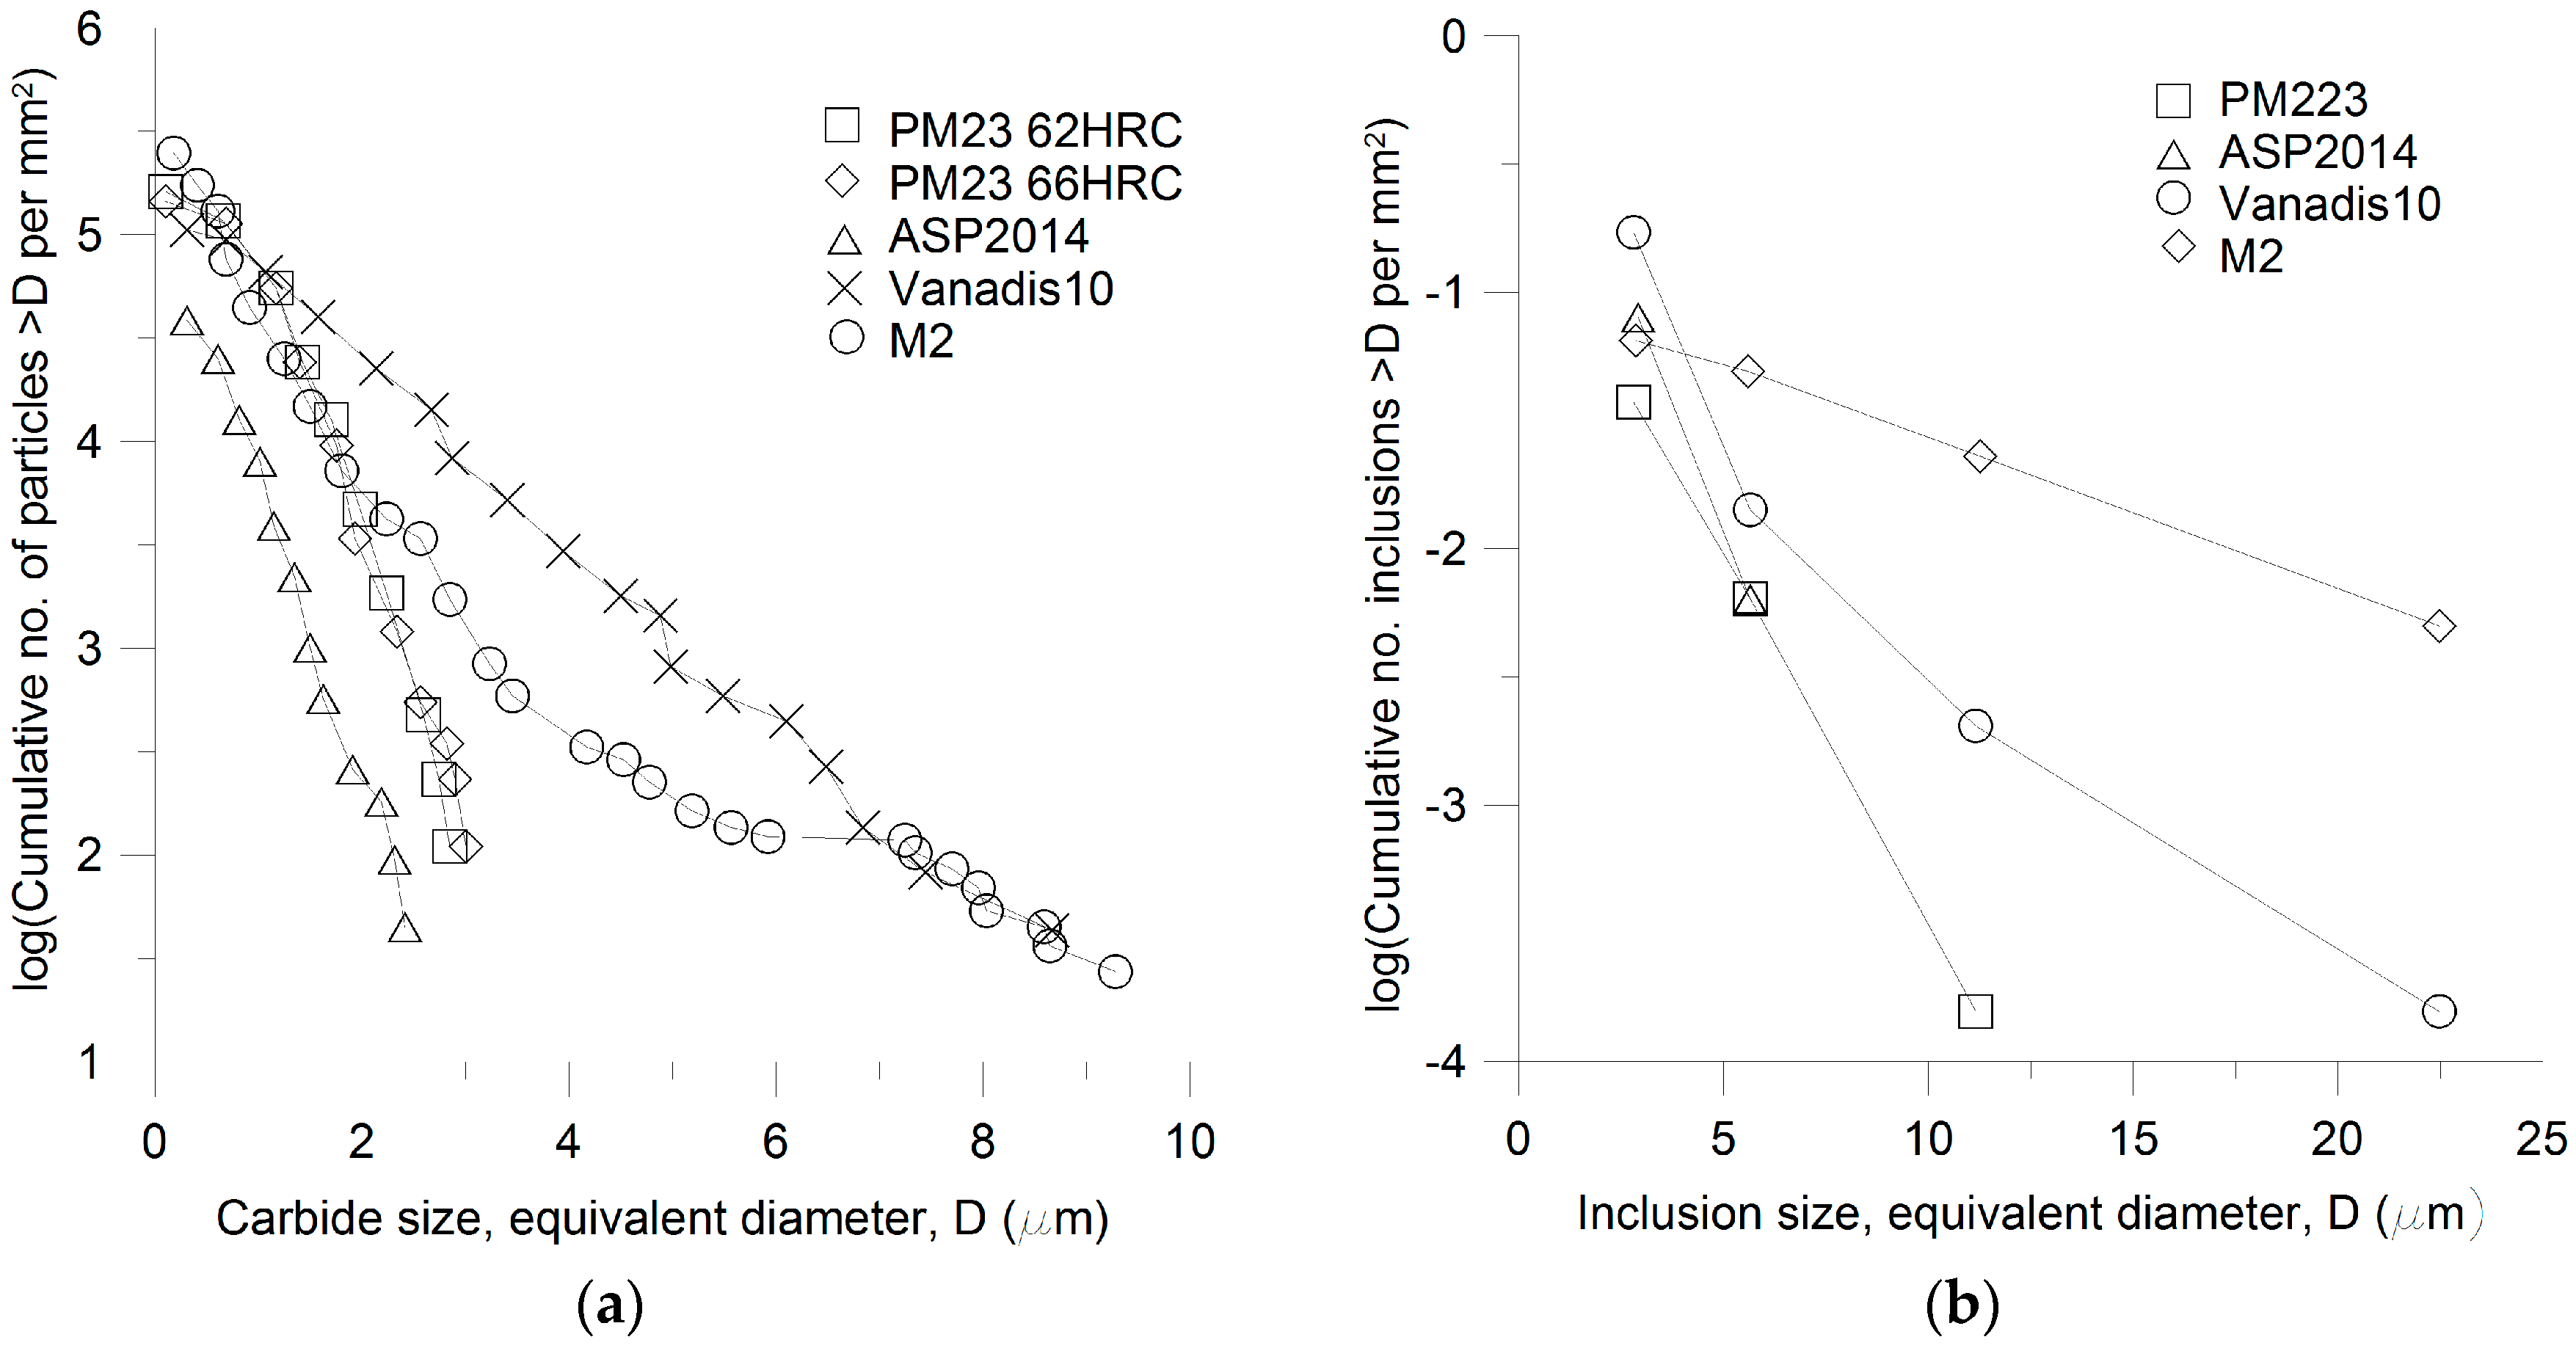
- Internal cracks initiating at large primary carbides (clusters) were observed in the cycle number range of 105–106 cycles,
- In the giga-cycle regime near-surface cracks originating at primary carbides caused failure, which was related to degradation of the RS by cyclic loading.
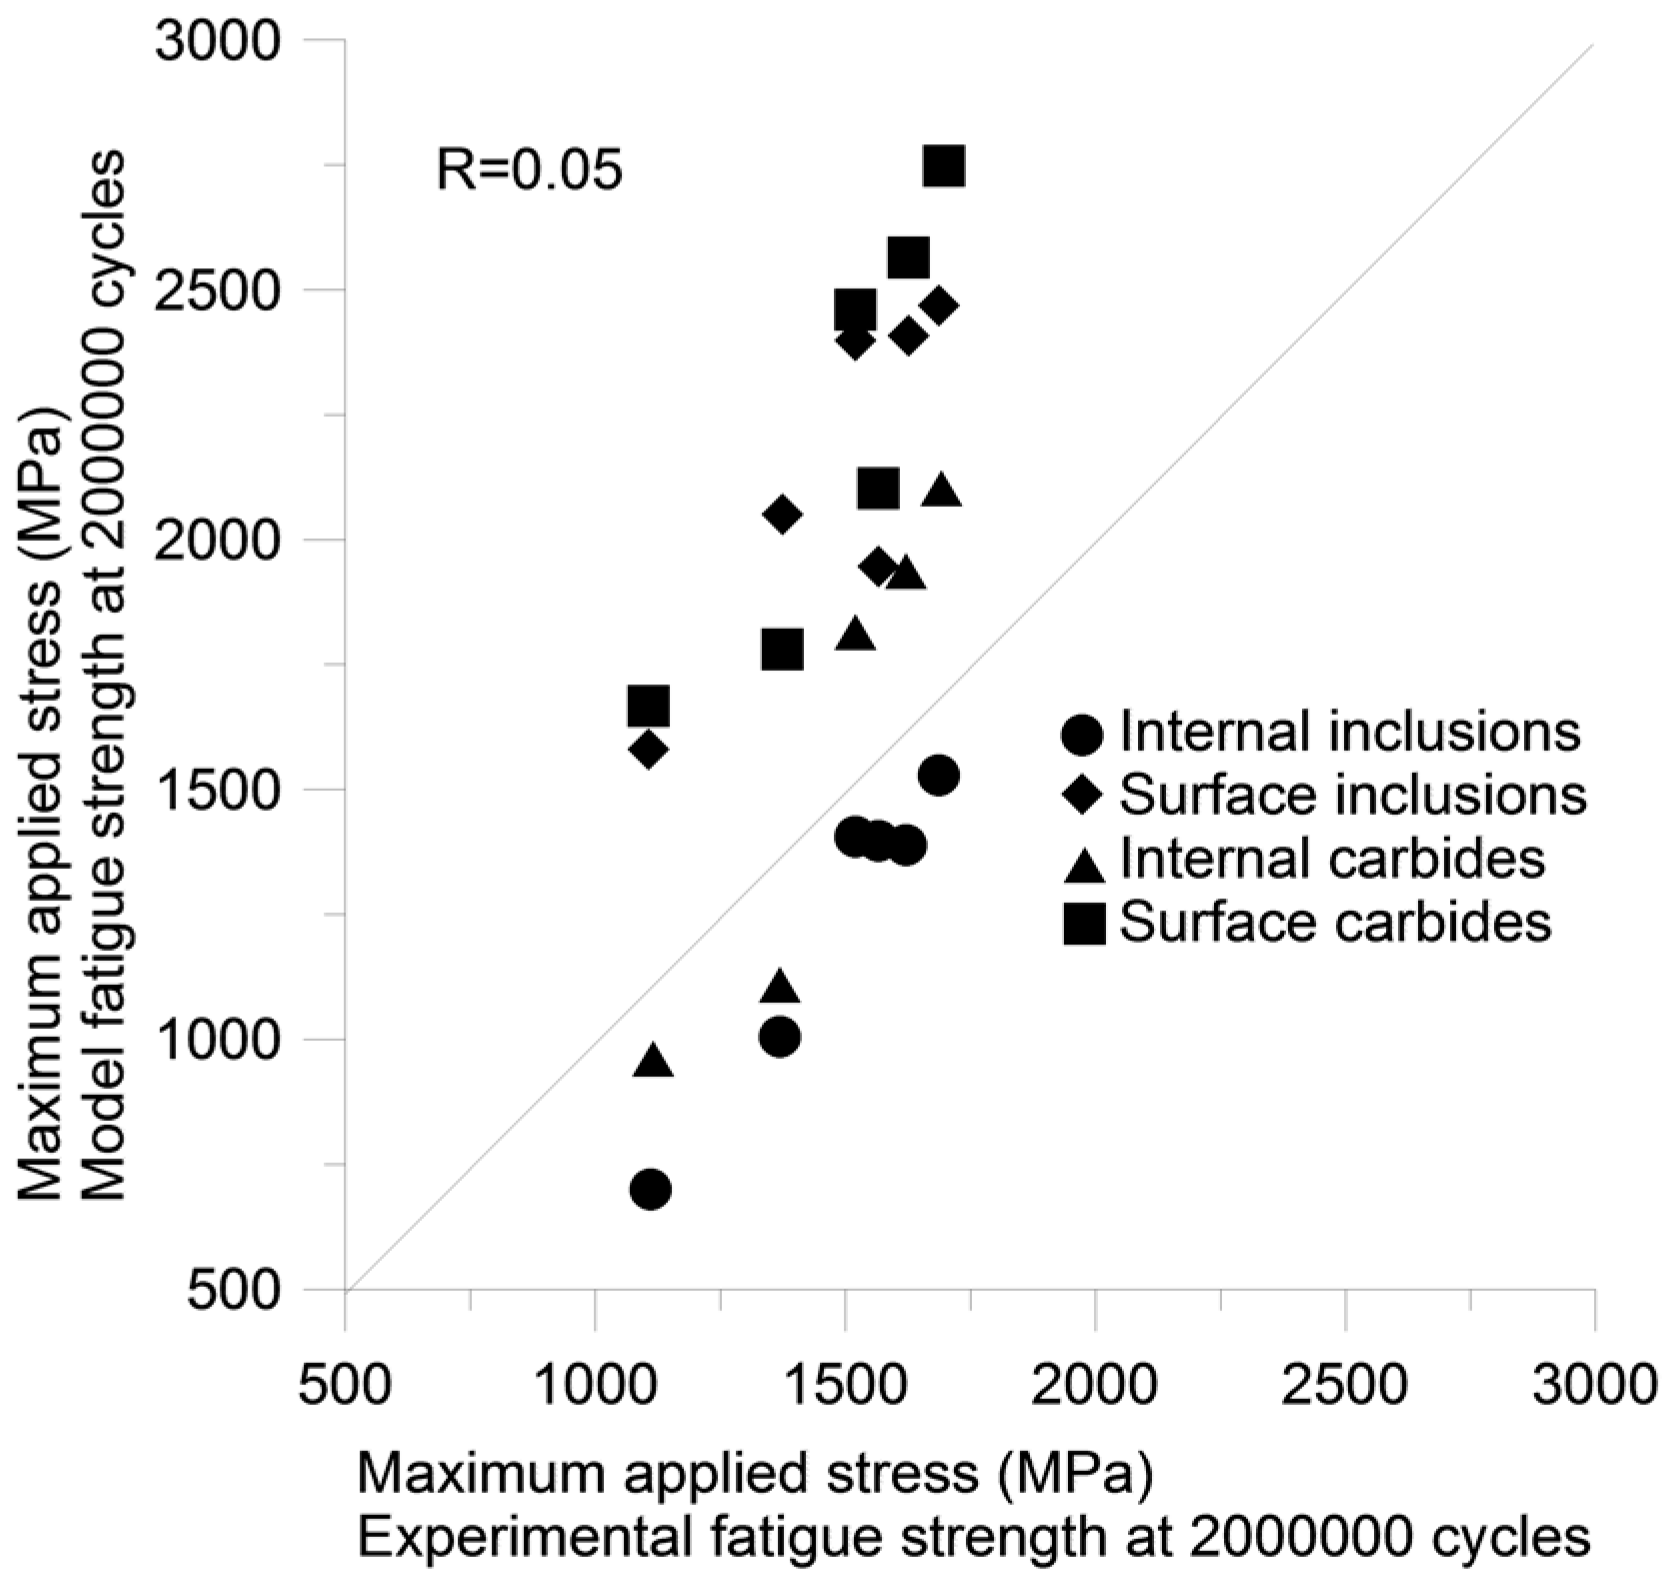
- The highest stress concentrations are found in the transversal direction of MnS inclusions while in the parallel direction the stress concentration is very small.
- The second highest stress concentration is found around Ti(C,N) particles due to the square geometry.
- Al2O3 particles generated the smallest stress concentrations due to the rounded geometry.
- Around all particles such as carbides and inclusions, cracks exist of equal size as the initiating particles.
- An existing crack will not grow unless the stress intensity at its tip exceeds the stress intensity threshold for crack propagation.
- If there exists at least one crack for which the stress intensity exceeds the threshold value, then this crack will eventually propagate to cause failure of the specimen.
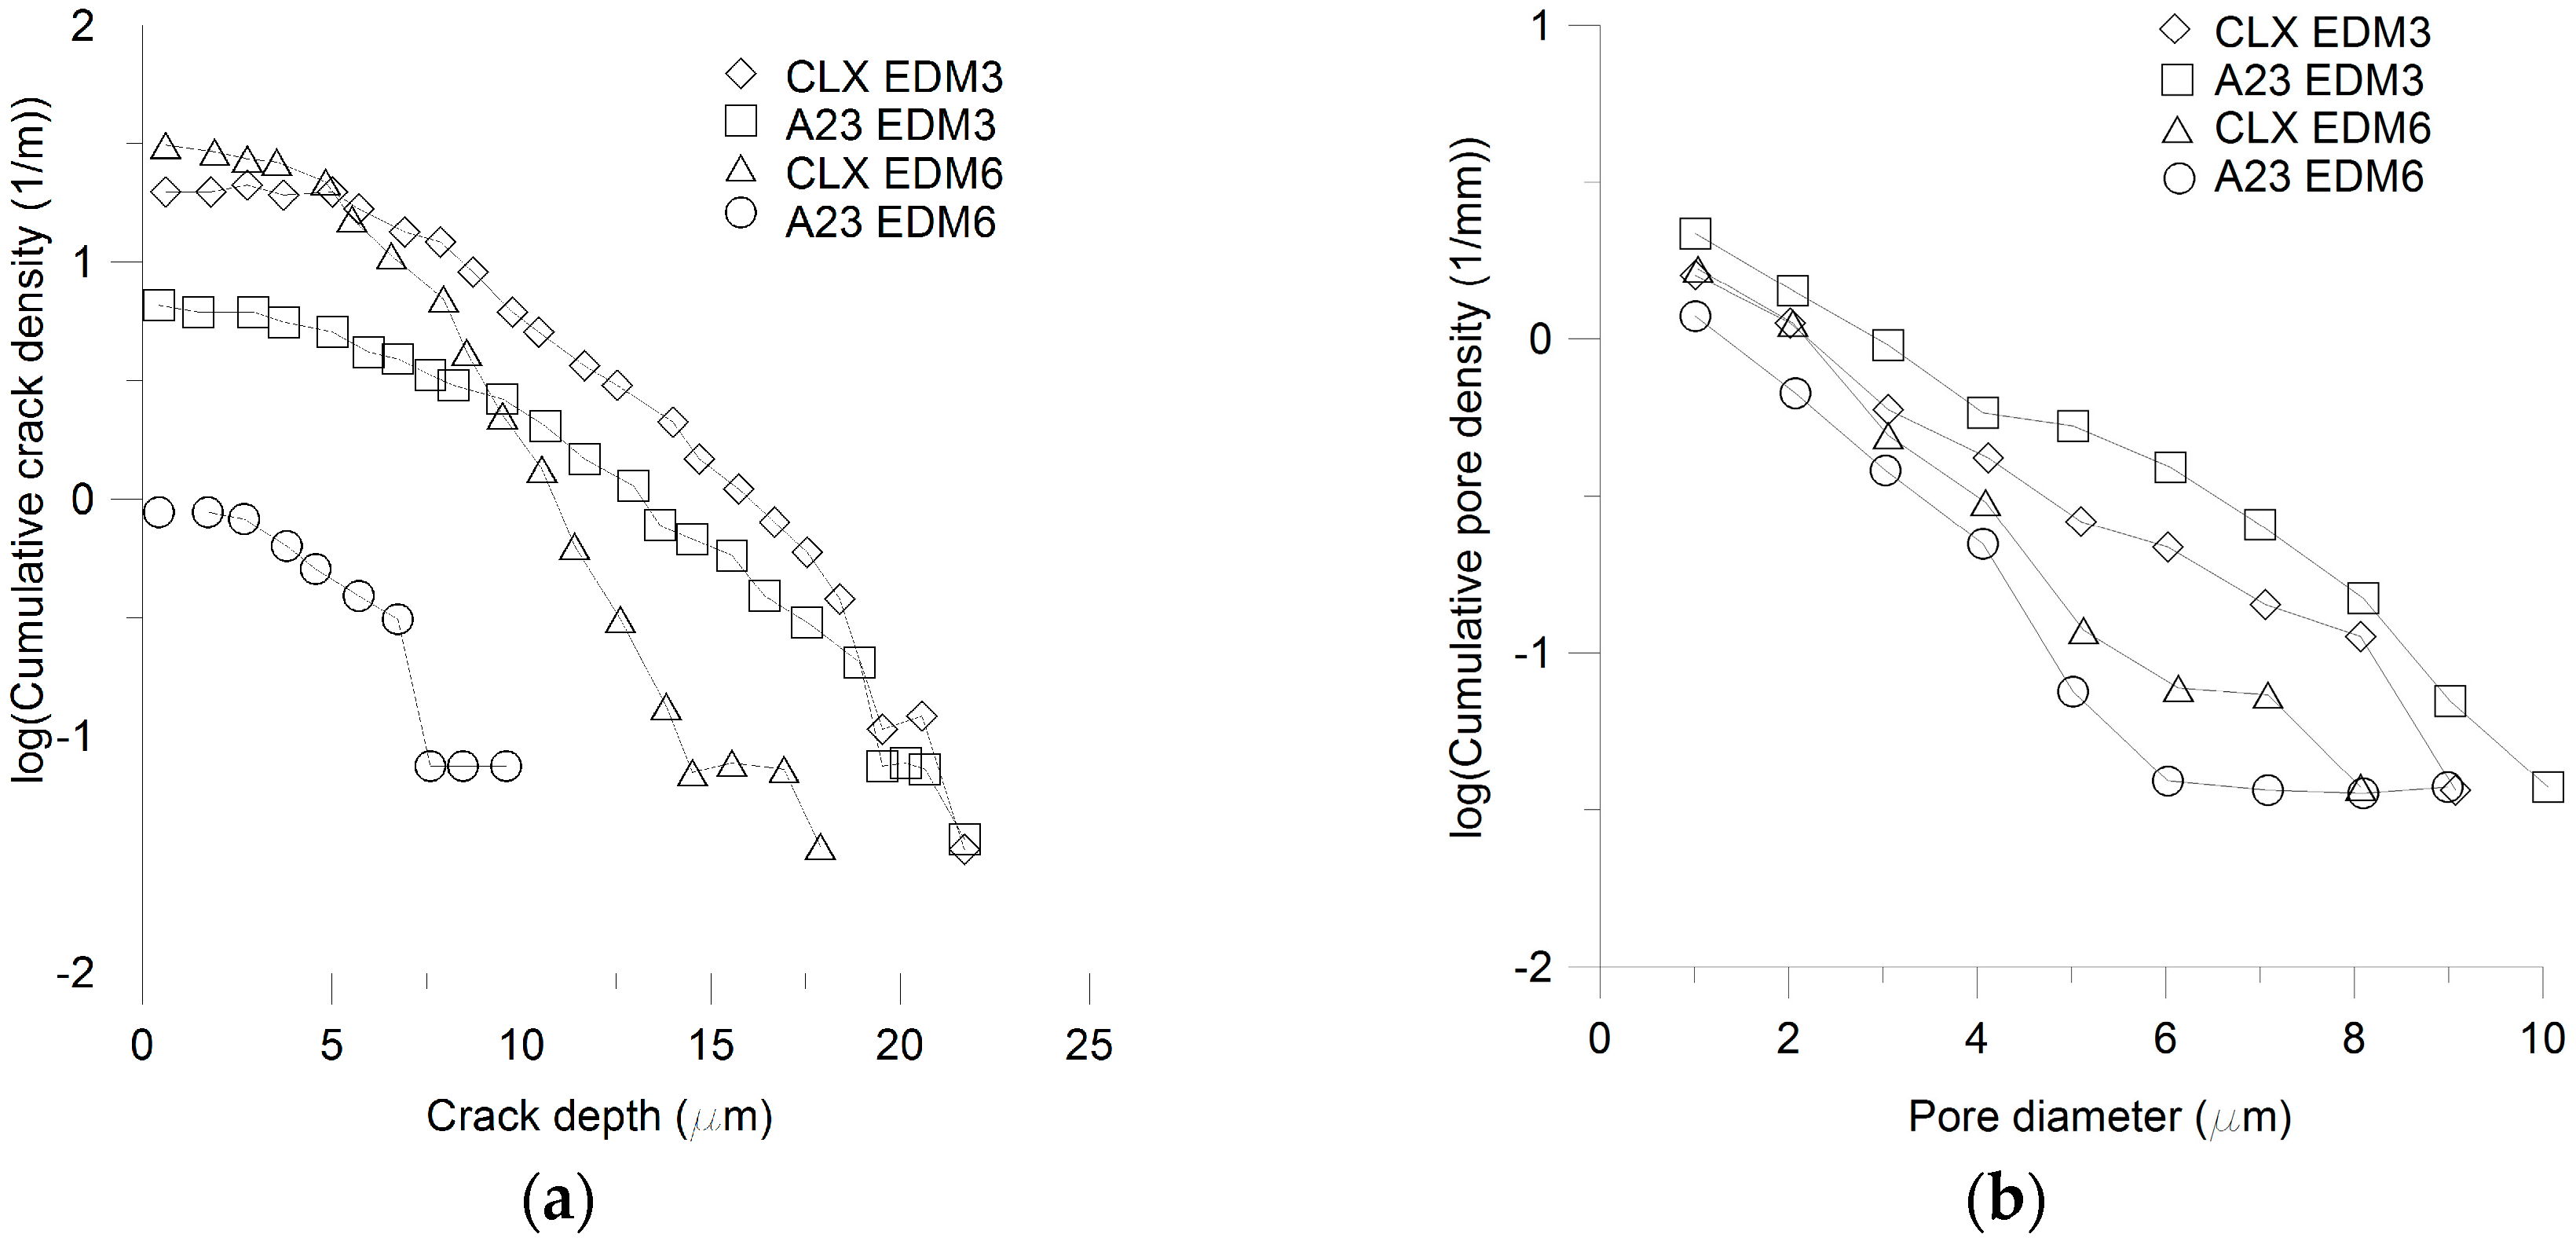
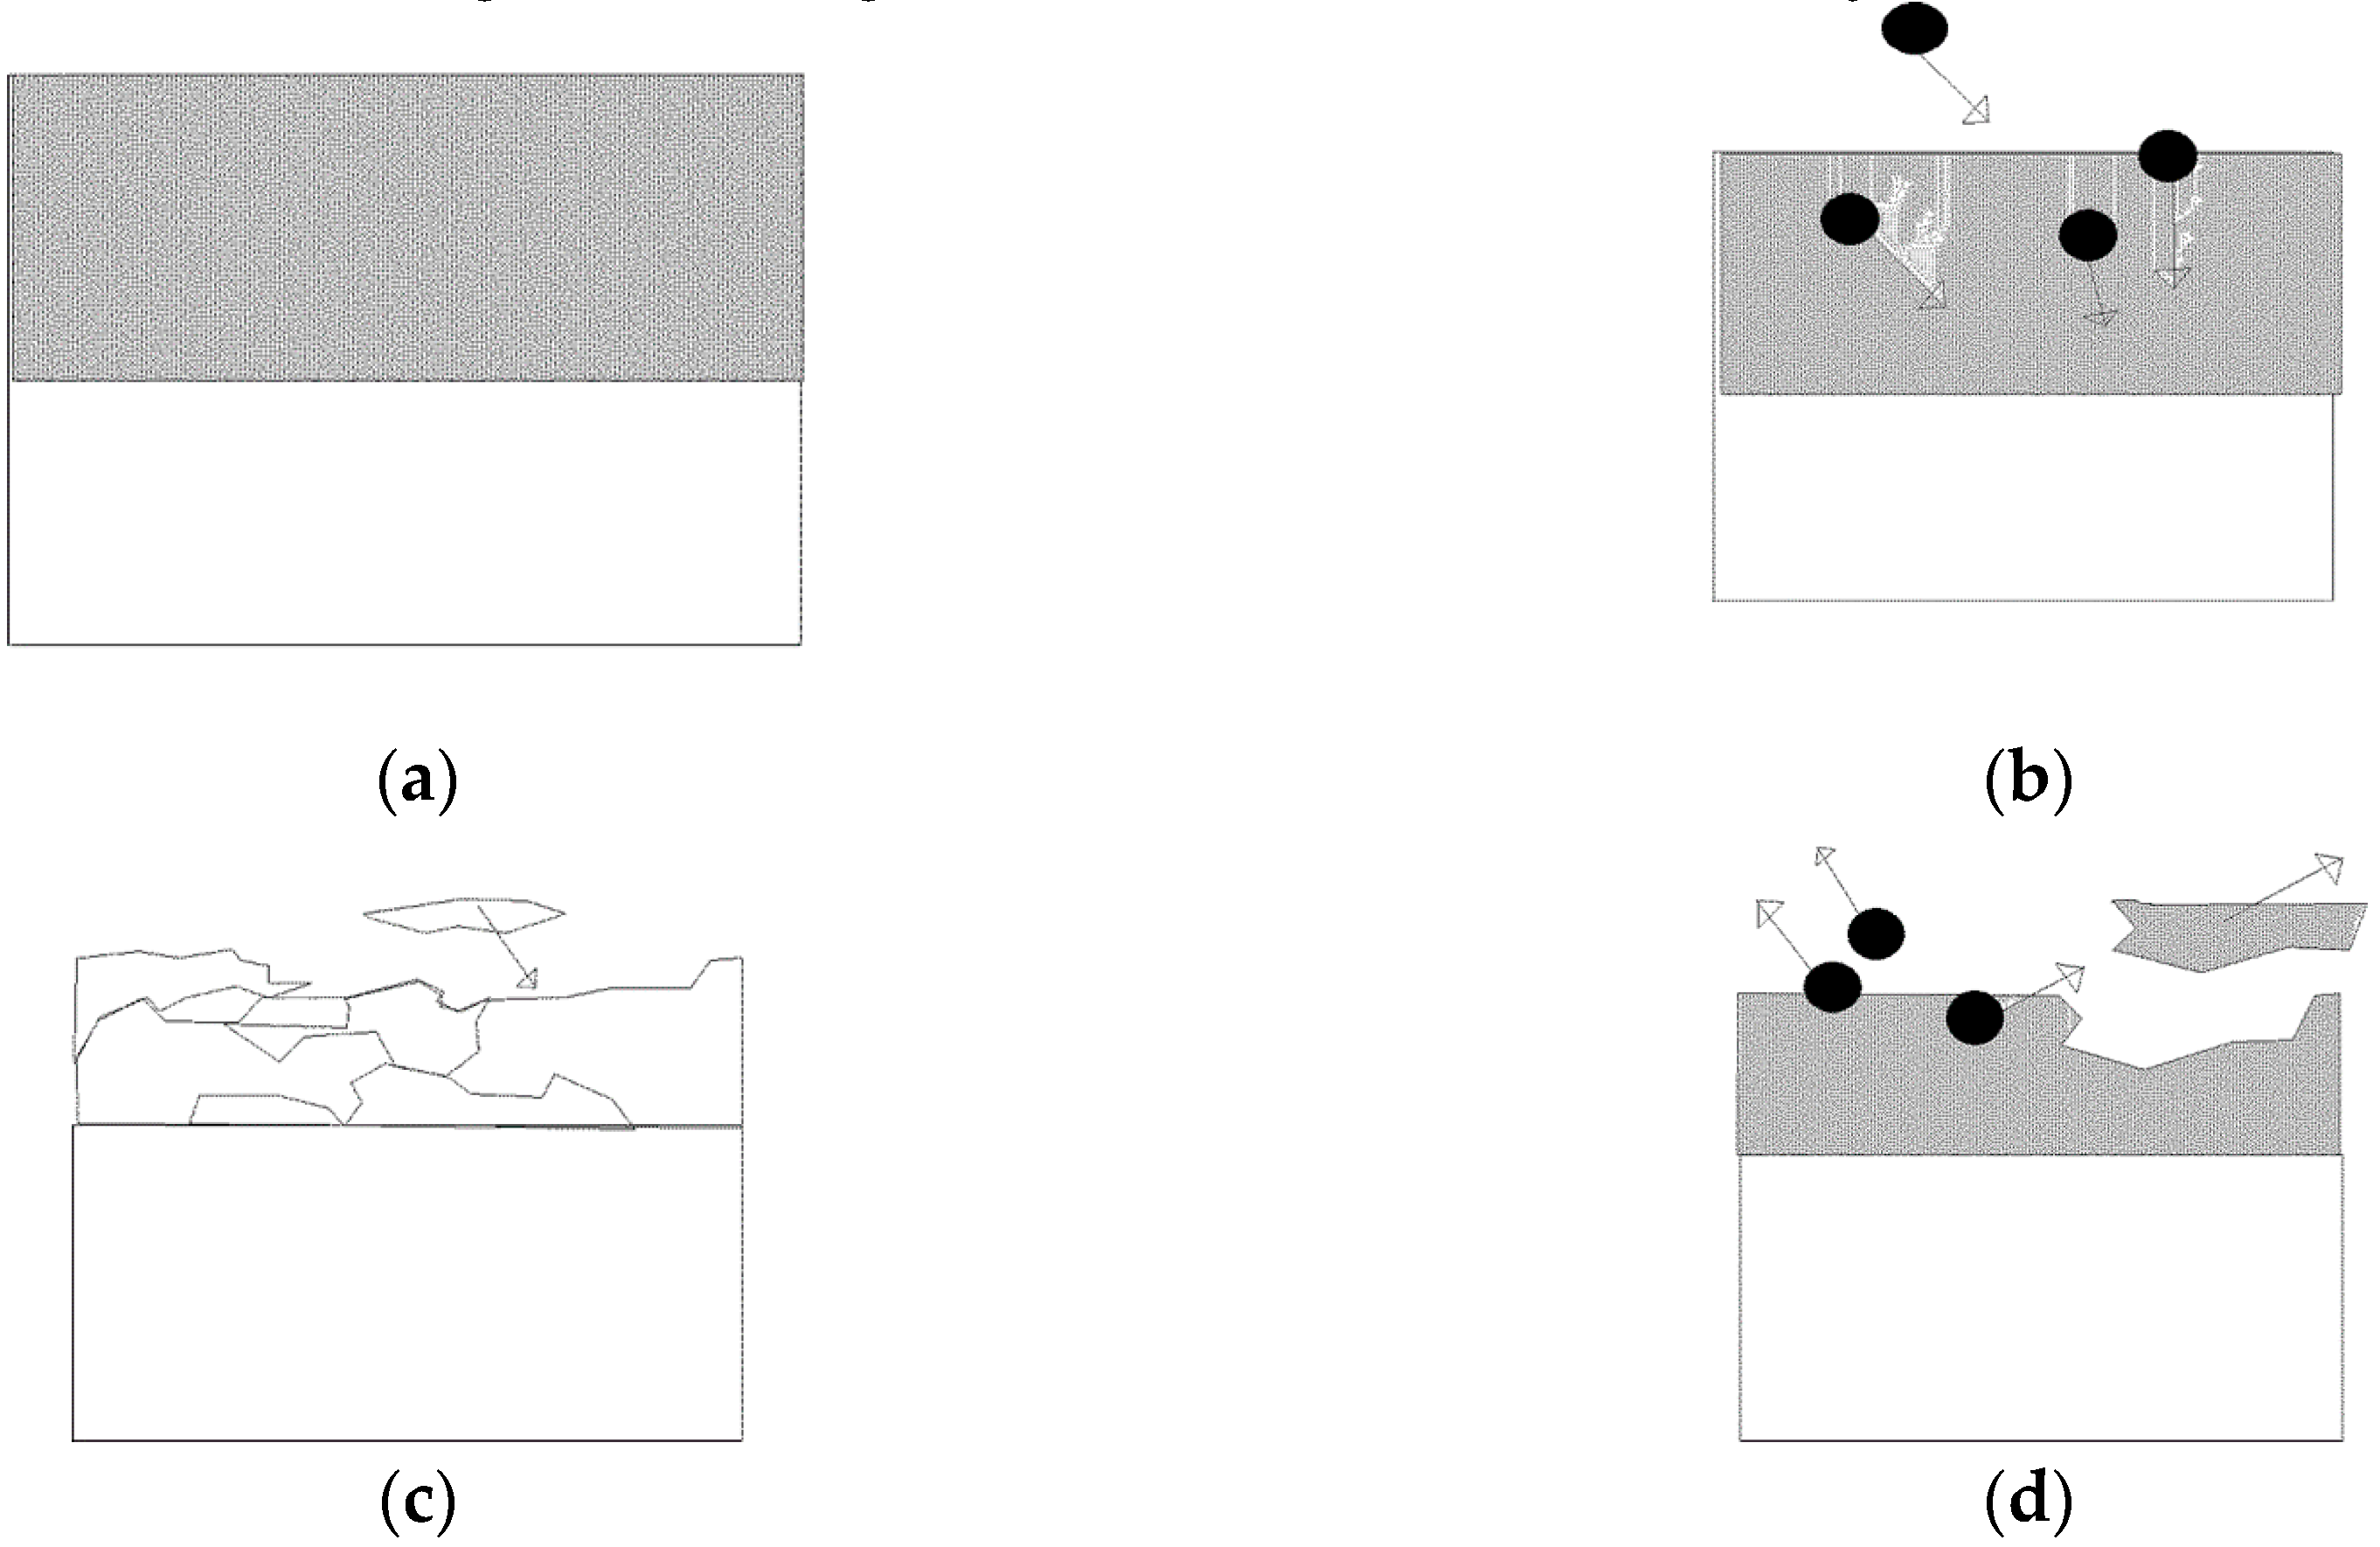
3.2. Material Wear
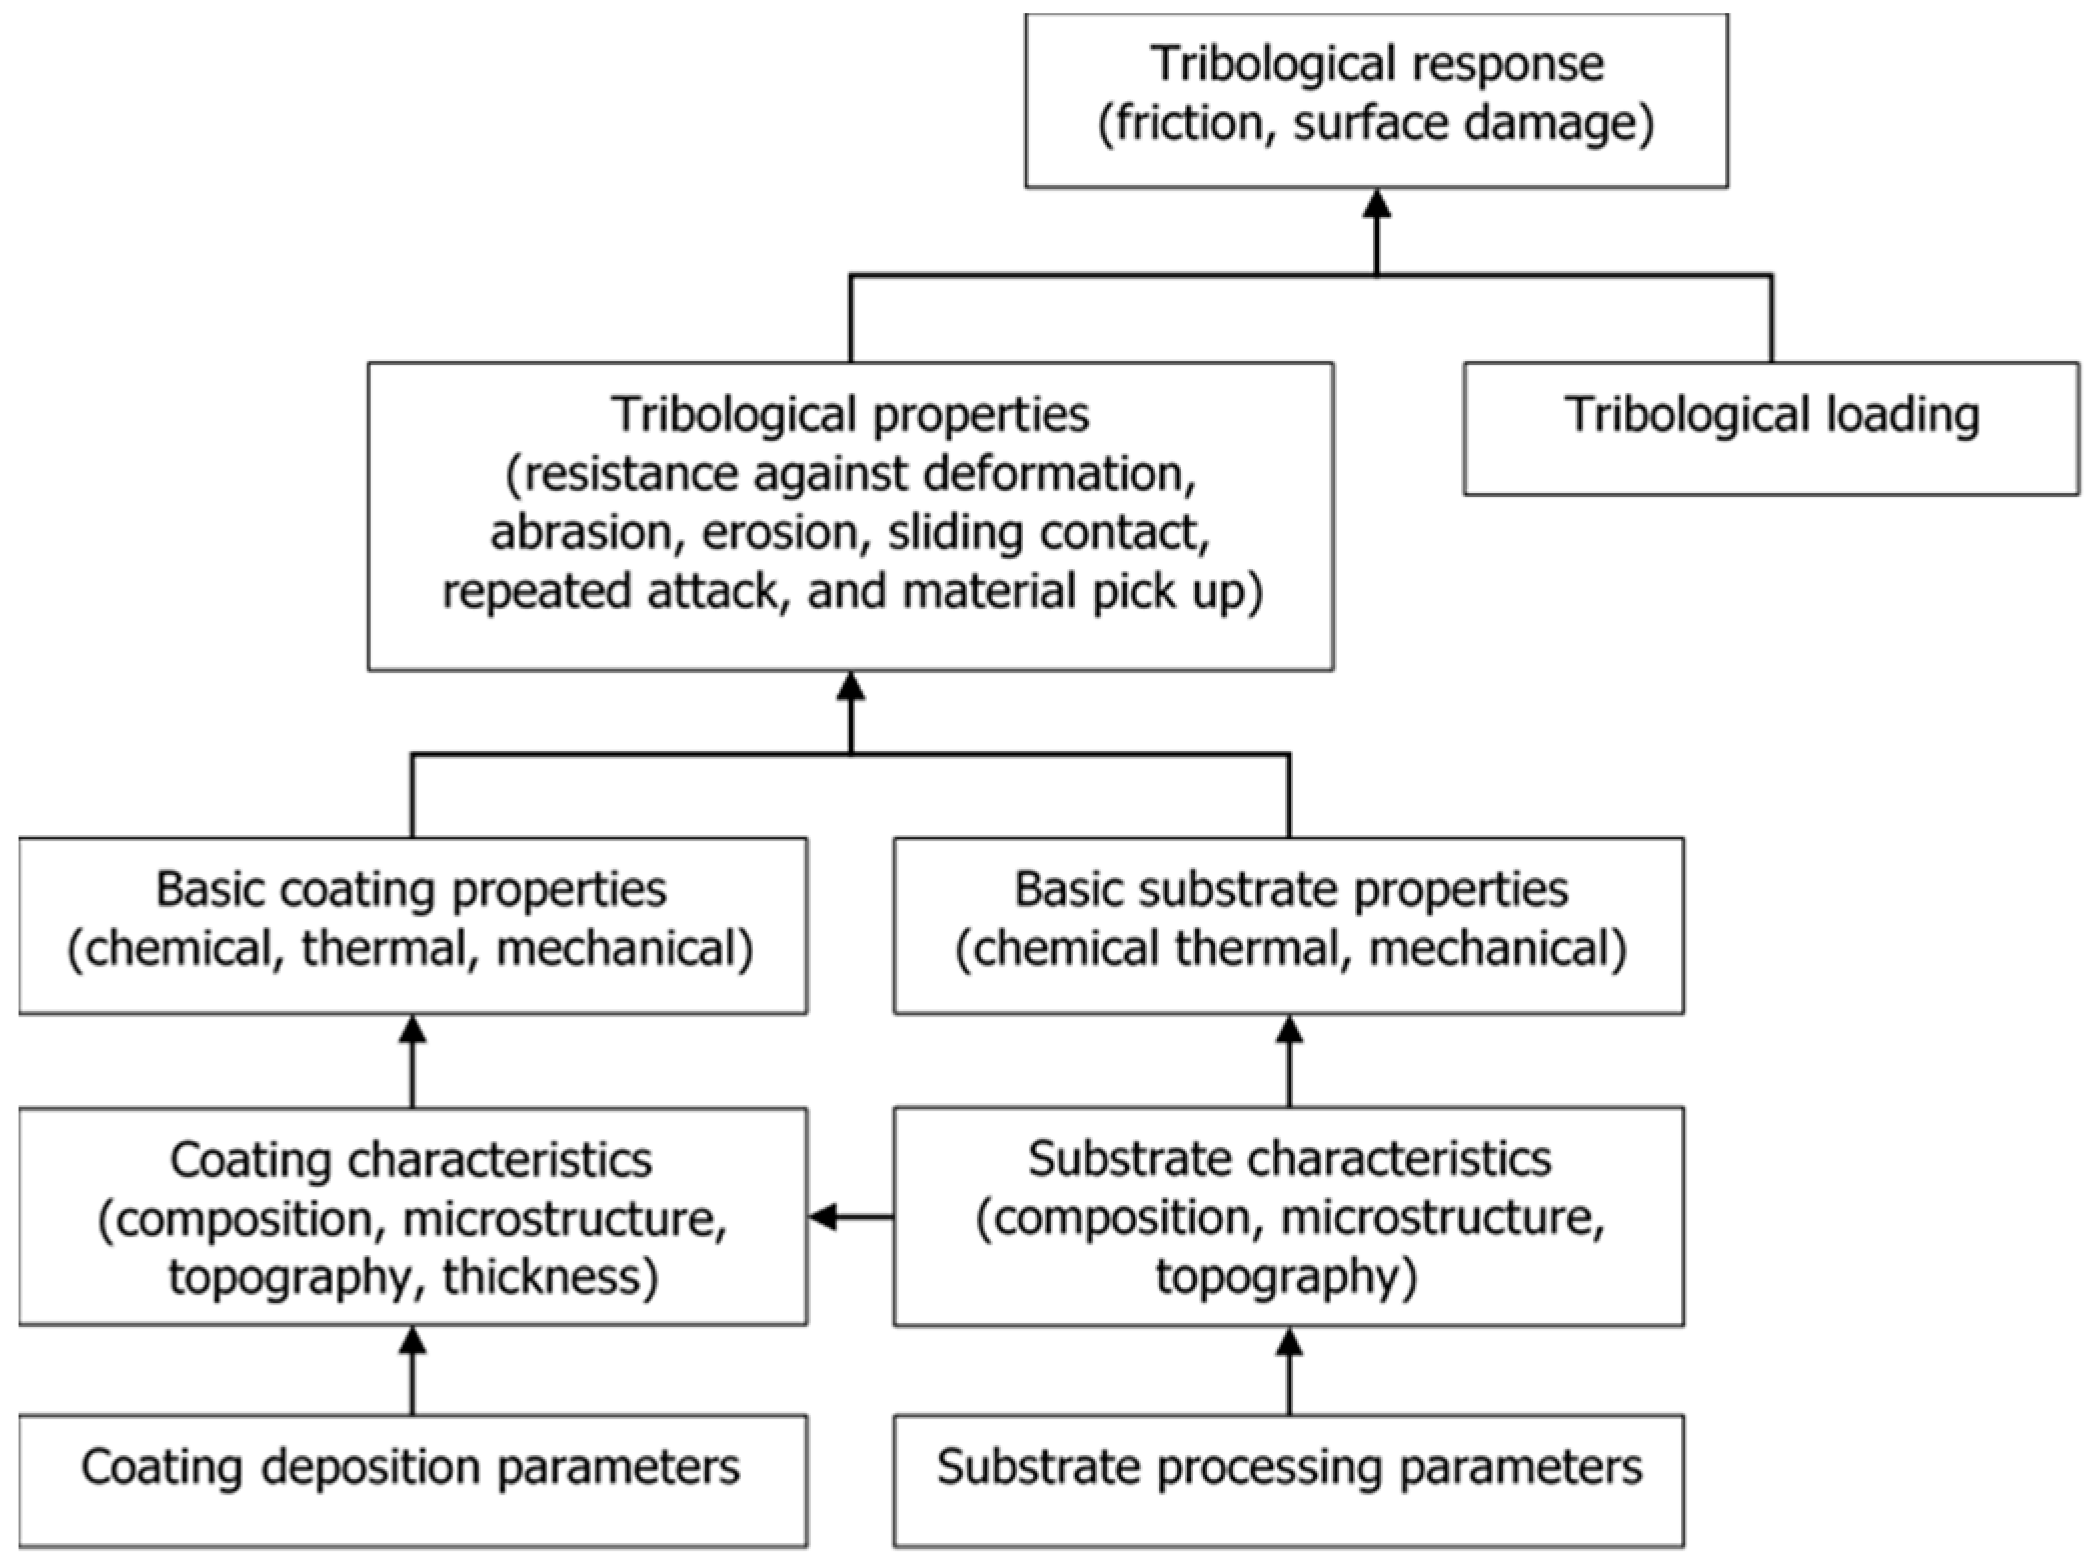
4. Surface Coatings
4.1. Characterization of General Coatings
4.1.1. Young’s Modulus
- = slope of the tensile curve
- = slope of force vs. strain for the two strain gauges (determined separately)
- = Young’s modulus of the substrate material (known)
- = width of the coated sample
- = thickness of the coating
- = thickness of the substrate
4.1.2. Residual Stress
- = biaxial modulus of the substrate
- = substrate thickness
- = coating thickness
- = radius of curvature after coating deposition
- = radius of curvature before coating deposition
4.1.3. Hardness
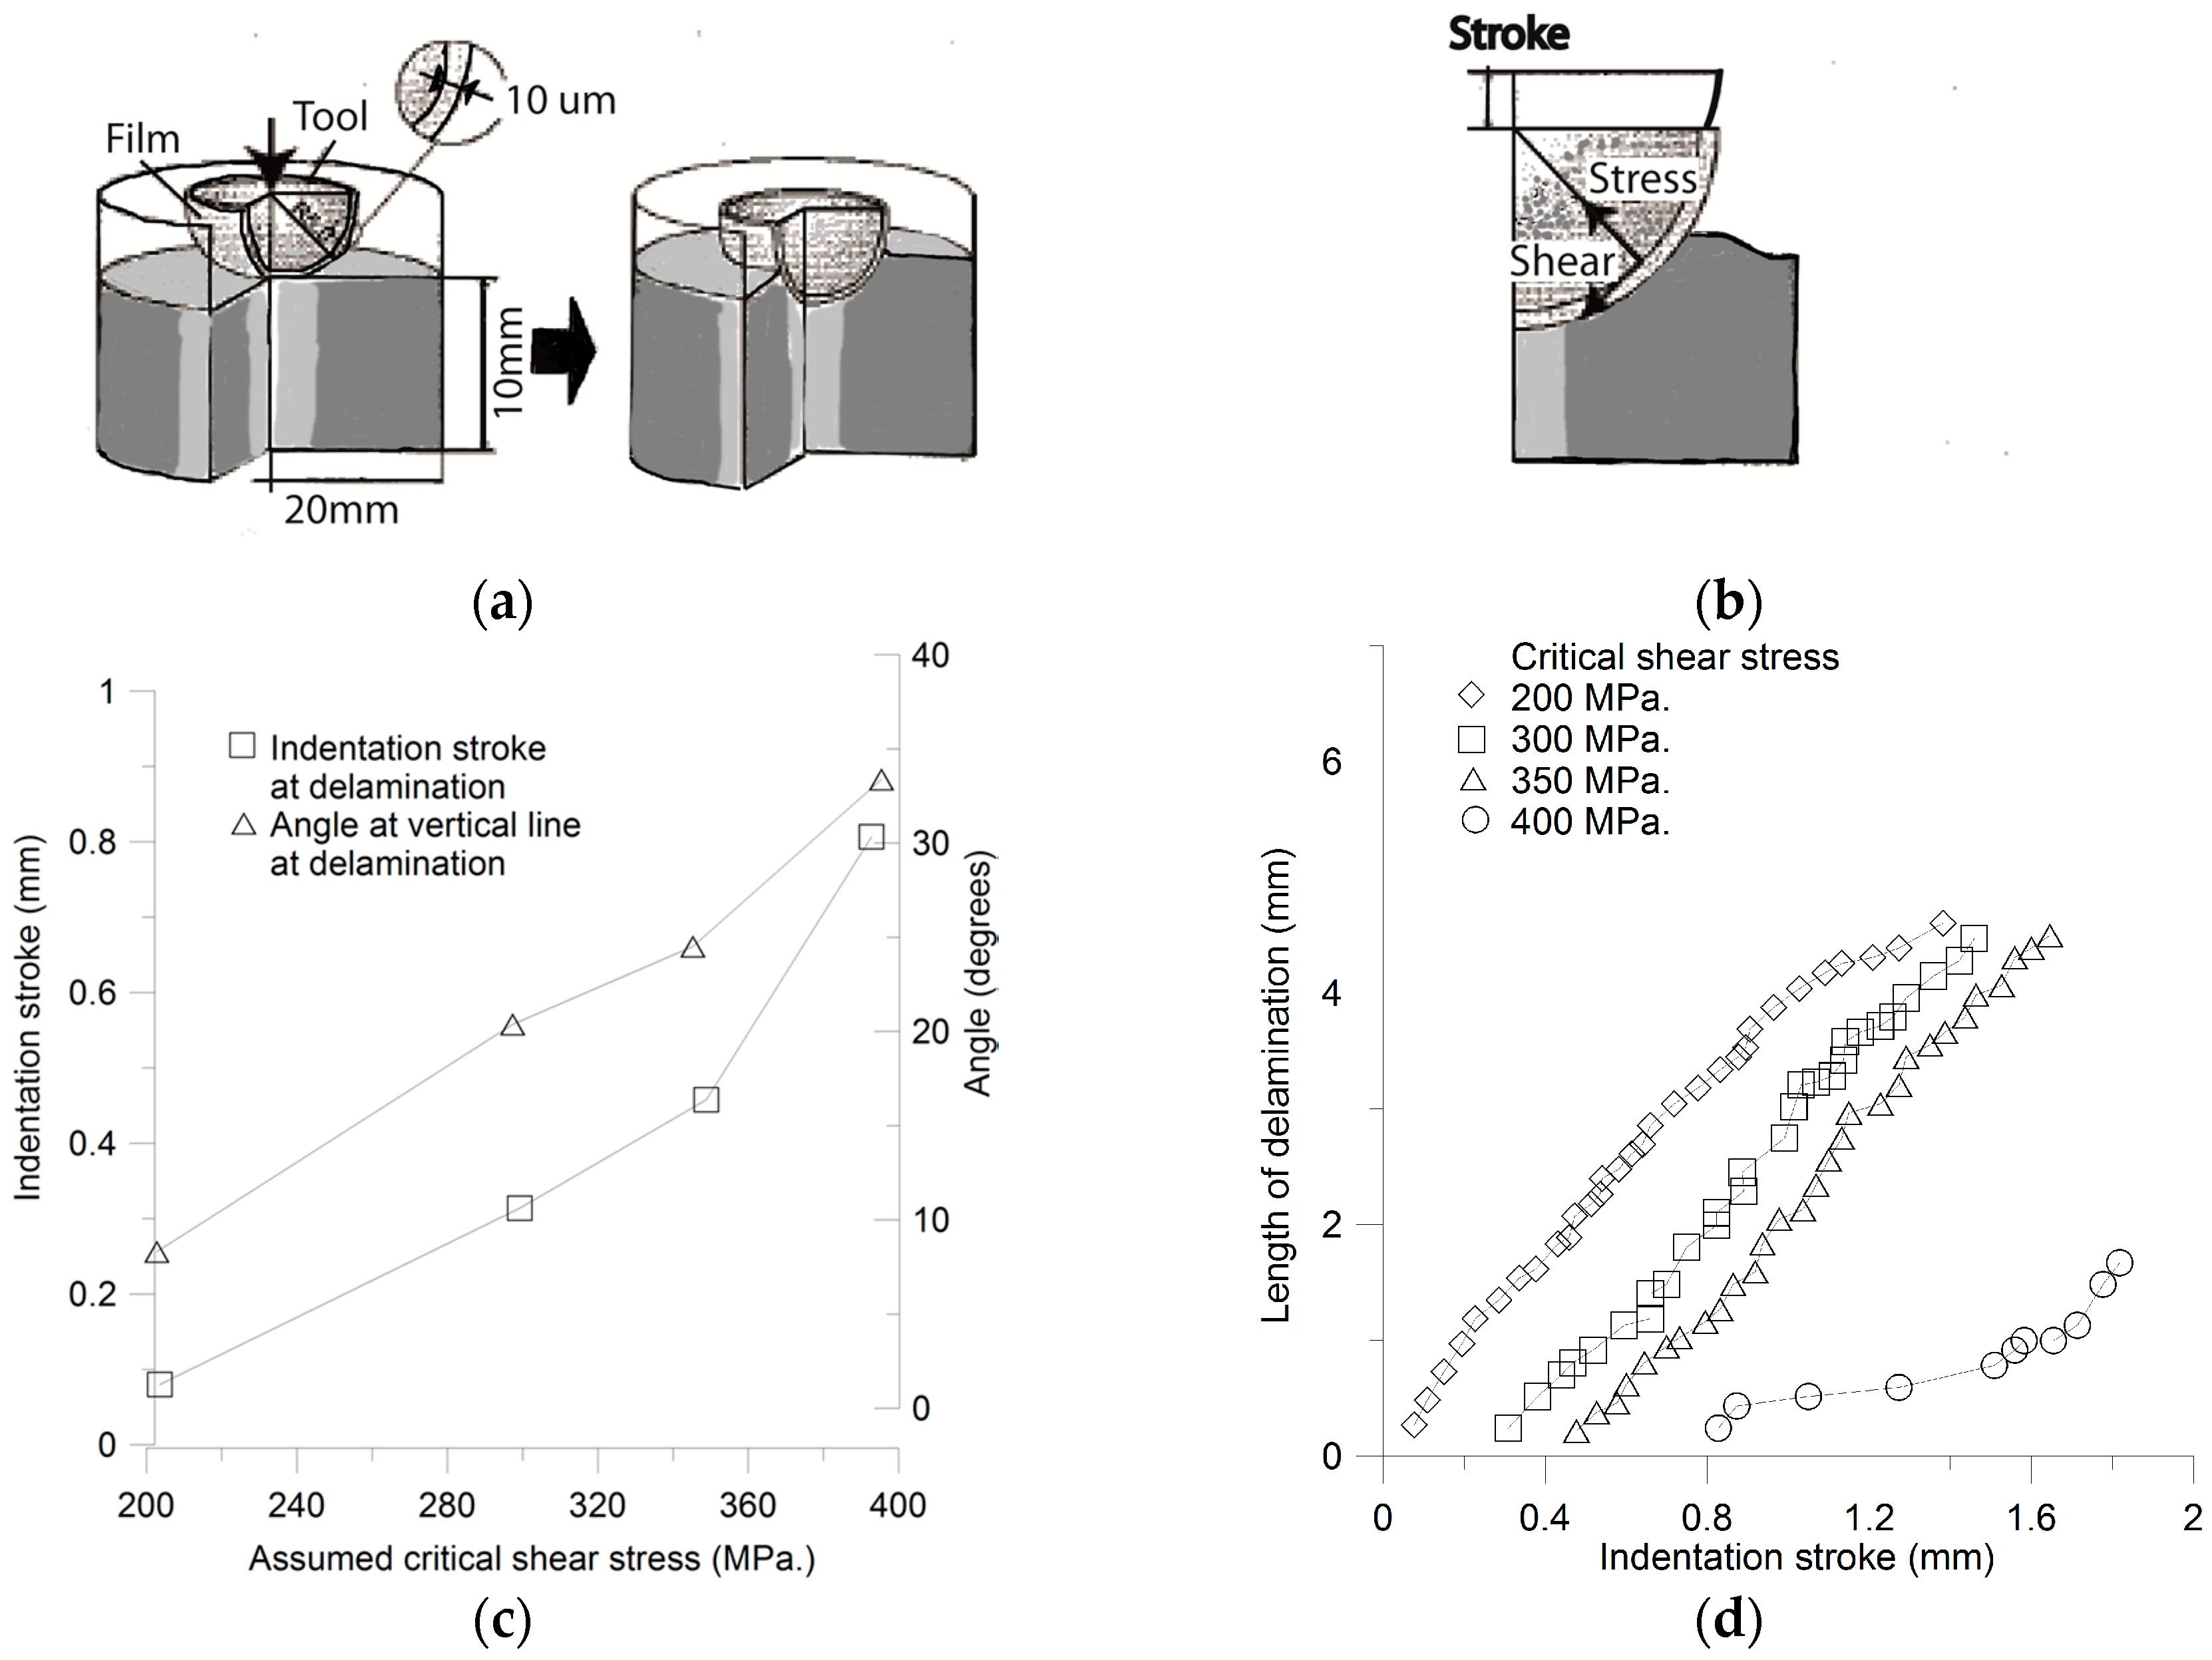
4.1.4. Layer Adhesion
4.1.5. Fracture Strength
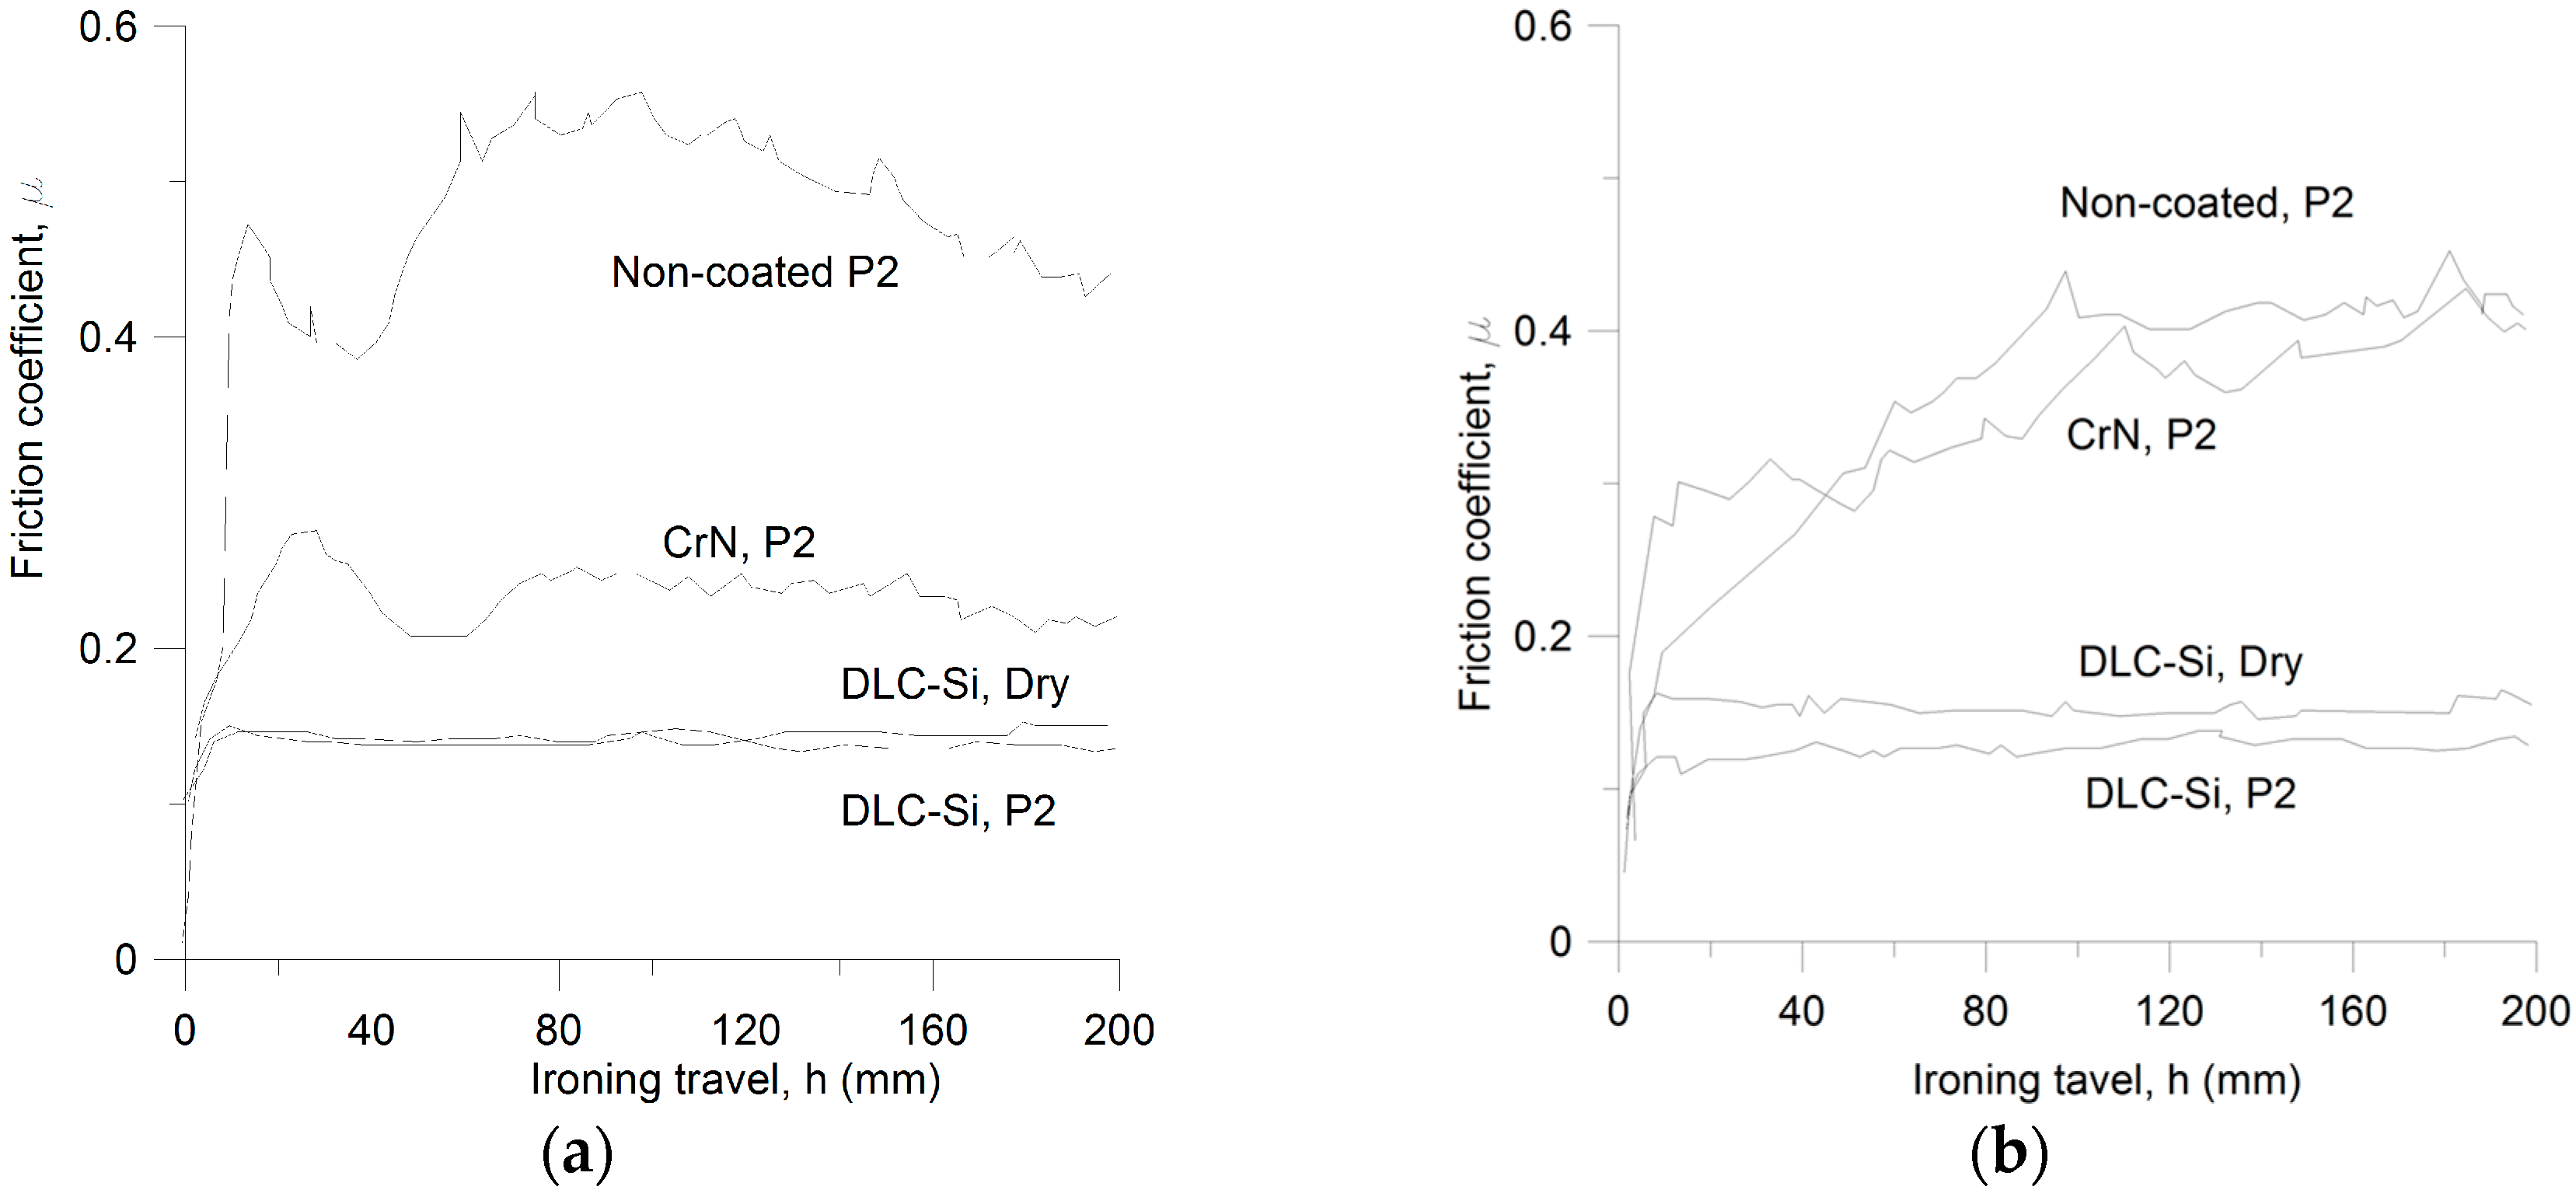
4.2. Lubrication and Tribological Influence of Surface Condition and Coatings on Tool Life
Surface Finish/Roughness
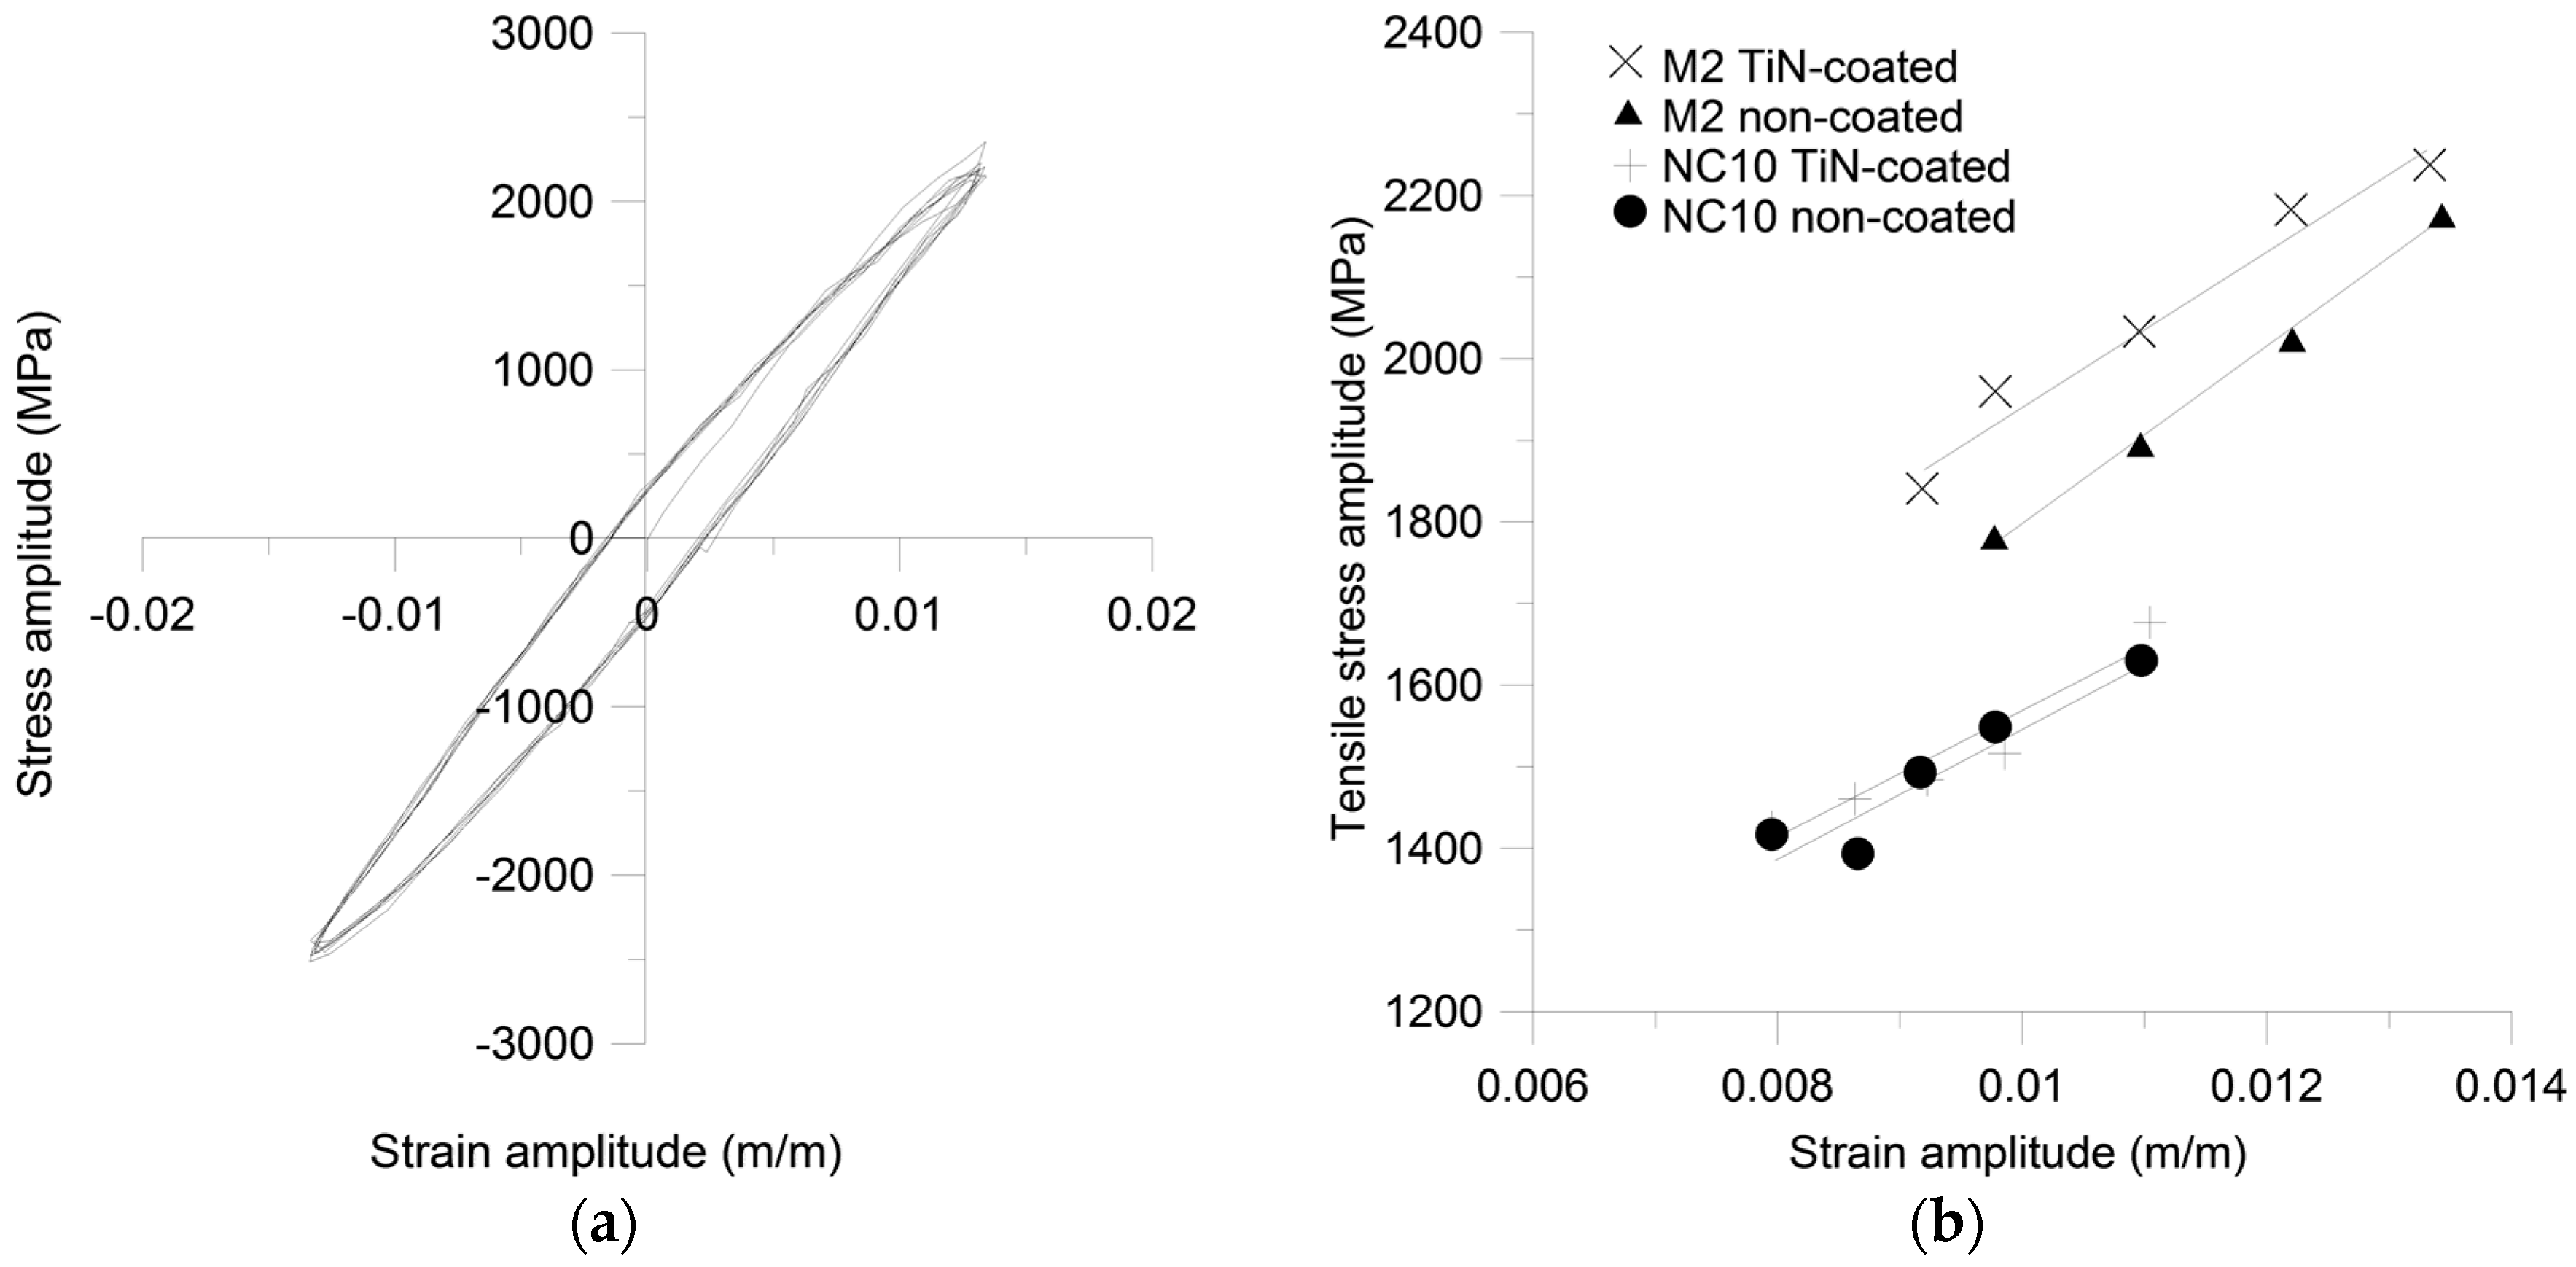
4.3. Influence of Coatings on Fatigue Life
- High hardness and wear resistance without affecting the dimensional tolerances of coated components,
- Suitability for coating small components,
- Good wear protection of specific geometries (e.g., sharp edges),
- Process capability to coat complex shaped components.
- Fatigue test showed that the PECVD/SiO2 coating did not significantly affect the fatigue behavior of the base material with no change in initiation and propagation between the coated and uncoated specimen
- Fatigue crack propagation mechanisms in coated specimens are similar to uncoated specimen.
- Fatigue limit decrease by 10% with respect to uncoated material
5. Surface Characteristics Change in Service and Influence on Wear Resistance
6. Critical Issues Particular to Microforming
7. Concluding Remarks
Acknowledgments
Author Contributions
Conflicts of Interest
References
- Del Pozo, D.; de Lacalle, L.N.L.; López, J.M.; Hernández, A.A. Prediction of press/die deformation for an accurate manufacturing of drawing dies. Int. J. Adv. Manuf. Technol. 2008, 37, 649–656. [Google Scholar] [CrossRef]
- Knoerr, M.; Lange, K.; Altan, T. Fatigue failure of cold forging tooling: Causes and possible solutions through fatigue analysis. J. Mater. Process. Technol. 1994, 46, 57–71. [Google Scholar] [CrossRef]
- Lange, K.; Hettig, A.; Knoerr, M. Increasing tool life in cold forging through advanced design and tool manufacturing techniques. J. Mater. Process. Technol. 1992, 35, 495–513. [Google Scholar] [CrossRef]
- GroenBaek, J.; Hensel, C. Advanced Material and Prestress Design of Cold Forging Die. In Proceedings of the 7th ICTP Conference on Advanced Technology of Plasticity, Yokohama, Japan, 28–31 October 2002; pp. 339–350.
- Meidert, M.; Hansel, H. Net shape cold forging to close tolerances under QS 9000 aspects. J. Mater. Process. Technol. 2000, 98, 150–154. [Google Scholar] [CrossRef]
- Tabe, H. Location of crack occurrence in tools. In Proceedings of the Stål 2004, Borlänge, Sweden, 5–6 May 2004.
- Broeckmann, C. Microstructure and mechanical properties of tool steel. In Proceedings of the 5th International Conference on Tooling, Leoben, Austria, 29 September–1 October 1999; pp. 49–58.
- Broeckmann, C. Fracture of tool steel on a microscopic scale. In Proceedings of the 4th International Conference on Tooling, Boston, MA, USA, 18–22 November 1996; pp. 491–500.
- Li, S. Improve tool life of cold work tools with the use of powder metallurgy tool steels: Understand factors affecting tool life and some common tooling problems. In Proceedings of the 5th International Conference on Tooling, Leoben, Austria, 29 September–1 October 1999.
- Bohm, H.J.; Eckschlager, A.; Han, W. Modelling phase arrangement effects in high speed tool steels. In Proceedings of the 5th International Conference on Tooling, Leoben, Austria, 29 September–1 October 1999; pp. 147–156.
- Plankensteiner, A.F.; Rammerstofer, F.G.; Buyachenko, V.A.; Hackl, G. Micro-Meso-Macro-mechanical modelling of the strength behaviour of tool steel. In Proceedings of the 4th International Conference on Tooling, Setubal, Portugal, 25–28 August 2004; pp. 481–490.
- Falk, B.; Engel, U.; Geiger, M. Estimation of tool life in bulk metal forming based on different failure concepts. J. Mater. Process. Technol. 1998, 80–81, 602–607. [Google Scholar] [CrossRef]
- Skov-Hansen, P.; Bay, N.; Gronbaekc, J.; Brondsted, P. Fatigue in cold-forging dies: Tool life analysis. J. Mater. Process. Technol. 1999, 95, 40–48. [Google Scholar] [CrossRef]
- Lee, H.C.; Saroosh, M.A.; Song, J.H.; Im, Y.T. The effect of shrink fitting ratios on tool life in bolt forming processes. J. Mater. Process. Technol. 2009, 209, 3766–3775. [Google Scholar] [CrossRef]
- Fu, M.W.; Lu, J.; Chan, W.L. Die fatigue life improvement through the rational design of metal-forming system. J. Mater. Process. Technol. 2009, 209, 1074–1084. [Google Scholar] [CrossRef]
- Lee, H.C.; Lee, Y.; Lee, S.Y.; Choi, S.; Lee, D.L.; Im, Y.T. Tool life prediction for the bolt forming process based on high-cycle fatigue and wear. J. Mater. Process. Technol. 2008, 201, 348–353. [Google Scholar] [CrossRef]
- Wan, W.S.F.S.; Tay, Z.H. Process modelling and simulation of vibratory finishing of fixtured components. In Proceedings of the Euspen International Conference, Delft, The Netherlands, 31 May–4 June 2010.
- Yokoi, D.; Tsujii, N.; Isomoto, T. Effect of carbide size on mechanical properties of cold work steels. In Proceedings of the 5th International Conference on Tooling, Leoben, Austria, 29 September–1 October 1999.
- Engel, U. Prediction of tool failure from a probabilistic point of view. J. Mater. Process. Technol. 1994, 42, 1–13. [Google Scholar] [CrossRef]
- Sohar, C.R.; Betzwar-Kotas, A.; Gierl, C.; Weiss, B.; Danninger, H. Gigacycle fatigue behavior of a high chromium alloyed cold work tool steel. Int. J. Fatigue 2008, 30, 1137–1149. [Google Scholar] [CrossRef]
- Elvira, R.; Gonzalez, L.; de Andoin, A.G.; Molinera, J.; Bertrand, C. Influence of the nature of inclusion population on the low cycle fatigue life of ultra clean high strength steels. In Proceedings of the Stål 2004, Borlänge, Sweden, 5–6 May 2004.
- Meurling, F.; Melander, A.; Tidesten, M.; Westin, L. Influence of carbide and inclusion contents on the fatigue properties of high speed steels and tool steels. Int. J. Fatigue 2001, 23, 215–224. [Google Scholar] [CrossRef]
- Haglund, S. Influence of inclusions in steels during fatigue. In Proceedings of the Stål 2004, Borlänge, Sweden, 5–6 May 2004.
- Meurling, F. FATSIMR—Fatigue Limit Prediction Software for High Speed Steel and Cold Work Steel Specimens; Report IM-1999-547; Swedish Institute for Metals Research: Stockholm, Sweden.
- Fredriksson, G.; Bergstrom, J.; Hogmark, S. Fatigure resistance and surface properties of EDMed cold work steels. In Proceedings of the 4th International Conference on Tooling, Boston, MA, USA, 18–22 November 1996; pp. 445–456.
- Lavender, C.A.; Honga, S.-T.; Smith, M.T.; Johnson, R.T.; Lahrman, D. The effect of laser shock peening on the lifeand failure mode of a cold pilger die. J. Mater. Process. Technol. 2008, 204, 486–491. [Google Scholar] [CrossRef]
- Wagner, K.; Putz, A.; Engel, U. Improvement of tool life in cold forging by locally optimized surfaces. J. Mater. Process. Technol. 2006, 177, 206–209. [Google Scholar] [CrossRef]
- Wagner, K.; Völkl, R.; Engel, U. Tool life enhancement in cold forging by locally optimized surfaces. J. Mater. Process. Technol. 2008, 201, 2–8. [Google Scholar] [CrossRef]
- Bergman, F.; Hedenqvist, P.; Hogmark, S. The influence of primary carbides and test parameters on erosive wear of selected PM high speed steels. Tribol. Int. 1997, 30, 183–191. [Google Scholar] [CrossRef]
- Tidesten, M.; Moser, P. Abrasive wear of tool steels; tests versus application studies. In Proceedings of the 4th International Conference on Tooling, Boston, MA, USA, 18–22 November 1996; pp. 83–92.
- Dohda, K.; Kubota, H.; Tsuchiya, Y.; Taniguchi, Y. Application of hard coatings to ironing dies. In Proceedings of the ICTP Conference on Advanced Technology of Plasticity, Verona, Italy, 9–13 October 2005; p. 329.
- Takaishi, K.; Iwaki, T.; Kondo, T.; Sasaki, K.; Abe, Y. Extension of blanking die life by surface coatings. In Proceedings of the 7th ICTP Conference on Advanced Technology of Plasticity, Yokohama, Japan, 28–31 October 2002.
- Tsuchiya, Y.; Dohda, K.; Kitamura, K. Improvement in anti-flaking properties of DLC-Si coatings and applications to forming die. In Proceedings of the 7th ICTP Conference on Advanced Technology of Plasticity, Gyeongju, Korea, 7–11 September 2008.
- Takatsuji, N.; Dohda, K.; Makino, T.; Yoshimura, T. Iinfluence of die coating on forming of micro-parts by forward-backward extrusion. In Proceedings of the 9th ICTP Conference on Advanced Technology of Plasticity, Gyeongju, Korea, 7–11 September 2008.
- Hogmark, S.; Hedenqvist, P. Tribological characterization of thin, hard coatings. Wear 1994, 179, 147–154. [Google Scholar] [CrossRef]
- Hedenqvist, P.; Jacobson, S.; Hogmark, S. Tribological PVD coatings—Characterisation of mechanical properties. Surf. Coat. Technol. 1997, 97, 212–217. [Google Scholar] [CrossRef]
- Gahlin, R.; Bromark, M.; Hedenqvist, P.; Hogmark, S.; Hakansson, G. Properties of TiN and CrN coatings deposited at low temperature using reactive arc-evaporation. Surf. Coat. Technol. 1995, 76–77, 174–180. [Google Scholar]
- Hollman, P.; Larsson, M.; Hedenqvist, P.; Hogmark, S. Tensile testing as a method for determining the Young’s modulus of thin hard coatings. Surf. Coat. Technol. 1997, 90, 234–238. [Google Scholar] [CrossRef]
- Wiklund, U.; Gunnars, J.; Hogmark, S. Influence of residual stresses on fracture and delamination of thin hard coatings. Wear 1999, 232, 262–269. [Google Scholar] [CrossRef]
- Nordin, M.; Larsson, M.; Hogmark, S. Mechanical and tribological properties of multilayered PVD TiN/CrN. Wear 1999, 232, 221–225. [Google Scholar] [CrossRef]
- Bromark, M.; Larsson, M.; Hedenqvist, P.; Hogmark, S. Wear of PVD Ti/TiN multilayer coatings. Surf. Coat. Technol. 1997, 90, 217–223. [Google Scholar] [CrossRef]
- Hayakawa, K.; Nakamura, T.; Tanaka, S.; Harada, K. A Testing Method for Estimation of Adhesion Strength of Interface between Forging Tool and Coated Hard Film. In Proceedings of the 7th ICTP Conference on Advanced Technology of Plasticity, Yokohama, Japan, 28–31 October 2002; pp. 799–804.
- Wang, Z.; Shiraga, H.; Ueda, N.; Matsumoto, T.; Ohhashi, M.; Nakagaki, H. A simple measurement method of compression behavior of cemented carbide for cold forging die. In Proceedings of the 8th ICTP Conference on Advanced Technology of Plasticity, Verona, Italy, 9–13 October 2005.
- Kubota, H.; Wang, Z.; Tsuchiya, Y.; Taniguchi, Y. Damage behavior of DLC-Si Coating by Vicker’s Hardness Test. JSTP 2007, 48, 1017–1021. [Google Scholar] [CrossRef]
- Bay, N. The state of the art in cold forging lubrication. J. Mater. Process. Technol. 1994, 46, 19–40. [Google Scholar] [CrossRef]
- Hanson, M.; Stavlid, N.; Coronel, E.; Hogmark, S. On adhesion and metal transfer in sliding contact between TiN and austenitic stainless steel. Wear 2008, 264, 781–787. [Google Scholar] [CrossRef]
- Berger, M.; Hogmark, S. Tribological properties of selected PVD coatings when slid against ductile materials. Wear 2002, 252, 557–565. [Google Scholar] [CrossRef]
- Bromark, M.; Hedenqvist, P.; Hogmark, S. The influence of substrate material on the erosion resistance of TiN coated tool steels. Wear 1995, 186–187, 189–194. [Google Scholar] [CrossRef]
- Bromark, M.; Larsson, M.; Hedenqvist, P.; Olsson, M.; Hogmark, S. Influence of substrate surface topography on the critical normal force in scratch adhesion testing of TiN-coated steels. Surf. Coat. Technol. 1992, 52, 195–203. [Google Scholar] [CrossRef]
- Podgornik, B.; Hogmark, S.; Sandberg, O. Influence of surface roughness and coating type on the galling properties of coated forming tool steel. Surf. Coat. Technol. 2004, 184, 338–348. [Google Scholar] [CrossRef]
- Podgornik, B.; Hogmark, S. Surface modification to improve friction and galling properties of forming tools. J. Mater. Process. Technol. 2006, 174, 334–341. [Google Scholar] [CrossRef]
- Popp, U.; Neudecker, T.; Engel, U.; Geiger, M. Excimer laser texturing of hard coated cold forging tools—Investigations on tool life. In Proceedings of the 7th ICTP Conference on Advanced Technology of Plasticity, Yokohama, Japan, 28–31 October 2002; pp. 1638–1699.
- Kocanda, A. Analysis of LCF behavior of TiN coated tool steel for cold forging. In Proceedings of the 7th ICTP Conference on Advanced Technology of Plasticity, Yokohama, Japan, 28–31 October 2002; pp. 793–798.
- Wang, Z.; Nakashima, I.; Ohhashi, M.; Matsumoto, T. Fatigue crack growth behaviour of cemented carbide die in cold forging process. In Proceedings of the 8th ICTP Conference on Advanced Technology of Plasticity, Verona, Italy, 9–13 October 2005.
- Baragetti, S.; Tordini, F. Fatigue resistance of PECVD coated steel alloy. Int. J. Fatigue 2007, 29, 1832–1838. [Google Scholar] [CrossRef]
- Gåård, A.; Krakhmalev, P.; Bergstrom, J. Wear Mechanisms in Galling: Cold Work Tool Materials Sliding against High-strength Carbon Steel Sheets. Tribol. Lett. 2009, 33, 45–53. [Google Scholar] [CrossRef]
- Bryggman, U.; Hogmark, S.; Vingsbo, O. Prediction of gouging abrasion resistance of steel by pendulum grooving and other laboratory test methods. Wear 1987, 115, 203–213. [Google Scholar] [CrossRef]
- Jacobson, S.; Hogmark, S. Surface modifications in tribological contacts. Wear 2009, 266, 370–376. [Google Scholar] [CrossRef]
- Geiger, M.; Kleiner, M.; Eckstein, R.; Tiesler, N.; Engel, U. Microforming. CIRP Ann. Manuf. Technol. 2001, 50, 445–462. [Google Scholar] [CrossRef]
- Geiger, M.; Engel, U.; Pfestorf, M. New developments for the qualification of technical surfaces in forming processes. CIRP Ann. Manuf. Technol. 1997, 46, 77–80. [Google Scholar] [CrossRef]
- Engel, U.; Messner, A.; Tiesler, N. Cold forging of microparts—Effects of miniaturization on friction. In Proceedings of the 1st ESAFORM Conference on Materials Forming, Sophia Antipolis, France, 1998; pp. 77–80.
- Engel, U. Tribology in microforming. Wear 2006, 260, 265–273. [Google Scholar] [CrossRef]
- Guo, B.; Gong, F.; Wang, C.; Shan, D. Flow stress and tribology size effects in scaled down cylinder compression. Trans. Nonferrous Met. Soc. China 2009, 19, s516–s520. [Google Scholar] [CrossRef]
- Taureza, M.; Song, X.; Castagne, S. On the influence of workpiece material on friction in microforming and lubricant effectiveness. J. Mater. Process. Technol. 2014, 214, 998–1007. [Google Scholar] [CrossRef]
- Peng, L.; Lai, X.; Lee, H.J.; Song, J.H.; Ni, J. Friction behavior modeling and analysis in micro/meso scale metal forming process. Mater. Des. 2010, 31, 1953–1961. [Google Scholar] [CrossRef]
- Baek, S.W.; Oh, S.I.; Rhim, S.H. Lubrication for micro forming of ultra thin metal foil. CIRP Ann. Manuf. Technol. 2006, 55, 295–298. [Google Scholar] [CrossRef]
- Hu, Z.; Schubnov, A.; Vollertsen, F. Tribological behaviour of DLC-films and their application in micro deep drawing. J. Mater. Process. Technol. 2012, 212, 647–652. [Google Scholar] [CrossRef]
- Wang, C.; Guo, B.; Shan, D.; Bai, X. Tribological behaviors of DLC film deposited on female die used in strip drawing. J. Mater. Process. Technol. 2013, 213, 323–329. [Google Scholar] [CrossRef]
- Brinksmeier, E.; Riemer, O.; Twardy, S. Tribological behavior of micro structured surfaces for micro forming tools. Int. J. Mach. Tools Manuf. 2010, 50, 425–430. [Google Scholar] [CrossRef]
- Geiger, M.; Popp, U.; Engel, U. Excimer laser micro texturing of cold forging tool surfaces—Influence on tool life. CIRP Ann. Manuf. Technol. 2002, 51, 231–234. [Google Scholar] [CrossRef]
- Ghassemali, E.; Tan, M.-J.; Jarfors, A.E.W.; Lim, S.C.V. Progressive microforming process: Towards the mass production of micro-parts using sheet metal. Int. J. Adv. Manuf. Technol. 2013, 66, 611–621. [Google Scholar] [CrossRef]
- Hu, Z.; Luepke, S.H.; von Kopylow, C.; Vollertsen, F. No Characteristic of wear behavior of micro deep drawing tools. In Proceedings of the AIP Conference, Paris, France, 24–27 October 2010; pp. 335–340.


| Materials | K (MPa) | n | DA (nm) | DB (nm) | NW (103) | Nf (103) | Tool Life (103) |
|---|---|---|---|---|---|---|---|
| AISI4135 | 900 | 0.084 | 0.754 | 0.957 | 418 | 133 | 133 |
| AISI1045 | 896 | 0.109 | 1.060 | 0.749 | 377 | 102 | 102 |
| AISI51B20 | 813 | 0.129 | 1.470 | 0.625 | 272 | 321 | 272 |
| AISI10B22 | 779 | 0.104 | 0.799 | 0.666 | 500 | 557 | 500 |
| Material | C | Si | Mn | Cr | Mo | W | V | Nb |
| ASP2014 | 0.75 | 0.3 | 0.4 | 4.1 | 3.0 | 3.0 | 1.0 | 1.0 |
| E M2′′ | 0.87 | 0.3 | 0.4 | 4.2 | 5.0 | 6.4 | 2.0 | - |
| M2 PM | 0.87 | 0.3 | 0.4 | 4.2 | 5.0 | 6.4 | 2.0 | - |
| ASP 23 CC | 1.28 | 0.3 | 0.4 | 4.2 | 5.0 | 6.4 | 3.0 | - |
| ASP 2023 | 1.28 | 0.3 | 0.4 | 4.2 | 5.0 | 6.4 | 3.0 | - |
| ASP 2053 | 2.50 | 0.3 | 0.4 | 4.2 | 3.0 | 4.0 | 8.0 | - |
| Material | vol % Primary Carbide | Primary Carbide Diameter | Bulk Hardness | |||||
| M6C | MC | M6C + MC | MC | M6C + MC | (HVm) | |||
| ASP2014 | a | 2.9 ± 0.4 | 2.9 ± 0.4 | 0.5 | 1.7 | 83O ± 10 | ||
| E M2 | 8.1 ± 3.2 | a | 8.1 ± 3.2 | 3.2 b | 10.5 b | 930 ± 20 | ||
| M2 PM | 10.0 ± 1.5 | a | 10.0 ± 1.5 | 2.5 | 5.4 | 900 ± 20 | ||
| ASP 23 CC | 6.3 ± 0.7 | 6.2 ± 0.8 | 12.5 ± 1.5 | 3.1 | 4.2 | 900 ± 10 | ||
| ASP 2023 | 8.1 ± O.6 | 5.4 ± 0.9 | 13.5 ± 1.5 | 1.2 | 2.2 | 930 ± 20 | ||
| ASP 2053 | - | 16.2 ± 1.4 | 16.2 ± 1.4 | 2.4 | 2.7 | 920 ± 20 | ||
| Die Material | Surface Coating | Thickness of Coating (mm) | Heat Treatment | Number of Blankings | Extension Ratio | Damage of Die Material |
|---|---|---|---|---|---|---|
| SKD11 | None | - | Normal | 7000 | 1.00 | None: worn out |
| SKD11 | None | - | Normal+CP 3 | 14500 | 2.07 | None: worn out |
| SKD11 | PVD Me-DLC | 0.002 | Normal | 23519 | 3.36 | Small chipping |
| SKD11 | PVD DLC | 0.002 | Normal | 18413 | 2.63 | None: worn out |
| SKD11 | PVD DLC | 0.002 | Normal | 13000 | 1.86 | Peeling |
| SKD11 | PVD DLC | 0.005 | Normal | 12000 | 1.71 | Peeling |
| SKD11 | ED-coat | 0.01 | Normal | 27500 | 3.93 | None: worn out |
| SKD11 | ED-coat | 0.01 | Normal+CP 3 | 20100 | 2.87 | Chipping |
| SKD11 | ED-coat | 0.01 | Normal+CP 3 | 21900 | 3.13 | Chipping |
| SKD11 | ED-coat | 0.01 | Normal+CP 3 | 62000 | 8.86 | None: worn out |
| HSS 1 | None | - | Normal | 24000 | 3.43 | None: worn out |
| HSS 1 | ED-coat | 0.01 | Normal | 8300 | 1.19 | Chipping |
| VS 2 | ED-coat | 0.01 | Normal | 15667 | 2.24 | Chipping |
| Coating Property | Characterization Method(s) |
|---|---|
| Chemical composition | Energy dispersive X-ray spectroscopy (EDX) Auger electron spectroscopy Glow discharge optical emission spectroscopy (GDOES) |
| Microstructure and morphology | Transmission electron microscopy (TEM) Scanning electron microscopy (SEM) Light optical microscopy X-ray diffraction |
| Residual stress state | X-ray diffraction Substrate deflection |
| Thickness | Ball grinding Cross-section microscopy X-ray fluorescence |
| Hardness | Extrapolation Theoretical models |
| Adhesion to substrate | Scratch adhesion testing |
| Fracture toughness | Indentation Microscopy observation of crack patterns Acoustic emission Bend test in Scanning electron microscope |
| Young’s modulus | Vibrating reed Membrane Bulge Beam bending Indentation Uniaxial tensile Tensile |
| Coating Material | Substrate Thickness (μm) | Young’s Modulus (Coating) (GPa) |
|---|---|---|
| TiN | 75 | 425 ± 80 |
| 48 | 400 ± 60 | |
| 23 | 380 ± 30 | |
| NbN | 75 | 350 ± 50 |
| Process | Deformation | Lubrication | Friction Coefficient μ * |
|---|---|---|---|
| Upsetting | Light | None | 0.2 |
| Mi + EP+ FA | 0.1 | ||
| Severe | Ph + SP | 0.1 | |
| Ironing and open die extrusion | Light | Ph + Mi + EP + FA | 0.1 |
| Severe | Ph + SP | 0.05 | |
| Extrusion | Light | Ph + Mi + EP + FA | 0.1 |
| Severe | Ph + SP | 0.05 | |
| Ph + MoS2 | 0.1 | ||
| Ph + MoS2 + SP | 0.05 |
| Lubricant System | Lubricant Performance | Advantages | Disadvantages |
|---|---|---|---|
| Oil | Moderate lubricity | Easy to handle | |
| Grease | Moderate lubricity | Easy to handle | |
| Zinc stearate | Good lubricity | Easy to handle | Dust problems |
| Phosphate coating + lubricant | Very good lubricity | Low treatment temperature Applicable to all aluminium alloys | Very difficult bath control Difficult disposal Limited life time of bath |
| Aluminate coating + lubricant | Excellent lubricity | Easy disposal Low treatment temperature Applicable to all aluminium alloys | Difficult bath control Agitation of the bath required Limited life time of the bath |
| Aluminium fluoride coating + lubricant | Excellent lubricity | Short treatment time Easy bath control Applicable to all aluminium alloys | Hazardous working environment High treatment temperature Difficult disposal Short life time of bath |
© 2016 by the authors. Licensee MDPI, Basel, Switzerland. This article is an open access article distributed under the terms and conditions of the Creative Commons Attribution (CC BY) license ( http://creativecommons.org/licenses/by/4.0/).
Share and Cite
Jarfors, A.E.W.; Castagne, S.J.; Danno, A.; Zhang, X. Tool Wear and Life Span Variations in Cold Forming Operations and Their Implications in Microforming. Technologies 2017, 5, 3. https://doi.org/10.3390/technologies5010003
Jarfors AEW, Castagne SJ, Danno A, Zhang X. Tool Wear and Life Span Variations in Cold Forming Operations and Their Implications in Microforming. Technologies. 2017; 5(1):3. https://doi.org/10.3390/technologies5010003
Chicago/Turabian StyleJarfors, Anders E. W., Sylvie J. Castagne, Atsushi Danno, and Xinping Zhang. 2017. "Tool Wear and Life Span Variations in Cold Forming Operations and Their Implications in Microforming" Technologies 5, no. 1: 3. https://doi.org/10.3390/technologies5010003