An Analysis of Best Practice Patterns for Corporate Social Responsibility in Top IT Companies


Computer Engineering & Computer Science, California State University of Long Beach, Long Beach, CA 90840, USA
*
Authors to whom correspondence should be addressed.
Technologies 2018, 6(3), 76; https://doi.org/10.3390/technologies6030076
Submission received: 20 July 2018
/
Revised: 8 August 2018
/
Accepted: 11 August 2018
/
Published: 15 August 2018
(This article belongs to the Special Issue Advanced Green Information and Communication Technology)
Abstract
:In order to show their compliance with Corporate Social Responsibility (CSR) goals, companies report their “sustainable initiatives” into their CSR reports. However, from small companies to multinational, it is hard to see the real benefits of sustainable strategies’ implementation, since there are actually no general patterns defined which can ensure high impacts on sustainability. Moreover, there are few metrics and process to assess the efficiency of a sustainability strategy, but the different studies made in that field can show different results, this induces a part of uncertainty to evaluate the performance of a sustainable strategy. Therefore, in this paper, we contribute a pattern approach to implementing sustainability in a company. To do that, we performed an analysis of the 25 CSR reports coming from the 25 biggest companies in the IT sector in order to extract sustainability patterns that are provided in an online catalog to (1) give first tracks to companies which would engage in sustainability initiatives and do not really know where to start; and (2) to give an indicator to companies who already have taken up sustainability initiatives and would like to establish an evaluation of it.
1. Introduction
According to the 2015 Centre for Energy-Efficient Telecommunications (CEET) report [1], Information and Communication Technology (ICT) represents around 2% of the global CO2 emissions. If we look at the energy consumption of the Internet, it represents between 1.5% and 2% of the world energy consumption, meaning that if the Internet were a country, it would be ranked as the fifth largest energy consumer in the world. This energy consumption is expected to double by 2020 if no actions are taken to reduce it. Moreover, from a social point of view, the increasing level of new technologies released in that sector induces a higher level of complexity in the education for future and current workers.
Behind Information and Communication Technology (ICT) and the Internet, there are all the IT companies which are the entity that can help solve these issues. Unfortunately, it is hard for a company to implement strategies to increase their sustainability since it is time consuming and has a lot of parameters (social, environmental, and economic) on the which a company can have positive impacts. Moreover, most of the recent studies related to companies’ sustainability through the topic of Corporate Social Responsibility (CSR) mainly focus either on economic aspects, such as financial performance [2,3,4] or marketing [5,6,7,8]; or on the performance of specific CSR strategy (employee voluntariness [9], consumer engagement [10], anti-corruption policy [11], etc.). But there are no studies about general CSR strategies that can promise a significant impact on corporates’ sustainability. In other words, there are no CSR patterns for companies that would like to engage into sustainability. Thus, we identified two main research gaps. First, there are no studies analyzing the actual content of CSR reports in an IT company context. Meaning that there is no research investigating best practices in CSR strategies. Second, which is quite related to the first one, we realized that there is no general set of ready-to-implement sustainable strategies at a global level, most of the research focusing on the impact of a specific initiative or on a specific impact coming from different initiatives. Therefore, our research objective is to extract general patterns showing high impacts on sustainability at an IT company level.
Therefore, our main research question will be what an IT company can do as a means to improve its sustainability. We decomposed this question into four sub-questions:
- What are the different sustainability initiatives and strategies coming from the biggest IT companies regarding the different dimensions of CSR?
- What are the success patterns in these strategies and initiatives?
- What are the different (potential) benefits and outcomes?
- How to assess or evaluate them using metrics?
In order to answer these questions, we decided to collect the CSR reports coming from the 25 biggest IT companies regarding their annual turnover based on a previous paper [12], available in Appendix A. Our objective is to explore these reports to extract repeatable sustainable strategies regarding the categories defined on ISO 26000 [13], these repeatable strategies will then form a set of sustainability patterns. We then investigate the different compositions of these patterns and cover all the issues described in the precedent paragraphs. We also identify a way on how we can best represent the data model defined in this research, in order to be able to represent the results in an online catalog in the future. In short, the contribution of this research is to carry out an analysis of 25 CSR reports to extract sustainability patterns for sharing them through an online catalog. The study claims that this can help to guide companies willing to engage in sustainability initiatives, but also provides them with an indicator for sustainability evaluation purposes.
2. Background
In this part, we describe the different concepts involved in this research. Starting with an overview of the evolution of the concept of CSR showing its different aspects, we then move to the state of the art of sustainable business practices describing how we can formulate a sustainable business practice and the issues related to its implementation. Finally, we analyze the concept of patterns and define what a pattern in CSR represents for us.
Corporate Social Responsibility (CSR) has been a constant area of investigation since the beginning of the 1950’s. According to Carroll’s literature review (1999) [14], the first definition of CSR was given by Bowen (1953) [15]. In this definition, Bowen considered the 100 biggest corporate entities as “a vital point of power and decision making”, therefore any actions or initiatives of this “vital point” would obviously have an effect on citizens. In other words, this first definition only takes into account social impacts as direct responsibility from corporations.
After this first definition, the concept of CSR went a long way and began to include economic impacts in addition to the social ones. In 1991, Carroll defined CSR as a pyramid build built around four pillars [16]: Philanthropical, Ethical, Legal, and Economic. Moreover, Moir [17] went a bit further and defined three theories to define CSR. The stakeholder theory, which implies that corporates have only an impact on their different stakeholders, and, therefore, that companies should then just try to improve themselves on their effect in this category; the social contract theory which estimates that businesses should consider what matters prior to the society and act depending on society’s expectations; this theory is quiet linked to the legitimacy theory which says that corporates should only consider the actions and initiatives that influence their legitimacy, in order to use it as a publicity [17].
In the beginning of the millennium, the international community started to strongly consider climate change as a global and urgent threat which should be fought by inverting its process, this consideration was especially translated by the ratification to the protocol of Kyoto (1997, applied in 2005) [18]. Therefore, the concept of corporate social responsibility had to evolve in order to integrate these environmental aspects and match the political expectations of society. This has led to a huge proliferation of definitions of CSR between 2000 and 2005 [19]. In order to get an unbiased definition of CSR, Dahlsrud [19] decided to perform a content analysis of 37 definitions of CSR, definitions, which were dated from 1980 to 2003. He concluded that CSR is composed of five dimensions as shown in Table 1.
We can already notice that Corporate Social Responsibility is deriving from the concept of sustainable development at a level of a company; since it includes three pillars, social, economic, and environmental.
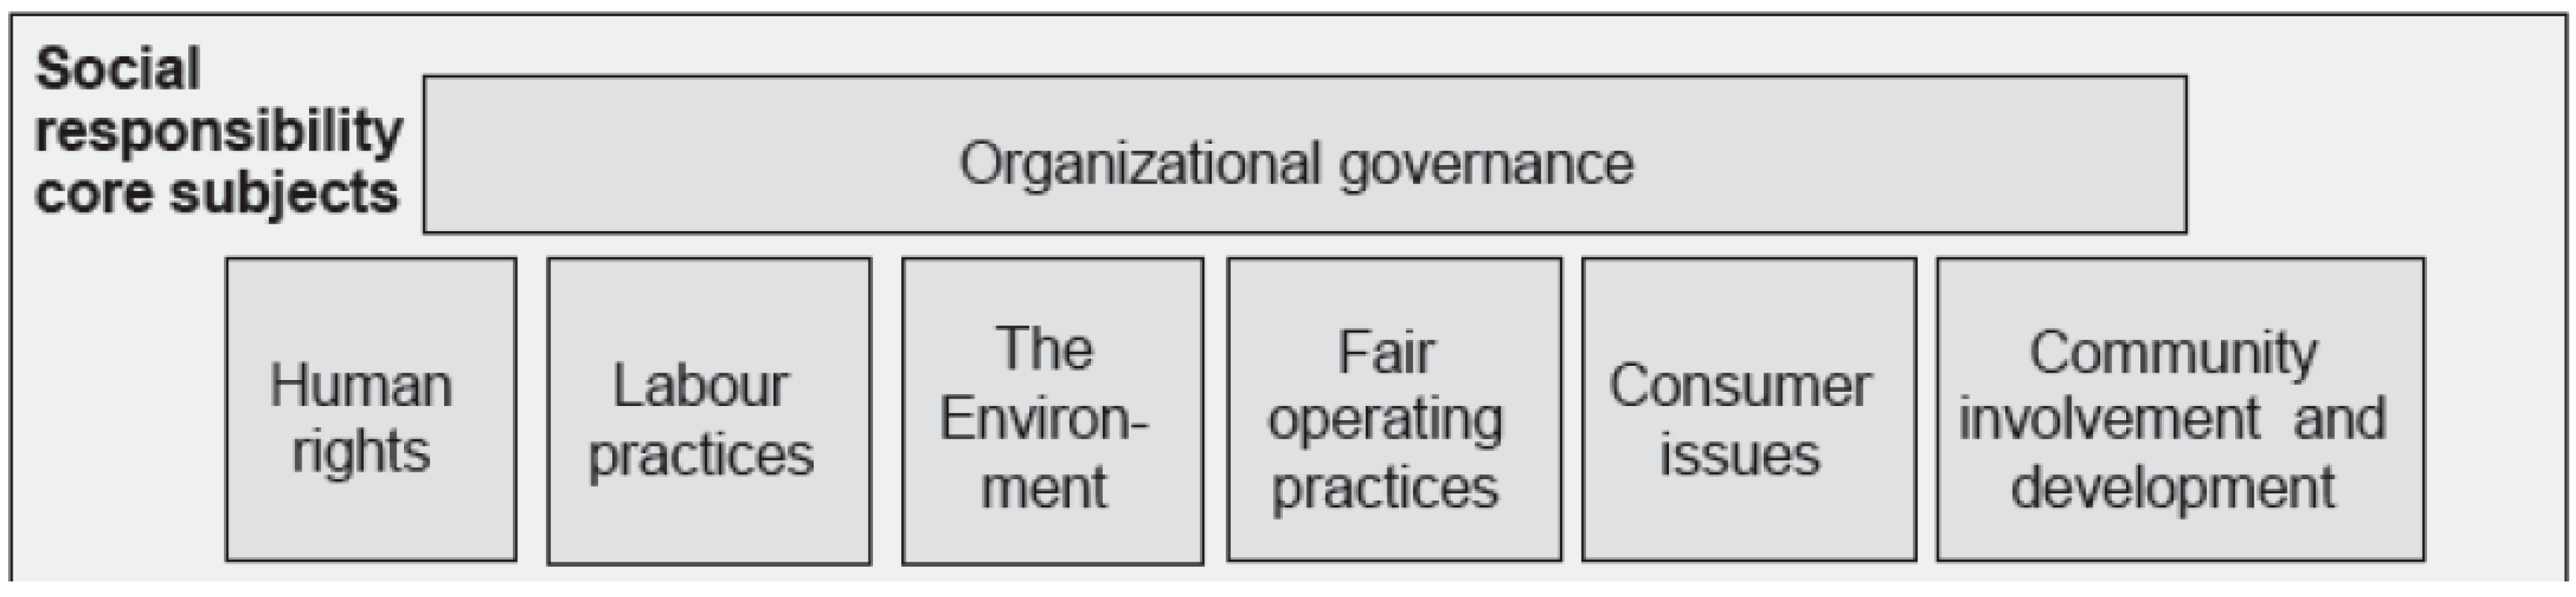
In the very beginning of the decade the norm ISO 26000 was published (2010). Herciu (2016) proposed an analysis of this norm [13]. According to her, this norm has the objective to define Corporate Social Responsibility, describing then the different categories of impact of Corporate Responsibility, which are Community involvement, Labor Practices, Environmental, Governance, Fair Operating Practices, Human Rights, and Consumer Issues, as shown on Figure 1.
Moreover, the author suggests that the application of this norm would maximize contribution of companies to sustainable development. This contribution is most of the time translated by the implementation of sustainable business practices.
This concept of sustainable business practice is closely related to the concept of sustainable business model. Indeed, the implementation of a sustainable business practice can lead to the emergence of a sustainable business model. A sustainable business model requires innovation to be fully effective [19] and is defined as “business models that incorporate pro-active multi-stakeholder management, the creation of monetary and nonmonetary value for a broad range of stakeholders, and hold a long-term perspective” [20]. A sustainable business practice can be seen as the implementation of sustainable strategy. According to the authors of a previous paper [21] there is a long way between formulation of a sustainable strategy and its implementation that induce a delay between the conception of a sustainable business practice and its implementation. Moreover, the conception of a particular sustainable business practice may not be mature enough for implementation and requires a maturity measurement, which consumes even more time. Finally, even if the publication of articles related to sustainable strategy investigation from a project point of view is recently emerging [22], most are coming from the literature and not from a company perspective. Therefore, it could be interesting to provide a set of mature sustainable strategies for a company which would like to start engaging into sustainability. In order to be easily broadcasted and to be simple to reproduce we decided to orient ourselves into a pattern approach for sustainable strategy.
In fact, we are surrounded by patterns. They can be found approximately everywhere, in a natural state in fields, like genetics, biology, or chemistry for example; or at an artificial state in architecture, software, or electronics. Historically, patterns were mostly used in architectural design [23] which explains the two first definitions of patterns provided in the website of Oxford English Dictionary [24]:
- “A repeated decorative design”
- “A model or design used as a guide in needlework and other crafts”
Then, patterns started to be used in engineering, which explains the third definition contained in the Oxford English Dictionary: “An example for others to follow” [24]. Therefore, according to these three definitions, we can consider a pattern as something “repeatable” which is used as “a model” created in order to be broadcasted for “others to follow”. These definitions of a pattern are easy to understand; however, we are using them to give a general idea of what is a pattern. In order to get a more precise idea of it, we went to the side of Tešanovic [25]. She describes a pattern as an artifact which is made of three components: a context, which refers to the scope of the pattern; a problem which refers to a set of forces which appears in the context; and, finally, a solution, which, refers to a configuration adopted to resolve forces generated by the problem. Obviously, additional components can be added to a pattern structure (such as benefits, consequences, relations with other patterns, etc.) depending on their fields and specificities. In our case, a pattern will be considered as successful when it has a positive impact on one of the categories defined in ISO 26000. In case of two patterns affecting the same metric, we keep the one with the highest impact on this metric.
Finally, in terms of sustainability evaluation, there are several studies that provide different metrics and processes for evaluation. Unfortunately, these metrics and processes are either not global or related to the IT industry field. Indeed, if we look at the metrics of a previous study [26], which is related to measuring CSR performance, we can notice that the authors mainly focus on economic performance and especially on the link between CSR practices and profitability, moreover, this study only consider three dimensions of CSR (environmental, Human Resources, customer and suppliers). If we look now at the metrics of another past paper [27], that aims to evaluate efficiency and sustainability of CSR strategies, we can see that the authors only take into account qualitative metrics and base their evaluation on a survey. Nevertheless, studies that take into account global sustainability evaluation do exist. They are not related to the IT industry, but are related to other sectors such as airlines [28] or urban transportation [29] for example. Thus, our objective in this research is to provide for each strategy a set of quantitative and qualitative metrics related to the different dimensions of CSR defined in ISO 26000.
To give an overall conclusion on this part, we can notice that we set up an innovative approach compare to other studies. Indeed, we based our analysis on CSR reports, meaning that these reports are considered as raw materials for our study. Moreover, we mainly focus on the whole content of CSR and not only focus on specific initiatives, as we are interested by all the three aspects of sustainability (social, economic, and environmental) and not a particular one.
3. Materials and Methods
As we stated at the end of our introduction, our objective is to extract repeatable strategies in CSR reports coming from the 25 best IT companies, in order to build a pattern from it. Our applied methodology is the following. First, we gathered a list of companies in order to collect their CSR reports. If we look at Appendix A (Table A1), we can notice that we collected 20 reports out of 25, these 5 missing reports either did not exist or were not accessible publicly.
Once we aggregated the reports, we needed to define the evaluation criteria to evaluate their quality and classify and categorize the contents as well as the strategies. Using these criteria, we performed a qualitative and quantitative analysis for each report, to finally analyze the repeatability of each strategy and build patterns. In this research, we only consider information referenced in CSR reports, meaning that, if a company did not speak about a strategy that it implements, this strategy was not taken into account.
Before starting our analysis, we define different evaluation criteria on which it will rely on. We will define two different types of criteria, which are showed in Appendix B.
First, the content criteria, this one served us to categorize the content of each reports and classify the strategies regarding the categories. We developed these categories on the basis of the seven defined in the ISO 26000. We could have used another popular standard which is the GRI Guidelines for CSR reporting which is very used among the reports, but our choice of ISO 26000 was motivated by a comparison study [30] which shows that ISO is the most complete evaluation criteria to compare different CSR. However, the norm is not totally complete and misses a component: the employee social responsibility as suggested previously [31]. To overcome this lack, we decided to add this employee responsibility into the labor practices category. We then referenced all the strategies contained in each report regarding these categories (Appendix B, Table A2) in the analysis.
Second, according to the authors of a previous paper [17], companies might use these CSR reports to gain some notoriety and communicate around it. Moreover, the investigated companies and the authors who wrote these reports represent the same entity. Thus, we needed to define quality criteria to evaluate the quality of each report in order to have trust in the strategies and results described in them. Habek and Wolniak came up with a factorial analysis on quality evaluation criteria for CSR reports [32]. This analysis followed a previous framework developed by the duo (2015) [33] in the which they explain how to use the criteria to evaluate the quality of CSR by scoring from 0 to 4 (0: no information about the criterion, 1: little mention, 2: most important aspects included, 3: detailed information included, 4: best practices/original practice), on one hand, the credibility of information; and the relevance of information (Appendix B, Table A3) on the other. Afterwards they calculate the mean of the credibility score (Cm) (Equation (1)) and the mean of the relevance score (Rm) (Equation (2)), to finally calculate the quality score (Qs) (Equation (3)) of the report by calculating the mean of Cm and Rm’s sums.
Cm = (C1 + C2 +…+ C5 + C6)/6,
Rm = (R1 + R2 +…+ R10 + R11)/11,
Qs = (Cm + Rm)/2.
Once our criteria were defined, we performed a content analysis for each report according to the ISO 26000 categories they are impacting. In other words, we investigated all the reports and referenced all the strategies described inside it. We referenced the pages regarding the information they were containing: the one describing the different strategies, those including the data associated with the strategies, those providing concrete examples of a given strategy, and finally, those describing the outcomes of the strategy, as shown in Table 2. Then we evaluated the repeatability of each strategy among the reports to define patterns.
After the repeatability analysis had been done, we carried out a qualitative analysis on the different reports, using the quality criteria described in the previous section. Thus, we used a qualitative coding software, Saturateapp [34]. We choose this software because it is an online tool, which allows users to share their coding with peers if they request it. We used this tool to code each paragraph of each CSR report which is in relation with the quality criteria. In order, at the end, to get an overview of the quality of each report and, then, distribute the quality score among the reports.
4. Results
4.1. Content Analysis
We counted the number of strategies shown in each category in each report. If every category had the same weight in terms of consideration, we would have an occurrence frequency around 15%. As we can see in Table 3, Consumer issues and Human rights are particularly under-represented in the reports and Fair operating practices are lightly taken into account. Despite that, we can see that the four remaining categories are more or less equally distributed.
After that we analyzed the repeatability of 36 strategies which seemed to be reiterated in a sufficient sample of reports. Each strategy has an identifier defined by the category it is impacting and possibly two numbers: CAT XY, CAT is the name of the category, X is the number of the strategy in this category, and, optionally, Y the number of the sub-initiative of the strategy X, this sub-initiative will be considered as an additional component of a particular strategy. We defined repeatability as a percentage representing the number of reports mentioning this strategy out of the total number of reports. We set up a repeatability threshold (75%) under which we estimated that the strategy is not repeatable enough to be taken into consideration. All the strategies satisfying this threshold are surrounded in green, except for the one that reach exactly 75%.
As shown below on Table 4, out of the 36 evaluated strategies, 16 were above the threshold and 5 exactly reached 75% for a total of 21 potential strategies. But, repeatability should not be considered as the only metric to include a strategy into the patterns building process. We will combine this repeatability with the mean of the quality score of the reports containing it to define a new metric: the level of confidence.
4.2. Quality Analysis
To define the level of confidence, we performed a quality analysis. This analysis allowed us to give a quality score, between 0 and 4, to each report. The results of this analysis are shown in Table 5. We can see that the average of the quality of our reports is 2.1975. Meaning that our reports include, on average, the most important aspects of the different quality criteria. Even if some criteria are poorly covered among the reports; especially for C5 (possibility to give feedback) and C6 (independent verification).
The level of confidence is defined as following: for each strategy we will calculate the mean of the quality score of the report containing it. In other words, if a strategy is contained in n reports we will we will add the quality score of these n reports divided by the number, n, of reports to obtain the quality mean of a strategy (QTm) (Equation (4)). Then, we combine QTm with the repeatability of the strategy among the reports to obtain the level of confidence (Lc) (Equation (5)) of a particular strategy k.
Qtm = (Q1 + Q2 +…+ Q(n − 1) + Qn)/n,
Lc(k) = Repeatability(k) × Qtm(k).
Then we define our thresholds using the previous strategy for repeatability (75%), and the average of the quality of the reports (Table 5) which is 2.1975. Thus, our level of confidence threshold to consider a strategy will be 1.648125 (Equation (6)), under which, a strategy will not be used to build a pattern.
Lc (k) ≥ 0.75 × 2.1975.
If we look now at Table 6, we can see that we obtained very similar results compared with the repeatability analysis since only one strategy (ENV 5) did not reach the threshold. We are now be able to rank our strategies regarding their level of confidence and define the most appropriate strategy in case of two patterns affecting the same metrics. In order to get a scoring which is more representative, we also defined a relative level of confidence (Confidence score), which represents the ratio between the level of confidence and the maximum level of confidence reachable (2.1975) expressed with a 0 to 10 score.
4.3. Evaluating Impacts
For the set of 20 strategies, we evaluated their impact on sustainability so that future users can predict and assess the application of one of these strategies. The metrics will be social, economic, or environmental, according to the dimensions. Most are included in the CSR reports themselves and directly linked to the strategy they are related. For example, Table 7 shows the one used for the pattern ENV1. Moreover, as suggested previously [35], we also evaluated sustainability by assessing Sustainable Development goals (SDG) defined by the United Nations [36]; referenced in Appendix B. We decided to extend this methodology by including the evaluation of the Paris Agreement Objectives [37] where possible. In other words, we provide conventional metrics to measure sustainability impacts of the repeatable strategies, but we also link these strategies to the UN SDGs and/or the Paris Agreement objectives that they are impacting. So, if we keep taking take the example of ENV1 the related SDG will be: UN Sustainable Development Goal 7: “Affordable and clean energy” and, for the Paris Agreement, Paris Agreement Article 2b and c.
4.4. Defining a Pattern Structure
As a final step, we defined our pattern structure, or, more precisely, our data-model. As a reminder, a pattern is defined around three main components [24]: context, problem, and solution. In our case we decided to define each component with several elements. The context is defined by four elements: its name, its level of confidence among the set of reports, its time of effectiveness (short, mid, and long term), and its ISO 26000 category; then, the problem is represented by three elements: the international regulations it impacts (Paris Agreement or SDGs), the metrics needed to evaluate the impacts, and the outcomes of the pattern; finally, the solution is modelized by three elements: the description of the pattern, the examples of its application coming from the reports, and the potential additional components related to the pattern. We then developed an UML representation of our pattern structure using these ten elements as shown in Figure 2.
The class “category” can take only one of the seven values defined in its list, the class “example” is considered as an instantiation of the class “pattern” since it represents example of application of the pattern. This representation will be used to define our data-model for the future implementation of an online reference catalog.
5. Discussion
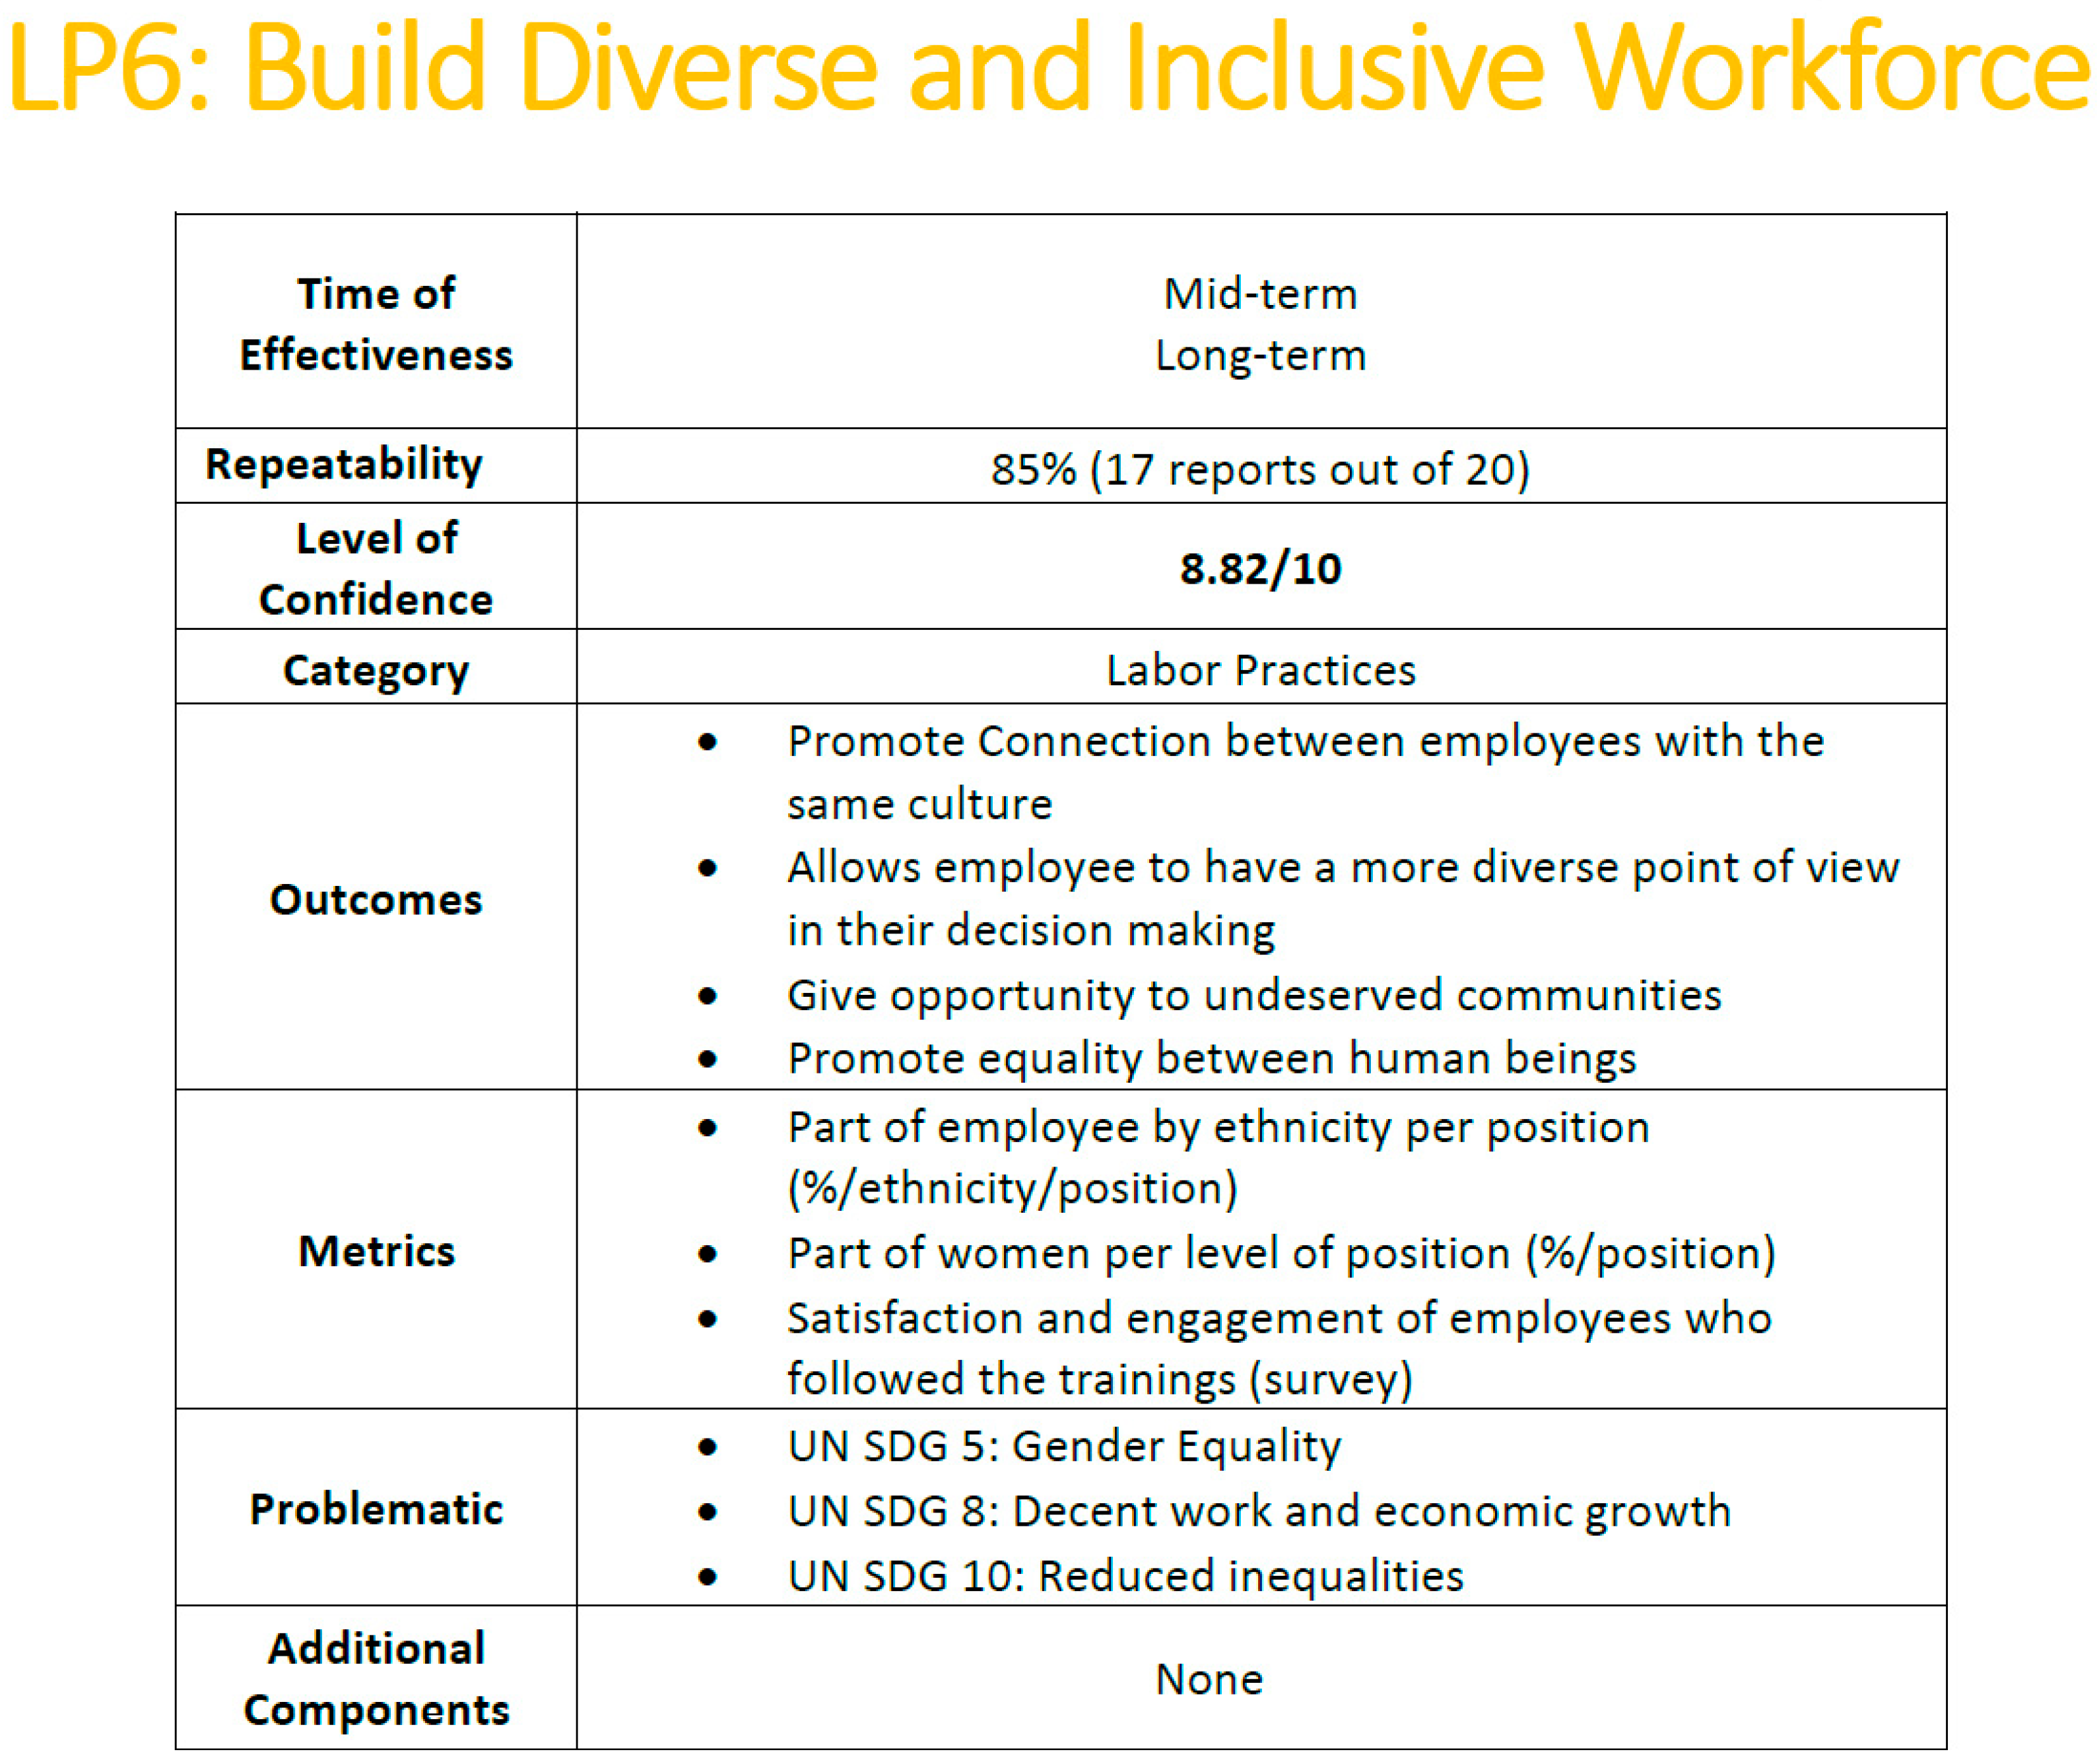
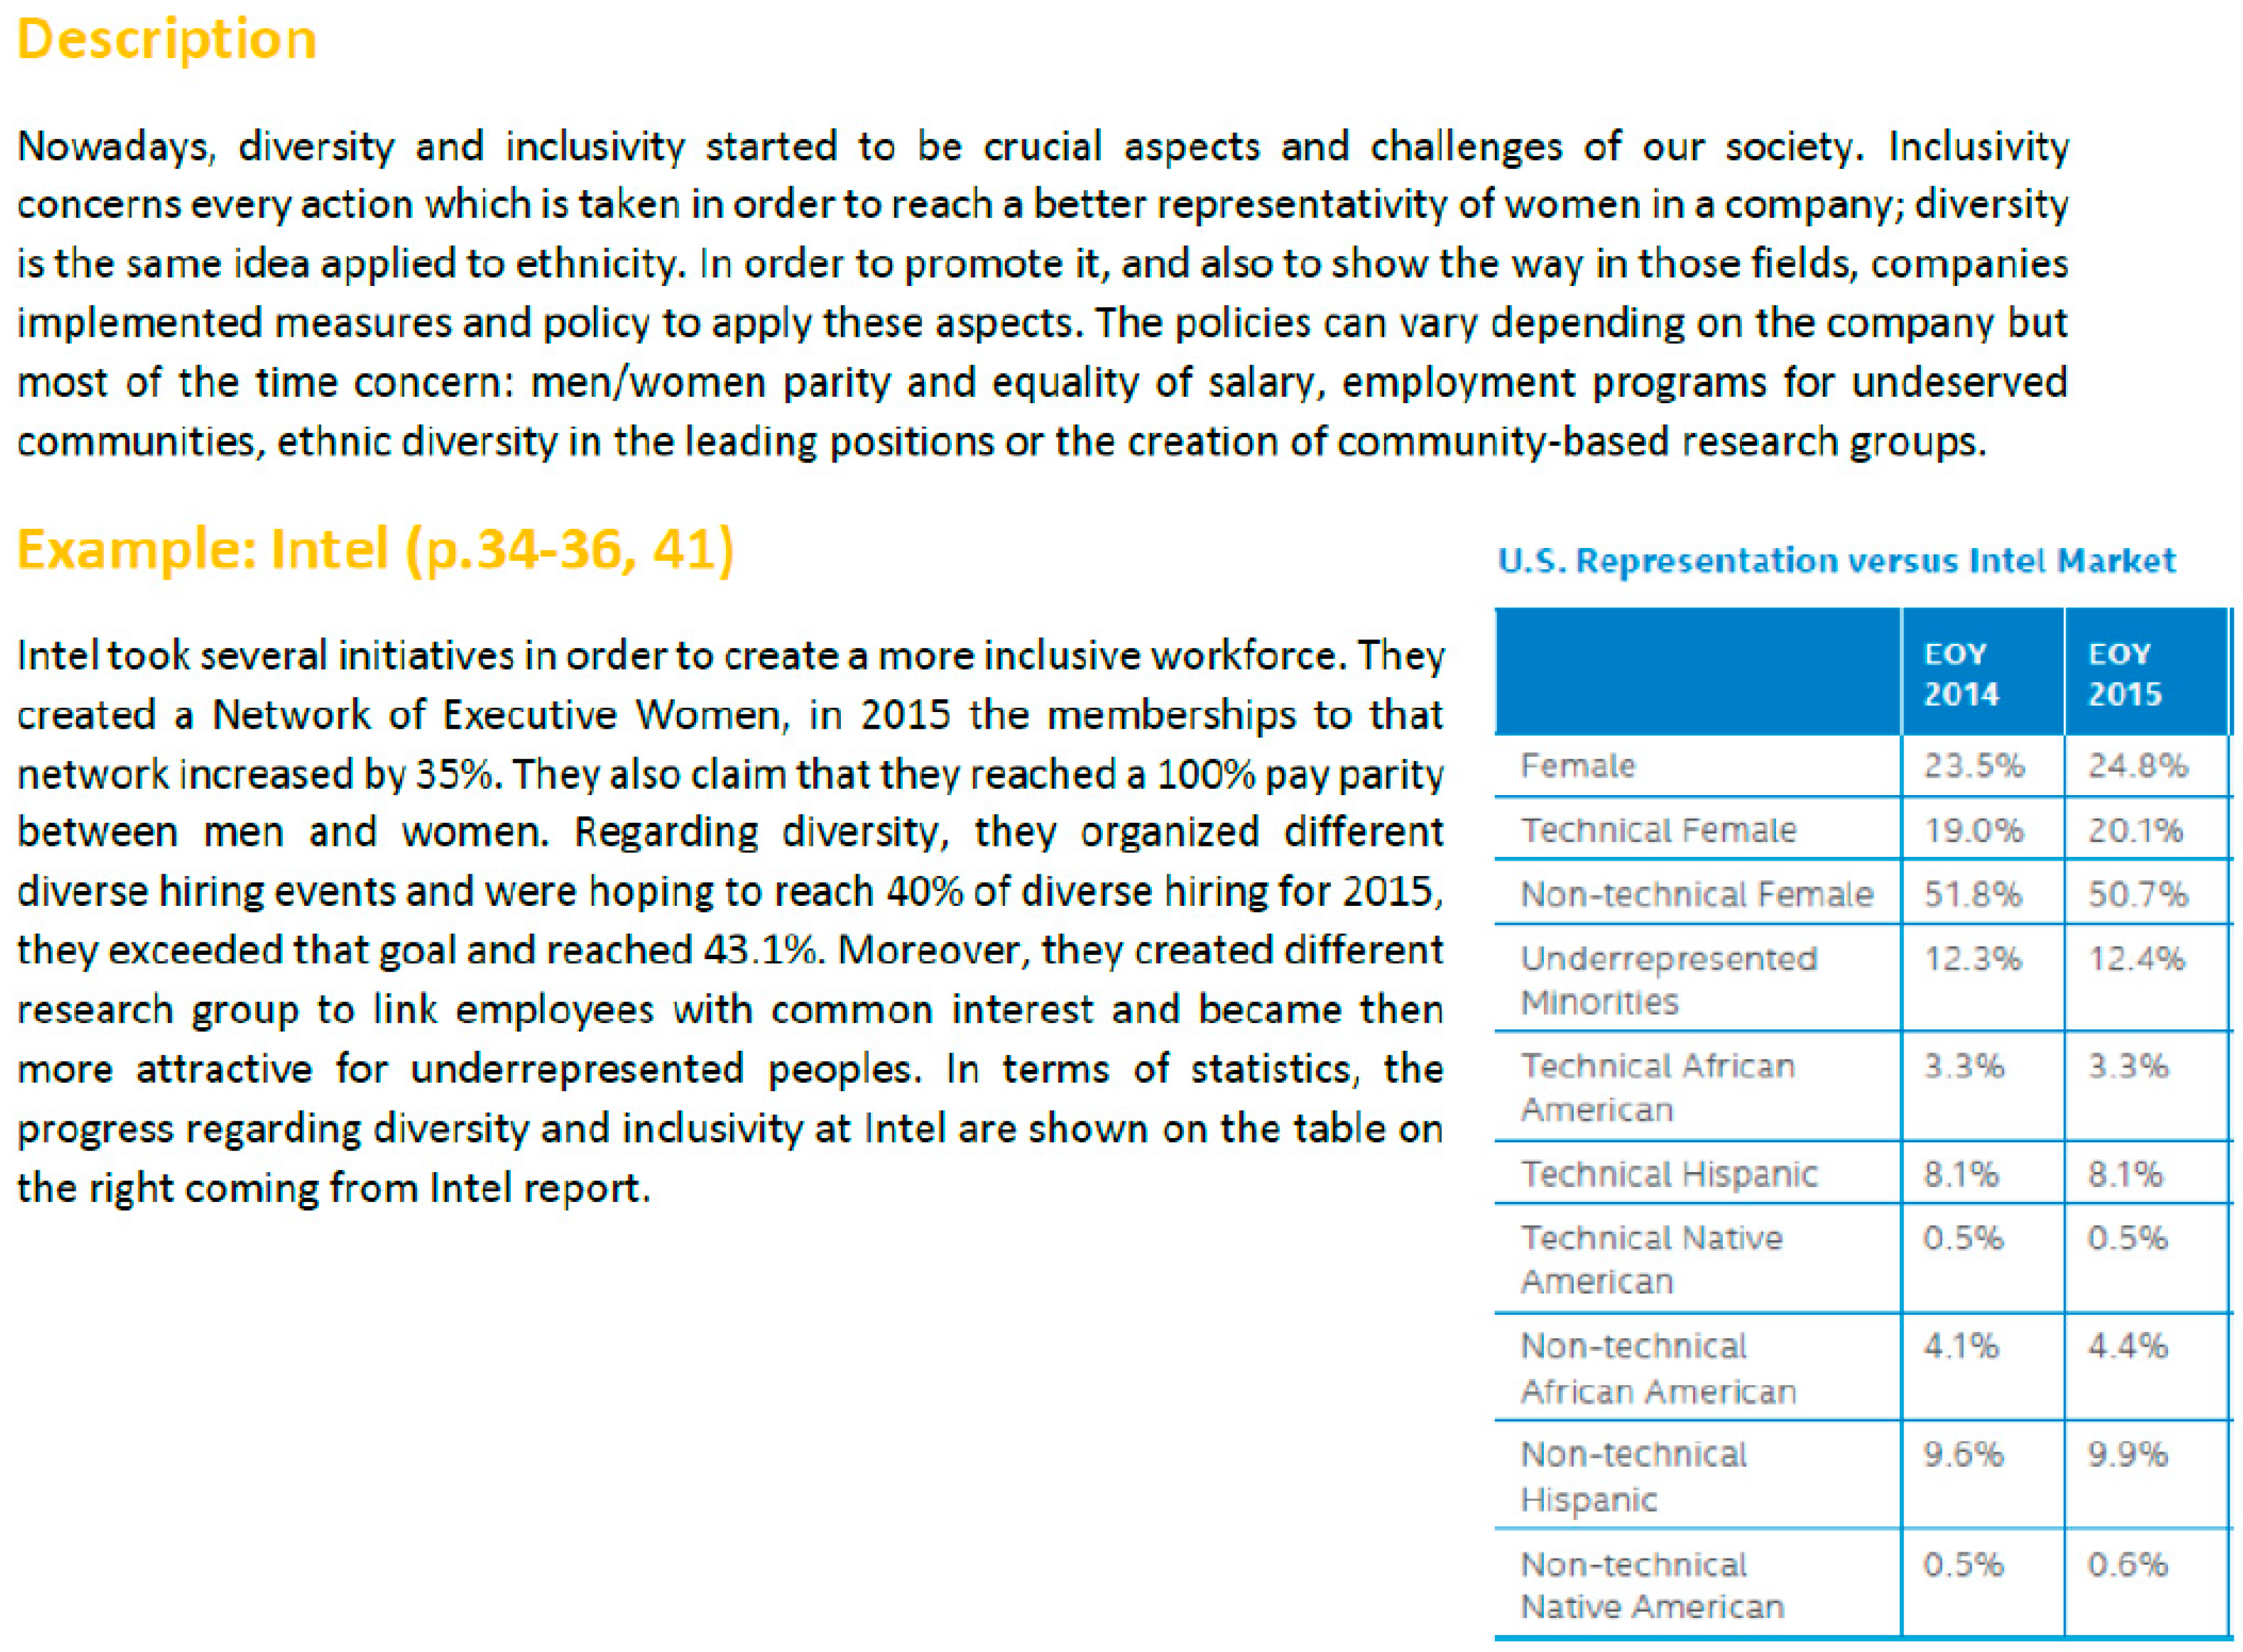
In this part we discuss the different results and contributions highlighted in this research. First, we used a qualitative method to evaluate CSR reports. We based this on two frameworks evaluating different aspects of the reports, the quality and the content. Regarding the quality, our set of reports had, on average, good quality since the average quality score indicates that the reports were including the most important aspects of credibility and relevance of information defined in the framework [32] (shown in Appendix B) even if some aspects were poorly covered (e.g., possibility to give feedback and independent verification). For the content analysis, depending on the categories we looked at, the results were satisfactory. Indeed, most of the reports focused on environmental, labor practices, governance, and community strategy categories, which explains why we were able to extract more patterns for these categories. Based on the results of this analysis we were able to classify our different strategies to rank them using the level of confidence we defined. Based on our results, we defined a data-model that we can apply to all our patterns and decided to create descriptive documents for all of them. As shown below on Figure 3 with the example of “LP6: Build a diverse and inclusive workforce”.
Regarding the limitations and different challenges faced in this research, we can first notice that our scope of research was based on a particular ranking of IT companies which is only based on annual turnover of the companies. It could be interesting to pursue a similar work with a different type of ranking, for example, the most innovative companies.
We note that there are a few threats to validity for this work. First, our quality analysis might have been influenced by a subjectivity bias. In other words, the classification results of our analysis according to the framework were influenced by the individual perception of the authors. One way to overcome this obstacle is by asking an external expert to perform an additional classification to then compare both results. Unfortunately, it was not possible to do this in our context due to circumstantial constraints. However, a slight difference in the precise classification would not influence the identification or nonidentification of a pattern, therefore this threat can, in the worst case, only have a minor influence on the presented results.
Second, a subjectivity bias also may also have influenced the content analysis. Indeed, for some strategies it was hard to determine and decide the most closely related ISO 26000 category. If we take the example of “LP2: encourage employee to volunteer”, which consists of encouraging employees to provide voluntary activities for the community such as teaching or helping associations without getting paid. We can see that this particular strategy is between the categories “Community involvement and development” because the volunteer activity has obviously social impacts and “Labor Practices” because it is employees who are providing the volunteering. So, for this particular pattern, we decided to put it under the category of “Labor practices” but in its description we mention the strong relationship between “LP2: encourage employee to volunteer” and “COM2: Support social projects, actions, non-profit organizations”. We see this mainly as a problem of predominant decomposition, as the categories in ISO 26000 do overlap in their instances. A deeper analysis investigating the relation between patterns would be interesting to conduct. However, also in this case, the threat only refers to the predominant related category and would, in the worst case, lead to minor corrections in the descriptions of the identified patterns.
Finally, the biggest challenge we faced was during the extraction of the different strategies and their definition. Indeed, it was hard to determine the most suitable level of granularity and detail. In other words, we had to determine the appropriate level of abstraction such that the patterns would not describe too specific initiatives. We decided then to stay into a high level of generalization, and, if a very particular initiative was stated many times among the reports we decided to define it as an additional component of a specific pattern. For example, “ENV3: Design ecological products” includes two additional components: reusing material by applying a circular economy and reducing the proportion of hazardous materials in the manufacturing of products. We can see that even if these two initiatives do not seem very close to each other, they both fall under the general idea of designing ecological products.
6. Conclusions
In this research, we presented an analysis and extraction of patterns from a set of CSR reports of the 25 biggest IT companies. From the analysis, which is based on the combination of two frameworks designed to evaluate CSR, and the UML representation of our patterns’ data model, in which we defined all components of our patterns through different elements. Before our contribution, most of the research in the area of CSR mainly focuses either on CSR performance or on the different ways to report it. In our approach, we evaluated the content of a particular set of reports in order to extract strategies for companies.
We plan to repeat this analysis on a different ranking of companies (e.g., most innovative IT companies) in order to increase the trust in our patterns and update the different strategies. The long-term goal is to help companies to be more and more sustainable with time by disseminating these patterns to a wide audience. For dissemination, we are developing a software tool, more precisely an online catalog, which will reference all our patterns; it is already being partially implemented as a prototype. All the strategies we identified and described are shown in Table 8. All pattern descriptions are available for the reviewers at http://TinyURL.com/ybtvd9h5 and will receive a permanent location upon acceptance of the article.
Author Contributions
Conceptualization, B.P.; Methodology, B.P.; Validation, B.P.; Investigation, G.D.; Resources, B.P.; Data Curation, G.D.; Writing—Original Draft Preparation, G.D.; Writing—Review & Editing, G.D., B.P.; Visualization, G.D.; Supervision, B.P.; Project Administration, G.D., B.P.; Funding Acquisition, G.D.
Funding
This research was funded by PERCCOM Erasmus Mundus Program of the European Union grant number PERCCOM-FPA 2013-0231.
Acknowledgments
The authors would like to express their gratitude to all the partner institutions, sponsors, and researchers involved in the PERCCOM program [38].
Conflicts of Interest
The authors declare no conflicts of interests.
Appendix A. IT Companies Investigated during This Study

Table A1.
List of the 25 IT companies and the existence of their CSR reports (Y for yes, N for no) from a previous study [12]; from 2015 if year not mentioned.
Table A1.
List of the 25 IT companies and the existence of their CSR reports (Y for yes, N for no) from a previous study [12]; from 2015 if year not mentioned.
Appendix B. Evaluation Criteria
Table A2.
Content classification criteria.
| Category | Definition |
|---|---|
| Community | Every strategy or initiative which impacts the community outside the company. (example: educational project, association funding, etc.) |
| Labor Practices | Every strategy or initiative which has an impact on the workplace and/or on the employees (example: employees training, diversity in the company, etc.) |
| Governance | Every strategy or initiative which relates to laws, management, or reporting (example: participating to the creation of regulations, organizing a stakeholder dialogue) |
| Environmental | Every strategy or initiative whichhelps to reduce the negative impacts on the environment (example build ecological products, produce or use renewable energy, etc.) |
| Fair Operating Practices | Every strategy or initiative which impacts supply chain sustainability (example: creation of a Supplier code of conduct, internal audits of the supply chain, etc.) |
| Human Rights | Every strategy or initiative which impacts human rights and their diffusion (example: Conflict free mineral policy, data privacy, or security policy) |
| Consumer Issues | Every strategy or initiative which impacts a customer and helps them reduce their problems (example: design accessible products, provide end of life management, etc.) |
Table A3.
Quality criteria coming from [28].
Table A3.
Quality criteria coming from [28].
| Assessment Criteria | Comments | |
|---|---|---|
| Relevance of Information | ||
| R1 | Sustainability strategy | The report presents the business strategy which relates to the aspects of sustainable development |
| R2 | Key stakeholders | The report contains identification of organization’s stakeholders, their expectations and a way of engagement with individual groups |
| R3 | Targets | The report presents targets for the future, targets set in the previous reporting period and the level of their achievements |
| R4 | Trends over time | The report contains indicators shown over several reporting periods indicating this way direction of change and ensuring their comparability |
| R5, R6, R7, R8 | Performance indicators: R5: Market place R6: Workplace R7: Environment R8: Community | The report contains quantitative information concerning organization’s performance achieved in particular areas (market place, workplace, environment, community). |
| R9 | Improvement actions | The report describes improvement activities undertaken by the organization to meet the objectives of sustainable development; e.g. programs to increase resource efficiency, reduction of emission etc. |
| R10 | Integration with business processes | The report contains information confirming that the aspects of sustainable development are included in the decision making process and implemented in the basic processes (purchasing, sales, marketing, production, etc.) |
| R11 | Executive summary | The report provides a concise and balanced overview of key information and indicators from the reporting period |
| Credibility of Information | ||
| C1 | Readability | The report has a logical structure, uses a graphical presentation of the data, drawings, and explanations where required or uses other tools to help navigate through the document |
| C2 | Basic reporting principles | The reporting period, scope and entity is defined in the report as well as limitations and target audience |
| C3 | Quality of data | The report describes the processes, procedures of collection, aggregation and transformation of data and determines the source of the data |
| C4 | Stakeholder dialogue outcomes | The report contains a description of the stakeholders’ dialogue and the results of this dialogue in relation to aspects of sustainable development (surveys, consultations, focus groups, round tables, programs, engagement, etc.) |
| C5 | Feedback | The report contains a mechanism that allows feedback process (contact point for suggestions or questions, hotline, e-mail, reply card, questionnaire etc.) |
| C6 | Independent verification | The report contains a statement of independent body attesting the authenticity of data presented in the report as well as proposals for future improvements |
References
- CEET Report 2013–2015; University of Melbourne: Melbourne, Australia, 2015; Available online: https://ceet.unimelb.edu.au/publications/ceet-annualreport-2015.pdf (accessed on 29 June 2018).
- Blasi, S.; Caporin, M.; Fontini, F. A Multidimensional Analysis of the Relationship between Corporate Social Responsibility and Firms’ Economic Performance. Ecol. Econ. 2018, 147, 218–229. [Google Scholar] [CrossRef]
- Bhardwaja, P.; Chatterjeeb, P.; Demirb, K.D.; Turutb, O. When and how is corporate social responsibility profitable? J. Bus. Res. 2018, 84, 206–219. [Google Scholar] [CrossRef]
- Wang, Z.; Sarkis, J. Corporate social responsibility governance, outcomes, and financial Performance. J. Clean. Prod. 2017, 162, 1607–1616. [Google Scholar] [CrossRef]
- Verčič, A.T.; Ćorić, D.S. The relationship between reputation, employer branding and corporate social responsibility. Public Relat. Rev. 2018, in press. [Google Scholar]
- Puncheva-Michelotti, P.; Hudson, S.; Jin, G. Employer branding and CSR communication in online recruitment advertising. Bus. Horiz. 2018, 61, 643–651. [Google Scholar] [CrossRef]
- Lim, J.S.; Greenwood, C.A. Communicating corporate social responsibility (CSR): Stakeholder responsiveness and engagement strategy to achieve CSR goals. Public Relat. Rev. 2017, 43, 768–776. [Google Scholar] [CrossRef]
- Michelon, G.; Pilonato, S.; Ricceri, F. CSR reporting practices and the quality of disclosure: An empirical analysis. Crit. Perspect. Account. 2015, 33, 59–78. [Google Scholar] [CrossRef] [Green Version]
- Cycyota, C.S.; Ferrante, C.J.; Schroeder, J.M. Corporate social responsibility and employee volunteerism: What do the best companies do? Bus. Horiz. 2016, 59, 321–329. [Google Scholar] [CrossRef]
- Uzunoğlu, E.; Türkel, S.; Akyar, B.Y. Engaging consumers through corporate social responsibility messages on social media: An experimental study. Public Relat. Rev. 2017, 43, 989–997. [Google Scholar] [CrossRef]
- Joseph, C.; Gunawan, J.; Sawani, Y.; Rahmat, M.; Noyem, J.A.; Darus, F. A comparative study of anti-corruption practice disclosure among Malaysian and Indonesian Corporate Social Responsibility (CSR) best practice companies. J. Clean. Prod. 2016, 112, 2896–2906. [Google Scholar] [CrossRef]
- Novinson, M. The 25 Biggest IT Companies on the 2016 Fortune 500. Available online: https://www.crn.com/slide-shows/managed-services/300081086/the-25-biggest-it-companies-on-the-2016-fortune-500.htm/pgno/0/1 (accessed on 14 May 2018).
- Herciu, M. ISO 26000—An integrative approach of corporate social responsibility. In Studies in Business and Economics; Sciendo: Warsaw, Poland, 2016; Volume 11, pp. 73–79. [Google Scholar]
- Carroll, A.B. Corporate social responsibility—Evolution of a definitional construction. Bus. Soc. 1999, 38, 268–295. [Google Scholar] [CrossRef]
- Bowen, H.R. Social Responsibilities of the Businessman; Harper and Row: New York, NY, USA, 1953. [Google Scholar]
- Carroll, A.B. The Pyramid of Corporate Social Responsibiiity: Toward the Morai Management of Organizational. Bus. Horiz. 1991, 34, 39–48. [Google Scholar] [CrossRef]
- Moir, L. What do we Mean by Corporate Social Responsibility? Int. J. Bus. Manag. Soc. Res. 2001, 1, 16–22. [Google Scholar] [CrossRef]
- Kyoto Protocol defined in United Nations website for Climate Change. Available online: https://unfccc.int/process/the-kyoto-protocol (accessed on 13 August 2018).
- Dahlsrud, A. How Corporate Social Responsibility is Defined: An Analysis of 37 Definitions. Corp. Soc. Responsib. Environ. Manag. 2008, 15, 1–13. [Google Scholar] [CrossRef]
- Geissdoerfer, M.; Vladimirova, D.; Evans, S. Sustainable Business Model Innovation: A Review. J. Clean. Prod. 2018, in press. [Google Scholar] [CrossRef]
- Engert, S.; Baumgartner, R.J. Corporate sustainability strategy: Bridging the gap between formulation and implementation. J. Clean. Prod. 2016, 113, 822–834. [Google Scholar] [CrossRef]
- Aarseth, W.; Ahola, T.; Aaltonen, K.; Økland, A.; Andersen, B. Project sustainability strategies: A systematic literature review. Int. J. Proj. Manag. 2017, 35, 1071–1083. [Google Scholar] [CrossRef]
- Alexander, C.; Ishikawa, S.; Silverstein, M.; Jacobson, M.; Fiskdahl-King, I.; Angel, S. A Pattern Language; Oxford University Press: New York, NY, USA, 1977. [Google Scholar]
- English Oxford Dictionary. Available online: https://en.oxforddictionaries.com/definition/pattern (accessed on 13 May 2018).
- Tešanovic, A. What Is a Pattern? Linköping Univeristy: Linköping, Sweden, 2004. [Google Scholar]
- Crifo, P.; Diaye, M.; Pekovic, S. CSR relatedmanagement practices and Firm Performance: An empirical anbalysis of the quantity-quality trade-off on french data. Int. J. Prod. Econ. 2016, 171, 405–416. [Google Scholar] [CrossRef]
- Bosch-Badia, M.; Montllor-Serrats, J.; Tarazon-Rodon, M. Efficiency and sustainability of CSR projects. Sustainability 2017, 9, 1714. [Google Scholar] [CrossRef]
- Chang, D.-S.; Chen, S.-H.; Hsu, C.-W.; Hu, A. Identifying Strategic Factors of the Implantation CSR in the Airline Industry: The Case of Asia-Pacific Airlines. Sustainability 2015, 7, 7762–7783. [Google Scholar] [CrossRef] [Green Version]
- Persia, L.; Cipriani, E.; Sgarra, V.; Meta, E. Strategies and measures for sustainable urban transport systems. Transp. Res. Procedia 2016, 14, 955–964. [Google Scholar] [CrossRef]
- Tsai, S.B.; Lee, Y.C.; Wu, C.H.; Lo, K.L. A Comparison Study on the Evaluation Criteria for Corporate Social Responsibility. In Proceedings of the 2011 International Conference on Management and Service Science, Wuhan, China, 12–14 August 2011. [Google Scholar]
- Hemphill, T.A.; Laurence, G.A. Employee Social Responsibility: A Missing Component in the ISI 26000 Social Responsibility Standard. Bus. Soc. Rev. 2018, 123, 59–81. [Google Scholar] [CrossRef]
- Habek, P.; Wolniak, R. Quality assessment of CSR reports: Factor analysis. Procedia Soc. Behav. Sci. 2016, 220, 541–547. [Google Scholar]
- Habek, P.; Wolniak, R. Assessing the quality of corporate social responsibility reports: The case of reporting practices in selected European Union member states. Qual. Quant. 2015, 50, 399–420. [Google Scholar] [CrossRef] [PubMed]
- Website of Saturateapp. Available online: http://www.saturateapp.com/help (accessed on 16 May 2018).
- Campagnolo, L.; Carraro, C.; Eboli, F.; Farnia, L. Assessing SDG’s: A New Methodolgy to Measure Sustainability. Available online: https://ssrn.com/abstract=2715991 (accessed on 10 August 2018).
- United Nations Sustainable Devlopment Goals Found in the UN Website for Development. Available online: http://www.undp.org/content/dam/undp/library/corporate/brochure/SDGs_Booklet_Web_En.pdf (accessed on 17 May 2018).
- Paris Agreement Found in the UN’s Dedicated Website to Climate Change. Available online: https://unfccc.int/resource/docs/2015/cop21/eng/l09r01.pdf (accessed on 12 August 2018).
- Klimova, A.; Rondeau, E.; Andersson, K.; Porras, J.; Rybin, A.V.; Zaslavsky, A. An international Master’s program in green ICT as a contribution to sustainable development. J. Clean. Prod. 2016, 135, 223–239. [Google Scholar] [CrossRef]
Figure 1.
Corporate Social Responsibility Core Subjects according to ISO 26000 [13].
Figure 1.
Corporate Social Responsibility Core Subjects according to ISO 26000 [13].

Figure 2.
UML representation of the pattern structure.

Figure 3.
Document referencing LP6: Build a diverse and inclusive workforce.


Table 1.
The five dimensions of CSR coming from Dahlsrud [18].
Table 1.
The five dimensions of CSR coming from Dahlsrud [18].
| Dimensions | The Definition Is Coded to the Dimension It Refers to | Example Phrases |
|---|---|---|
| The environmental dimension | The natural environment | “a cleaner environment” |
| “environmental stewardship” | ||
| “environmental concerns in business operations” | ||
| The social dimension | The relationship between business and society | “contribute to a better society” |
| “integrate social concerns in their business operations” | ||
| “consider the full scope of their impact on communities” | ||
| The economic dimension | Socioeconomic or financial aspects, including describing CSR in terms of a business operation | “contribute to economic development” |
| “preserving the profitability” | ||
| “business operations” | ||
| The stakeholder dimension | Stakeholders or stakeholder group | “interaction with their stakeholders” |
| “how organizations interact with their employees, suppliers, customers and communities” | ||
| “treating the stakeholders of the firm” | ||
| The voluntariness dimension | Actions not prescribed by law | “based on ethical values” |
| “beyond legal obligations” | ||
| “voluntary” |
Table 2.
Example of the strategy referencing of AT&T’s CSR report using the ISO 26000 criteria (This report didn’t mention any strategy about human rights this is why the category does not appear in the table).
Table 2.
Example of the strategy referencing of AT&T’s CSR report using the ISO 26000 criteria (This report didn’t mention any strategy about human rights this is why the category does not appear in the table).
| Community | Labor Practices | Governance | Environmental | Fair Operating Practices | Consumer Issues |
|---|---|---|---|---|---|
| Develop sensitization campaign p8 | Provide training to employees p8 | Collaborate with other companies/create international standards p9,14,16 | Implement energy efficiency projects p9 d9 | Encourage suppliers to track their GHGe p15 o15 | Provide online instructions for use p8 |
| Fund/Participate to educational program/projects p10 d10,17,18 | Employee reward program p8 | Set clear sustainability objectives p11–19 | Carbon savings program p9 o12 | Sustainability code of conduct for suppliers p15 | Provide online references about products’ environmental impacts p9,12,3 o12,13 |
| Provide their own teaching platform p10 d10 | Employee volunteering program p8 d8,7 | Reduce energy consumption of the company p12 o12 | Supplier scorecard system p15 | Provide products/services which help customers to increase their own sustainability p14 | |
| Enhance people connectivity to internet p12 o12 | Build diverse and inclusive workforce p8 | Use/produce their own renewable energy p12 | Propose a take back program to recycle products p13 o13 | ||
| Connect disadvantaged people p12 o12,18 | Use/promote alternative vehicles p12 p12 | ||||
| Fund social actions programs p17,18,19 | Design energy efficient products/services p9 | ||||
| Build their own charity foundation p10 |
Table 3.
Number of strategies per category in all the reports and the frequency of occurrence of each category.
Table 3.
Number of strategies per category in all the reports and the frequency of occurrence of each category.
| Category | Total | Frequency of Occurrence (%) |
|---|---|---|
| Community | 115 | 16.55 |
| Labor Practices | 131 | 18.85 |
| Governance | 142 | 20.43 |
| Environmental | 147 | 21.15 |
| Fair Operating Practices | 78 | 11.22 |
| Human Rights | 34 | 4.89 |
| Consumer Issues | 48 | 6.93 |
| Total | 695 | 100 |
Table 4.
Repeatability in percentage of each of the 36 evaluated strategies. (The lines in grey mean that the strategy reached the repeatability threshold we set up).
(a).
Repeatability in percentage of the different strategy impacting community involvement and development.
(a).
Repeatability in percentage of the different strategy impacting community involvement and development.
| ID | Name | Repeatability (%) |
|---|---|---|
| COM1 | Support educational projects or actions | 90 |
| COM11 | Create their own educational platform | 45 |
| COM12 | Provide scholarships | 35 |
| COM2 | Support social projects, actions or non-profit organizations | 95 |
| COM21 | Health | 35 |
| COM22 | Undeserved people | 65 |
| COM23 | Environmental | 50 |
| COM24 | Societal | 35 |
| COM25 | Create their own charity foundation | 45 |
| COM26 | Participate to sensitization campaigns | 35 |
| COM27 | Encourage employees’ donations | 35 |
| COM3 | Enhance access to technology in the community | 60 |
| COM4 | Donations after humanitarian disasters | 45 |
| COM5 | Economic empowerment of the community | 45 |
(b).
Repeatability in percentage of the different strategy impacting Labor practices.
| ID | Name | Repeatability (%) |
|---|---|---|
| LP1 | Provide training to employees | 85 |
| LP11 | Skills training | 80 |
| LP12 | Career management | 70 |
| LP2 | Encourage employees to volunteer | 90 |
| LP3 | Organize employee award ceremony | 40 |
| LP4 | Employee well-being program | 80 |
| LP41 | Health and safety management | 80 |
| LP42 | Compensations program | 60 |
| LP5 | Sensitize employees to environmental issues | 80 |
| LP6 | Build diverse and inclusive workforce | 85 |
| LP7 | Employees’ feedback | 65 |
(c).
Repeatability in percentage of the different strategy impacting Governance.
| ID | Name | Repeatability (%) |
|---|---|---|
| G1 | Set clear sustainability objectives through dedicated team(s) | 90 |
| G2 | Use standardized measurements tools or methods | 45 |
| G3 | Collaborate with peers | 90 |
| G31 | Comply with regulations, laws, standards and norms | 80 |
| G32 | Participate to the creation of laws, regulations, standards and norms | 85 |
| G33 | Engage stakeholders in the definition of sustainability objectives | 55 |
| G4 | Sustainability Management | 75 |
| G41 | Implement Risk Management | 50 |
| G42 | Implement Environmental Management System (EMS) | 70 |
| G5 | Transparency | 100 |
| G51 | Report environmental impacts | 100 |
| G52 | Report political contributions | 35 |
| G53 | Report charity donations | 70 |
| G6 | Create Code of Conduct | 65 |
(d).
Repeatability in percentage of the different strategy impacting Environment.
| ID | Name | Repeatability (%) |
|---|---|---|
| ENV1 | Produce or use renewable energy | 90 |
| ENV2 | Energy Efficiency | 90 |
| ENV21 | Products or services | 60 |
| ENV22 | Facilities | 75 |
| ENV23 | Projects in the company | 60 |
| ENV3 | Design ecological products | 85 |
| ENV31 | Circular economy | 70 |
| ENV32 | Hazardous material | 65 |
| ENV4 | Resource efficiency | 90 |
| ENV41 | Paper | 55 |
| ENV42 | Water | 70 |
| ENV43 | Waste Generation | 85 |
| ENV5 | Propose alternative solutions for commuting, transportation | 75 |
| ENV51 | Alternative vehicles | 60 |
| ENV52 | Air travel reduction program | 40 |
| ENV53 | Car pooling | 30 |
| ENV6 | Involve in biodiversity or nature conservation activities | 40 |
(e).
Repeatability in percentage of the different strategy impacting Fair operating practices, Human rights and Consumer issues.
(e).
Repeatability in percentage of the different strategy impacting Fair operating practices, Human rights and Consumer issues.
| ID | Name | Repeatability (%) |
|---|---|---|
| FOP1 | Supplier Code of Conduct | 75 |
| FOP2 | Sensitize supply chain to sustainability | 95 |
| FOP3 | Build a diverse supply chain | 60 |
| FOP4 | Proceed audits in the supply chain | 45 |
| FOP5 | Avoid conflict mineral usage | 60 |
| HR1 | Conflict free mineral policy | 60 |
| HR2 | Data privacy and security policy | 75 |
| HR3 | Sensitize employees to Human Rights | 50 |
| CONS1 | Provide end of Life Management | 75 |
| CONS2 | Provide products or services which help customers to increase their own sustainability | 85 |
| CONS3 | Design accessible products | 35 |
| CONS4 | Provide information about environmental impacts of their products | 30 |
Table 5.
Quality score of the reports from the highest to the lowest and all the different quality criteria.
Table 5.
Quality score of the reports from the highest to the lowest and all the different quality criteria.
| Company | Credibility Score | Relevance Score | Quality Score |
|---|---|---|---|
| HP | 2.67 | 3.36 | 3.12 |
| Microsoft | 2.17 | 3.64 | 3.12 |
| Cisco | 2.50 | 3.36 | 3.06 |
| Intel | 2.67 | 3.38 | 3 |
| Xerox | 1.5 | 3.09 | 2.53 |
| Qualcomm | 2.17 | 2.55 | 2.41 |
| IBM | 1.5 | 2.82 | 2.35 |
| CSC | 1.83 | 2.55 | 2.29 |
| Cognizant | 1.67 | 2.55 | 2.24 |
| Verizon | 1.67 | 2.55 | 2.24 |
| EMC | 2 | 2.77 | 2.18 |
| Oracle | 1.5 | 2.36 | 2.06 |
| AT&T | 1.33 | 2.18 | 1.88 |
| Western Digital | 1.67 | 1.91 | 1.82 |
| Apple | 2 | 1.64 | 1.76 |
| Arrow | 1.5 | 1.82 | 1.71 |
| 1.5 | 1.82 | 1.71 | |
| Comcast | 1.5 | 1.73 | 1.65 |
| Avnet | 1.17 | 1.64 | 1.47 |
| Century Link | 0.83 | 1.64 | 1.35 |
| Average | 1.7675 | 2.433 | 2.1975 |
Table 6.
The level of confidence of each strategy based on a 0 to 4 scale for the global level of confidence and on a 0–10 for the confidence score. (The lines in grey mean that the strategy reached the quality threshold we defined.)
(a).
Level of confidence and confidence score of the different strategy impacting community involvement and development.
(a).
Level of confidence and confidence score of the different strategy impacting community involvement and development.
| ID | Name | Global Level of Confidence | Confidence Score (Out of 10) |
|---|---|---|---|
| COM1 | Support educational projects or actions | 2.02 | 9.18 |
| COM11 | Create their own educational platform | 1.06 | 4082 |
| COM12 | Provide scholarships | 0.75 | 3.41 |
| COM2 | Support social projects, actions or non-profit organizations | 2.11 | 9.59 |
| COM21 | Health | 0.78 | 3.55 |
| COM22 | Undeserved people | 1.47 | 6.68 |
| COM23 | Environmental | 1.07 | 4.86 |
| COM24 | Societal | 0.67 | 3.05 |
| COM25 | Create their own charity foundation | 1.05 | 4.77 |
| COM26 | Participate to sensitization campaigns | 0.69 | 3.14 |
| COM27 | Encourage employees’ donations | 0.75 | 3.41 |
| COM3 | Enhance access to technology in the community | 1.37 | 6.23 |
| COM4 | Donations after humanitarian disasters | 1.09 | 4.95 |
| COM5 | Economic empowerment of the community | 1.11 | 5.05 |
(b).
Level of confidence and confidence score of the different strategy impacting Labor practices.
| ID | Name | Global Level of Confidence | Confidence Score (Out of 10) |
|---|---|---|---|
| LP1 | Provide training to employees | 1.94 | 8.82 |
| LP11 | Skills training | 1.87 | 8.5 |
| LP12 | Career management | 1.62 | 7.36 |
| LP2 | Encourage employees to volunteer | 2.02 | 9.18 |
| LP3 | Organize employee award ceremony | 0.87 | 3.95 |
| LP4 | Employee well-being program | 1.82 | 8.27 |
| LP41 | Health and safety management | 1.82 | 8.27 |
| LP42 | Compensations program | 1.47 | 6.68 |
| LP5 | Sensitize employees to environmental issues | 1.82 | 8.27 |
| LP6 | Build diverse and inclusive workforce | 1.94 | 8.82 |
| LP7 | Employees’ feedback | 1.54 | 7 |
(c).
Level of confidence and confidence score of the different strategy impacting Environment.
| ID | Name | Global Level of Confidence | Confidence Score (Out of 10) |
|---|---|---|---|
| ENV1 | Produce or use renewable energy | 1.99 | 9.05 |
| ENV2 | Energy Efficiency | 2 | 9.09 |
| ENV21 | Products or services | 1.41 | 6.41 |
| ENV22 | Facilities | 1.69 | 7.68 |
| ENV23 | Projects in the company | 1.44 | 6.55 |
| ENV3 | Design ecological products | 1.95 | 8.86 |
| ENV31 | Circular economy | 1.68 | 7.64 |
| ENV32 | Hazardous material | 1.53 | 6.95 |
| ENV4 | Resource efficiency | 1.98 | 9 |
| ENV41 | Paper | 1.17 | 5.32 |
| ENV42 | Water | 1.61 | 7.32 |
| ENV43 | Waste Generation | 1.87 | 8.5 |
| ENV5 | Propose alternative solutions for commuting, transportation | 1.55 | 7.05 |
| ENV51 | Alternative vehicles | 1.23 | 5.59 |
| ENV52 | Air travel reduction program | 0.84 | 3.82 |
| ENV53 | Car pooling | 0.58 | 2.64 |
| ENV6 | Involve in biodiversity or nature conservation activities | 0.94 | 4.27 |
(d).
Level of confidence and confidence score of the different strategy impacting Fair operating practices, Human rights, and Consumer issues.
(d).
Level of confidence and confidence score of the different strategy impacting Fair operating practices, Human rights, and Consumer issues.
| ID | Name | Global Level of Confidence | Confidence Score (Out of 10) |
|---|---|---|---|
| FOP1 | Supplier Code of Conduct | 1.74 | 7.91 |
| FOP2 | Sensitize supply chain to sustainability | 2.11 | 9.59 |
| FOP3 | Build a diverse supply chain | 1.46 | 6.64 |
| FOP4 | Proceed audits in the supply chain | 1.14 | 5.18 |
| FOP5 | Avoid conflict mineral usage | 1.44 | 6.55 |
| HR1 | Conflict free mineral policy | 1.44 | 6.55 |
| HR2 | Data privacy and security policy | 1.77 | 8.05 |
| HR3 | Sensitize employees to Human Rights | 1.25 | 5.68 |
| CONS1 | Provide end of Life Management | 1.67 | 7.59 |
| CONS2 | Provide products or services which help customers to increase their own sustainability | 1.85 | 8.41 |
| CONS3 | Design accessible products | 0.83 | 3.77 |
| CONS4 | Provide information about environmental impacts of their products | 0.69 | 3.14 |
(e).
Level of confidence and confidence score of the different strategy impacting Governance.
| ID | Name | Global Level of Confidence | Confidence Score (Out of 10) |
|---|---|---|---|
| G1 | Set clear sustainability objectives through dedicated team(s) | 2.04 | 9.27 |
| G2 | Use standardized measurements tools or methods | 0.95 | 4.32 |
| G3 | Collaborate with peers | 2 | 9.09 |
| G31 | Comply with regulations, laws, standards and norms | 1.8 | 8.18 |
| G32 | Participate to the creation of laws, regulations, standards and norms | 1.89 | 8.59 |
| G33 | Engage stakeholders in the definition of sustainability objectives | 1.39 | 6.32 |
| G4 | Sustainability Management | 1.72 | 7.82 |
| G41 | Implement Risk Management | 1.21 | 5.5 |
| G42 | Implement Environmental Management System (EMS) | 1.61 | 7.32 |
| G5 | Transparency | 2.2 | 10 |
| G51 | Report environmental impacts | 2.2 | 10 |
| G52 | Report political contributions | 0.89 | 4.05 |
| G53 | Report charity donations | 1.61 | 7.32 |
| G6 | Create Code of Conduct | 1.51 | 6.86 |
Table 7.
Example of metrics to evaluate strategies with the example of ENV 1.
| ID | Name | Metric | Problematic |
|---|---|---|---|
| ENV1 | Produce or use renewable energy | CO2 emissions per year(tons/year) | Paris Agreement Article 2b |
| Part of renewable energy in the energy mix (%) | Paris Agreement Article 2c | ||
| kWh of renewable energy produced (kWh/year) | UN Sustainable Development Goal 7 | ||
| kWh of renewable energy bough (kWh/year) |
Table 8.
The list of all the patterns and their related additional components extracted at the end of our analysis.
Table 8.
The list of all the patterns and their related additional components extracted at the end of our analysis.
| ID | Name |
|---|---|
| COM1 | Support educational projects or actions |
| COM11 | Create their own educational platform |
| COM12 | Provide scholarships |
| COM2 | Support social projects, actions or non-profit organizations |
| COM21 | Health |
| COM22 | Undeserved people |
| COM23 | Environmental |
| COM24 | Societal |
| COM25 | Create their own charity foundation |
| COM26 | Participate to sensitization campaigns |
| COM27 | Encourage employees’ donations |
| LP1 | Provide training to employees |
| LP11 | Skills training |
| LP12 | Career management |
| LP2 | encourage employee to volunteer |
| LP4 | Employee well-being program |
| LP41 | Health and safety management |
| LP42 | Compensations program |
| LP5 | Sensitize employee to environmental issues |
| LP6 | Build diverse and inclusive workforce |
| G1 | Set clear sustainability objectives through dedicated team(s) |
| G3 | Collaborate with peers |
| G31 | Comply with regulations, laws, norms |
| G32 | Participate to the creation regulations, laws, norms |
| G33 | Stakeholder engagement |
| G4 | Sustainability management |
| G41 | Implement risk management |
| G42 | Implement Environmental Management System (EMS) |
| G5 | Transparency |
| G51 | Report environmental impacts |
| G52 | Report political contributions |
| G53 | Report charity donations |
| ENV1 | Produce or use renewable energy |
| ENV2 | Energy efficiency |
| ENV21 | Products/services |
| ENV22 | Facilities |
| ENV23 | Projects in the company |
| ENV3 | Design ecological products |
| ENV31 | Circular economy |
| ENV32 | Hazardous materials |
| ENV4 | Resource efficiency |
| ENV41 | Paper |
| ENV42 | Water |
| ENV43 | Waste generation |
| FOP1 | Supplier Code of Conduct |
| FOP2 | Sensitize supply chain to sustainability issues |
| HR2 | Data privacy and security policy |
| CONS1 | Provide end of life management |
| CONS2 | Provide products or services which help customers to increase their own sustainability |
© 2018 by the authors. Licensee MDPI, Basel, Switzerland. This article is an open access article distributed under the terms and conditions of the Creative Commons Attribution (CC BY) license (http://creativecommons.org/licenses/by/4.0/).
Share and Cite
MDPI and ACS Style
Déroche, G.; Penzenstadler, B. An Analysis of Best Practice Patterns for Corporate Social Responsibility in Top IT Companies. Technologies 2018, 6, 76. https://doi.org/10.3390/technologies6030076
AMA Style
Déroche G, Penzenstadler B. An Analysis of Best Practice Patterns for Corporate Social Responsibility in Top IT Companies. Technologies. 2018; 6(3):76. https://doi.org/10.3390/technologies6030076
Chicago/Turabian StyleDéroche, Germain, and Birgit Penzenstadler. 2018. "An Analysis of Best Practice Patterns for Corporate Social Responsibility in Top IT Companies" Technologies 6, no. 3: 76. https://doi.org/10.3390/technologies6030076
Note that from the first issue of 2016, this journal uses article numbers instead of page numbers. See further details here.