1. Introduction
The primary goal of this project is to develop a methodology that leads to the implementation of a tool, which is currently in the production stage, to analyze statistical information online. To do so, we first need a mechanism to manage the large amount of data generated by opinion polls. This mechanism must ensure that the information remains safe and that the data analysts can work with it. Second, another mechanism is required to define which information can be published on the web and which is not ready to be published yet (e.g., information that must be anonymized). Finally, a mechanism is also required to allow the mass media, external researchers, and the general public to freely work with the data to obtain new information. To solve these problems, a methodology was defined with the aim of simplifying the interaction with the datasets for all potential users. This methodology was successfully applied on the development of a tool named UPCEO.
This project pursues the idea of open data. The concept of open data to everyone is not new. It was established with the formation of the World Data Center system (WDC) during the International Geophysical Year in 1957–1958 [
1]. In the beginning, the WDC had centers in the United States, Europe, the Soviet Union and Japan. Now, it includes 52 centers in 12 countries. The Science Ministers of the Organization for Economic Co-operation and Development (OECD) signed a declaration stating that all the information created or found by the public must be freely available [
2]. In that sense, in [
3], the trends of the web are analyzed, where the semantic representation and access to information will clearly face the future of access to the information. In this vein, certain legal tools, such as Open Data Commons [
4], came into existence to simplify the use of open data over the Internet. In that sense, several existing tools allow the final user to access information, such as the system in [
5], a website devoted to the representation of information on a map, or the Socrata
® system [
6], a system that supports some interesting applications such as Data.gov [
7] that has the primary mission “… to improve access to Federal data and expand creative use of those data beyond the walls of government by encouraging innovative ideas (e.g., web applications)”.
There are several websites and tools to access public statistical information as well as several applications that allow the reuse and sharing of code related to the access of public information, such as [
8] or [
9]. The next step is to allow users without technical knowledge to access the information and perform easy statistical tasks with it. To do this, the user must be able to execute those tasks on a remote server that stores both remote information and certain statistical functions.
The possibilities of allowing end-users to execute certain statistical functions to obtain new information from the data were described by [
10]. Currently, there are different tools that to show information over the web and allow the execution of statistical functions by the end users, e.g., the NESSTAR system [
11]. In parallel with these proprietary solutions, several efforts are focused on developing APIs (Application Protocol Interfaces) to access statistical information. As an example, Data.org is preparing an API that allows users to interact with the system data to build their own applications and mash-ups; in [
12], an API has also been implemented to interact with its data. However, the question of how to develop and use these APIs remains open. Every infrastructure that develops this type of solution implements a new API, and the developers must be able to address all of them.
Another problem is related to the data preparation; there are different alternatives already available to define the surveys, e.g., [
13] or [
14]. These tools allow the user to export the data to various formats and perform posterior analyses (a well-known format is the Triple-S, an XML for survey software that enables the user to import and export surveys between different software). The main issue with this approach is that manual operations are required to process the data. In our proposed approximation, once the surveys are completed, their datasets can easily be uploaded to the system, and all the items of the questionnaires can be related directly to the historical record of survey questions. Finally, another interesting concern is related to the standardization of the Cloud infrastructures [
15]. In our approach, we solve this issue by proposing the use of the R as the common language to work with statistical information, independent of the Cloud infrastructure used.
2. The Proposed Solution
Statistical institutes that wish to open their data must deal with the intrinsic complexity of their data structures. To address this, we could define an ontology as proposed in [
16] or [
17]. In this paper, we propose a different approach, defining a methodology based on the R language (see [
18] or [
19]), that simplifies the CRUD (create, read, update and delete) operations that can be performed on the data. To access this data, we need to face two problems: the format and the flow. The format is a key factor, since it is needed to define a framework that guarantees that we can always access the data; see [
20] for an example in the judicial area. This can be solved by using R as a translation element to our base known format. It is also necessary to define a flow for analyzing the datasets that a statistical institution wants to publish, so that the users can interact with them. To do so, we need to categorize the data that we own in the system. We use the datasets of public opinion surveys which are based on the collection of responses to a standardized questionnaire from representative samples of the population. These survey datasets must also be managed by the system. In our proposal, they are represented by an initial matrix of data containing the questions (and the answers to these questions). Because a survey can be related to other surveys (to obtain information over time), it is necessary to define a superstructure to relate the various initial matrices between them at two levels: at the matrix level and at the table-field level.
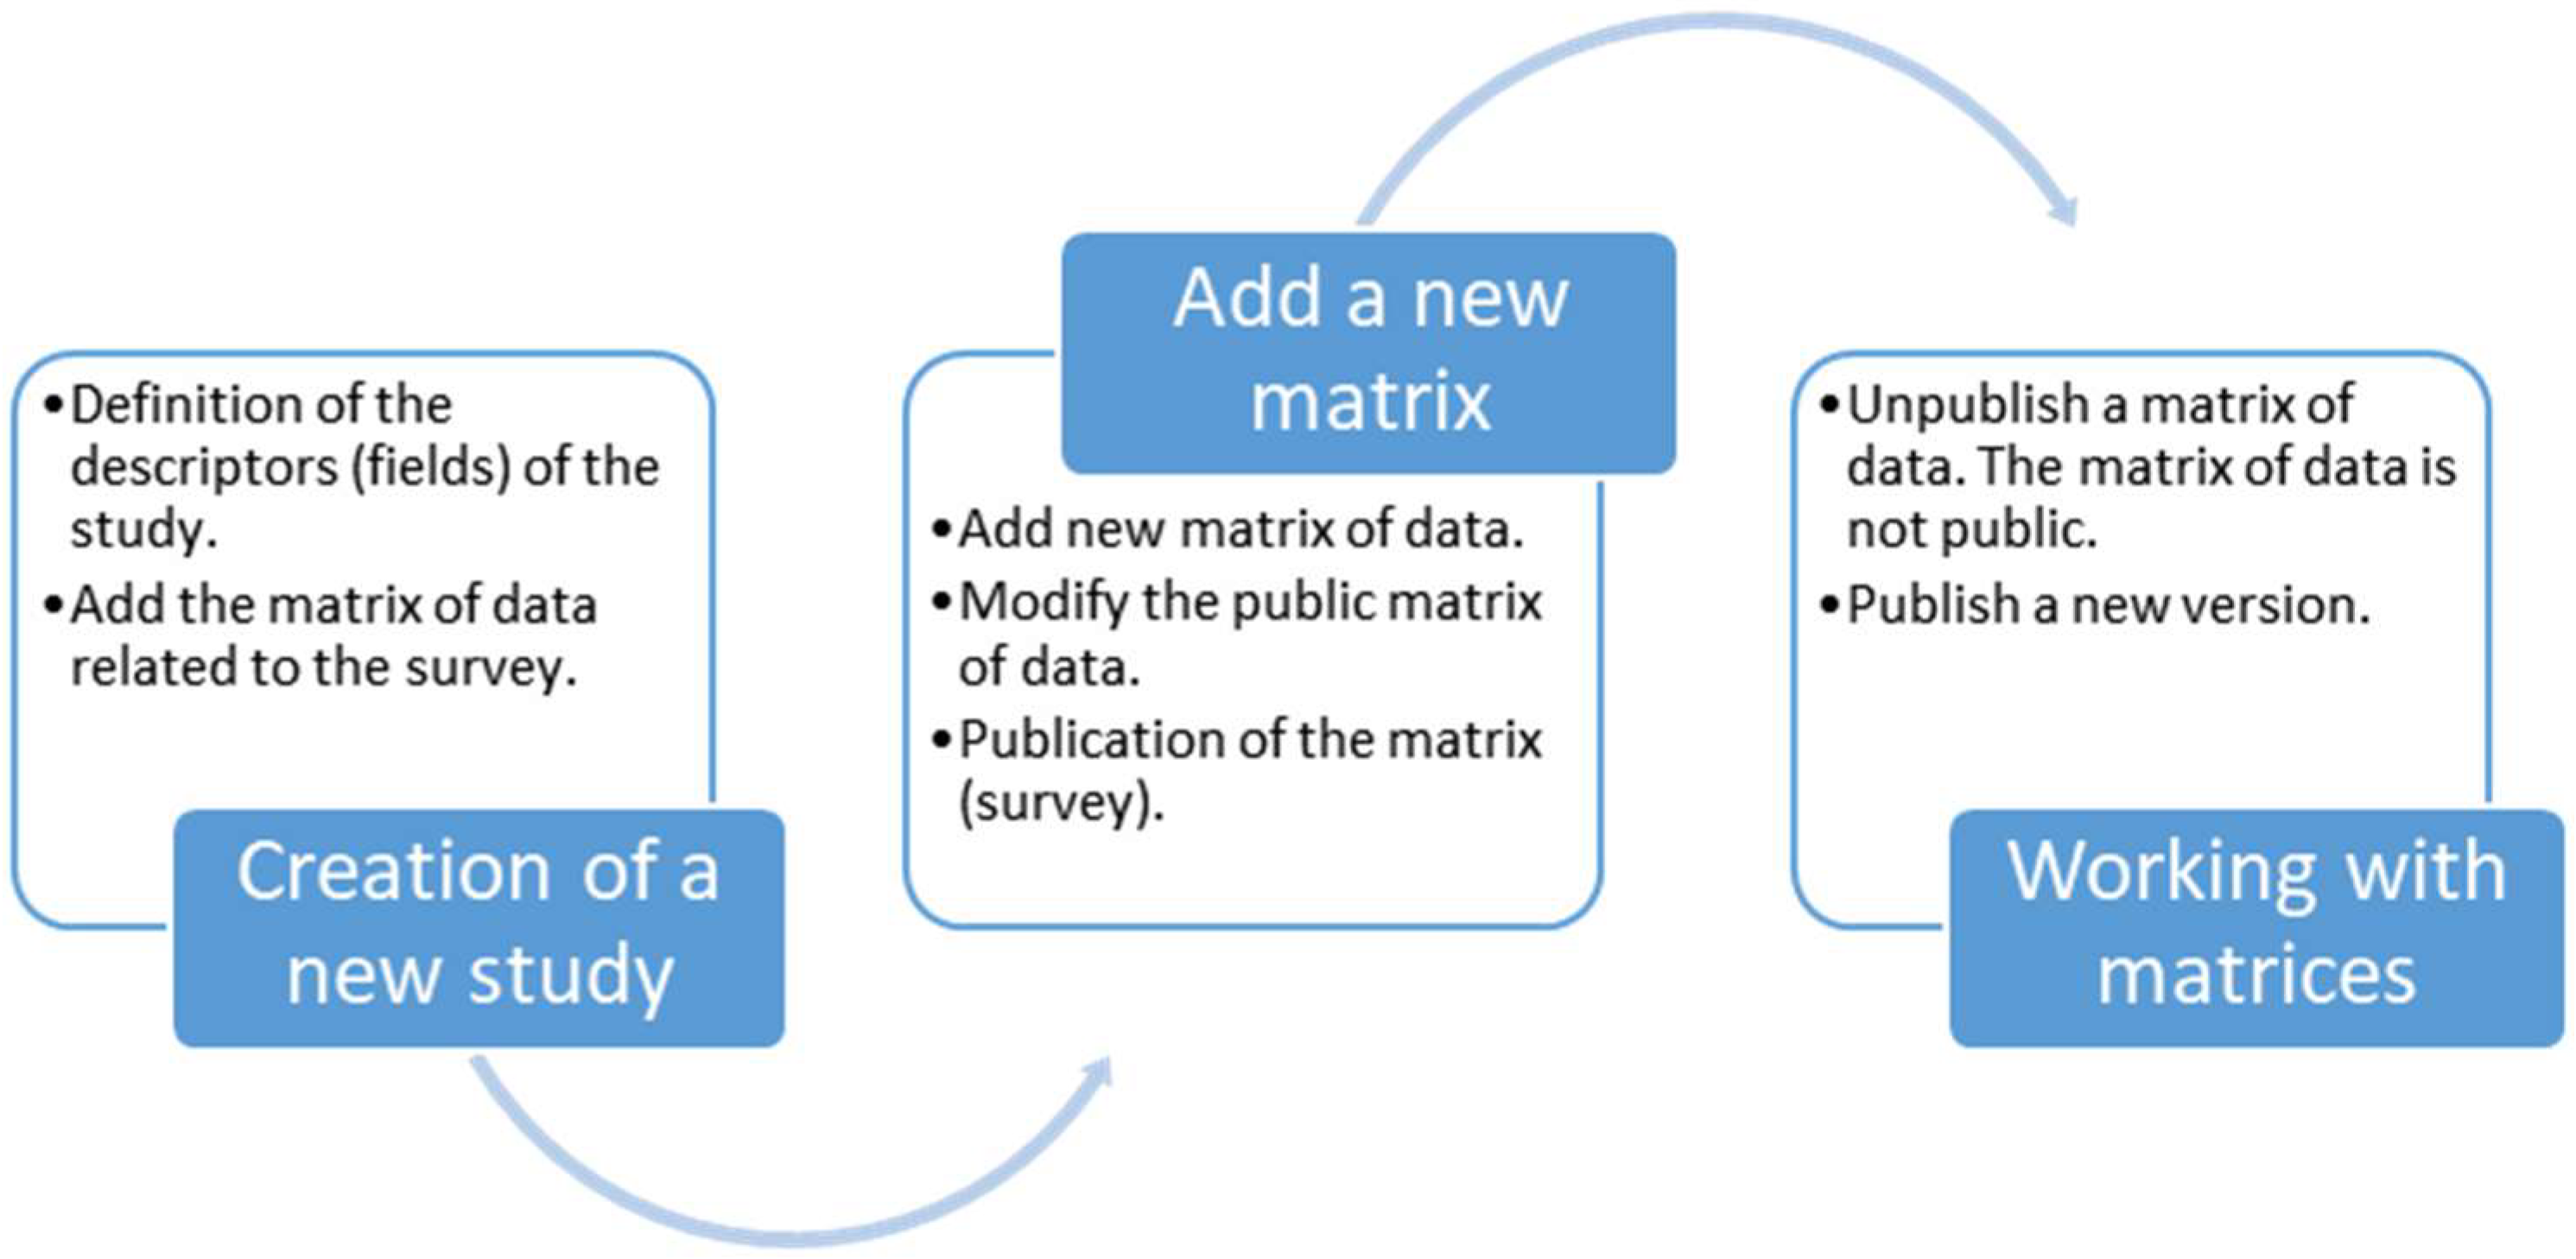
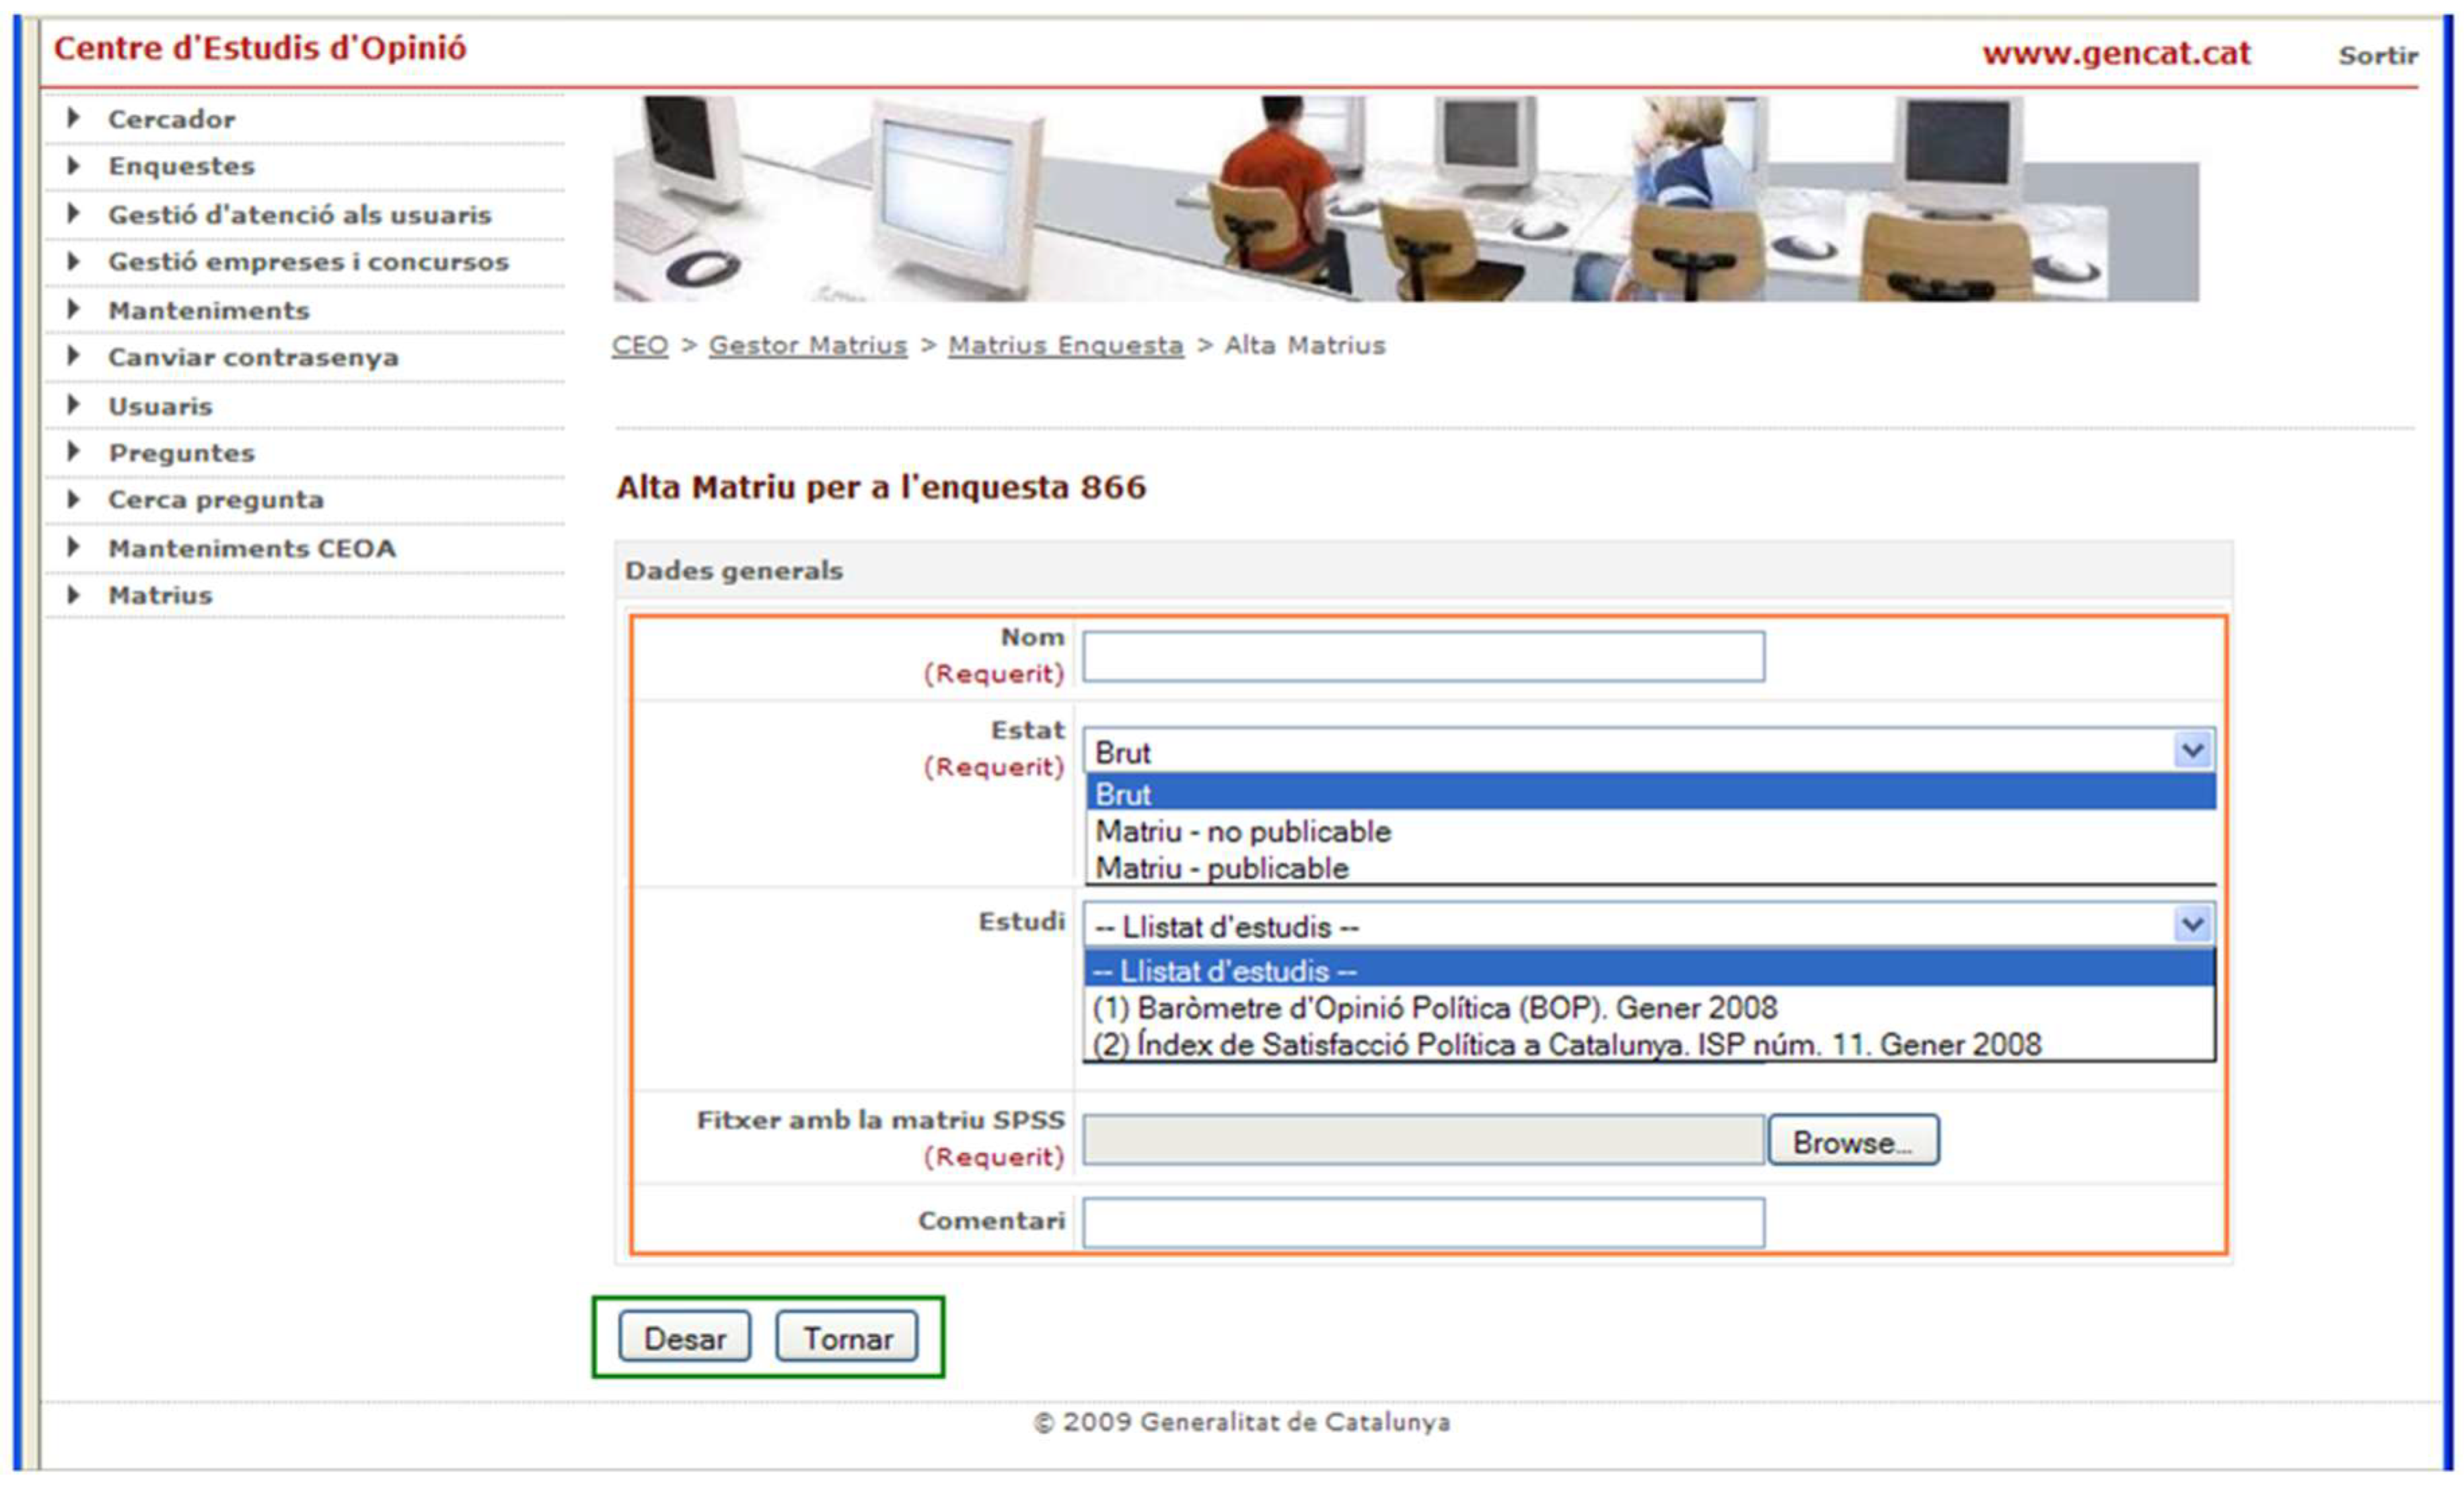
Additionally, some fields of the dataset of the survey might not be made available to the public (due to anonymity concerns); hence, some transformations to the data must be performed to guarantee that the registers are properly anonymized. After this is performed, different versions of a study can be published; for example, to correct or clean errors in the data. However, the public must only have access to matrices of data that pass the necessary quality controls, while the rest of the matrices are stored on the system as working matrices which are not accessible to the general public. The life-flow of a study is shown in
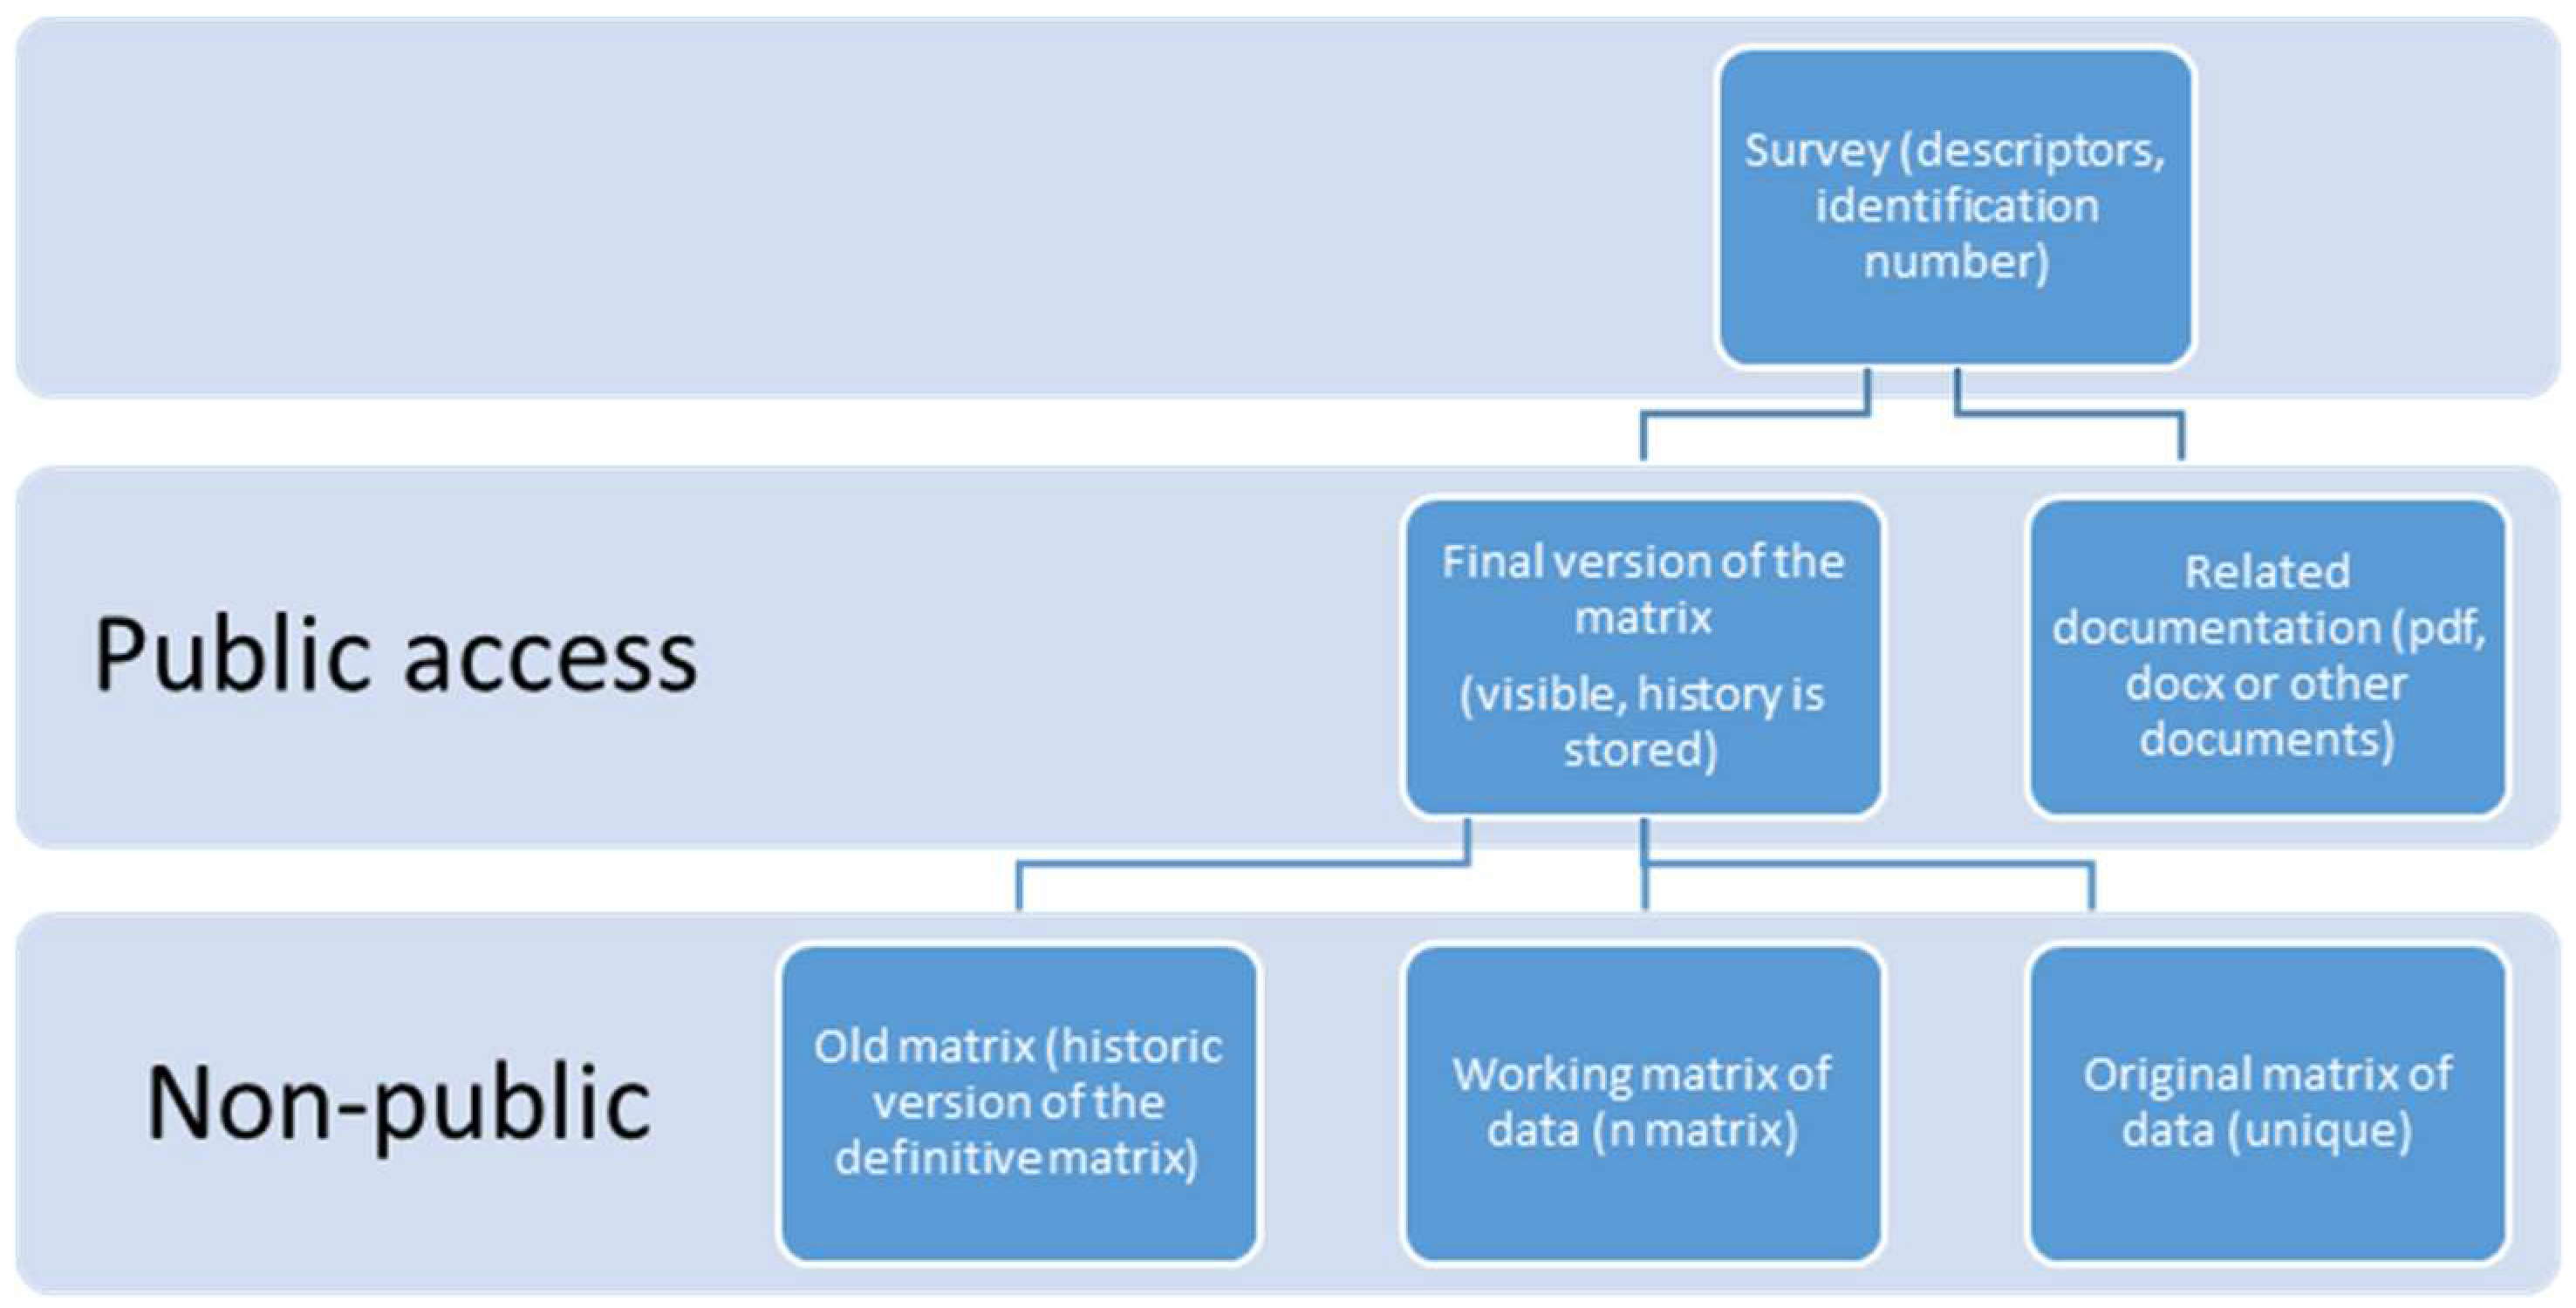
Figure 1, and the structure of our study proposal is shown in
Figure 2.
Every study has descriptors to identify the nature of the study and an identification number. For each of the studies, there is at least one corresponding matrix representing the survey. All the versions obtained from this work are stored in the study structure. Usually, this implies modifying the matrix structures or adding new information. To do so, a working matrix is created, representing the last up-to-date matrix related to the studies. The final version of the matrix is the one the users can operate with using R.
To manage these matrices, different roles must be defined.
Table 1 presents the roles we propose. Each one of these roles has different privileges in the final application. An analyst can add new studies, add new matrices to the system, and modify working matrices, whereas an external user can only perform the statistical operations allowed by the system with the definitive matrix.
To manage the matrices of data and allow a modification of these data over Cloud infrastructure, organizations worldwide are developing approaches to share statistical information over the web using different API. From our point of view, this is not sufficient because of the inherent complexity of our type of statistical data. Also, this approach would require continuous modifications on the API functions to accommodate them to new users and the institutions’ requirements employing the data. In our approach, we use a statistical language to provide a common mechanism to access all the information. The data contained in the platform we propose can be published over the internet using the statistical language itself. This allows the user to interact with the system using the full power of the R language, with no need to define new functions through an API to interact with the data.
2.1. Beyond the API: Using the R Language
We chose the R language [
18] due to its power and because it is a widely accepted language among the statistical community. R is a free software for statistical computing and graphics (see [
21] or [
22]).
This approach is opposed to the one followed by the API development. In our approach, the system allows an authorized user, or program, to access the dataset and obtain, using R syntax, the customized statistical results and information desired. Our concern is not related with the implementation of new APIs or protocols to allow access to specific statistical information or datasets but with limiting the amount of information that can be obtained over the web. This implies limiting the R operations that can be implemented on the server. Fortunately, this configuration can be accomplished through the RServe package [
23,
24], which allows the user to define what instructions can be applied over the web.
The power of R does not only rely on its strong statistical and graphical facilities but also on its versatility. Any member of the research community can improve the system by adding new modules to perform statistical operations. One of the packages we need for our approach is the RServe. R usually works in standalone applications, so the RServe package must be used to connect the different services to R. RServe can be executed from a command. RServe is a TCP/IP server that allows other programs to use the R facilities from various languages without the need to initialize R or link to the R library [
25]. Each connection has a separate workspace and working directory, which is an essential feature for this project. The sequences to start using the service are (i) starting the R console; and (ii) loading the RServe library on the console.
For most users, the default configuration is satisfactory; however, for this project, RServe must be configured to coordinate the different elements that comprise the system. RServe usually works with several default parameters that can be modified in the
config file (see [
24]).
2.2. Using R on the Statistical Study Lifecycle
Three main areas must be covered (see
Figure 1): the management of the questionnaire, the management of the matrices of a given study, and the management of the operations that can be applied to the matrices of the public study. In each of these three areas, we propose to use the R language as a basic element to simplify the interaction.
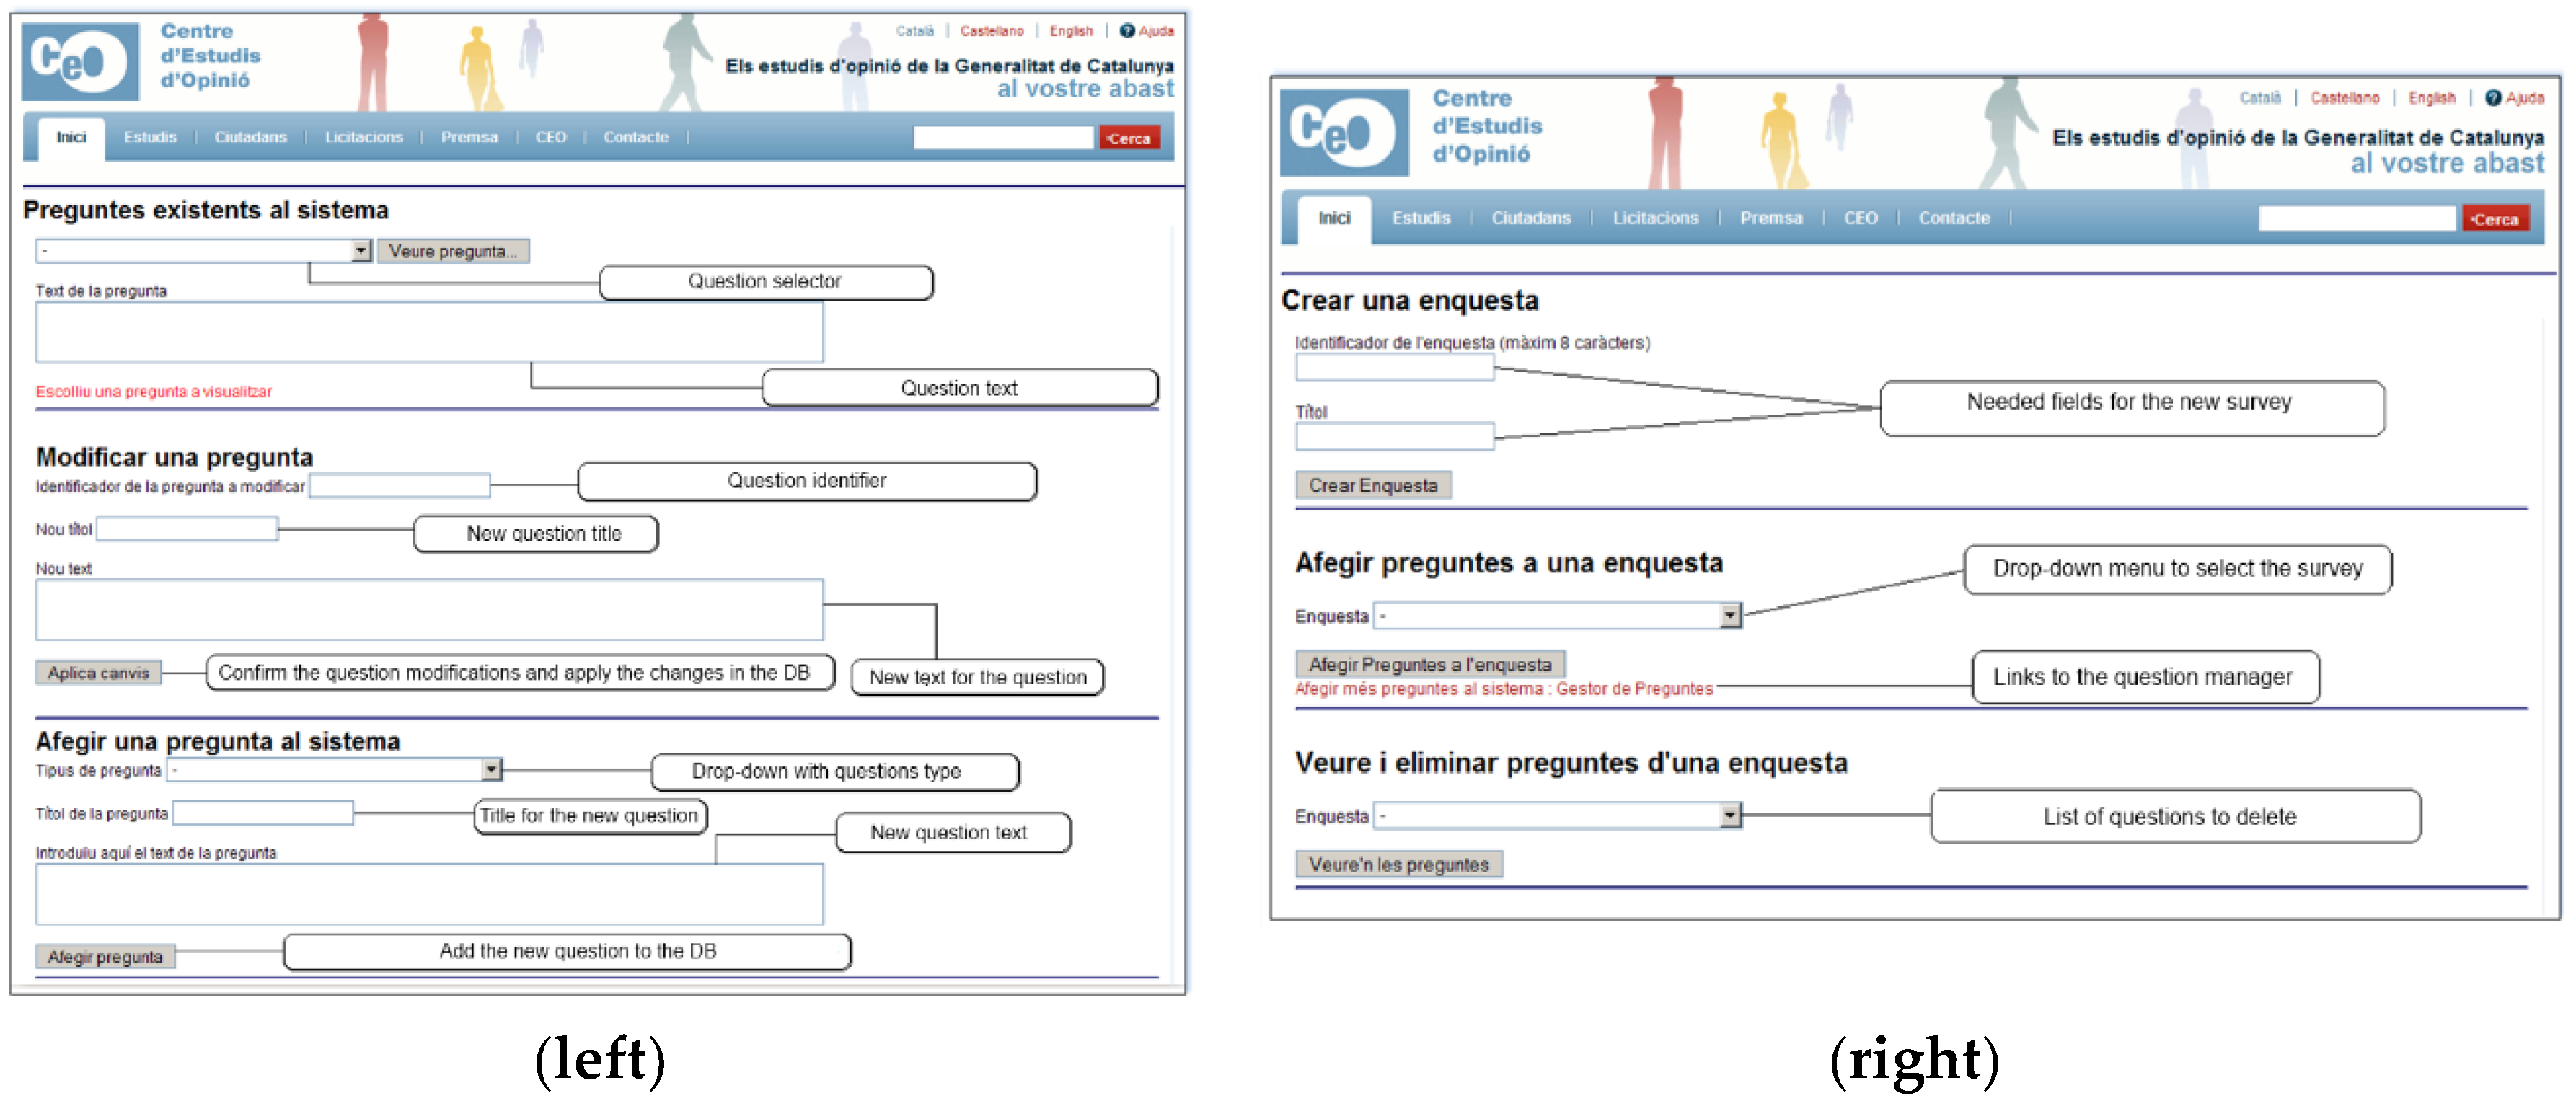
To prepare a new questionnaire, first, the questions must be defined. This is not an easy task because of the diversity of questions that can appear in a single questionnaire; also, because the various surveys (of a barometer trend) must consistently be related to each other to make it possible to obtain accurate conclusions over time. There are various alternatives to design surveys; e.g., [
13], or [
14], among others. Using these alternatives, the questions can be defined, and they can be sorted into questionnaires that the respondents must answer. Often, these alternatives can export the data to various formats for posterior analysis (such as Triple-S).
In our proposal, the relations between the various questions that compose the questionnaires must also be defined; this information (which can be stored in the database for its posterior use) helps us in the review of the complete history of the questions. The answers to the various questionnaires and the history of changes are also available. For example, if we include a question such as “Which party would you vote for in the next election?” and in a new version of a questionnaire, this changes to “If elections were to be held tomorrow, which party or coalition would you vote for?”, we must keep the relation between both questions, indicating that they represent the same underlying concept. This simplifies the statistical use in the operations tool, merging the information to construct, for example, a time series.
In that sense, the present approach simplifies the ulterior data management; however, this implies that the uploading process is not easy because it is necessary to create the structure of the relationships of the questions, surveys and answers in the database. Additionally, the matrix files can be large and represented in various formats. In our approach, all the information is transformed to a specific XML file that always has the same structure. This enables the user to work with surveys that have the answers in several formats, such as Excel, SPSS, Minitab or R, among many others. Thanks to the use of an XML base representation for the uploading and management of the data matrices, it is possible to incorporate tools to access the questions. These questions can be presented to the user in various ways; i.e., editions. All the editions of a question can be related, simplifying the operation of merging surveys. The users can build a new questionnaire, and after the questionnaires are defined in the system, they can be related in a matrix that contains the data obtained from the respondents. The key element is to always retain the relation between the questions, the questionnaires and the answers. Finally, and because we propose to use the R language, the users can execute the operations written in R with the data loaded on the system (a subset of the allowed operations).
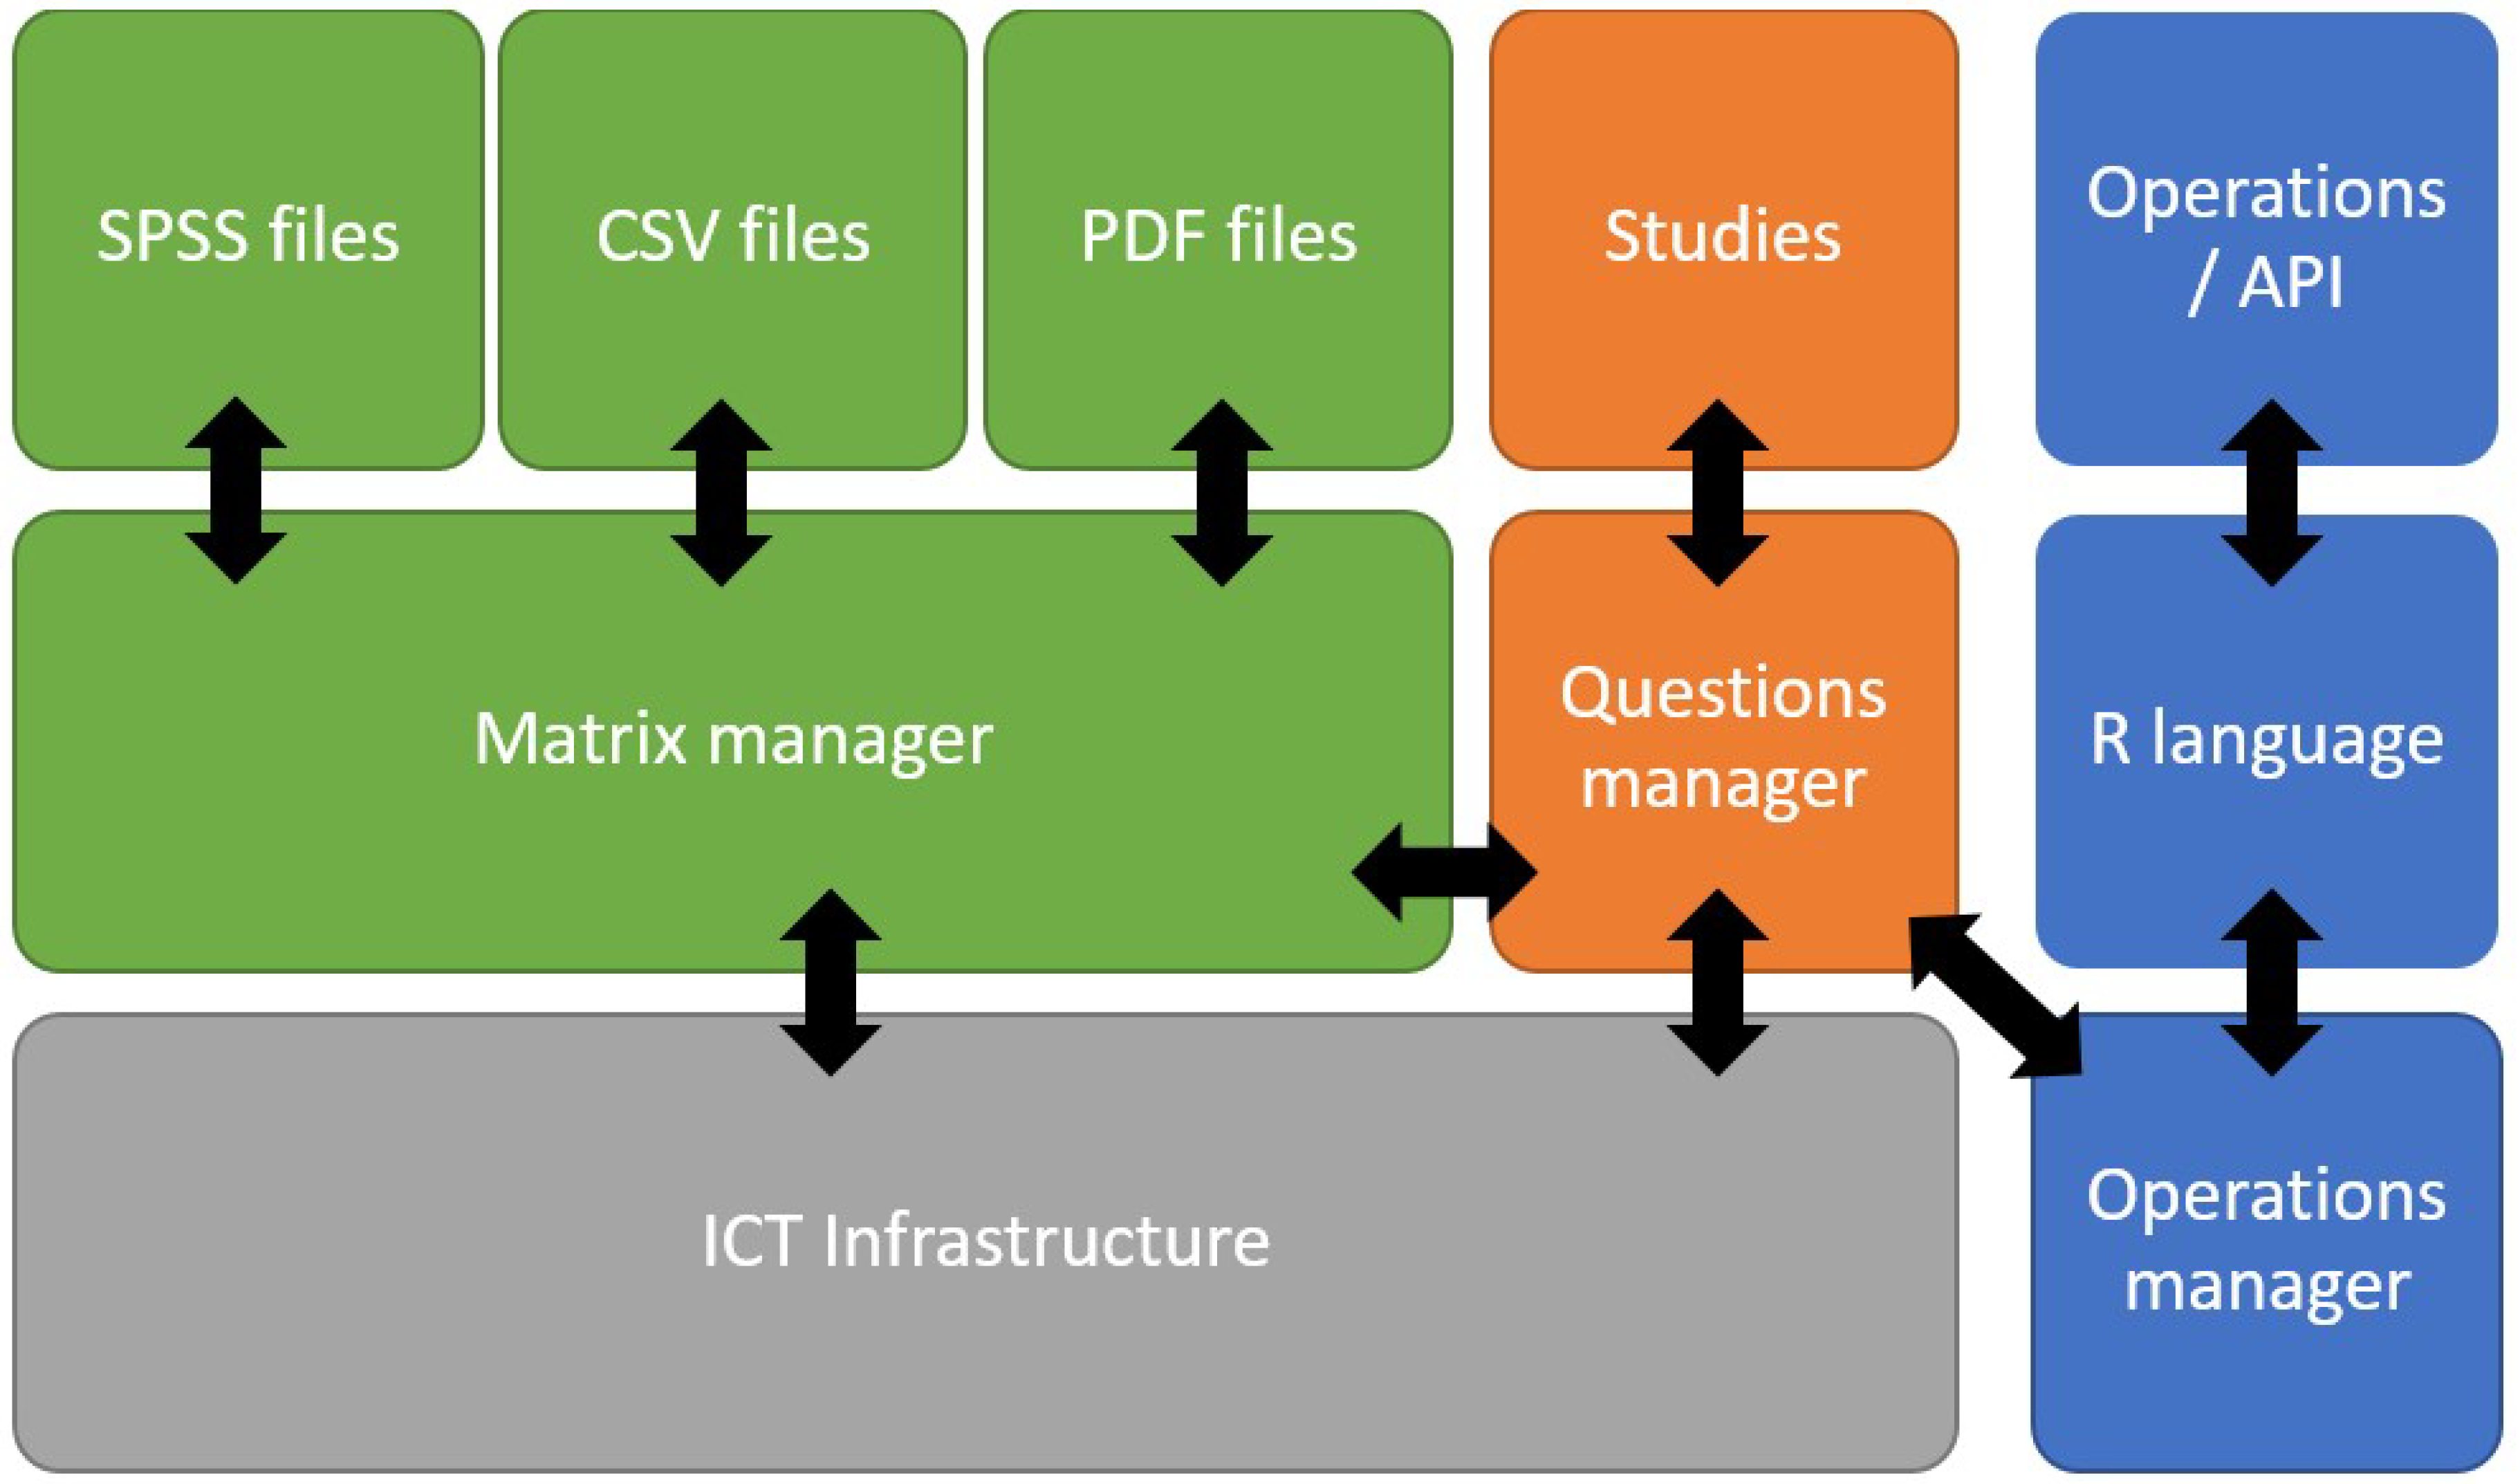
In
Figure 3, the proposed architecture for the management of the statistical information is presented. In this approach, the relation between the questions in all the questionnaires included in the database is preserved. Additionally, the R language will be used as an API to obtain information from the system instead of defining an API.
3. Case Study: The UPCEO Application
Three institutions are involved in this project, the Centre d’Estudis d’Opinió (CEO), the InLab FIB and the Centre de Telecomunicacions i Tecnologies de la Informació (CTTI). The CEO is the official survey research institute of the Generalitat de Catalunya. It handles the government’s political surveys, barometers, election studies, and other public opinion polls in Catalonia. As defined in their institutional functions, “It is a tool [the CEO] of the Catalan government aimed at providing a rigorous and quality service to those institutions and individuals interested in the evolution of Catalan public opinion.” One of its commitments is to make the information readily accessible to the public.
InLab FIB is an innovation and research lab based in the Barcelona School of Informatics, Universitat Politècnica de Catalunya–Barcelona Tech (UPC) that integrates academic personnel from various UPC departments and its own technical staff to provide solutions to a wide range of demands that involve several areas of expertise. InLab FIB, formerly LCFIB, has more than three decades of experience in developing applications using the latest ICT technologies, collaborating in various research and innovation projects and creating customized solutions for public administrations, industry, large companies and SMEs (Small and medium-sized enterprises) using agile methodologies.
The
Centre de Telecomunicacions i Tecnologies de la Informació (CTTI) [
26] is an infrastructure that can host all the services that the various organizations that belong to the
Generalitat de Catalunya require. This infrastructure is maintained by a licensed private enterprise (currently T-Systems). This is convenient for the project because, when the CEO releases a new study, the quantity of resources required to supply the punctual demand can be bigger than the resources required in a usual day. Additionally, because CTTI ensures that the system is working 24/7, it can be convenient for the daily work to provide the infrastructure for the CEO database to store all the information regarding the studies. The CEO primarily manages surveys related to political public opinion. The studies derived from these surveys are published on the CEO website to ensure that the public has knowledge about them.
Based on the proposed architecture presented in
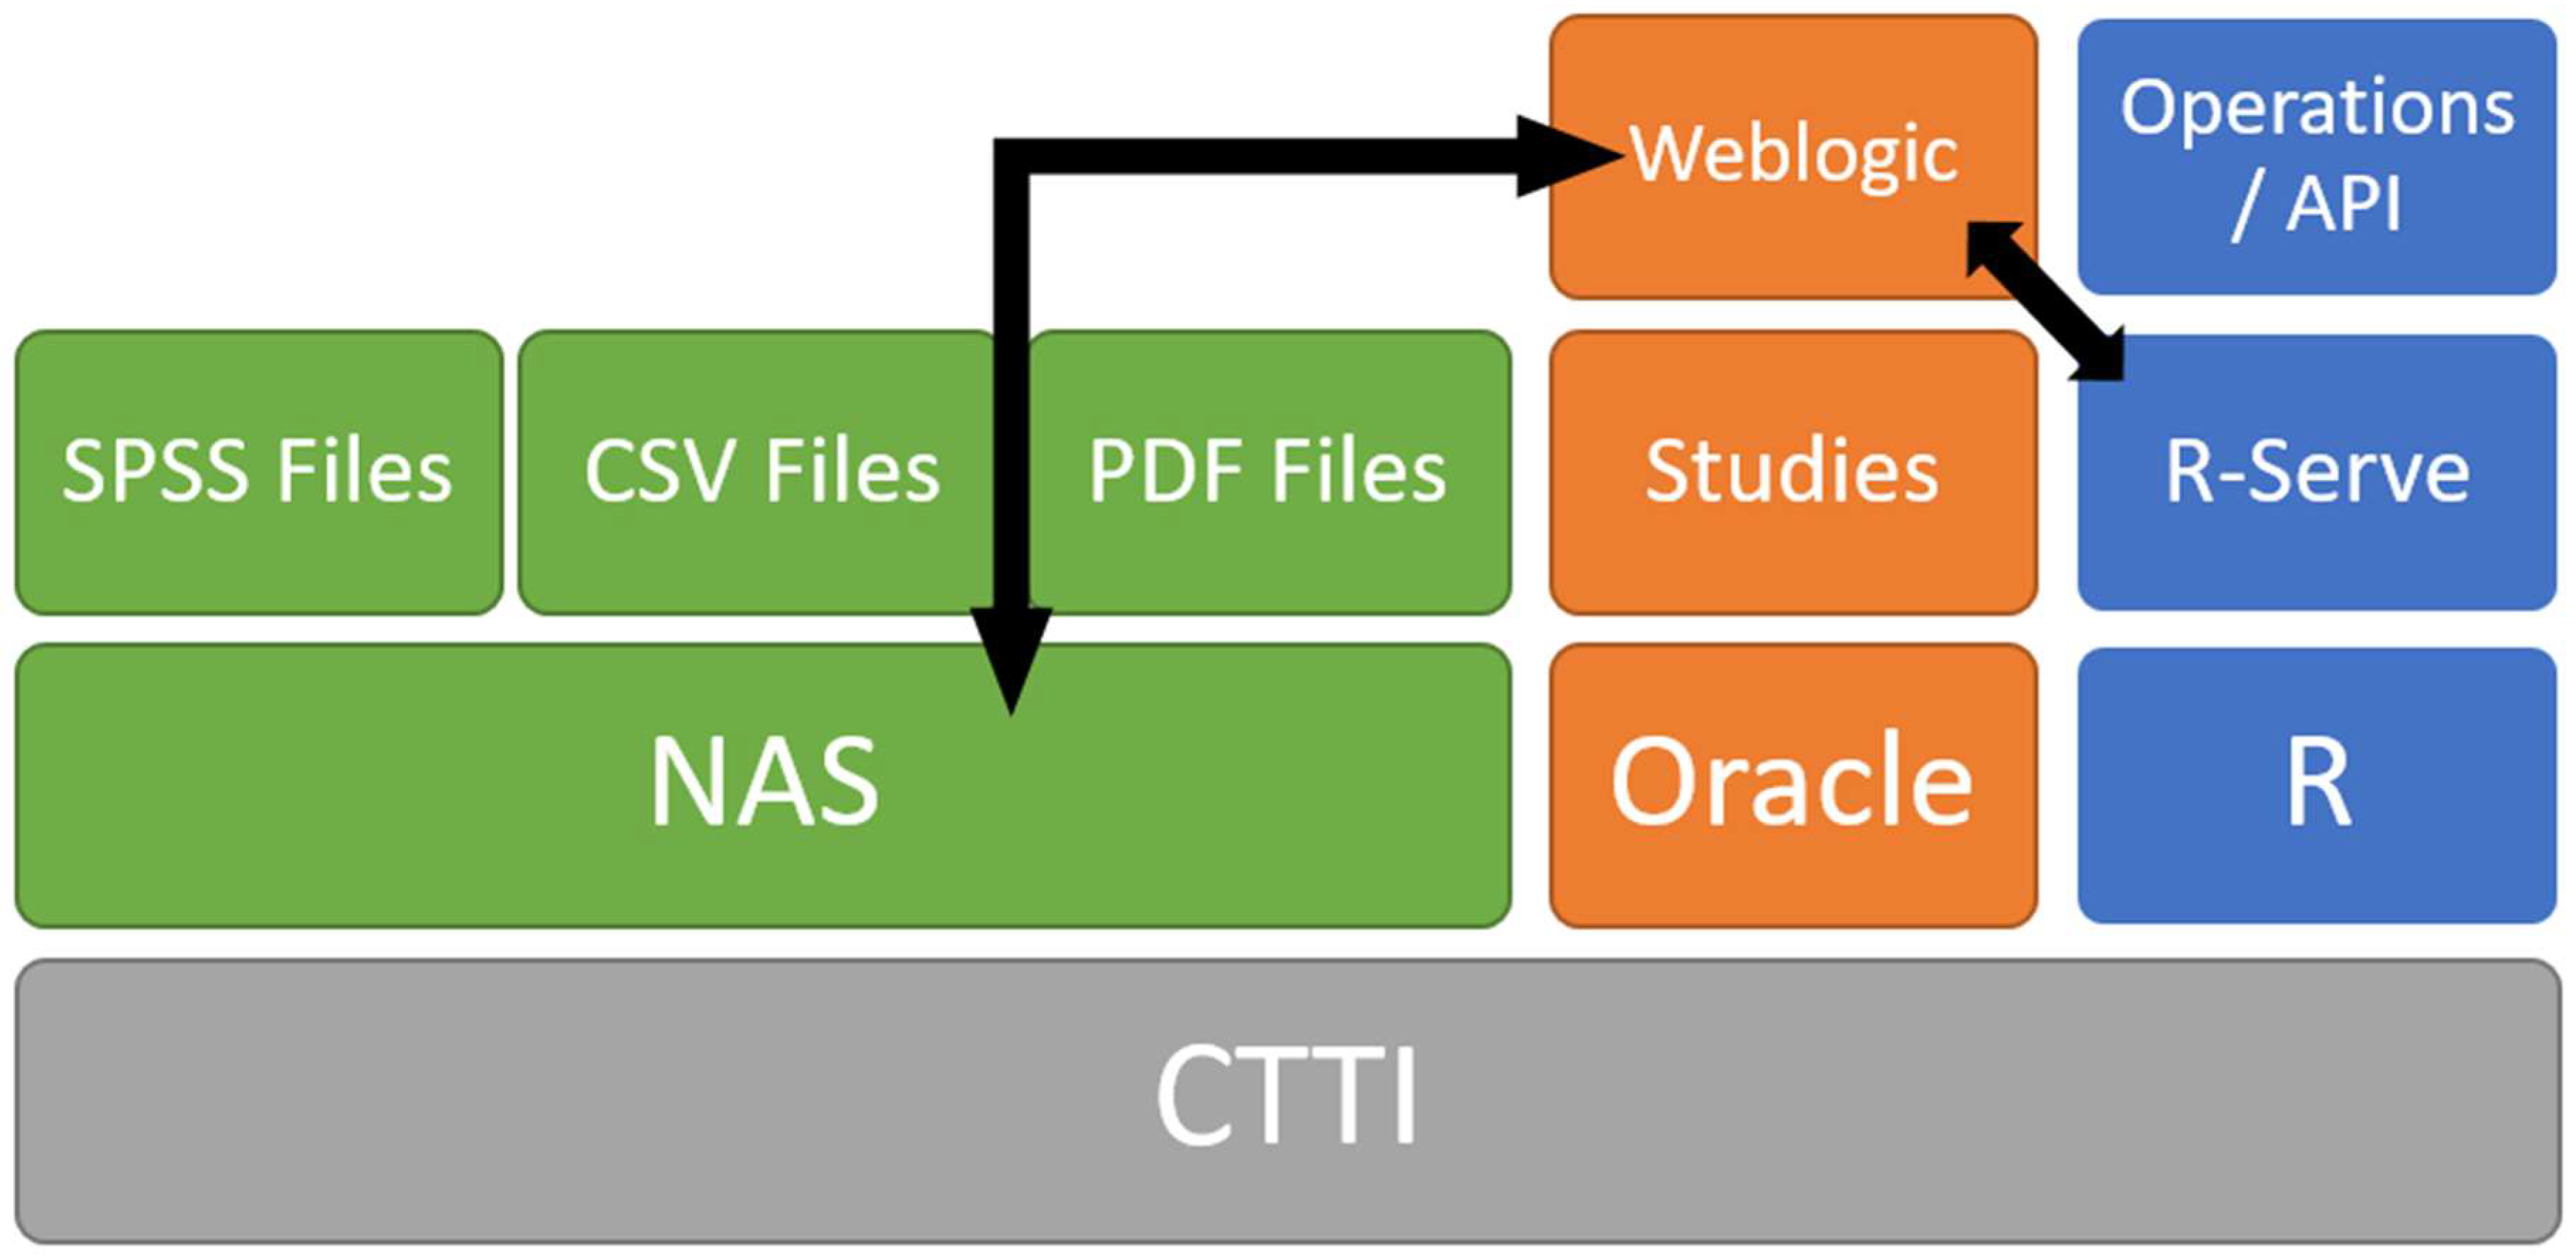
Figure 3, we implement a system for the CEO to simplify the management and use of statistical information over a web. The specific implementation is represented in
Figure 4. The system is composed of different layers, each of which is related to the different services that the system must provide. The web server is based on a WebLogic Oracle
® application [
27], using Apache Struts [
28,
29] and Java as the infrastructure to define the interface of the system and to establish communication with the R system. The main purpose of using R is to implement several operations that deal with data. As an example, we use R to obtain the data from the matrix and the surveys that usually are in the original form of Excel spreadsheets, SPSS files or SAS files; here, R is used as the bridge between all the various file formats. The R language can be used by users and other applications as an API to communicate with the system to obtain statistical data. In
Figure 4, the structure of the system is shown. The entire system is on the CTTI cloud infrastructure. The various files related to the application are stored on a NAS system. The studies are stored in an Oracle database to manage the different files of the system. The R application is installed on the system with the RServe package, defining a set of operations (as an API) and publishing them on the internet using WebLogic platform.
From an operations point of view, when a user requests a specific study, they obtain its related documents; mainly .pdf files and links to other data related to the survey. With these data, the user can perform various operations (with R), obtaining new data and information. These results can then be exported in CSV file format to be analyzed in more detail using any statistical package. As shown in
Figure 4, the matrix is stored in its original form on the NAS, implying that various formats must be stored in the system. In this way, the information generation process can be reproduced exactly as it was done by the analyst.
The main file formats that can be used by the CEO analyst are Excel spreadsheets, SPSS .sav files and .csv files. The various functionalities in the system are as follows:
The application can be accessed at
http://ceo.gencat.cat/ca/inici/. The website (in Catalan language) gives access to the operations in
Banc de dades del BOP, located at the bottom of the page.
4. Implementation and Calibration of the Application
The entire application resides as a cloud solution supported by the
Generalitat de Catalunya, hosted by the
Centre de Telecomunicacions i Tecnologies de la Informació (CTTI). In this Cloud solution, the options to work and to modify the uploaded code are limited, as explained in
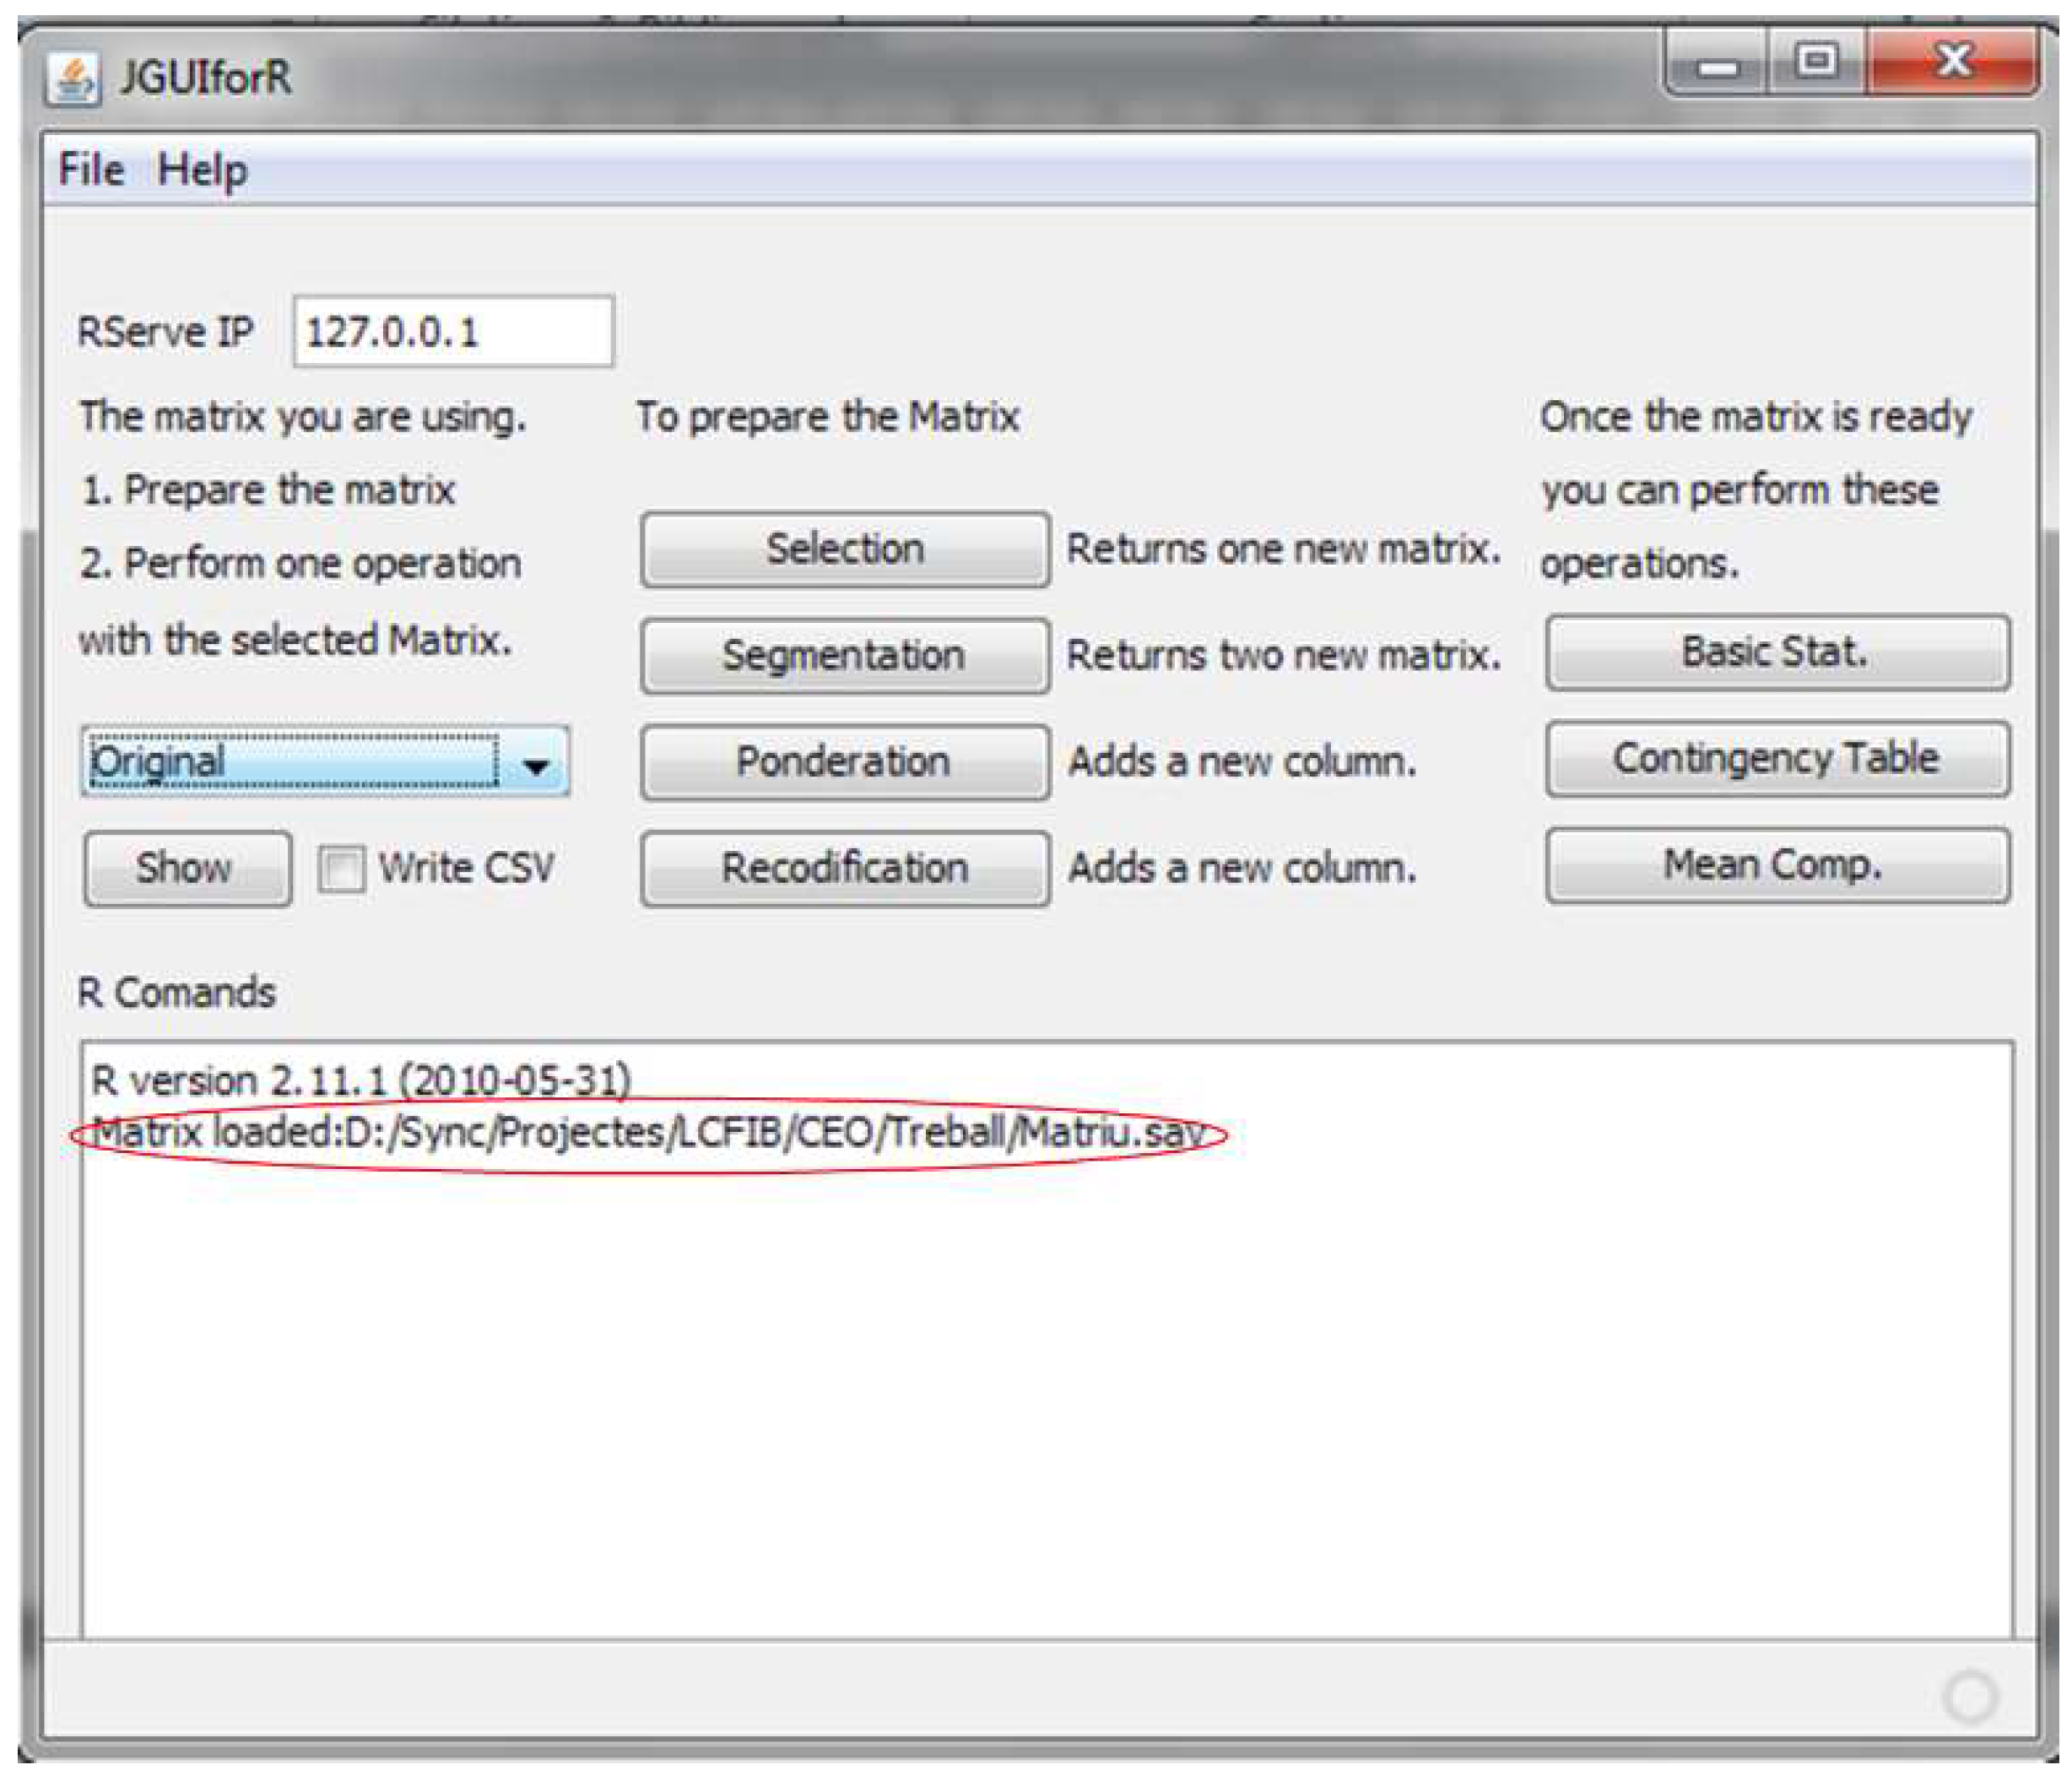
Section 3. Because of the complexity of the structure and the required security concerns, a test infrastructure was implemented to assess the R operations. The test infrastructure is composed of a server and a client. On the server side, a machine acts as a web server (using IBM WebLogic), hosting the MySQL database, storing the data on the NAS (network attached storage) and executing R-Serve. On the client side, a java program (named JGUIforR; see
Figure 7) is used to define the Graphical User Interface (GUI) and the R code needed to execute the operations and manage the matrices.
The client application must first be connected with the server side. The IP of the R server instance we want to use is defined. In this case, the application is connecting with a server that is executed on the same machine as the JGUIforR.
Once this is completed, the connection with the server is established using the file menu. Then, there are two options available. RComand implies that the user is working with a local instance of R. In that case, it is not necessary to define the IP. RComandTCP implies that the user is working with a remote instance of R; in that case, the IP of the remote server must be defined. If the connection is established without error, a message appears in the RComand window showing the version of the R engine used on the server side.
To start working, a dataset must be selected; in this case, an SPSS® dataset. Opening a new dataset is as easy as going to the file menu and selecting a new matrix of data.
Once the matrix is loaded, a message is shown to the user in the RComand area, as shown in
Figure 7. At this point, all the operations are active, and the user can start working with the matrix.
CEO analysts use this software to understand the operations that the system publishes and to understand the behavior desired in the final implementation of the client (see
Figure 8). As shown in
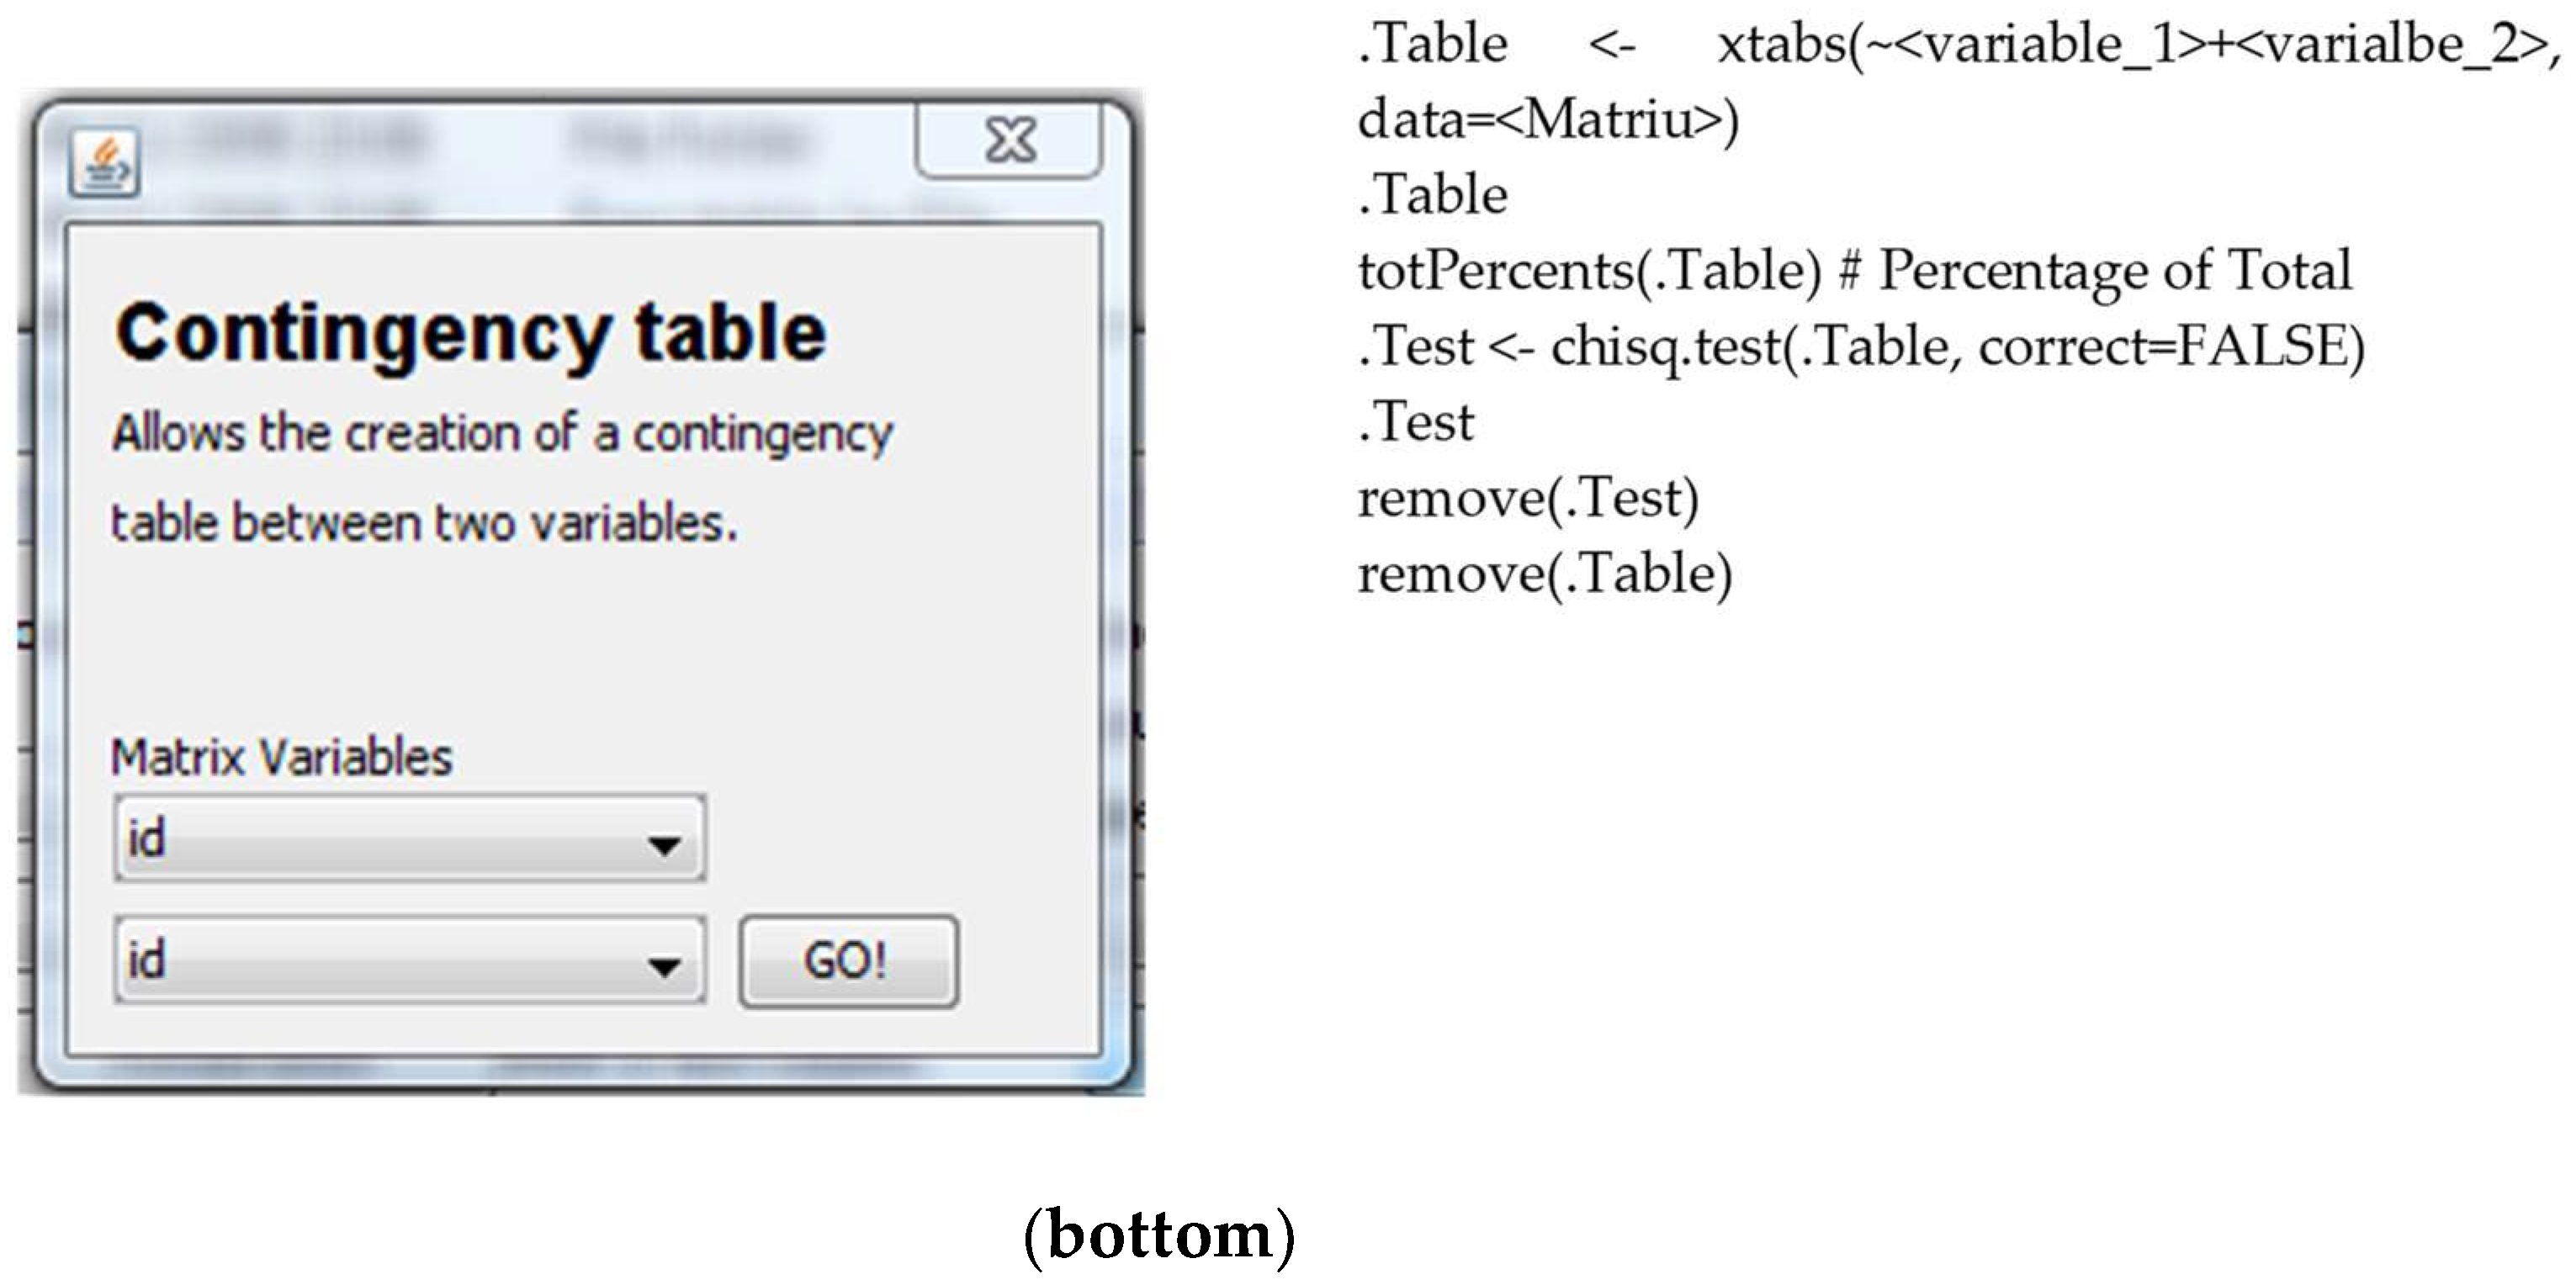
Figure 7, the operations are divided into two main groups. The first includes the preparation of the matrix (the dataset of the survey), the selection of a portion of the data of the entire matrix, the segmentation of the matrix, weighting of some of the columns of the matrix, and recodification. The other operations that can be executed are implemented on this matrix. The results are obtained also following the R syntax; as an example,
Figure 8 shows the code that allows us to obtain the contingency table that will be shown to the user as in described in
Section 4.3.3.
Next, you can see the output for the contingency table in R code. The output obtained is a double entrance table, with total percentages and a chi-square test to analyze the independency. The output is reformatted and uses only two decimals to simplify the reading.
[REAL* (318.0, 190.0, 189.0, 192.0, 330.0, 194.0, 195.0, 192.0)]
[VECTOR ([REAL* (0.08)], [REAL* (3.0)], [REAL* (0.9931509045238127)], [STRING “Pearson’s Chi-squared test”], [STRING “.Original”],
[REAL* (318.0, 190.0, 189.0, 192.0, 330.0, 194.0, 195.0, 192.0)],
[REAL* (320.04, 189.65, 189.653, 189.65, 327.96, 194.34, 194.34, 194.34)],
[REAL* (−0.11, 0.02, −0.04, 0.17, 0.11, −0.02, 0.04, −0.16)])]
Note that this format, although it contains the needed information, is not easily readable for a non-trained user.
4.1. Deploying the System
Once operations perform as expected, the system can be deployed on the CTTI infrastructure. This project represents the first deployment of RServe on the CTTI infrastructure, which implies the need to define roles and protocols to ensure 24/7 support. First, the application is deployed on the working server, a machine accessible only to the computers located at the InLab FIB. Once the application passes the tests on these machines, it is deployed at the integration level of the CTTI infrastructure. Here, the application is tested in an environment that has similar security levels and the same software. After the application performs well there, it can be deployed to a preproduction level. Here, the application runs on an exact replica of the final infrastructure, on the same hardware and executing the same software that the application will find in the production environment. At this level, a set of tests are performed, and the application must pass all of them to be deployed to the production level.
At the production level, the application is available for public use. Once the system is deployed, the operations performed by the users never modify the information stored in the server. The system must also be able to store information regarding the different activities each user does. When an operation is selected, the R syntax is stored in the database. This syntax is not executed immediately on the system; it is only executed when the user requests the results (for example, executing the operations of basic statistics).
4.2. Testing the System
To evaluate how the system performs, it is necessary to test how it behaves during each of the different tasks that must be accomplished in the process of producing and analyzing a new matrix of data. In that sense, the main operations are (i) the process of preparing the surveys and uploading a matrix of data and (ii) the process of operating with these data and returning the information to the user.
4.2.1. Preparing the Questionnaires and Uploading a Matrix of Data
As is described in
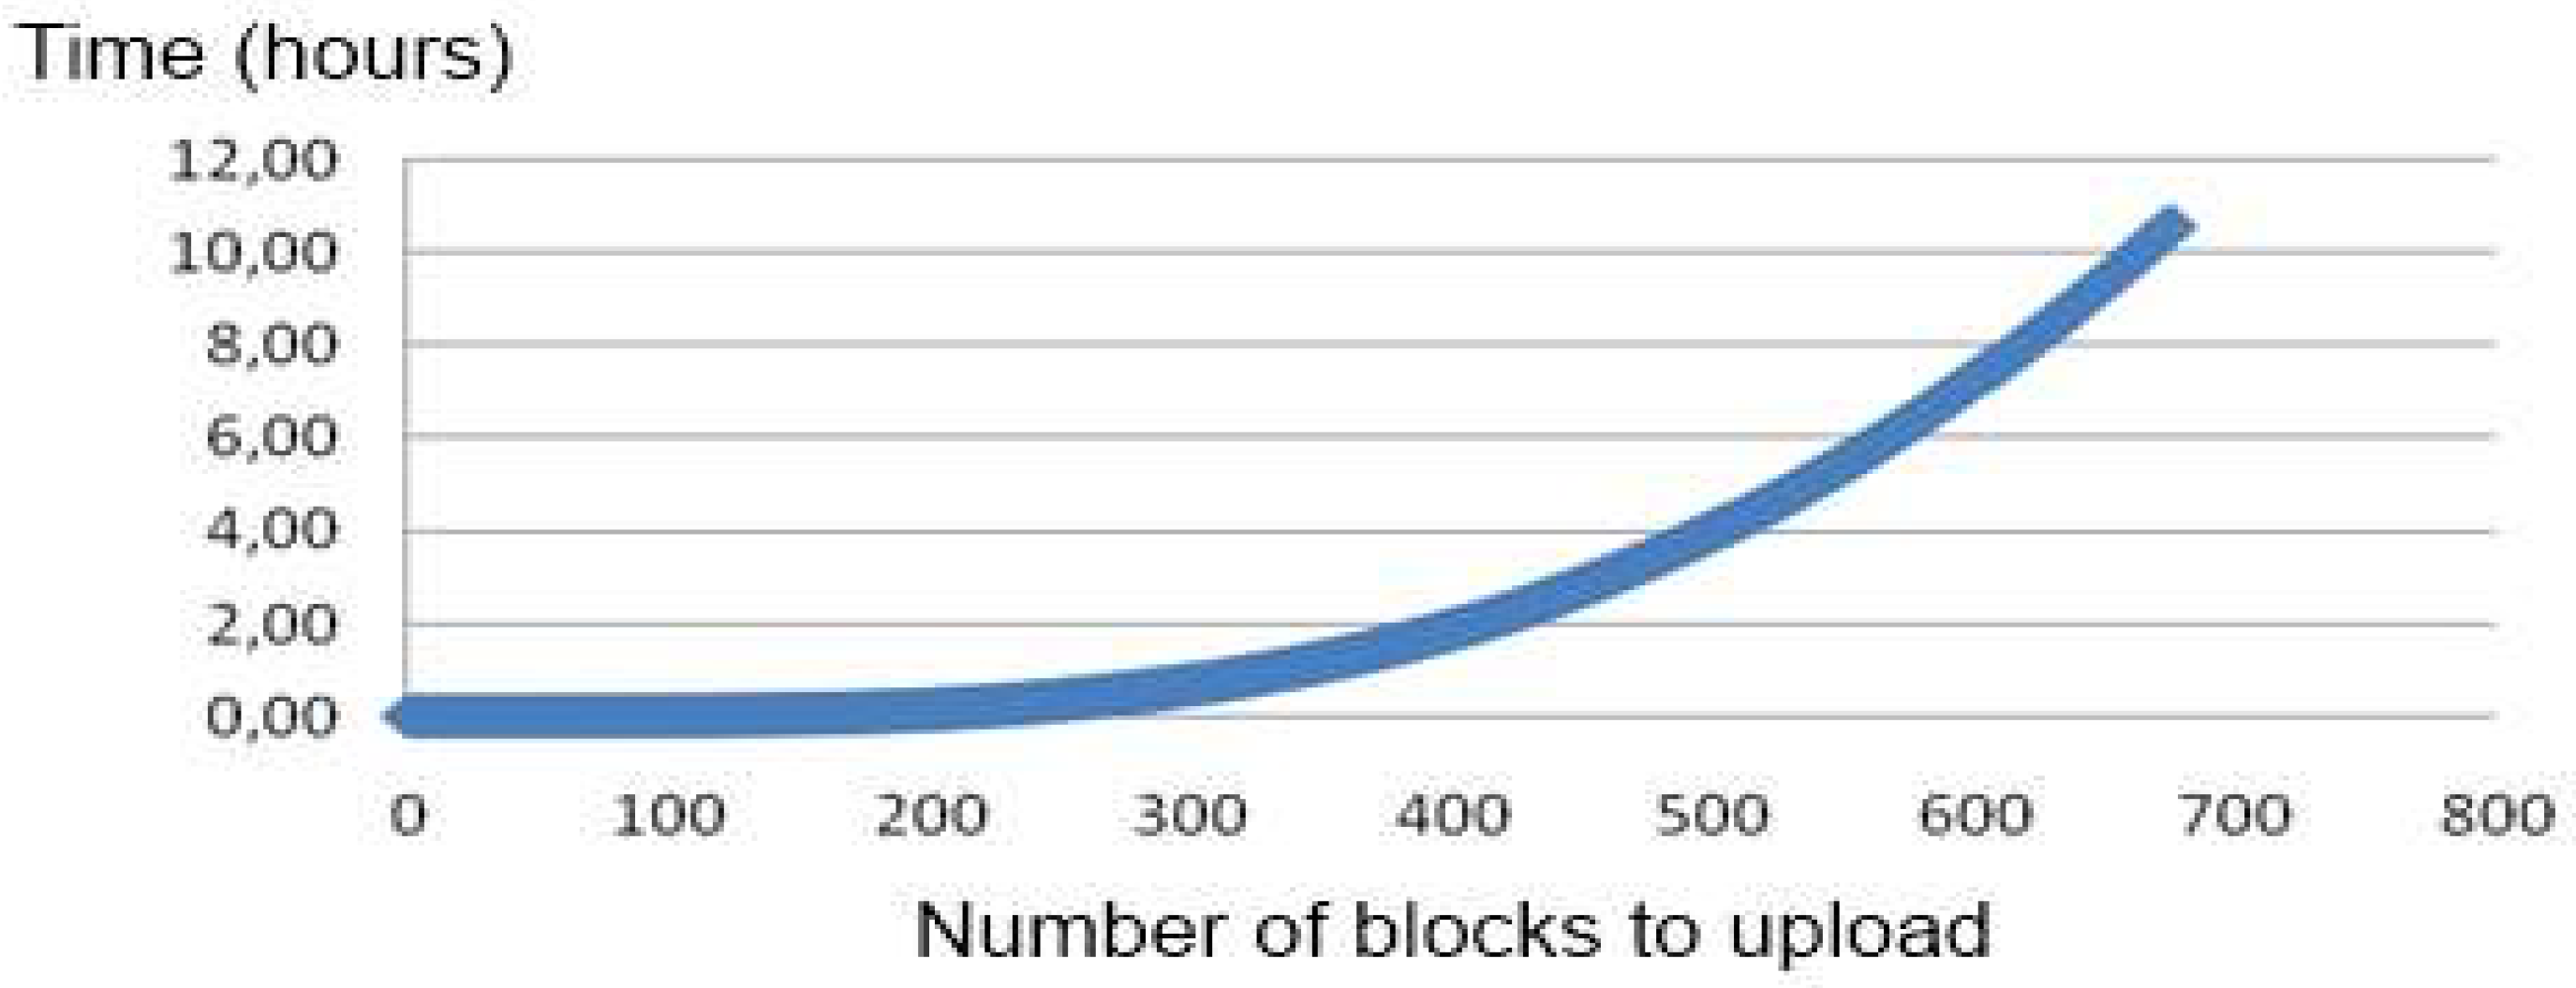
Section 3, the questions and the questionnaires must be related to assure obtaining chronological information. This implies that the matrices of data are huge and have a great impact on the database. This implies an increased time to upload a new matrix of data in the database. Several alternatives were analyzed and tested to reduce this upload time. The first alternative tested is the use of SQL commands to include the new answers on the database (creating the relation with the questions and questionnaires of the surveys). This approach was not possible to implement because the file can be larger than the maximum value of bytes accepted by the database to be included in a single operation. The second alternative, which is uploading the files by parts, does not solve the problem because the time needed to upload the complete file grows exponentially from the communication protocol of the server, as shown in
Figure 9.
Other alternatives that offer good performance are SQL LOADER (Moore, 2003) or external tables (Billington, 2007). However, both techniques, although dramatically improving the time required to upload the matrices of data (more clearly with large matrices), are not suitable for use in our cloud infrastructure. The implemented solution was based on the use of CLOB and XMLType (ORACLE-BASE.com, 2012). Test results showed that, to insert the XML file with the XmlType format in the database quickly, it must first be inserted as an object of the type Oracle CLOB and then reinserted into another object of the type XMLType.
With this solution, the time required to upload a matrix of data is less than two minutes for a normally sized matrix and approximately five minutes for the large matrices. With this approach, not only is the matrix uploaded, but the relationships for its posterior calculus are also created and stored.
4.2.2. The Process of Operating with the Matrix of Data and Returning the Information to the User
The tool must operate at least as efficiently as if the user downloads the matrix of data and uses R on a desktop computer.
All the operations are stored in the database using the R syntax. Thus, when a user starts the operations, the system stores the R code in the database, but as mentioned earlier, it does not execute the code. The code is only executed when the user requests the results. This is because the system has a delay in the establishment of the connections between the client and the RServe. This delay can be of a minute in some cases. Using this approach, the delay is minimized. After the connections are established, R performs well and returns the new data very quickly. In all of the tests, the time required to obtain new values, after the initial connection was established, depended only on the web latency.
One of the main advantages of the new system is that it does not allow the users to accidentally modify the data and does not allow mistakes in the statistical operations.
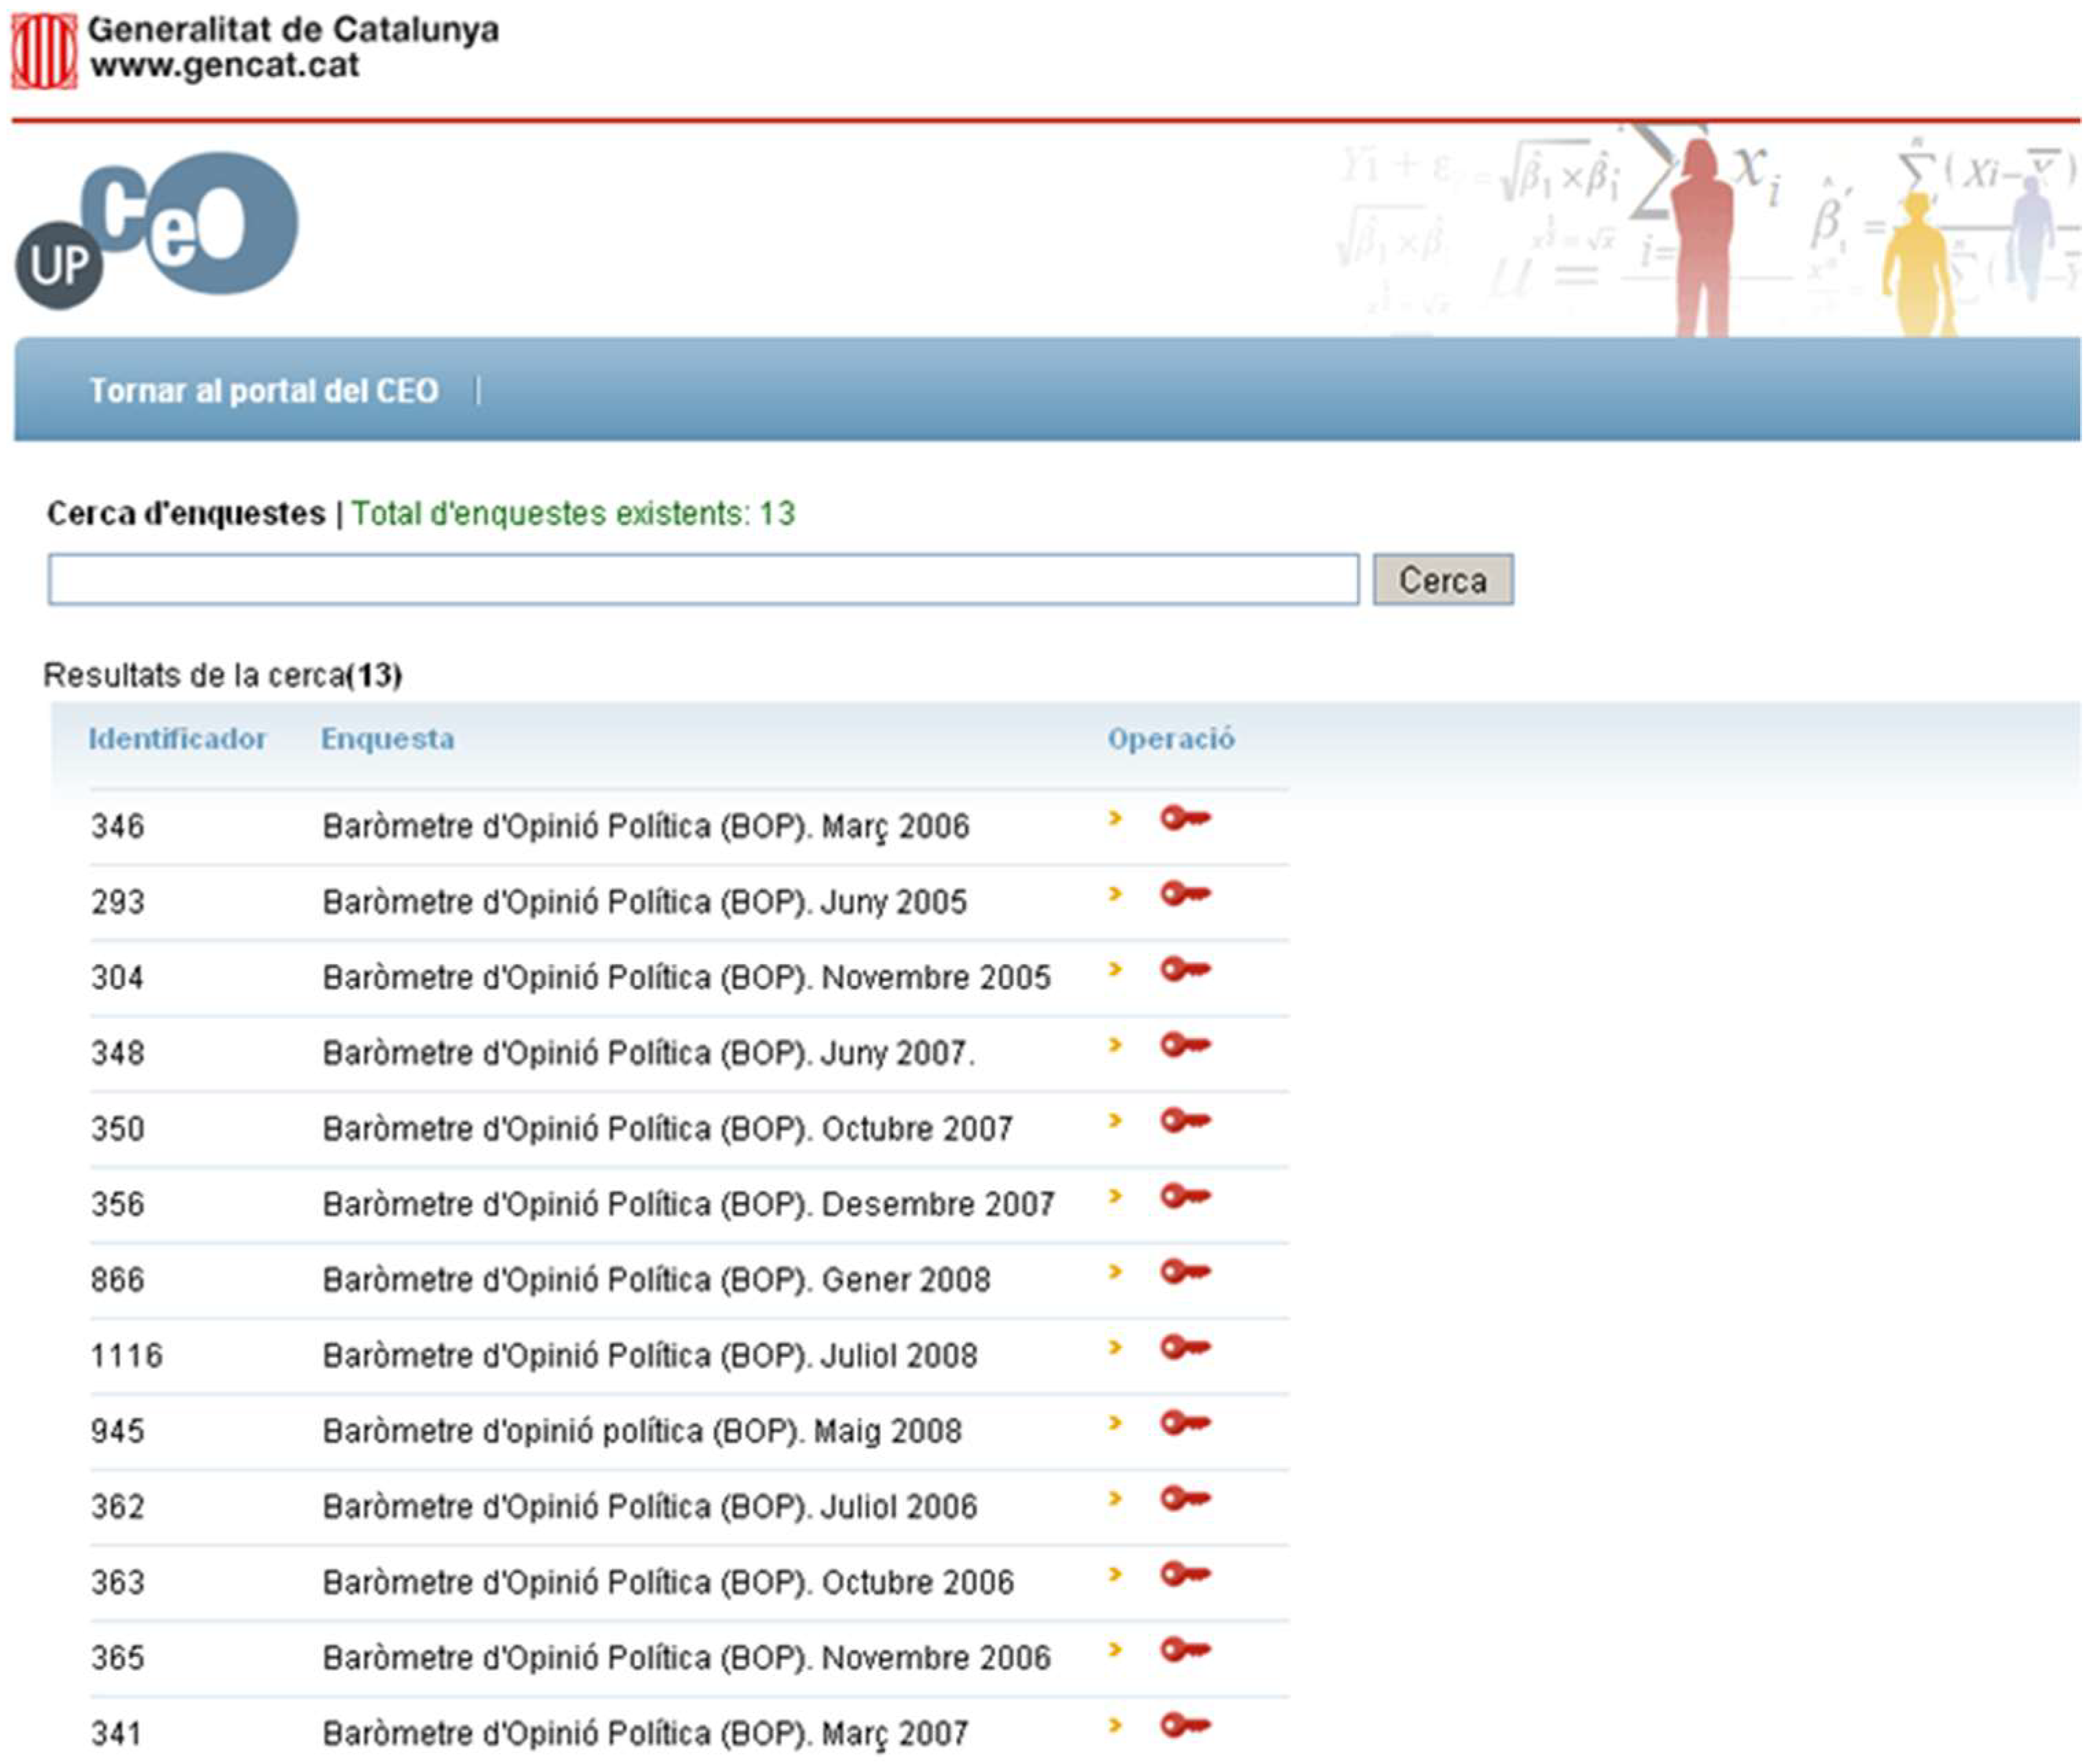
4.3. Examples of Use: Operations Manager
In this section, we show an example of the use of the application manager. First, the user must select the initial survey (matrix) to work with (see
Figure 10).
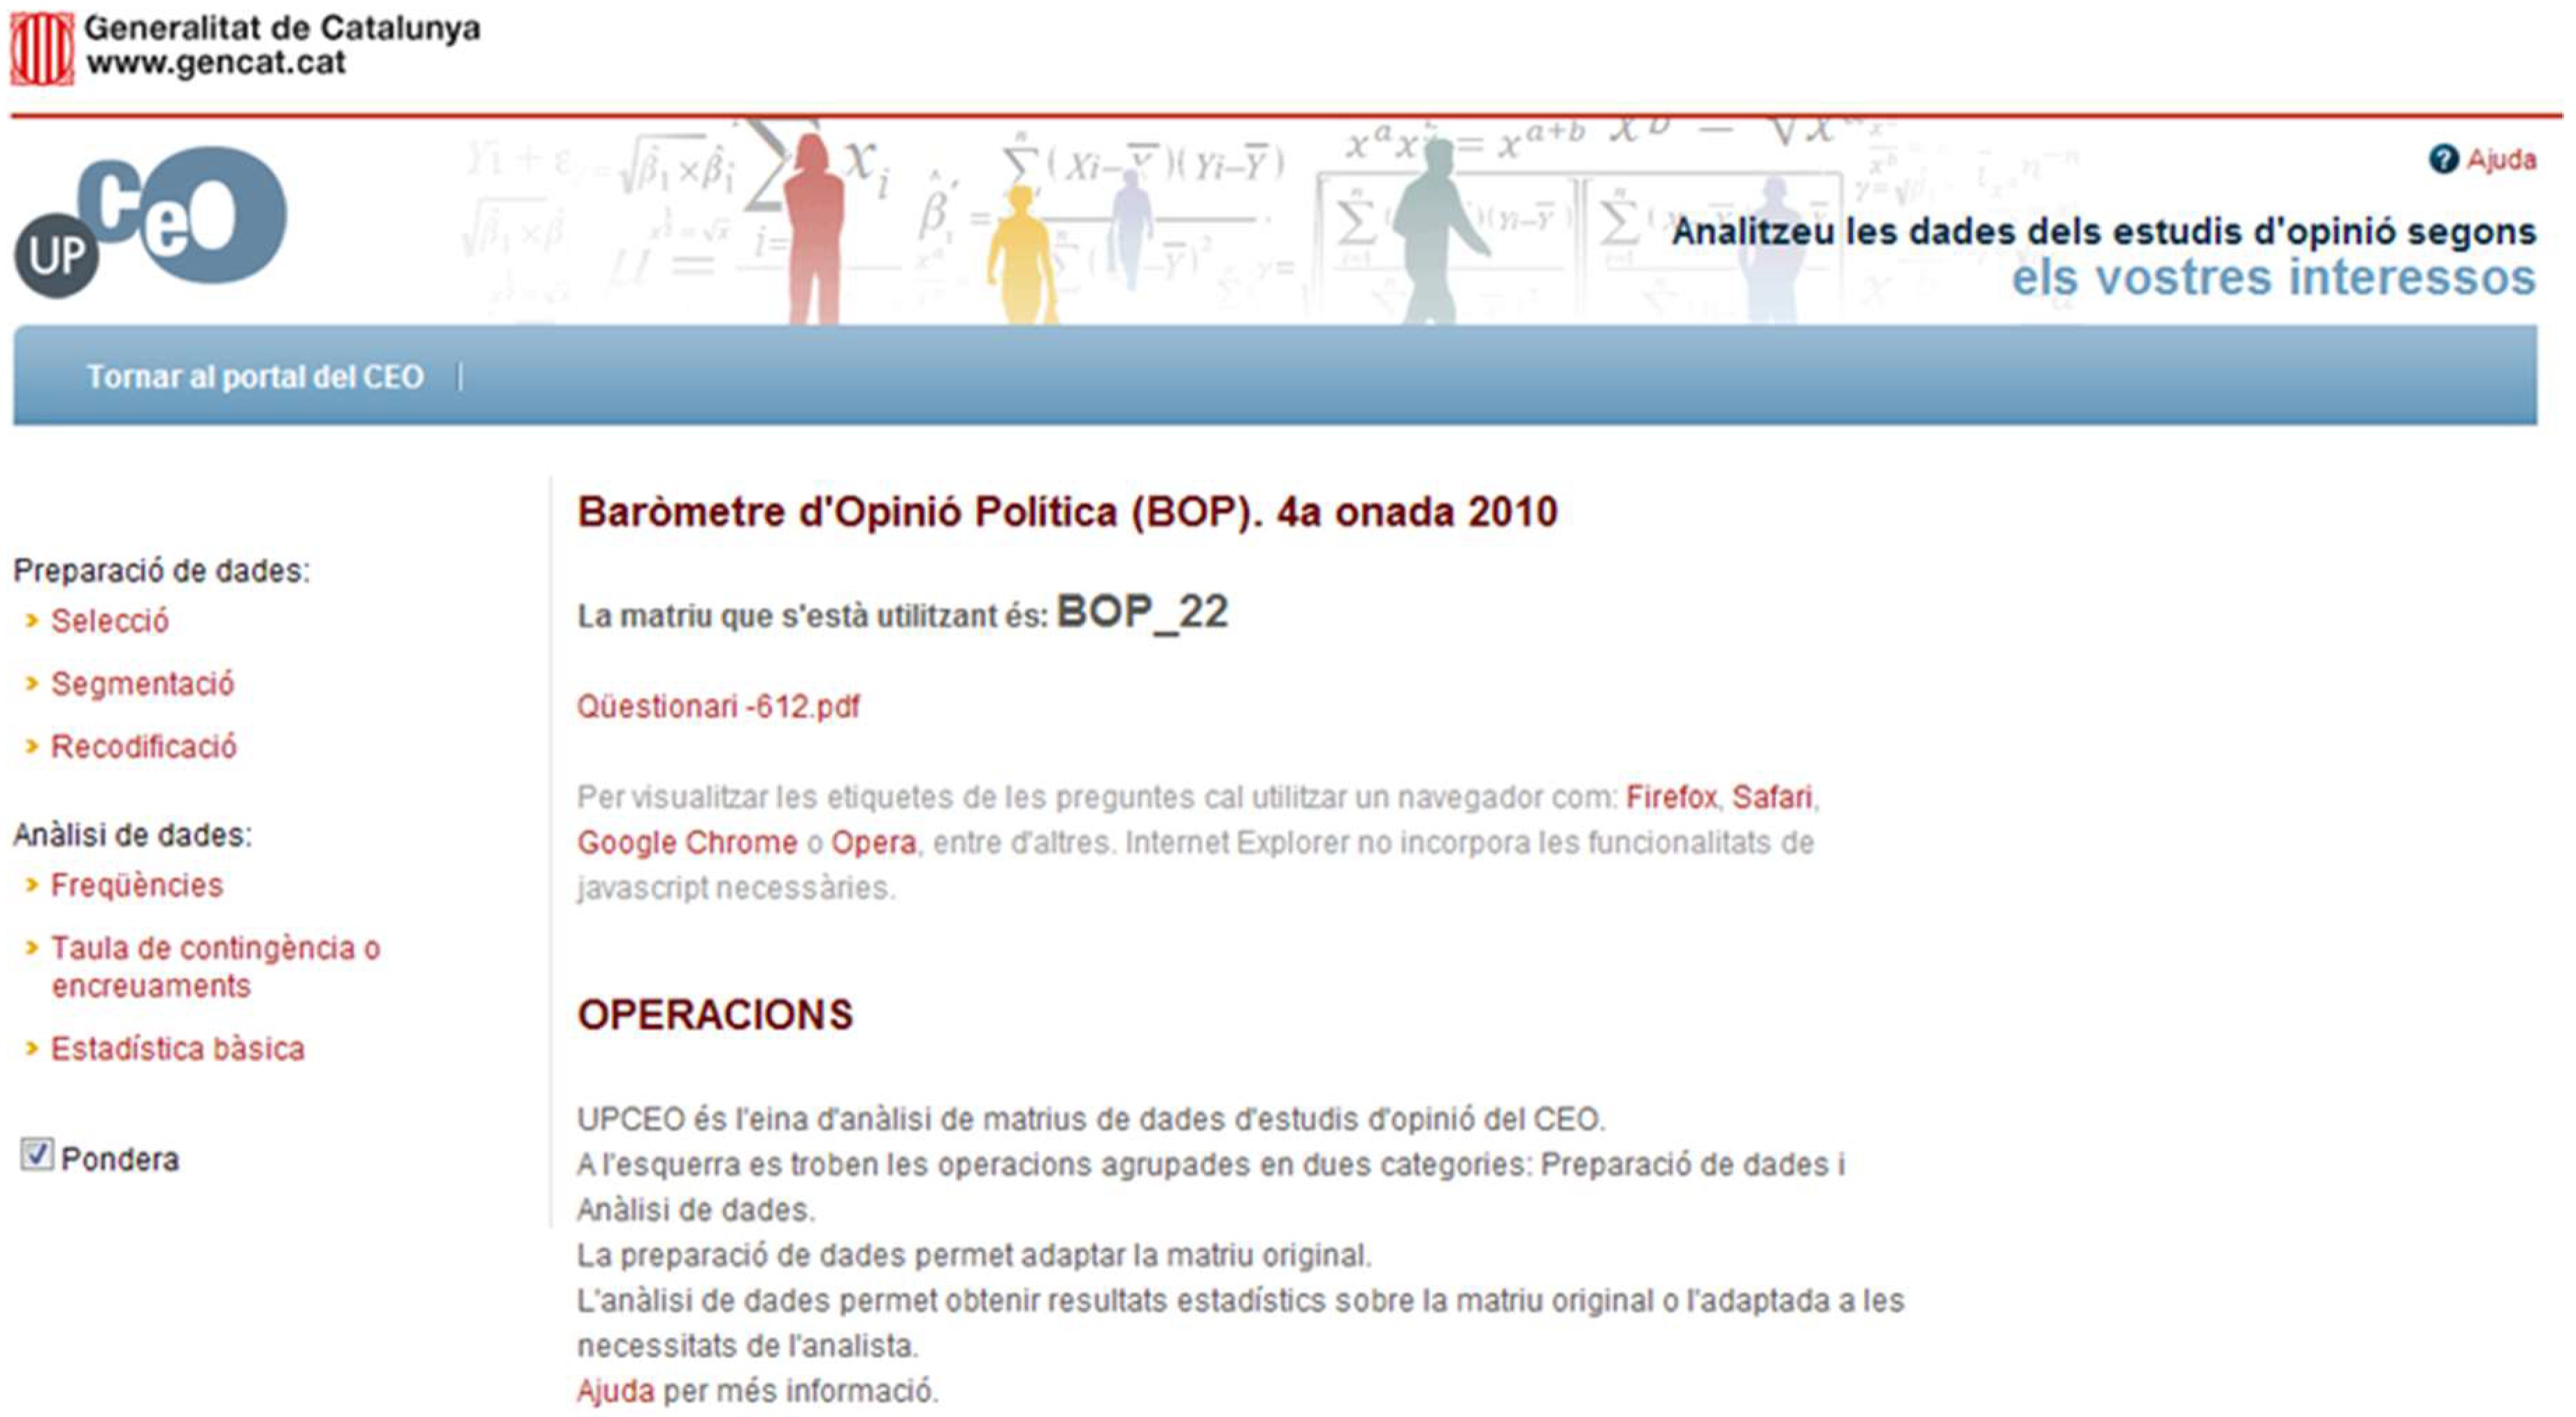
Once the user selects a study to be analyzed, a new window is shown. In this window, the basic information of the matrix is portrayed. A menu on the left side also shows the operations that can be applied to the matrix of data obtained from the survey.
Figure 11 presents this window. Each of the different operations is codified using R; therefore, the implementation of new and maybe more complex operations is simplified. On the one hand, the implementation of the operation is programmed using R code, and on the other hand, the output is formatted to make it visible over the web.
Each operation grouped under the label
Preparació de dades (data preparation) generates a new matrix of data that can be further analyzed (see
Figure 12).
The operations that can be performed in this case are as follows:
Selection (Selecció): this operation allows the selection of a subset of the matrix according to a specific condition;
Segmentation (Segmentació): this operation splits the matrix into two different matrices according to a specific condition;
Recodification (Recodificació): this operation modifies the variables of the matrix according to a rule.
In this first version of the website, only one preparation of the matrix can be done simultaneously, implying that all the preparations are always applied to the definitive matrix (see
Figure 2). Once one of these operations is performed, a new matrix will be created. The new matrix is presented in the drop-down menu and can be selected as a data source.
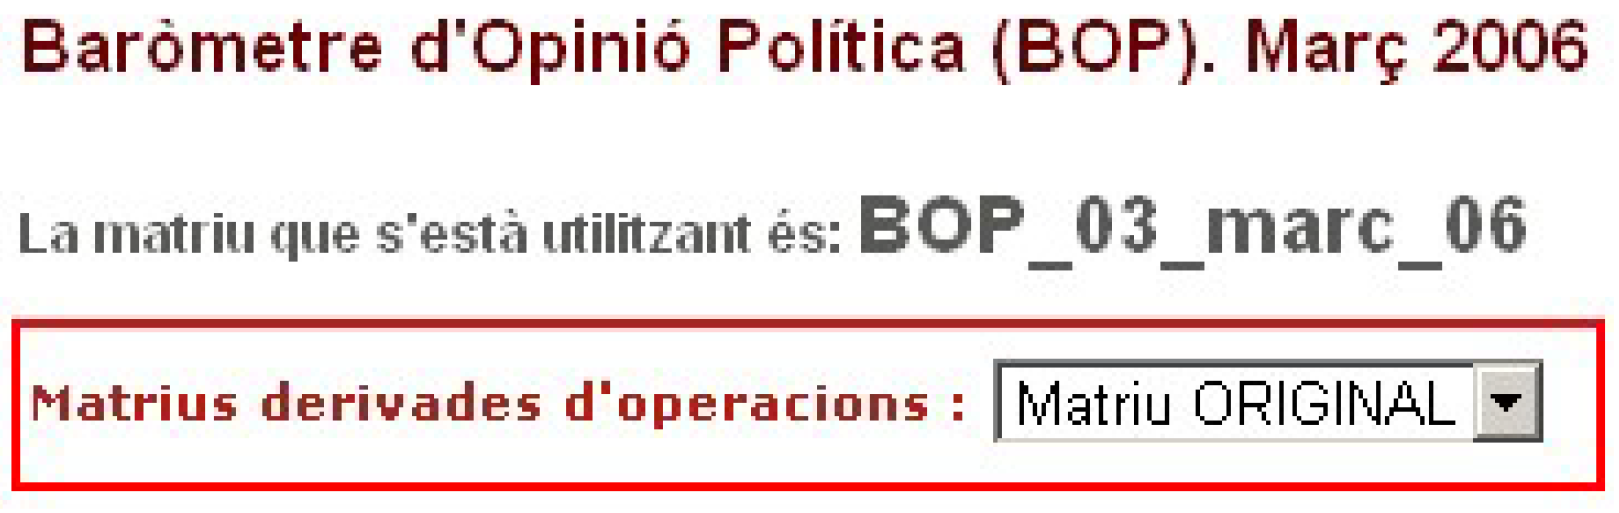
The weighting operation (
ponderación) emphasizes different values of some variables over others. Weighting is usually needed when there is a discrepancy in terms of proportionality between some magnitudes in the population and their corresponding correlates in the sample. This discrepancy can obey a deliberate design decision or be the consequence of fieldwork complications such as non-response bias. To work with weights, the user must select a check box that appears on the foot of all operations (see
Figure 13 and
Figure 14 or
Figure 15). The weighting values are defined by the CEO analysts on the original matrices (in a column in the original SPSS
® matrix), becoming an element that can be used by a non-expert user in a transparent way. Next, we describe examples of some of the operations implemented (selection, basic statistics operation, and contingency tables).
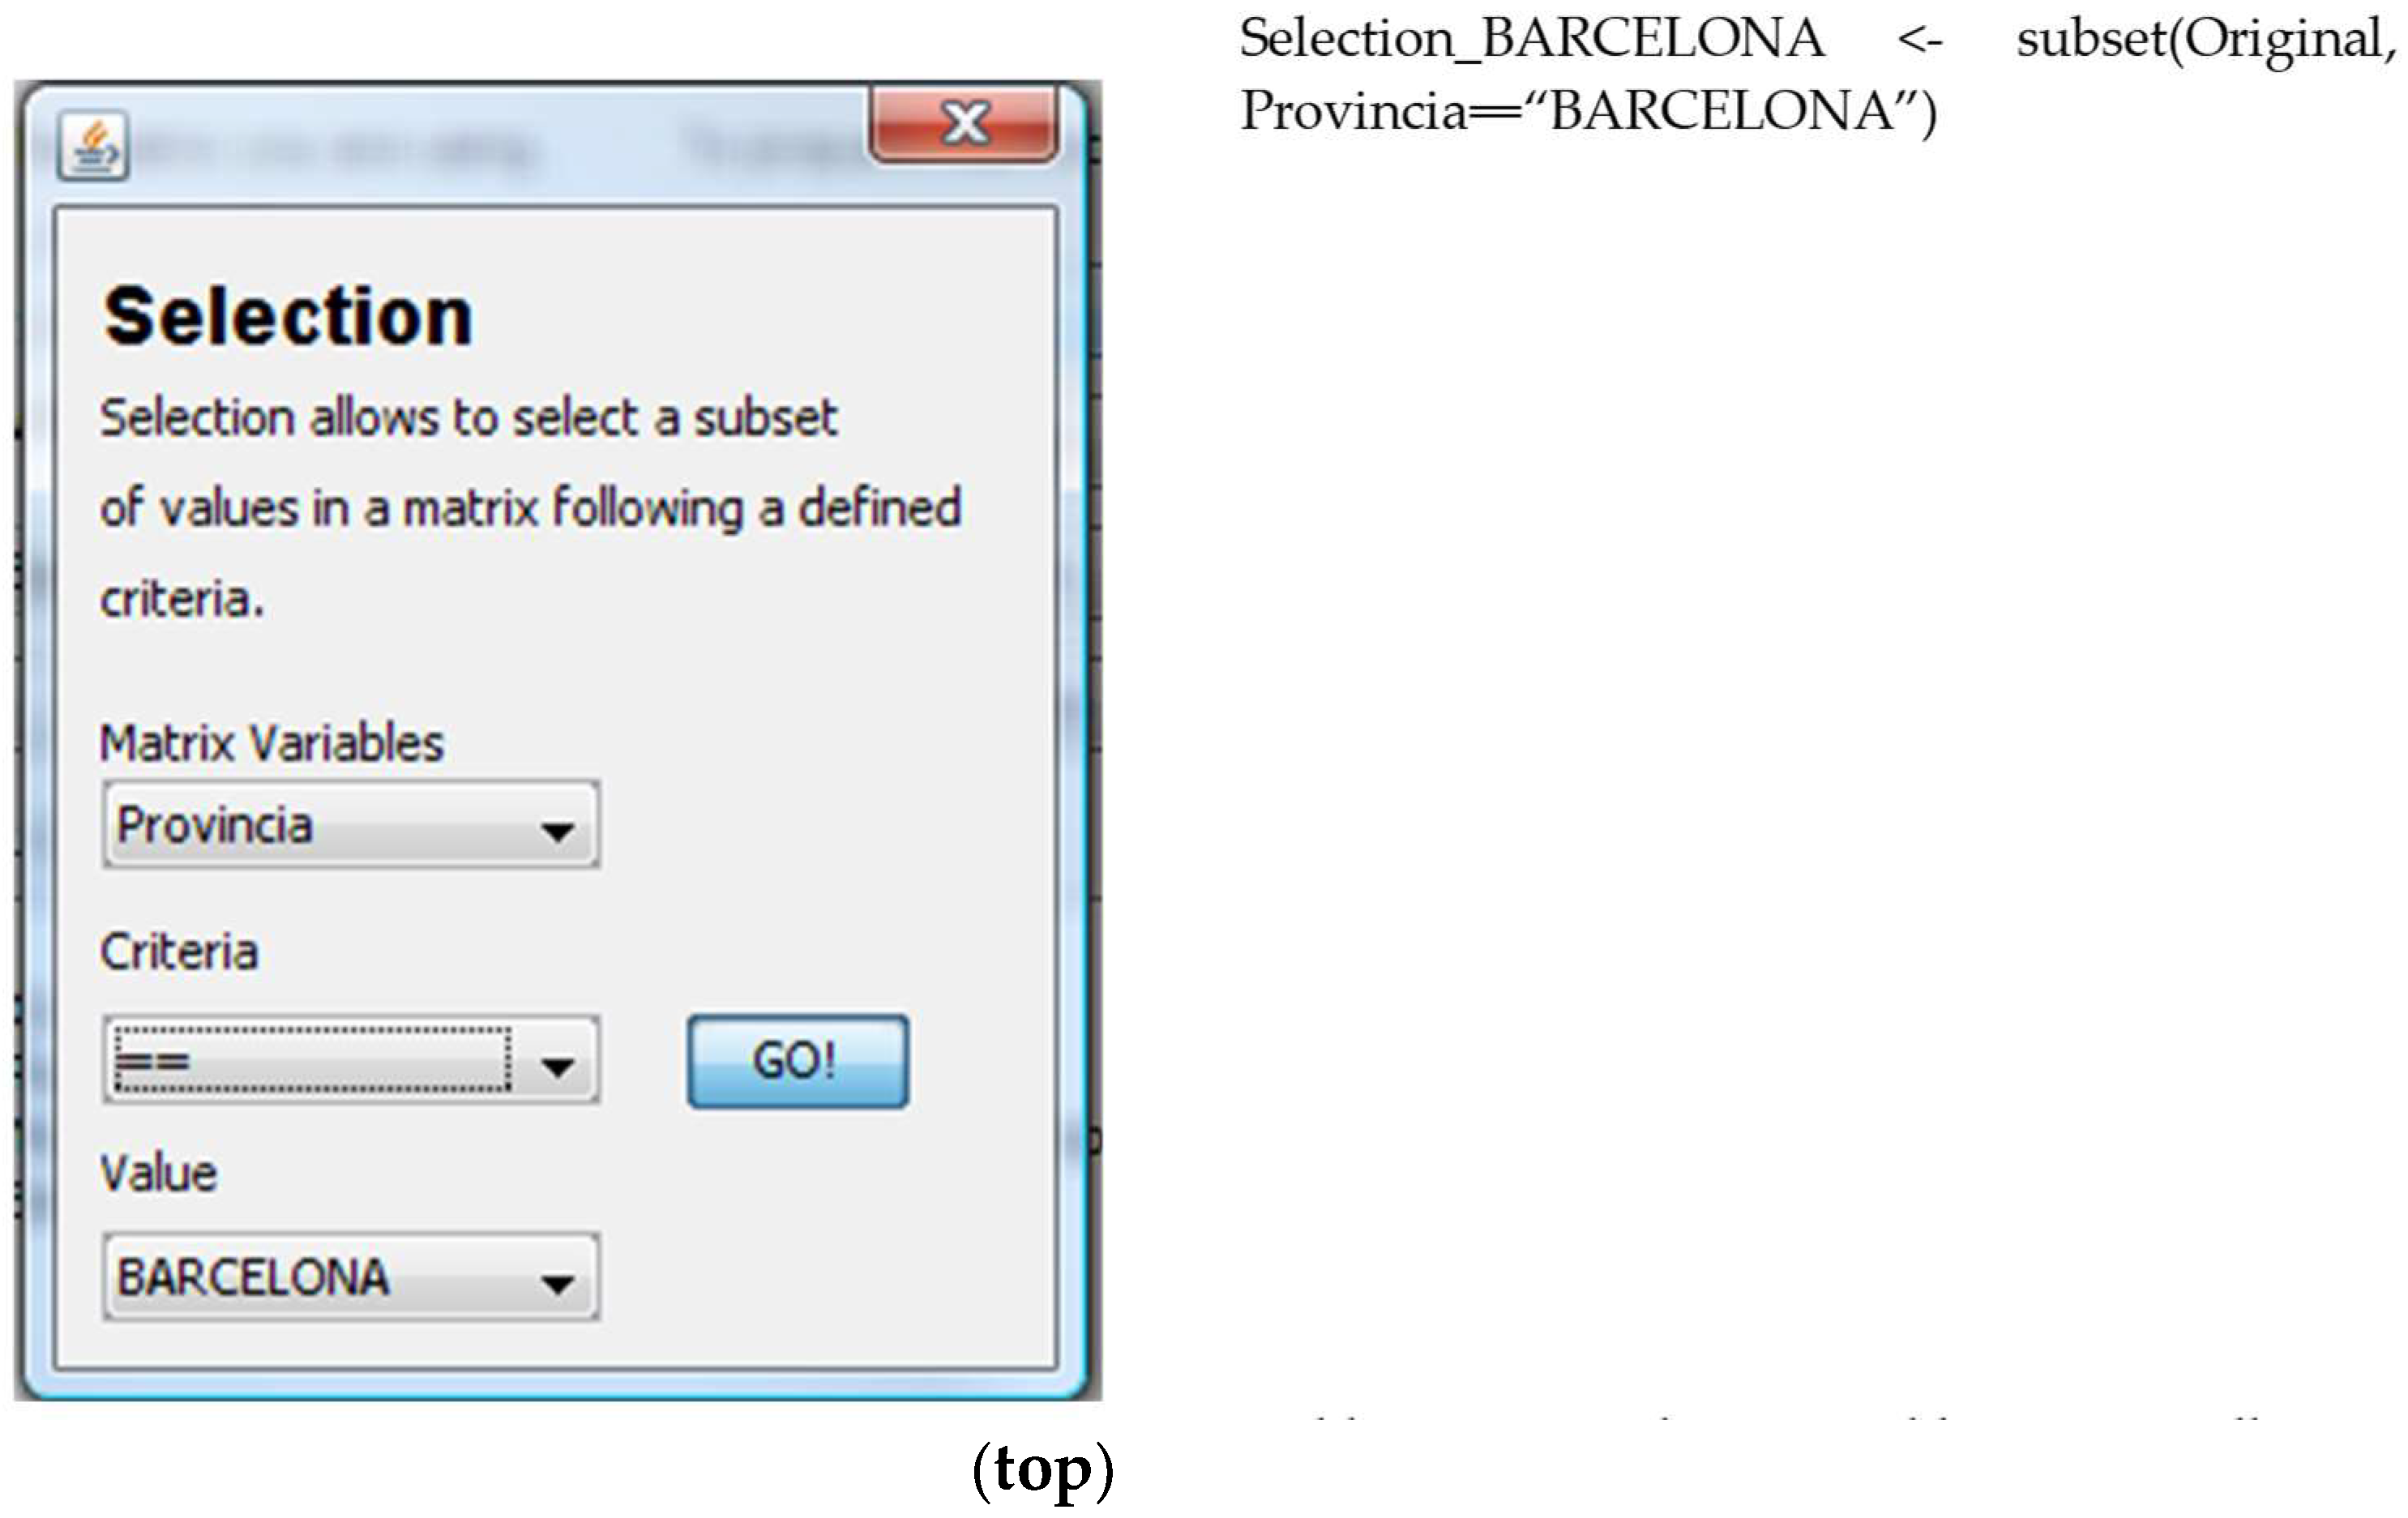
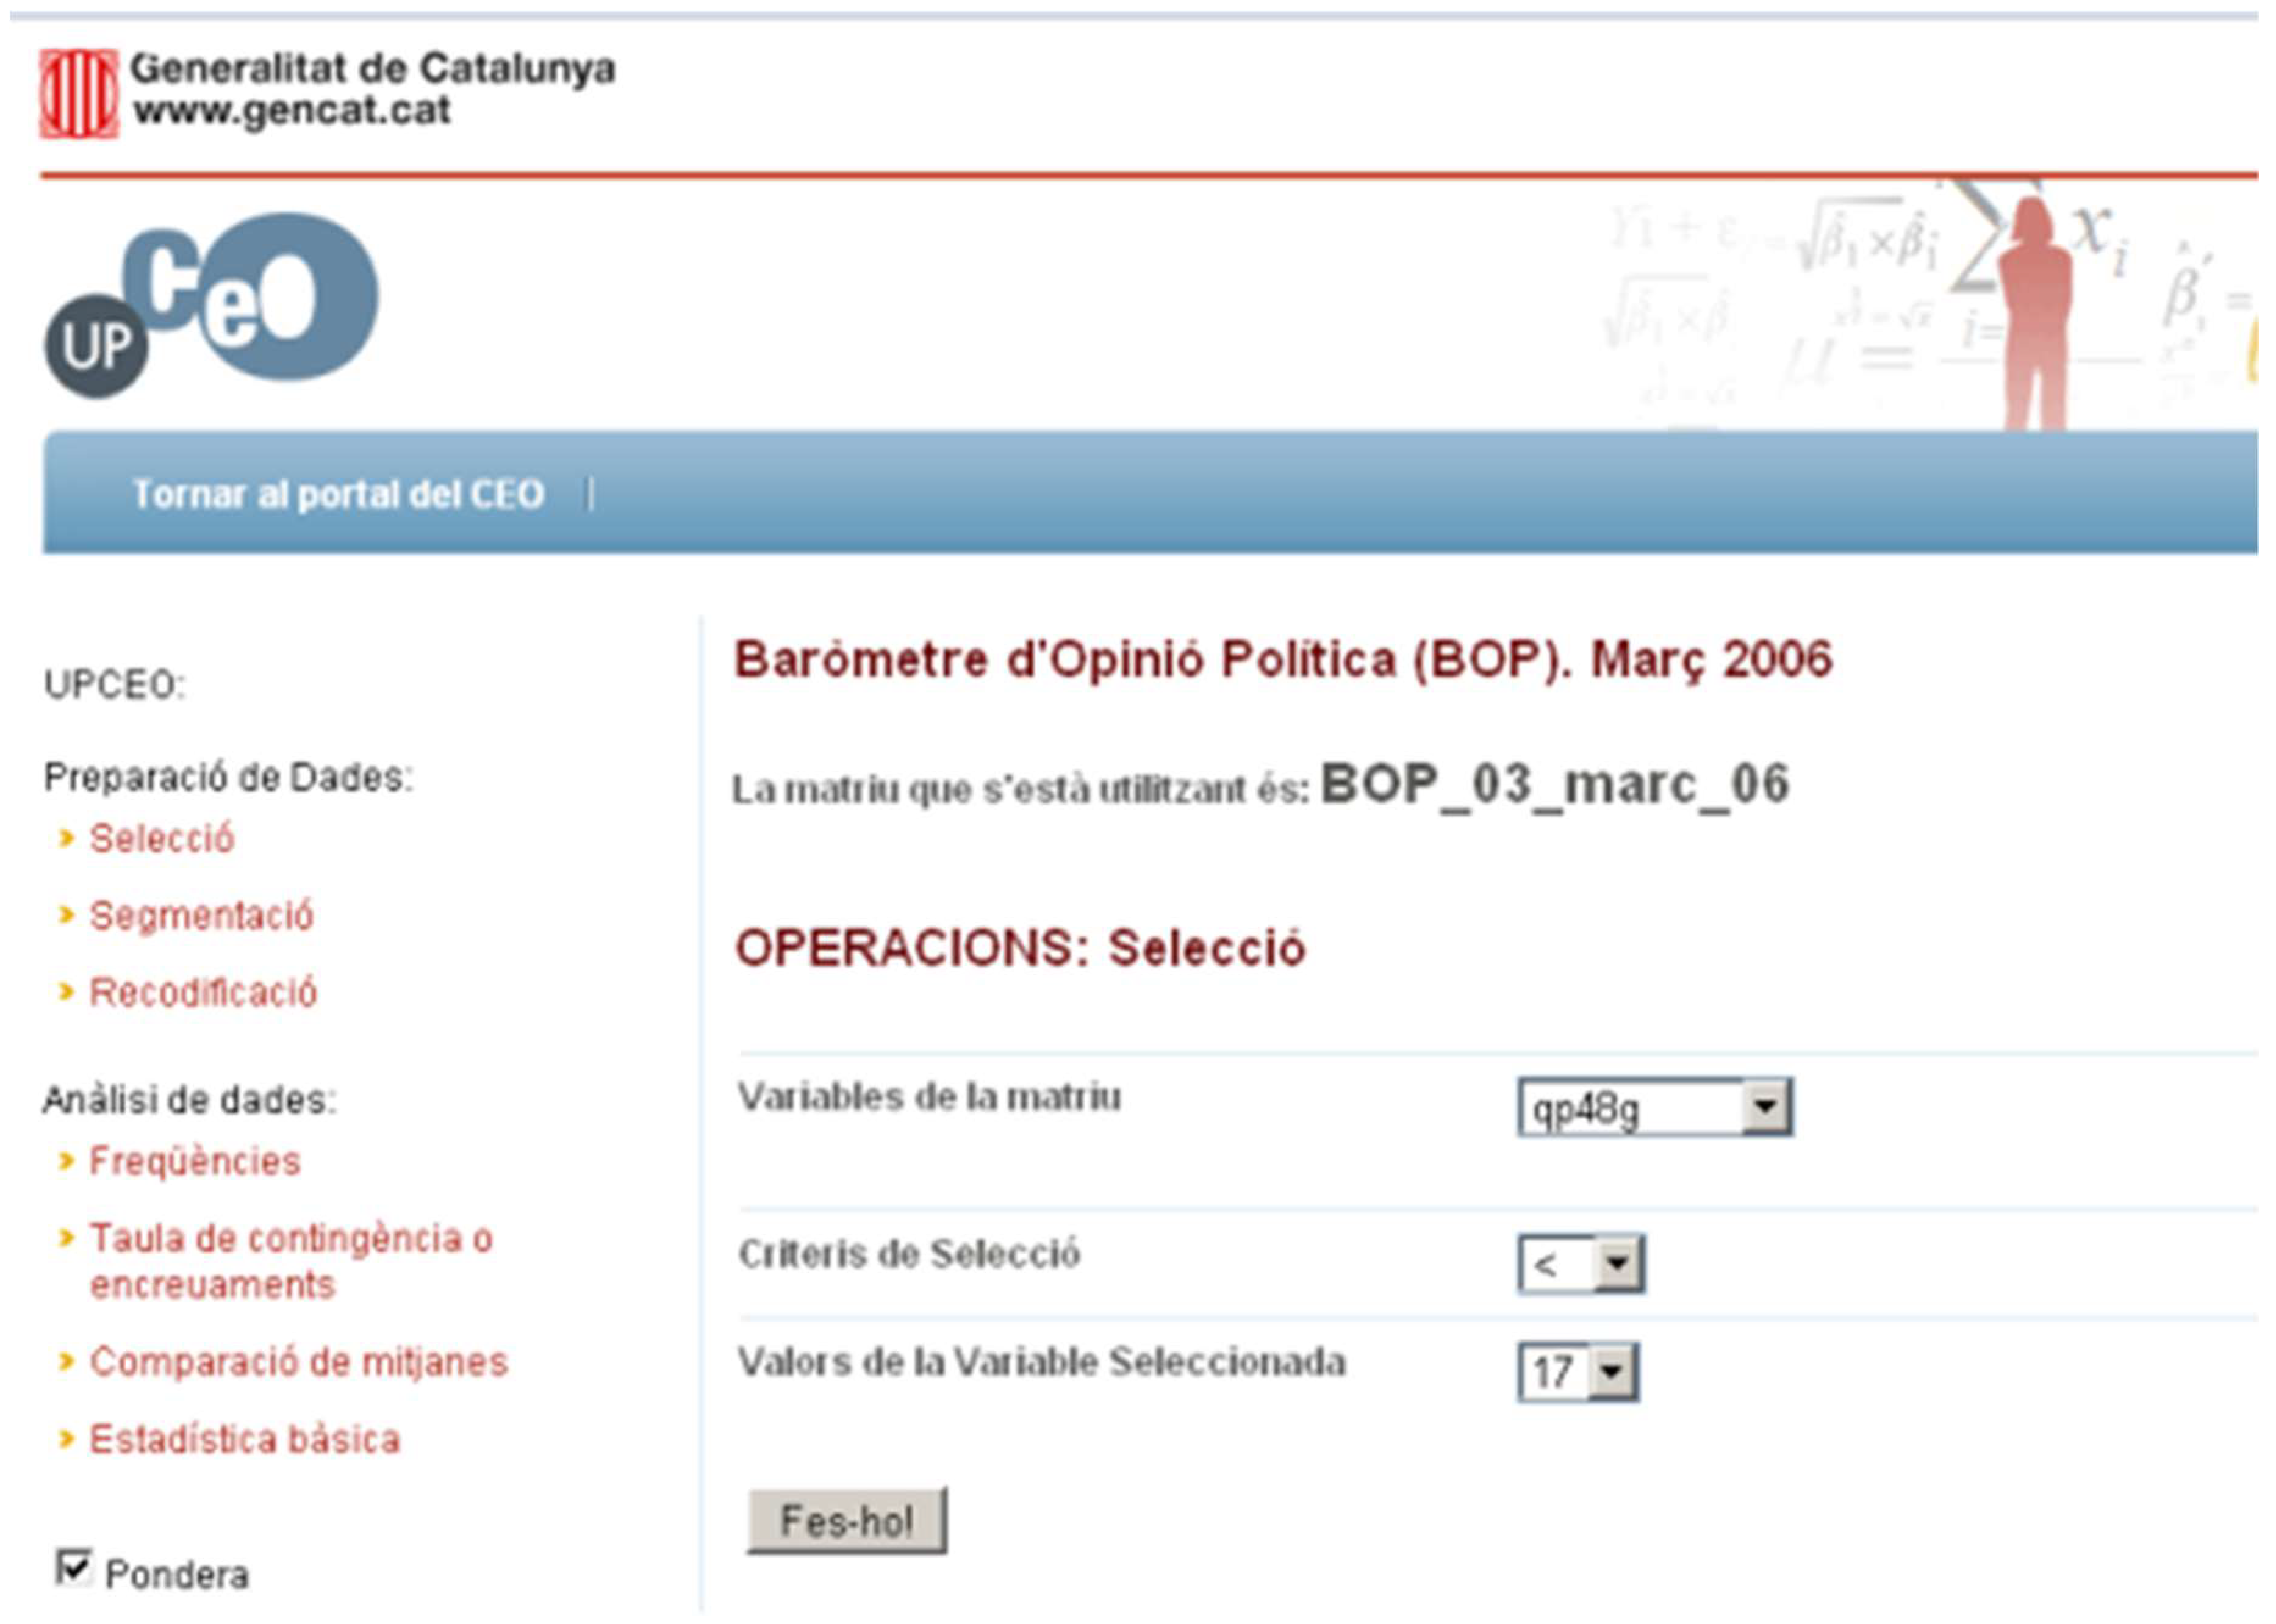
4.3.1. Selection
Selection chooses a subset of the data stored in a matrix (see
Figure 13). The process that a user must follow to perform the operation is (i) the user selects the matrix to carry out the operation; (ii) the user selects the variable to execute the selection; (iii) the user defines the new values for the new variable; and (iv) the system adds the new variable to a new matrix at the drop-down menu. The result of the operation is stored in a new matrix that has the name Selection_<variable>. Now, we can perform operations with this newly created matrix, so that the statistical analyses the user will carry out from this point onwards will only be performed in the subset of selected cases.
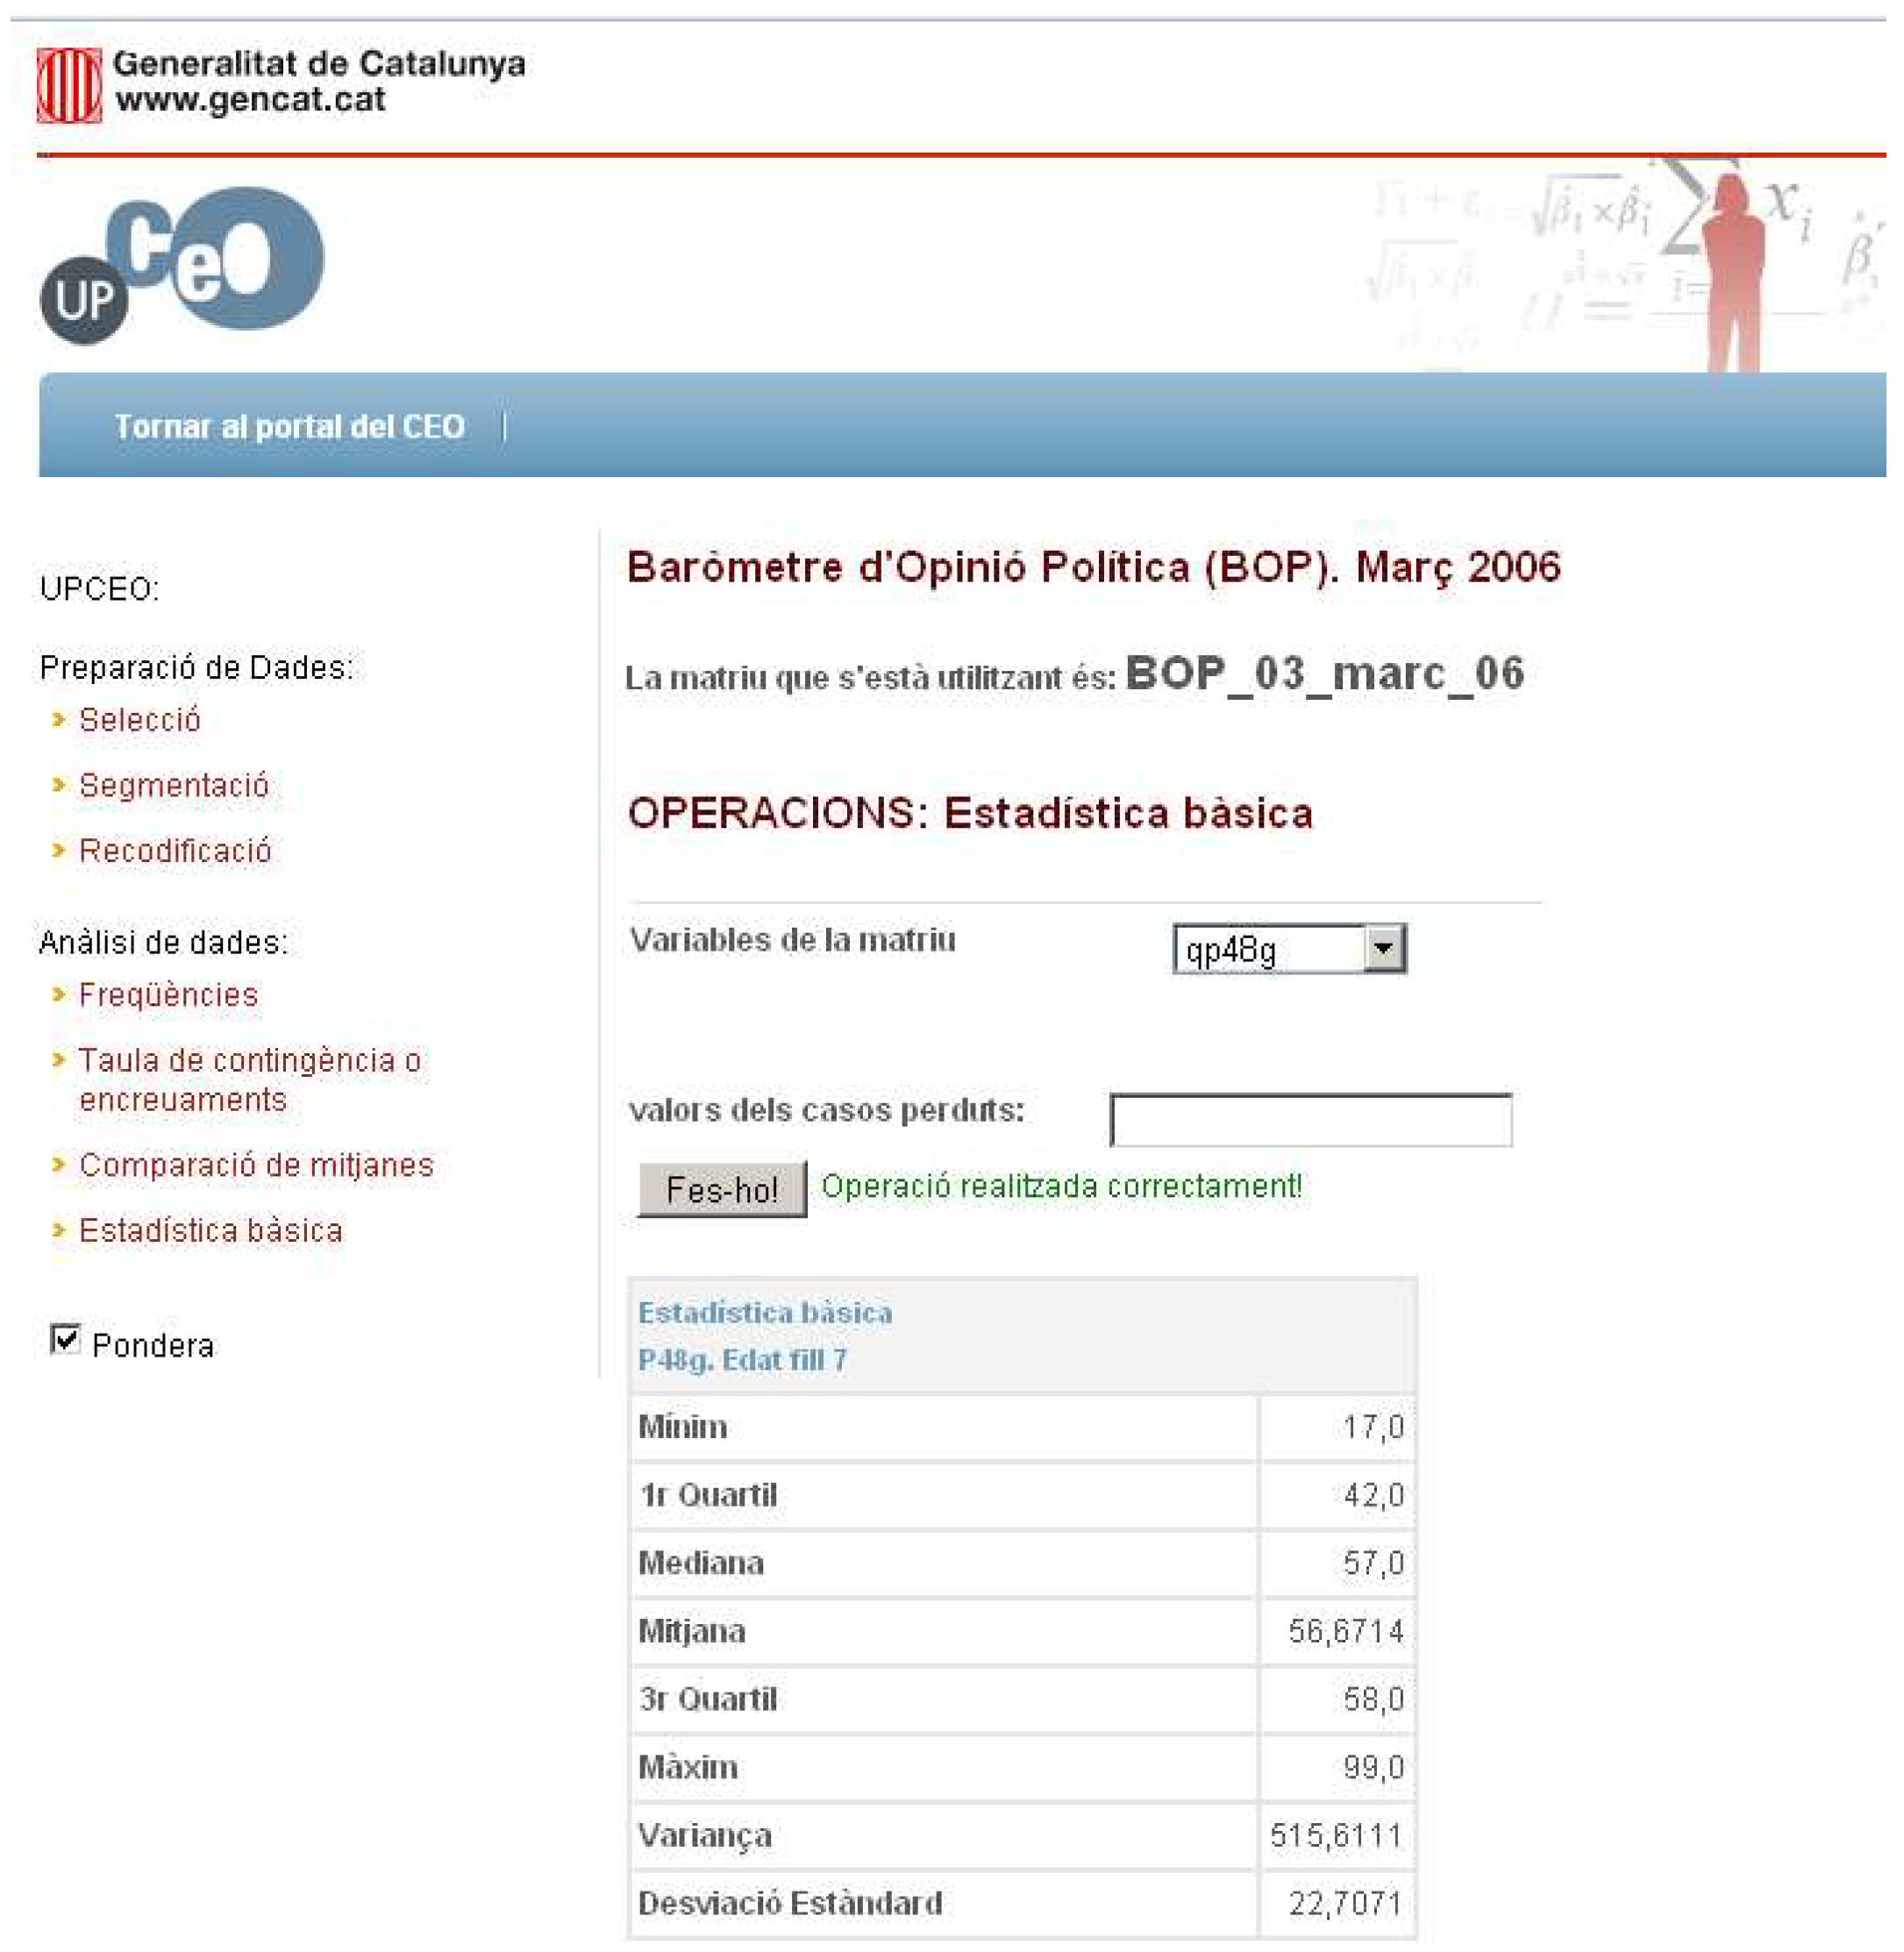
4.3.2. Basic Statistics
We can obtain a basic univariate statistical analysis over an UPCEO matrix. The process is that (i) the user chooses the matrix to be used to perform the operation (optional, the default is the original matrix); (ii) the user selects the variables on which to perform the statistical operation, which is a descriptive statistical analysis; and (iii) the system shows the result of the operation in the window (see
Figure 14).
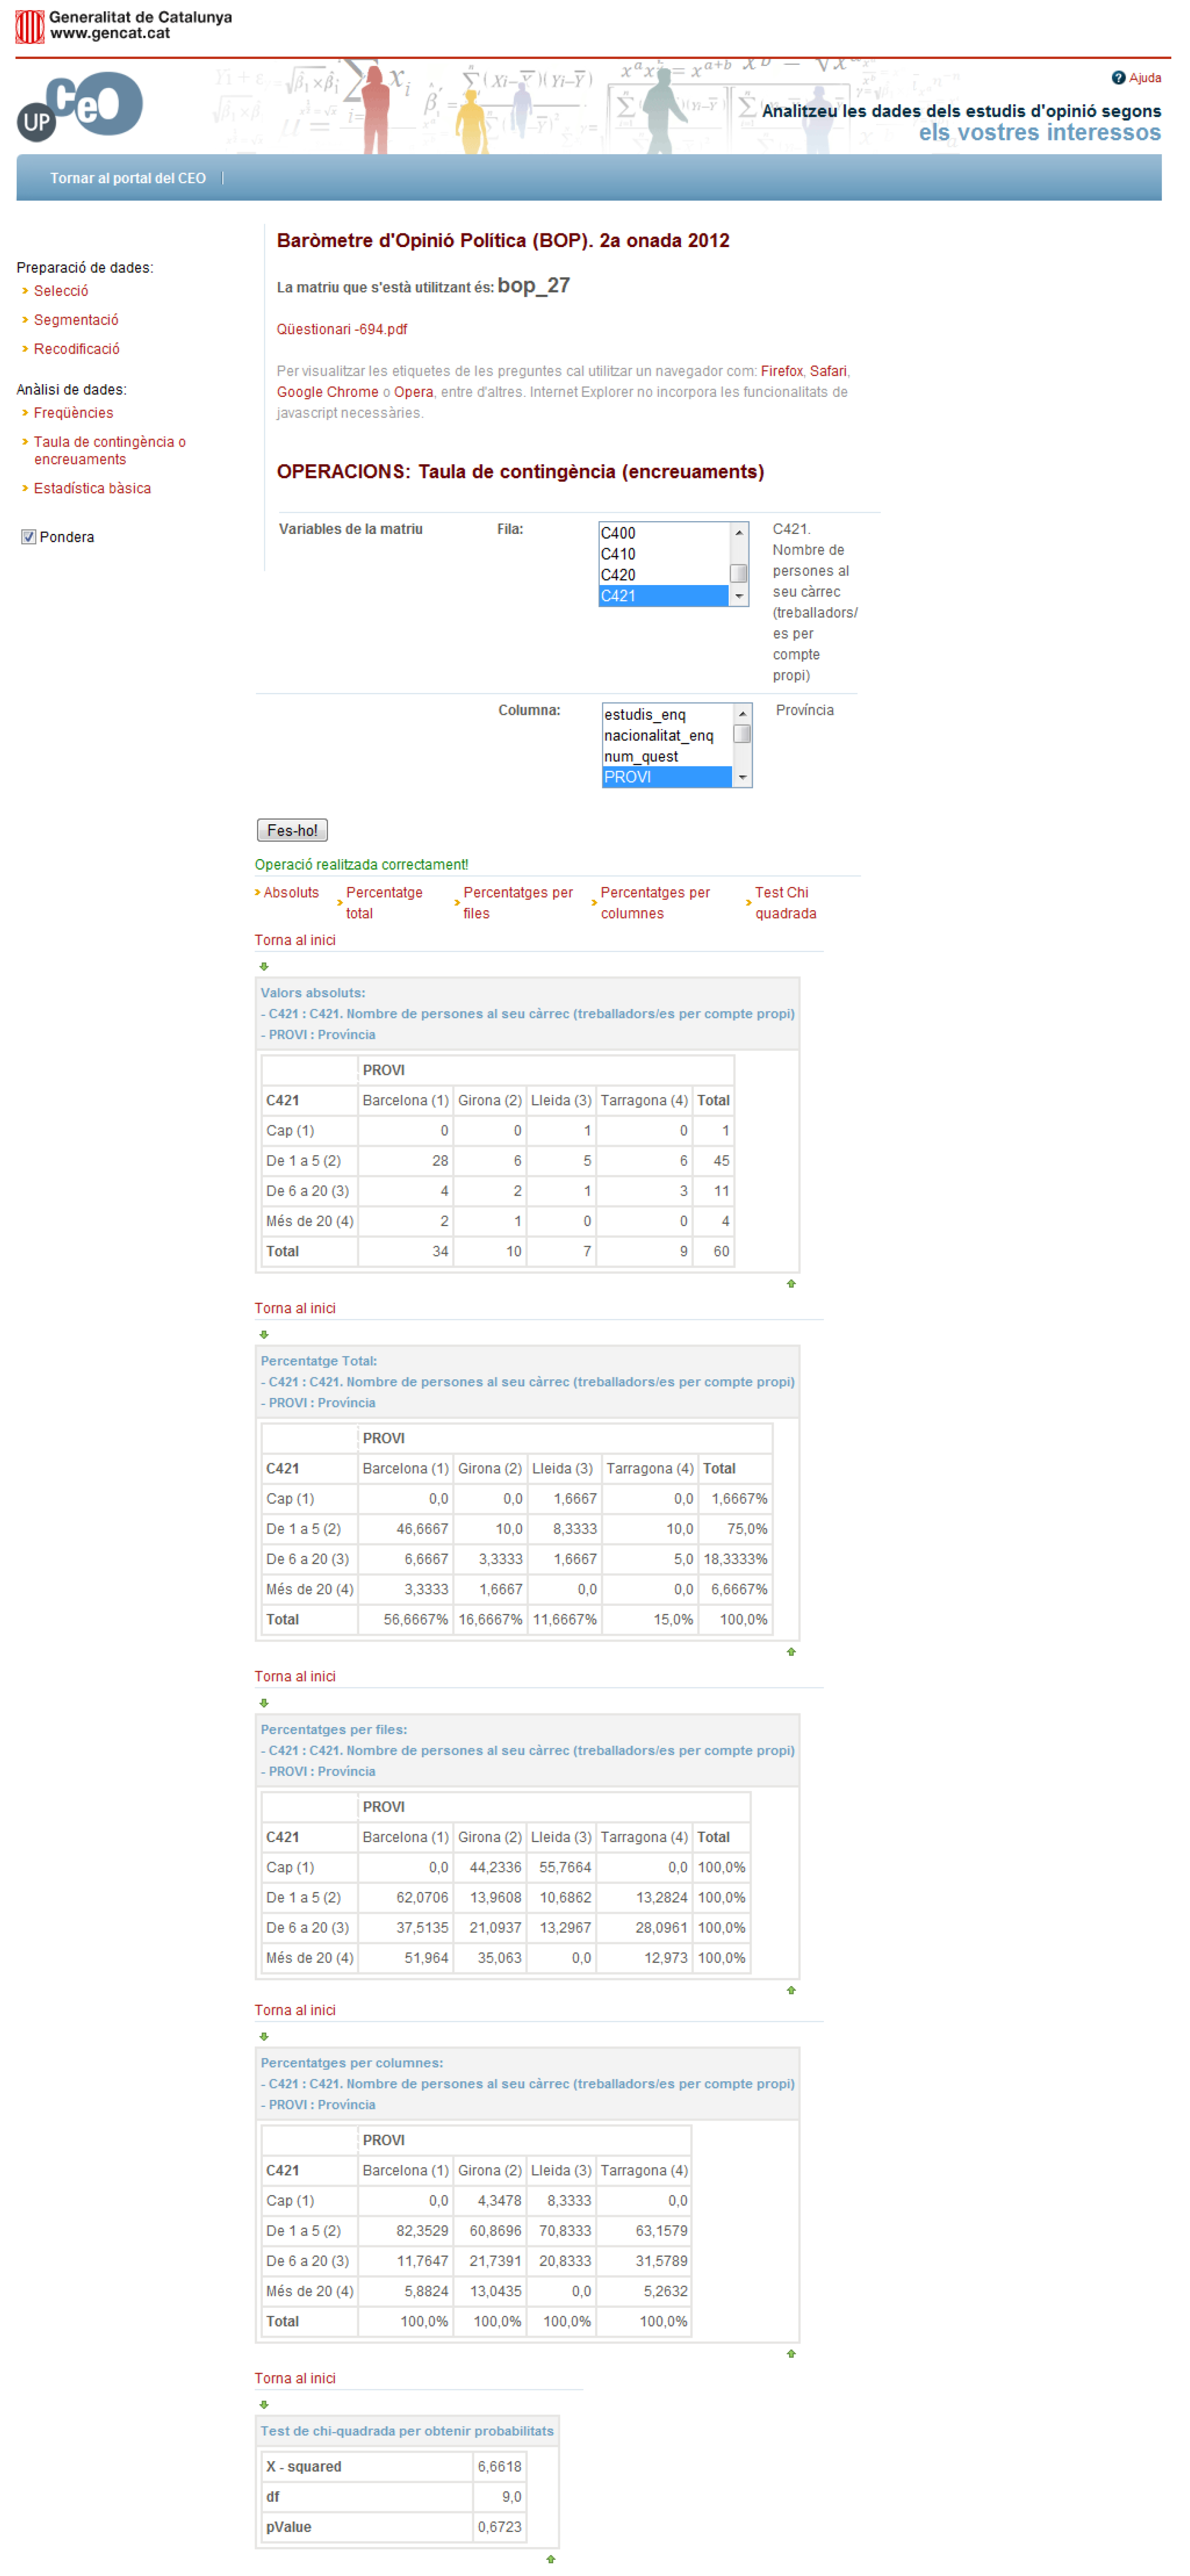
4.3.3. Contingency Table
This operation allows the user to analyze the relation between two or more categorical variables: a bivariate analysis. The process is that (i) the user selects the matrix to be used; (ii) the user selects the variables to be used; and (iii) the system shows the detailed information regarding the contingency table requested using five related sub-tables: the first one presents the number of cases in each cell of the contingency table, the three next tables show the three types of cell percentages that can be calculated (total, row, and column percentages), and the last table indicates the chi-square value, the degrees of freedom and the associated
p-value (see
Figure 15).
5. Concluding Remarks
This study develops a novel approach to present statistical information over the web following the open-data philosophy. In this approach, the R statistical package is a key element to manage and display the information, allowing the user to perform a number of basic statistical operations with the data. In future applications of the product, the system could be easily extended to perform more advanced data analysis techniques for the study of survey responses. To do so would simply imply adding new R libraries.
From the point of view of data management, the structure of the surveys, the structure that relates the questionnaires and the questions and the related matrix that contains the data often follow different formats in an actual environment. This is true even if a single team manages the information, because technology changes and the tools used can be diverse, depending on the objectives of the specific work. This ecosystem of data formats often makes working with the data more difficult. Thus, mechanisms are necessary to translate the information from one format to another. Often, these mechanisms are prone to errors and require the use of tools that are usually not well-known by all of the members of the team. In this approach, R is the bridge between the various formats that are stored in the database and is also the language used to recover and work with the information contained in the system. Thus, the CEO analysts store the information in the system using the format they are familiar with, and the system is able, using R, to work with the data and to formulate new matrices of data that can be used again by experts applying the common statistical tools.
We implemented a Cloud solution to simplify UPCEO management and scalability. The flow of access of the external users depends on several factors; e.g., when a new study is offered to the public. This implies that, at times, the traffic to the site is heavy, an aspect that can become a problem for the servers and site management. The Cloud solution proposed stores all the information obtained from the CEO studies, allowing 24/7 access to all the information by all the users, and making it possible, conditional on the users’ roles, to deal with the data and create new information (statistical output) and matrices. Working with the data is accomplished using R as a statistical engine; a user can execute queries and obtain new information regarding the matrices of data related to a survey. Additionally, as all the operations implemented use R syntax, adding new operations is easy and only requires the addition of a new R code and the definition of a new interface. Thus, systems based on this approach are extremely scalable and expandable.
Since the access to the statistical information is based on the R language, new websites or applications (such as JGUIforR) can be developed that access the data through the use of R statements. This implies that the application goes beyond the definition of an API because it uses a statistical language. The power and extensibility of R ensures that we can obtain all the information desired, and the user must only define the subset (if it is needed) of the R instructions that an external user (application or website) can execute. Currently, researchers from different Catalan institutions are building their own mash-ups using this type of application. In the future, more capabilities will be added to the application by including new R language instructions open to public use. There is an additional goal of open access to the data generated by public institutions, allowing them to access all the information from the CEO servers and define the queries needed for each application (in the broad sense that an application can be a simple query that can reside in a spreadsheet, or a complete web application with various mash-ups).
Last but not least, a set of operations can be defined as an R script. This definition implies that repetitive operations can be performed with fewer errors and in less time.


