1. Introduction
The survival of the fittest firms related to changes in the business environment caused by exogenous shocks, such as recessions and natural disasters, can be explained using economic Darwinism (see, e.g.,
Nishimura et al. 2005). The natural selection mechanism of Darwinism leads to efficient resource allocation: firms with low performance are forced out of the market while productive firms survive. In other words, exogenous shocks can create ‘cleansing effects’ as shocks clean out unproductive firms so that available resources are allocated to the remaining more productive firms (see
Caballero and Hammour 1994). However, the shocks may also force out young firms that have the potential to be highly productive in the future, which will lower the average productivity of industry. This is known as the ‘scarring effect of shocks’ (
Ouyang 2009). Therefore, the overall impact of exogenous shocks on the allocation of resources depends on the relative magnitude of cleansing and scarring effects.
This paper investigates whether the natural selection mechanism worked after the Yogyakarta earthquake in 2006, specifically in the manufacturing sector in the province of Yogyakarta. There are three main reasons that specifically motivate this study.
First, a study on the survival of firms after the earthquake is important for understanding regional economic resilience. As
Rose (
2017) argues, disasters can threaten the performance of regional economies since they tend to directly affect the regional level (see also
Martin 2012;
Martin and Sunley 2015). Meanwhile,
Okuyama (
2017) indicates that the analysis of disaster impacts must focus on the regional level since the economic impacts of disasters can become quite substantial both in their intensity and extent at this level. Also, firm-level data allow the detection of how local conditions interact with shocks (
Barone and Mocetti 2014). Therefore, our study contributes to this empirical literature on the impact of natural disasters on firm survival, specifically in developing countries.
Second, the Yogyakarta earthquake in 2006 was one of the largest natural disasters in recent Indonesian history and was one of the costliest natural disasters in the developing world. This earthquake occurred on 27 May 2006 at 05:52 local time with its epicenter in the Indian Ocean at about 33 kilometers south of the Bantul district in the Yogyakarta province, Indonesia (
Bappenas 2006). It affected five districts in the Yogyakarta province and six districts in the Central Java province and killed more than 5700 people and damaged thousands of houses (see
Table 1). This earthquake caused damage and losses of Rp 29.1 trillion (US
$3.1 billion) or 41% of regional GDP (see
Gunawan and Mahul 2011) Based on the gross regional domestic product (GRDP), manufacturing was one of the most affected sectors in the Yogyakarta province and its growth rate in 2009 was still lower than the growth rate in 2005 (
Table 2).
Third, the impact of the 2006 earthquake on firms in the affected districts is still rarely studied. The only study is
Resosudarmo et al. (
2012) and it focuses on the determinants of the recovery of small and medium-sized enterprises, and in particular on the role of aid in the recovery process after the earthquake. Using a panel firm-level survey in the Bantul District, they found that smaller enterprises were more resilient and were able to recover faster. Furthermore, affected firms were usually able to compete effectively with firms not affected by the earthquake, but only when there was no mistargeting of aid delivery (i.e., unaffected firms do not receive aid). Another study is
Parinduri (
2014), which focusses on the impact of family hardships, including natural disasters, on the growth of micro and small firms, in terms of assets, by using the 2000 Indonesia Family Life Survey (IFLS). This study finds that hardship slows down the growth of firms or reduces their assets. If firms, as a result, cannot cope with naturally occurring shocks, their likelihood to survive will decrease. This suggests a scope for public policy to help firms that are facing severe family hardship.
In this study we use data on medium-sized and large manufacturing firms collected by the Indonesian Statistical Agency (BPS). These firm level data have also been used in a few studies on the impact of the East Asian economic crisis on the Indonesian manufacturing sector (
Hallward-Driemeier and Rijkers 2013;
Poczter et al. 2014;
Narjoko 2014). The main finding of this paper is that firms with a higher productivity prior to the earthquake in 2006 were more likely to survive after the earthquake, which suggests the existence of a natural selection mechanism, specifically a cleansing effect. We do not find evidence of the scarring effects of the earthquake on new entrants.
2. Literature Review
Focusing on local firm behavior after a natural shock is important since the effects of natural disasters are typically geographically concentrated (
Barone and Mocetti 2014) and quite significant in terms of their intensity and extent (
Okuyama 2017). This is in line with
Rose (
2017), who argues that the resilience of regional economies can be threatened by shocks. Rose also points out that spatial considerations have important implications for resilience and disaster recovery, including changes in a firm’s activity levels. During a shock, like a recession, economic resilience may also be determined by how firms resolve their dilemma to reduce short-term cost and expenditure while managing their productive capacity (
Martin and Sunley 2015). The firms’ choice of strategies will affect both their survival and their ability to respond to recovery.
Basically, according to the concept of natural selection embedded in ‘economic Darwinism’, exogenous shocks will force out inefficient firms and free up available resources for the remaining more productive ones, improving the efficiency of resource allocation (see, e.g.,
Nishimura et al. 2005). Unproductive firms are more vulnerable to negative external shocks since shocks can decrease the firms’ performance below a critical threshold that is known as ‘the destruction threshold’ (see
Barlevy 2002). Once their productivity is below the threshold, firms are forced out of the market. In contrast, surviving firms will be more productive compared with their pre-shock performance, while new and efficient firms will enter the market so long as shocks do not significantly reduce the market demand. Potential entrants may choose to enter an industry since competition in the direct aftermath of the shock is relatively weak (see
Caballero and Hammour 1994). The new entrants may play an important role because they are usually expected to have new technology, as explained by the traditional vintage models of technological change (
Dwyer 1998; see also
De Groot et al. 2004 for the development of a vintage model in the context of endogenous growth theory).Therefore, natural selection processes that are similar to the cleansing effects based on Schumpeterian creative destruction (see
Caballero and Hammour 1994) will improve aggregate industry productivity.
In contrast,
Barlevy (
2002) mentions that, while economic shocks like recessions can accelerate the destruction of unproductive firms, they can also repress the most efficient firms. This implies that shocks do not necessarily support improving allocative efficiency and reducing slack in the economy. Barlevy refers to this as the ‘sullying effect’.
Ouyang (
2009) also argues that recessions that destroy infant businesses scar the economy by preventing new and innovative businesses from reaching their full potential. In other words, it is possible that the plants that are suffering most during the crisis are infant plants. The reason for this effect is that young firms must exit from the market during the recession before they can demonstrate their own quality. During good times, a potentially good firm would have survived. The exit of promising firms then reduces the proportion of good firms in the future because potentially good young firms are forced to leave. This process will lower average productivity. Ouyang defines this impact as a ‘scarring effect’. Therefore, the overall impact of an economic shock, like a recession, on the allocation of resources depends on the relative magnitude of the cleansing and scarring effects (
Ouyang 2009).
A number of recent studies investigate natural selection processes in industries caused by natural shocks. These studies add scant available literature on the economic impact of natural disasters. Focusing on firm exit after the Tohuku earthquake in 2011 and the Kobe earthquake in 1995,
Uchida et al. (
2014) find that more efficient firms are less likely to go bankrupt both inside and outside the affected areas, which indicates the existence of natural selection. However, by comparing firms inside and outside the affected areas, they also find that firms inside affected areas are less likely to go bankrupt than those located outside, which suggests that damage from the earthquake actually decreases firm exit. They also state that this behavior is probably related to the role of aid for damaged firms or firms in affected areas. The impact of the 1995 Kobe earthquake on firms, specifically on the survival of manufacturing plants and their post-earthquake economic performances, is also investigated by
Cole et al. (
2015). They find that the probability of a firm surviving is negatively correlated to the level of damage a plant experiences, but this effect diminishes over time. Interestingly, there is also some indication of a creative destruction effect, as plants that survived but were more severely damaged tended to show improvements in productivity. Several possible mechanisms driving the positive impact of the earthquake on productivity are: (i) a reduction in the ratio of workers to capital inputs and output; (ii) a reduction in the ratio of capital to labor inputs and output; or (iii) an increase of the ratio of capital to labor input. These results may also reflect what is known as technological adjustment in vintage models.
Tanaka (
2015) also studies the impact of the Kobe earthquake in 1995 on firm performance. He does not focus only on firm survival, but also shows that surviving firms are significantly larger than exiting or non-surviving firms in terms of employment, capital, and value added, which suggests that smaller firms are more likely to exit due to the earthquake.
Still another study conducted by
Fabling et al. (
2014) focusses on the impact of the Canterbury earthquakes in New Zealand in September 2010 and February 2011 on businesses in the Canterbury region. They show that the chance of survival is influenced by the firms’ prior financial viability, which reflects their resilience. Firms have a strong financial viability if they have sufficient financial resources to continue operations when a large shock affects their normal income. In other words, firms that perform poorly are affected and disproportionately forced to exit. Meanwhile, surviving firms rapidly return to their pre-earthquake profitability levels, once the adverse effects of the earthquake on the profit rate have completely disappeared. They argue that these results are consistent with competition acting to prevent extreme profits, and to eliminate poor performing firms—with the latter process accelerated by the Canterbury earthquakes.
Some studies have investigated the impact of the East-Asian economic crisis as another type of shock on the performance of the manufacturing sector in Indonesia (
Hallward-Driemeier and Rijkers 2013;
Poczter et al. 2014;
Narjoko 2014). Although the impacts of the 2006 earthquake are more local than the impact of the economic crisis, these studies provide insight into the consequences of large shocks on firm survival. Using firm-level manufacturing data (1991–2001), Hallward-Driemeier and Rijkers find support for the hypothesis that the crisis strongly improved the re-allocative process. They also conclude that the crisis appears to have removed the weakest potential entrants, thus helping to mitigate the loss in aggregate productivity. Poczter et al. also use firm-level manufacturing data (1990–2005), and find that during a crisis declining real productivity becomes more pervasive and does not return to pre-crisis levels, which suggests that surviving firms become less productive on average. Specifically, the decreasing average productivity of firms spreads to almost all industries and all groups in the post-crisis era, while in the pre-crisis period the only set of firms with aggregate negative real productivity growth are the domestic firms.
Meanwhile,
Narjoko (
2014) focusses on firm entry, and on how the entrants’ characteristics in the Indonesian manufacturing sector differed between the pre- and the post-crisis. He finds that there are some differences in the characteristics of the entrants in the pre- and post-crisis period. For instance, the size of the entrants, as measured by employment, is larger after the crisis. However, he also finds that labor productivity in the two periods is more or less the same, which indicates that entrants were able to match the productivity level of incumbents, which may increase the chances of survival of the entrants. As entrants after the crisis were less financially constrained, they also tended to be more resilient to shocks than their predecessors.
3. Dynamics of Firm Survival
Our main data are manufacturing data collected by the Indonesian Statistical Agency, BPS (Badan Pusat Statistik), covering medium-sized and large establishments in the Yogyakarta province in 2003, 2005, 2007, and 2009. The period of analysis does not extend beyond 2009, because in 2010 the Merapi volcanic eruption occurred and that might also affect the local economies of the province of Yogyakarta. Our investigation focusses on the implication of the 2006 earthquake. The survey designed by BPS was intended to be a complete annual enumeration of all medium-sized and large manufacturing establishments. It uses 20 employees as the threshold for medium-sized and large establishments without considering when the firms started. The data contain detailed information on employment, inputs, outputs, exporting, ownership, and capital stock.
The raw data consist of 1632 observations for 637 firms. Most of them were located in Bantul, Sleman, and Yogyakarta. These data do not provide explicit information about the dynamics of firm survival. An additional note is that the BPS manufacturing survey cannot follow a firm if the firm relocates to another district. Therefore, the survey design determines how we construct our own definition of ‘surviving, ‘exiting’, and ‘new entrant’ firms during the period based on the available data. It implies that the term ‘surviving, ‘exiting’ and ‘new entrant’ does not reflect actual survival, exit, and entry. We considered filtering out observations that did not represent a genuine exit, however, due to data limitations this could not be implemented. Previous studies using the Indonesian manufacturing data also face the same limitation.
1We classify a firm as an
exiting firm if the firm disappears from the survey because it goes out of business or falls into the category of small-sized establishment with less than 20 employees. When a firm entered the survey, it was classified as a
new entrant firm, as it did not appear in the previous survey. Firms that also existed in the previous survey are identified as
surviving firms. Using this approach we can present the dynamics of firm survival (
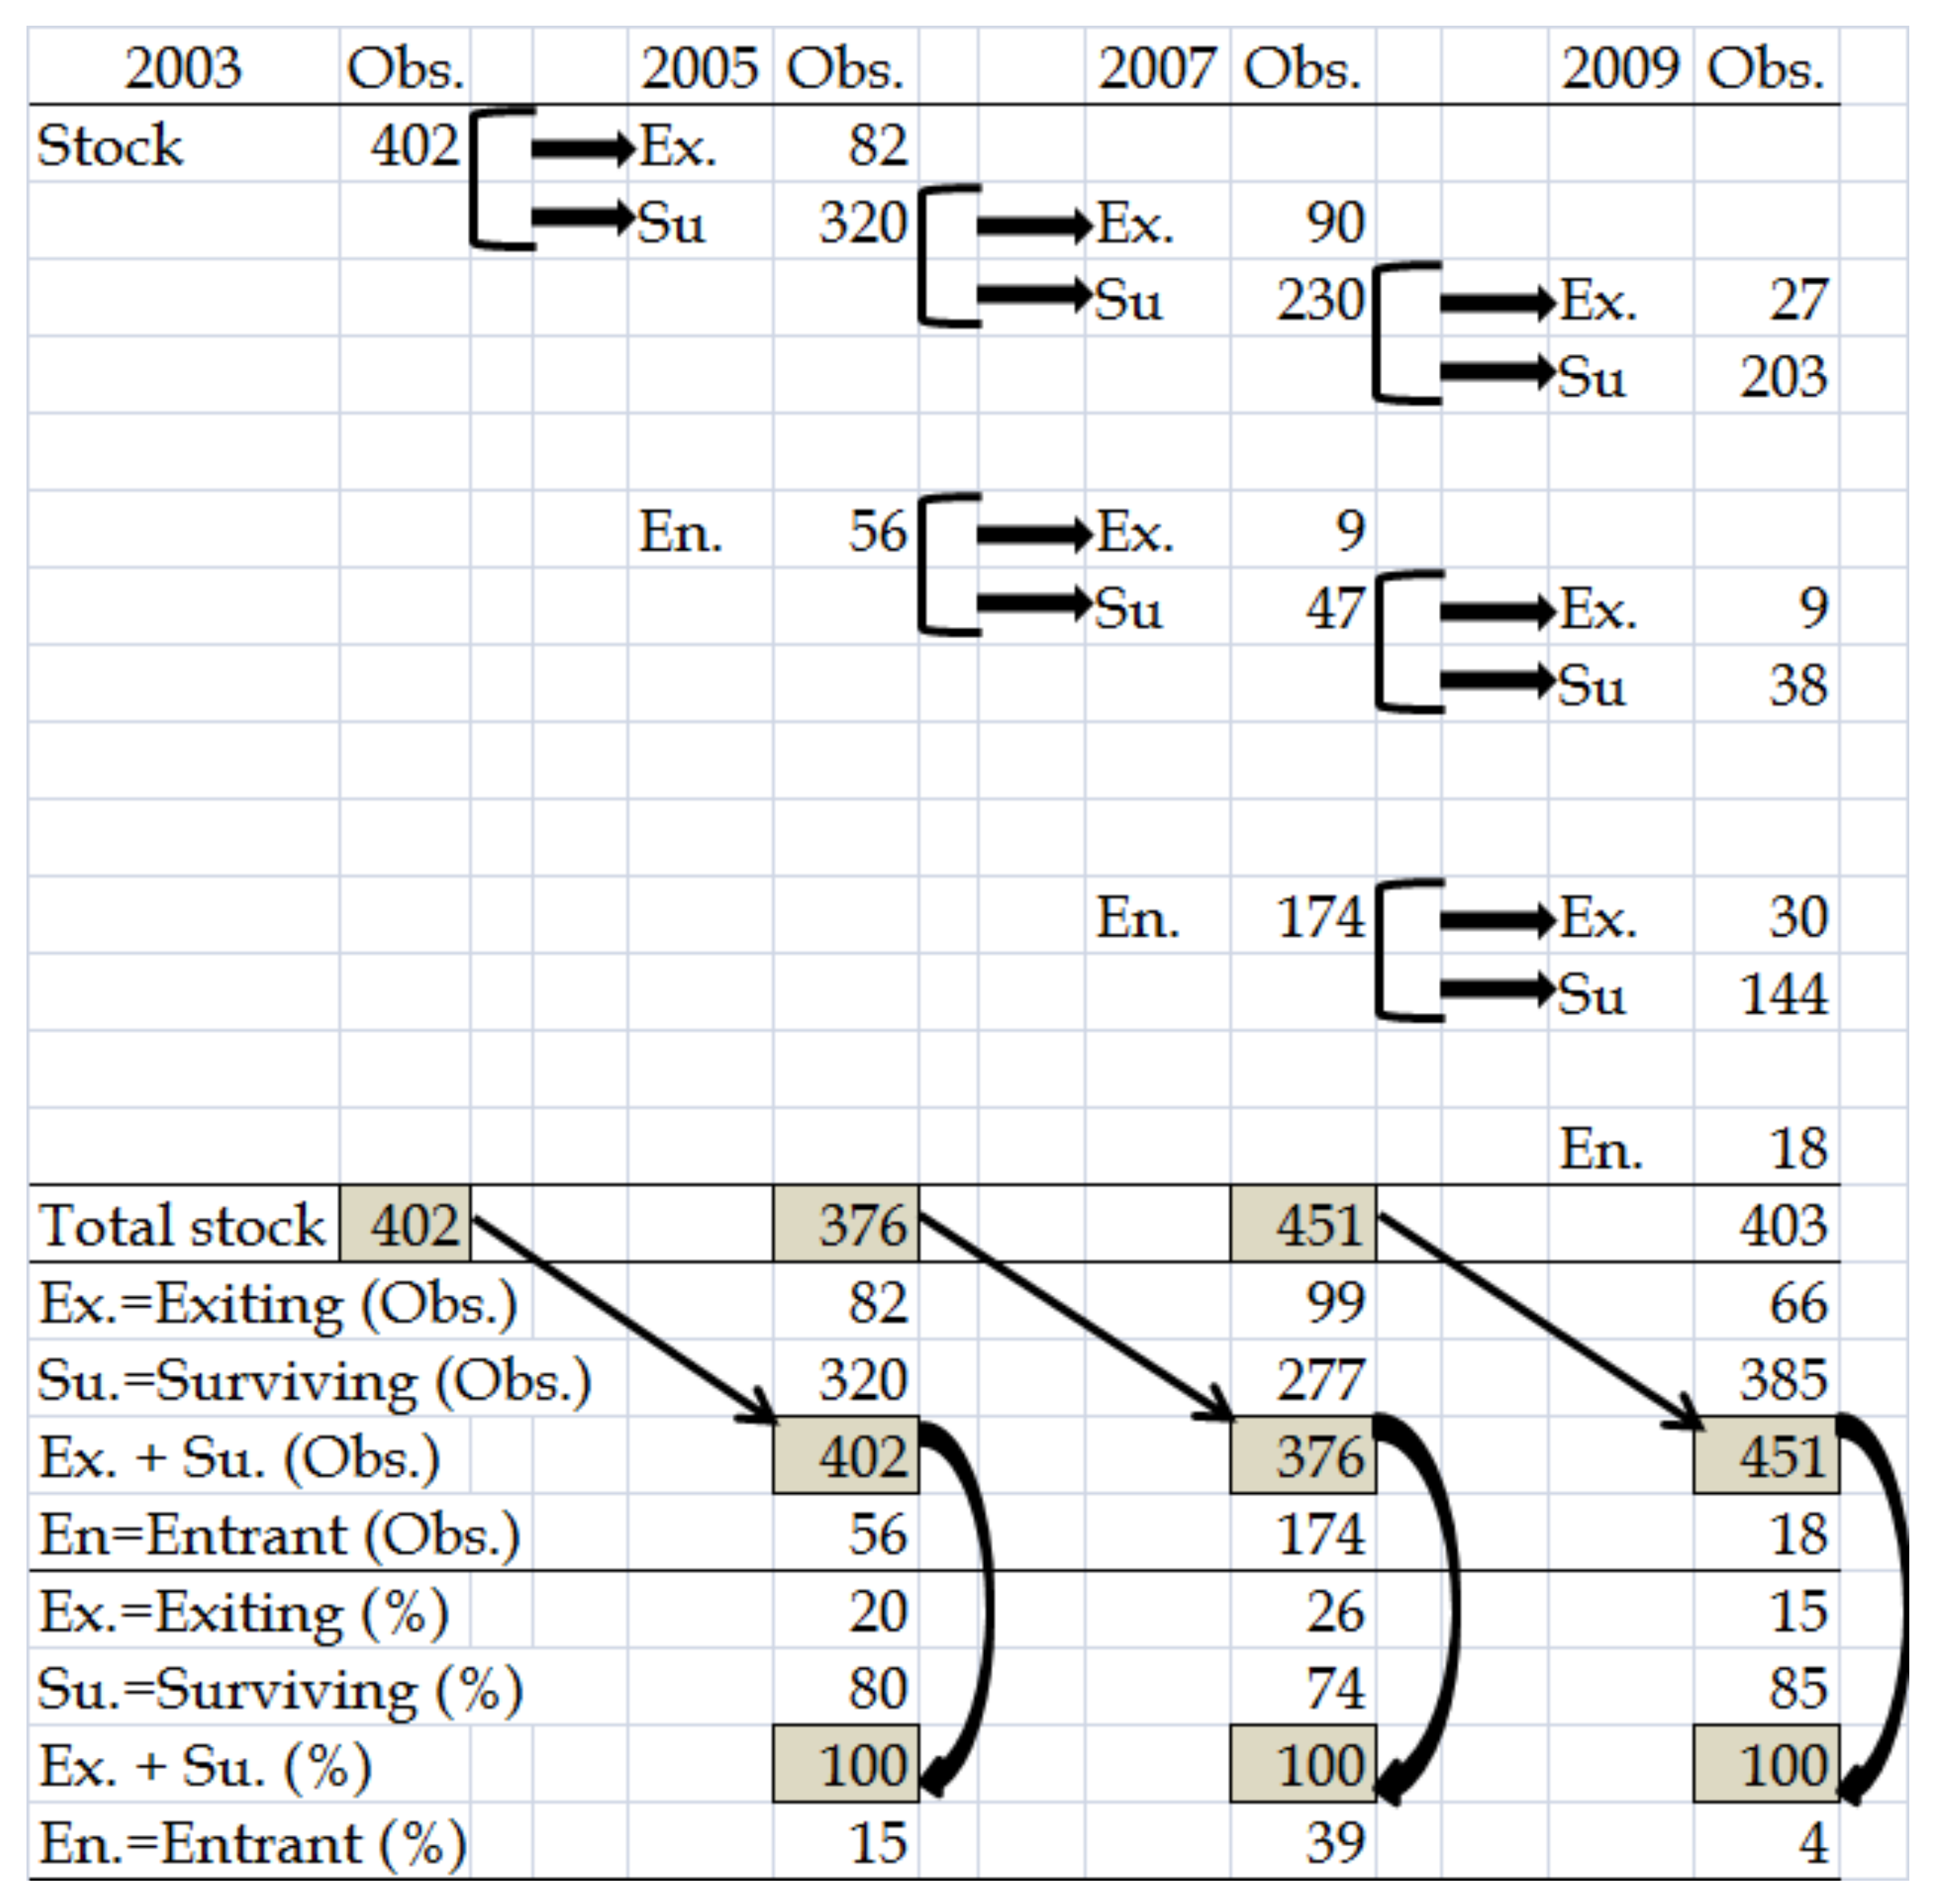
Figure 1).
Figure 1 shows that the number of firms in 2007 was higher than the number of firms in 2003, and larger than in 2005 or 2009. Interestingly, the lowest rate of survival and the highest rate of entry are found in 2007. There were 402 firms in 2003, and 80% of them were still surviving in 2005. Meanwhile, 74% of the firms that existed in 2005 were still surviving in 2007. The difference is relatively small, but it provides early evidence of the consequence of the earthquake. From 402 firms that existed in 2003 there were 203 firms that continued to exist until 2009.
The entry rate in 2007 was around 39%, and relatively high compared with the entry rate in 2005 and 2009. The survival rate of these entrants was also relatively high. We observe that 84% (47 firms) and 68% (38 firms) of the 56 firms that entered in 2005 were still active in 2007 and 2009, respectively. Meanwhile, the survival rate of firms that entered industry in 2007 was 83% (144 of 174 firms). The difference in the survival rate between new entrants in 2005 and in 2007 is relatively small, indicating that there was no large difference in firm characteristics, such as productivity, between the two groups of entrants in their early years.
4. Dynamics of Firm Productivity
The description of the developments in the manufacturing industry in the previous section suggests that natural selection works in the Yogyakarta earthquake context. The earthquake forced out 26% of firms that existed in 2005, and also attracted a large number of new entrants (39%). This raises an intriguing question: Why did the earthquake attract so many new firms to enter the manufacturing industry?
The most likely reason is that it was a response to the excess demand for the reconstruction of buildings and utilities following the earthquake. The decrease in aggregate production that was related to the exit of so many old firms as a result of the earthquake was largely substituted by the output of new firms. Closing this gap in production is the main role of the new entrants (see Panel A,
Table 3). In 2005, the surviving firms (320 firms) produced 97% of the added aggregate value. In 2007, about 80% of added aggregate value was produced by the 277 surviving firms. The added average value of these surviving firms and the panel firms (203 firms that had existed continuously from 2003 until 2009) in 2007 was also lower than the average in 2005, and continued to decrease until 2009, although the average of all firms actually increased. This reveals that new entrants were needed to fill the production gap. In contrast to the decreasing value added of the surviving firms, the value added per new entrant consistently increased from 0.6 billion rupiahs in 2005 to 2.8 billion rupiahs in 2009. This indicates that the new entrants became more productive as time went by. Therefore, the earthquake has attracted new and more productive firms, which supports the natural selection hypothesis.
New entrants in 2007 were relatively small compared with the same group in 2005 (see Panel B of
Table 3). In 2005, the size of the new entrants, based on the average number of workers, was 85 while in 2007 it was 80. If we use a cut-off point of 50 workers, the data show that more than 69% of new entrants in 2007 were firms with less than 50 workers, compared with 55% in 2005, indicating that the post-earthquake era provided opportunities for smaller firms.
In addition, it is also possible that, prior to 2007, some of the new firms were small firms (with less than 20 workers), but their size then increased to more than 20 workers, or surpassed the minimum threshold of the definition of medium-large enterprises, as used by the BPS (see the previous section on data). We do not have enough historical information on these new entrants to confirm that they were small establishments prior to 2007. However, it is important to note that the average number of workers of surviving firms and the panel firms also increased from 125 in 2005 to 146 in 2007, and then decreased to 129 in 2009, which suggests that industry also used a labor-intensive strategy as a short-run strategy to maintain the aggregate supply following the earthquake in 2006.
The earthquake in 2006 has forced out unproductive firms. This process may increase the productivity of the surviving firms. The negative shock caused by the earthquake also opened opportunities for new producers to enter the industry. One expects exiting firms to be the least productive firms, while new entrants are expected to be more efficient. Overall, this process will increase industrial productivity. Further analysis is needed to support this claim. We do this by comparing firm productivity during the period. Panel C of
Table 4 provides firm productivity based on value added per worker.
If we compare the productivity of the surviving firms and new entrants (see Panel C of
Table 3), we see that firm productivity in 2007 and 2009 was lower than in 2005, except for new entrants. This result indicates that the earthquake is associated with a reduction in average productivity. The decrease in productivity of the surviving firms and the panel firms was relatively large. New entrants after the earthquake played an important role in the recovery process of the industry: these firms were more productive than the new entrants in the previous years and the surviving firms. Therefore, the figures suggest that the earthquake contributed to eliminating the unproductive firms, and, at the same time, attracted new productive firms. In other words, there was a cleansing process following the earthquake in 2006.
Now we turn to a comparison of firm productivity between surviving and exiting firms in the preceding 2 years (
Table 4). It is based on the argument that firms exited from the market due to their low productivity. The table clearly indicates the importance of a firm’s preceding productivity in determining firm survival. The preceding productivity of exiting firms in all years was always smaller than the preceding productivity of the surviving firms. As already discussed, unproductive firms are more vulnerable to negative external shocks. This finding also gives support to the role of productivity in the natural selection mechanism.
5. Determinants of Firm Survival
Following the descriptive analysis, we empirically investigate the relationship between productivity and ‘entrant status’ and the firm’s probability of survival related to the earthquake. The expectation is that high productivity firms will have a higher probability of survival, and will also be able to survive more easily from the adverse impact of the earthquake in 2006. Empirically we test whether the preceding productivity determines firm survival. For instance, it is expected that high productivity firms in 2005 will be associated with higher survival in 2007. Our indicator of productivity is value added per worker in the preceding year or in t–2 (labelled as P, in natural logarithm). Since we have data for 2003, 2005, 2007, and 2009, we can apply this approach to the surviving firms in 2005, 2007, and 2009 for which we use firm productivity in 2003, 2005, and 2007 to predict firm survival in 2005, 2007, and 2009.
We also examine the difference in survival with regard to new entrant status. As far as natural selection works, we expect that the new entrants in
t–2 will have a higher probability of survival in year
t. A dummy variable for new entrants is labelled as
N, and takes the value of 1 for firms that entered in year
t–2, and 0 otherwise. In total, we have 1229 observations for the estimation. Since we cannot identify firms in 2003 as new entrants, we have to exclude 402 observations for the year 2003. This implies that we can only focus on firm survival in 2007 and 2009 by using their productivity in 2005 and 2007, respectively, as the main predictors of previous firm performance. Based on
Figure 1, we can use 827 observations for estimating the probability of a firm to survive that consist of 376 observations for the year 2005 and 451 observations for the year 2007. These observations represent 550 firms that consist of 376 firms that already existed in 2005 (320 surviving firms in 2005 from 402 firms in 2003, plus 56 new entrants in 2005) and 174 new entrants in 2007.
Since we mainly aim to investigate firm survival related to the earthquake in 2006 we then need to use a variable that can capture the relationship between the earthquake and the firms. However, the raw data does not provide information on whether a firm was directly affected by the earthquake or not. It provides information about the firm location at the district level only. We therefore use a Difference in Difference (
DiD) strategy, which is also used in
Hallward-Driemeier and Rijkers (
2013) and
Narjoko (
2014), to investigate the implications of the earthquake. Following the DiD approach, the earthquake in 2006 is the treatment. Therefore, we create a binary post-earthquake variable, labelled
Post_EQ2006, that takes the value of 1 after the earthquake, and 0 elsewhere. We then interact this earthquake dummy variable with productivity and entrant status. The coefficient for the interaction variable between productivity and the earthquake variable reflects the cleansing effect, while the coefficient of the interaction variable between entrant status and the earthquake variable represents the scarring effect. These two interaction variables are our variables of key interest. We empirically use the following logit model:
where
Pi,t is the probability that firm
i survives in year
t;
PR is a productivity measure of the respective firm in year
t–2;
Post_EQ2006 is a dummy variable for the post-earthquake time dummy (the year 2005 is 0, while 2007 is 1);
N is a dummy variable for firm
i that entered the survey in year
t–2 representing a new entrant. We also control for sector of industry (8 industries: food, textile, wood, paper, chemicals, non-metallic mineral products, metal products, and other processing), district (5 districts: Bantul, Sleman, Yogyakarta city, Kulon Progo, and Bantul), and year (2) to capture the differences in firm survival behavior. These control variables, especially district dummies, are also used to cover the omitted geographical characteristics related to the earthquake.
2The key coefficients are β2 and β4. A negative sign of β2 indicates a decrease of the power of productivity in 2007 to protect firm survival in 2009, compared with the power of productivity in 2005. In other words, productivity is more important for firms to survive in 2007 or to pass the negative external shock caused by the earthquake in 2006. Since more productive firms in 2005 had a higher probability to survive, we can interpret this as evidence of the cleansing effect: this exogenous shock cleansed out less-productive firms. Meanwhile, a negative sign of β4 indicates that firms that entered the industry in 2007, or just after the earthquake, had a lower probability of surviving in 2009. This also means that new entrants in 2005 tended to have higher probability of survival in 2007, or had success in dealing with the negative impact of the earthquake in 2006. This leads to the conclusion that the Yogyakarta earthquake in 2006 had no scarring effect on the new entrants.
In addition, some relevant variables that are suggested in the literature (e.g.,
Disney et al. 2003;
Syverson 2011;
Hallward-Driemeier and Rijkers 2013;
Wagner 2013) are included in the model. First, we add a variable for firm size measured by the number of workers (
ln(Workers)t–2) to test whether large firms tend to have a higher probability of survival. The second additional variable is a dummy variable for exporting firms (
Xt–2). This variable takes the value of one for firms that answered ‘yes’ to the question ‘any product exported?’ in the survey, and zero otherwise. As the shock caused by the earthquake would affect the local market, one may expect that an exporting firm would survive more easily following the earthquake. Finally, we include a variable to control a firm’s credit constraints. This variable is a dummy variable for access to credit (one for firms with access to credit, and zero otherwise). We create this variable based on data on firm expenses. Specifically, it takes the value of one for firms that reported interest paid on loans, and zero otherwise (
Ct–2). It can be expected that firms with access to credit tended to have a higher probability of survival as they were able to deal with financial difficulties related to damage or losses due to the earthquake. But it is also possible that these firms then faced difficulty in servicing their commercial loan. After controlling for these variables separately, we estimate a full model that includes all control variables. All these additional variables are also interacted with
Post_EQ2006.
In the previous section we showed the dynamics of firm survival and the dynamics of firm productivity. In the current section we try to relate these two dynamic processes. We focus on the following two empirical questions: Is there a difference in the relationship between the pre-and post-earthquake productivity of firms and their probability to survive? And is there a difference in the probability of survival of the new entrant firms in 2005 (before the earthquake) and the firms that entered the industry in 2007 (after the earthquake)? Estimation results are presented in
Table 5,
Table 6 and
Table 7, in which we provide the marginal effects of our independent variables.
In
Table 5 we first present the marginal effects of our variables of interest. Column 1 of this table indicates that all means are statistically different from zero. Firms with higher productivity are 8.3% more likely to survive, meanwhile the marginal effect of new entrant variable is 13% point. These findings confirm that the survival of more productive firms or new entrants was higher than that of less productive firms or old firms. Meanwhile, the interaction variable between productivity and the post-earthquake dummy variable has a negative marginal effect, and is statistically significant. This indicates a decrease of the influence of productivity in determining firm survival after the earthquake. The net marginal effect of productivity is relatively small, only 1%, but since this effect is still positive we can interpret that the preceding productivity was important for firms to survive. Tests for the effect of the interaction variable between preceding productivity and post-earthquake is also statistically significant at the 5% level, indicating that the effect of preceding productivity is statistically different between pre- and post-earthquake. This evidence supports a cleansing effect of the earthquake. Looking at the interaction variable between new entrants and the post-earthquake dummy variable we find that its marginal effect is also statistically significant. It indicates that the new entrants in 2005 were relatively well-prepared compared with the new entrants in 2007, so there is a relationship between the firms’ status as new entrants and their probability to succeed in dealing with the negative impact of the earthquake. This difference is also statistically significant at the 5% level. This result suggests that the earthquake had no scarring effects on firms that entered the industry in 2005.
The inclusion of other variables does not affect the sign of the effect of our main variables on the probability to survive, but the interaction variable between productivity and new entrants with the earthquake variable loses its statistical significance. As well, the difference of productivity for new entrants between pre- and post-earthquake is statistically significant at 10% (see
Table 5, specification (2)). Firm size, measured by the number of employed people, is the only other covariate that has a statistically significant effect on firm survivability. But the effect of the interaction between this firm-size indicator and the earthquake is not statistically significant and its test of difference relationship between the two periods is also not statistically significant, even at the 10% level (chi-squared is 1.20).
This finding weakly indicates that the firms that could survive following the earthquake are only those which were productive in the preceding year. As the result confirms that the earthquake has forced out unproductive firms, it supports the natural mechanism of economic Darwinism. The interaction variable between new entrant and earthquake also has a negative and statistically significant coefficient confirming that the firms that entered the industry in 2005 had a higher probability of survival than the firms that entered the market after the earthquake. This indicates that the earthquake had no scarring effect on the new entrants. Since new entrants were mostly young firms, the finding suggests that the shock caused by the earthquake did not force out young firms that entered the industry before the earthquake. In general, the estimated models correctly classified a firm’s survivability at more than 80%.
We also present other estimations in which we use productivity that has been normalized (
Table 6). This normalization uses the mean productivity of each industrial group in 2003. Therefore, a firm’s productivity in 2005, 2007, and 2009 was divided by the mean productivity at industry level in 2003. Since this variable also reflects the improvement in productivity, we expect that this alternative productivity measure will not give different results. Empirically, we reran all the specifications estimated in
Table 5. The results show that all variables have the same signs. The levels of significance of these effects are relatively similar. But additional tests show that the difference of the effect of new entrants between pre- and post-earthquake loses its statistical significance.
On the basis of the results in
Table 5 and
Table 6, we may conclude that the earthquake in 2006 cleansed out less-productive firms, leading us to support the natural selection mechanism. One potential problem with these results it that the dummy variable of the earthquake does not sufficiently represent the consequences of the shock since this variable is constructed following the before-after method.
An alternative that can resolve the issue is to link firm location data to the information on the area affected by the earthquake at the village or sub-district level, which might give a better dummy variable that represents the earthquake. Although we have data on the affected areas at a sub-district level, our manufacturing dataset does not provide detailed information about firm location. The location information is available only at the district level.
An inspection of the disaster magnitude of the Yogyakarta earthquake, measured as a percentage of the total damage and losses to gross regional domestic product, shows that Bantul was the most affected district and Yogyakarta (city) was the least affected district (see
Table 1). The disaster magnitude of Bantul, Kulon Progo, Gunung Kidul, Sleman, and Yogyakarta (city) as a percentage of damage and losses to the size of the economy are 246, 74, 64, 48, 28, respectively (
Bappenas 2006). The difference between these districts in the disaster magnitude might suggest that firms also responded differently to this negative shock. Based on the disaster magnitude data, we created an alternative dummy for the earthquake. This new dummy variable takes the value of 1 for the post-earthquake situation after 2006, but only for Bantul, Gunung Kidul, and Kulon Progo. Estimation results using this alternative indicator are provided in
Table 7 for the baseline model only.
In column 1 of
Table 7 we use value added per worker, while in column 2 we use value added per worker that has been normalized. The results show that the preceding productivity tends to consistently play an important role in affecting firm survival. However, the interaction variable between productivity and the earthquake loses its significance. The variable for new entrant and its interaction with the earthquake becomes statistically insignificant. Testing for interaction variables also loses it statistical significance. Regarding these results, it is still problematic to draw firm conclusions on the consequence of the earthquake on the probability of firms to survive, in particular due to the limitations of the data.

