1. Introduction
Exchange rates powerfully affect cross-border economic transactions, according to
Frieden (
2008). “Trade, investment, finance, tourism, migration, and more are inextricably linked to and influenced by international monetary policy”, see
Frieden (
2008, p. 344). To this end, there is an abundance of theoretical and empirical evidence that overwhelmingly highlights the increasing importance of exchange rates in the face of globalization (see
Frieden 2008). A competitive exchange rate is a condition for economic growth (
Gala and Lucinda 2006)
1. Yet, since the 1990s, this condition is not present in most developing countries (
Bresser-Pereira 2008). Most developing countries do not have the “relatively devaluated” exchange rate which Bresser-Pereira referred to as a competitive exchange rate. The idea of the competitive real exchange rate has received a lot of attention in both academic and political circles, (see
Sokolova 2015). In the Caribbean,
Blackman (
2002) noted that the exchange rate is the most important price since it determines the terms of trade as well as the relative prices within an economy.
Doroodian et al. (
2002) posit that it is a general consensus among researchers that the state must pursue an appropriate exchange rate policy as part of its liberalization effort in order to strengthen the competitiveness of domestic firms against established foreign firms. In other words, maintaining the real exchange rate at the “wrong” level can have negative effects on the nation’s competitiveness. The authors further highlight that the inadequacy of economic performance has been the result of inappropriate exchange rate policies.
Johnson et al. (
2006) argue that exchange rate policy is a “lever for growth” even in countries with relatively weak institutions.
The policy advice that governments usually receive on exchange rates have been typically presented as theoretical solutions to economic problems. However, we cannot ignore the fact that exchange rate policy is a politically charged issue since it impacts all citizens; some favorably and some not so favorably. As such, policy-makers are generally more concerned with the impact of currency policy on electoral conditions and potentially, pressures from special interest groups.
Within recent times, Trinidad and Tobago’s (T&T’s) foreign reserves have been waning on account of the unexpected decline in oil prices experienced in mid-2014; with the state doing its best to manage the currency float. The price of oil took a severe turn in mid-2014, plummeting to all-time lows in over ten years; remaining depressed over the last couple of years, barring a slight recovery in recent times
2. This decline in reserves resulted in foreign currency shortages in the banking sector in Trinidad and Tobago which has ignited a debate on whether T&T’s exchange rate is overvalued or not. The International Monetary Fund (IMF) Article IV 2016 for the Trinidad and Tobago economy found that that the Trinidad and Tobago currency is substantially overvalued in the range of 21.3 to 50%.
Edwards (
1989) argues that real exchange rate misalignments may affect growth and welfare. Maintaining the real effective exchange rate (REER) at the wrong level may create distortions in the relative price of traded to non-traded goods, which can generate incorrect signals to economic agents and result in greater economic instability. This essentially results in the suboptimal allocation of resources across the various sectors of the economy. Furthermore, sustained REER overvaluations constitute an early warning indicator of possible currency crashes (
Krugman 1979;
Frankel and Rose 1996;
Kaminsky and Reinhart 1999). Furthermore, overvaluations have also been empirically found to have a negative impact on growth in the literature. Though this seems to be a long way off for the Trinidad and Tobago economy given its relatively large buffer of foreign reserves and a still healthy position of 9.7 months of import cover as of 2017, this can easily dissipate in the absence of greater exchange rate flexibility as noted by the IMF. Specifically, the IMF report noted that in the absence of greater exchange rate flexibility the country’s healthy external reserve position of 10.9 months of import cover as of July 2016 could steadily deteriorate to under 3½ months by 2021.
The question now arises: Is the Trinidad and Tobago currency really overvalued and to the extent outlined in the IMF Article IV report for 2016 for the T&T economy? In this paper, we focus our attention on a discussion regarding the issue of currency misalignment in the T&T economy for the period 1960 to 2016. We empirically examine T&T’s exchange rate misalignments for the period 1960 to 2016 as it deviates away from its equilibrium long run fundamentals. This study utilizes the ARDL approach for assessing cointegration, i.e., to assess whether a long-run relation exists amongst the real exchange rate and its fundamentals, which was proposed by
Pesaran and Smith (
1995) and further developed by
Pesaran et al. (
2001). The paper also examines the impact of exchange rate misalignments on economic growth for the Trinidad and Tobago economy. We also examine whether these effects are linear or non-linear; by testing the theoretical and empirical notion that an overvaluation is harmful to economic growth whilst an undervaluation is beneficial to economic growth.
The paper is unique as it is the first paper, to the best of our knowledge, to empirically examine T&T’s real effective exchange rate misalignments and its potential impact on economic growth. Studies examining the impact of exchange rate misalignments, specifically the impact of overvaluations and undervaluations on economic growth for net oil exporters are sparse. The contribution of this study to the existing literature is three-fold. From our review of the literature, to the best of our knowledge, this is the first empirical paper that addresses the impact of exchange rate misalignments (both overvaluations and undervaluations) on economic growth on such a country classification. The studies cited in this paper as well as other studies conducted for net oil exporters in the literature focus mainly on the effect of oil prices on the REER, i.e., the Dutch disease effect. Secondly, the paper provides useful policy implications in relation to the current size and extent of T&T’s exchange rate misalignment. In particular, it provides contrasting results in relation to those found by the IMF Article IV 2016 for the T&T economy, which as highlighted above, found the currency to be substantially overvalued in the range of 21.3 to 50%, whereas this paper finds an overvaluation of 9.5% and 7.1% for the years 2015 and 2016 respectively. The differences in these findings can have serious policy implications if policy makers choose to utilize the IMF findings. Third, the paper presents results that are not in line with the current empirical literature whereby we find that both undervaluations and overvaluations impact negatively on growth in T&T economy, which contradicts the results of recent empirical literature (see, for example,
Rodrik (
2008)).
In this regard, the rest of this paper is organized in the following way. In
Section 2 of the paper, we review the evolution of the exchange rate in the Trinidad and Tobago economy.
Section 3 provides a comprehensive review of the literature on the relationship between real exchange rate misalignments and economic growth.
Section 4 outlines the methodology used in the paper, and briefly outlines the data and their respective sources used in the study.
Section 5 provides a discussion on the empirical results obtained, whilst
Section 6 estimates the exchange rate misalignments and examines its impact on economic growth in the Trinidad and Tobago economy. Lastly,
Section 7 concludes and provides key policy recommendations.
2. Evolution of the Exchange Rate Regime in Trinidad and Tobago
In discussing currency valuation for Trinidad and Tobago, the natural point of departure for this discussion is the country’s dependence on oil and natural gas exports. Trinidad and Tobago has been a significant exporter of oil for many decades and more recently a major producer of natural gas
3. The volatility in prices for these natural resources impacts significantly on T&T’s economy, and by extension its exchange rate value as well. During the 1960s up to the early 1990s, T&T adopted a fixed exchange rate regime, where it was pegged to the US
$ before shifting to a managed float regime from the 13th of April 1993. During the period 1974 and 1982, T&T benefitted immensely from positive oil shocks which led to economic boom conditions in Trinidad and Tobago. Real GDP growth for the period averaged 4.60% whilst foreign exchange reserves climbed from TT
$768.3 million in 1974 to TT
$7.16 billion in 1982, peaking at TT
$7.69 billion in 1981. Along with this, government expenditures rose sharply and there was a commensurate fall in unemployment. The unprecedented boom was followed by an adverse movement in the country’s terms of trade which was precipitated by falling oil prices from a peak of US
$39.60 per barrel in 1981 to less than US
$15 in 1986. This led to declining government revenues and mounting fiscal deficits which grew from 1.4 percent to 13.1% of GDP in 1983. The reaction of the Government of the Republic of Trinidad and Tobago (GORTT) was to control imports rather than devalue the local currency. Consequently, there was a system of ex ante Central Bank controls over imports and the implementation of a wide array of tariffs, taxes, and subsidies.
In 1986, when international oil prices fell to less than US$15 per barrel, Trinidad and Tobago experienced a precipitous fall in foreign exchange reserves. Reserves fell to the equivalent of less than two months of import cover. Between 1982 and 1987, earnings from the petroleum sector fell by almost 50% and the rate of unemployment doubled from 10 to 22%. Realizing that approaching the IMF was inevitable in order to finance the growing fiscal deficit, the government then further devalued the currency to a unified rate of US$1.00 = TT$3.60. However, the decline in the economic standing of Trinidad and Tobago eventually led to the signing of a stand-by agreement with the IMF in 1987 with an additional agreement signed in 1990.
The design of the stabilization program emphasized tax reform, making the exchange rate more competitive, liberalizing the trade regime, increasing privatization, and reducing the external account and fiscal deficits. It was thought that these policies would create an environment conducive to increasing production and exports. Consequently, the government reduced the public sector wage bill by 10%, privatized and liquidated parts of state-owned enterprises, and introduced the 15% value added tax (VAT) covering all goods and services except for exports and some basic commodities. The government also introduced selective credit controls, reserve requirements, and limited open market operation to control the availability of credit. In 1988, faced with even further declines in petroleum prices and a significant cluster of external debt service payments, the government adopted a more comprehensive program which included a 15% devaluation in the currency which led to a cumulative depreciation in real effective terms of over 40% since the beginning of 1985.
Fast forward to 1993, the government decided to abolish controls on the current and capital transactions in favour of having the value of the Trinidad and Tobago dollar be determined within the context of an interbank market whose major players would have then been the authorized foreign exchange dealers. Since then, the value of the Trinidad and Tobago dollar appreciates or depreciates in response to changes in supply and demand conditions in the foreign exchange market and the intervention policy of the Bank; therefore, in practice, the foreign exchange system is a managed float. This led to the classification of Trinidad and Tobago as a
de facto floating exchange rate regime by the International Monetary Fund. Under the free float system, the central bank would adopt a passive stance and let the exchange rate be determined freely in the foreign exchange markets. In this instance, the central bank’s non-intervention in the foreign exchange markets means that the balance of payments and reserves transactions are zero
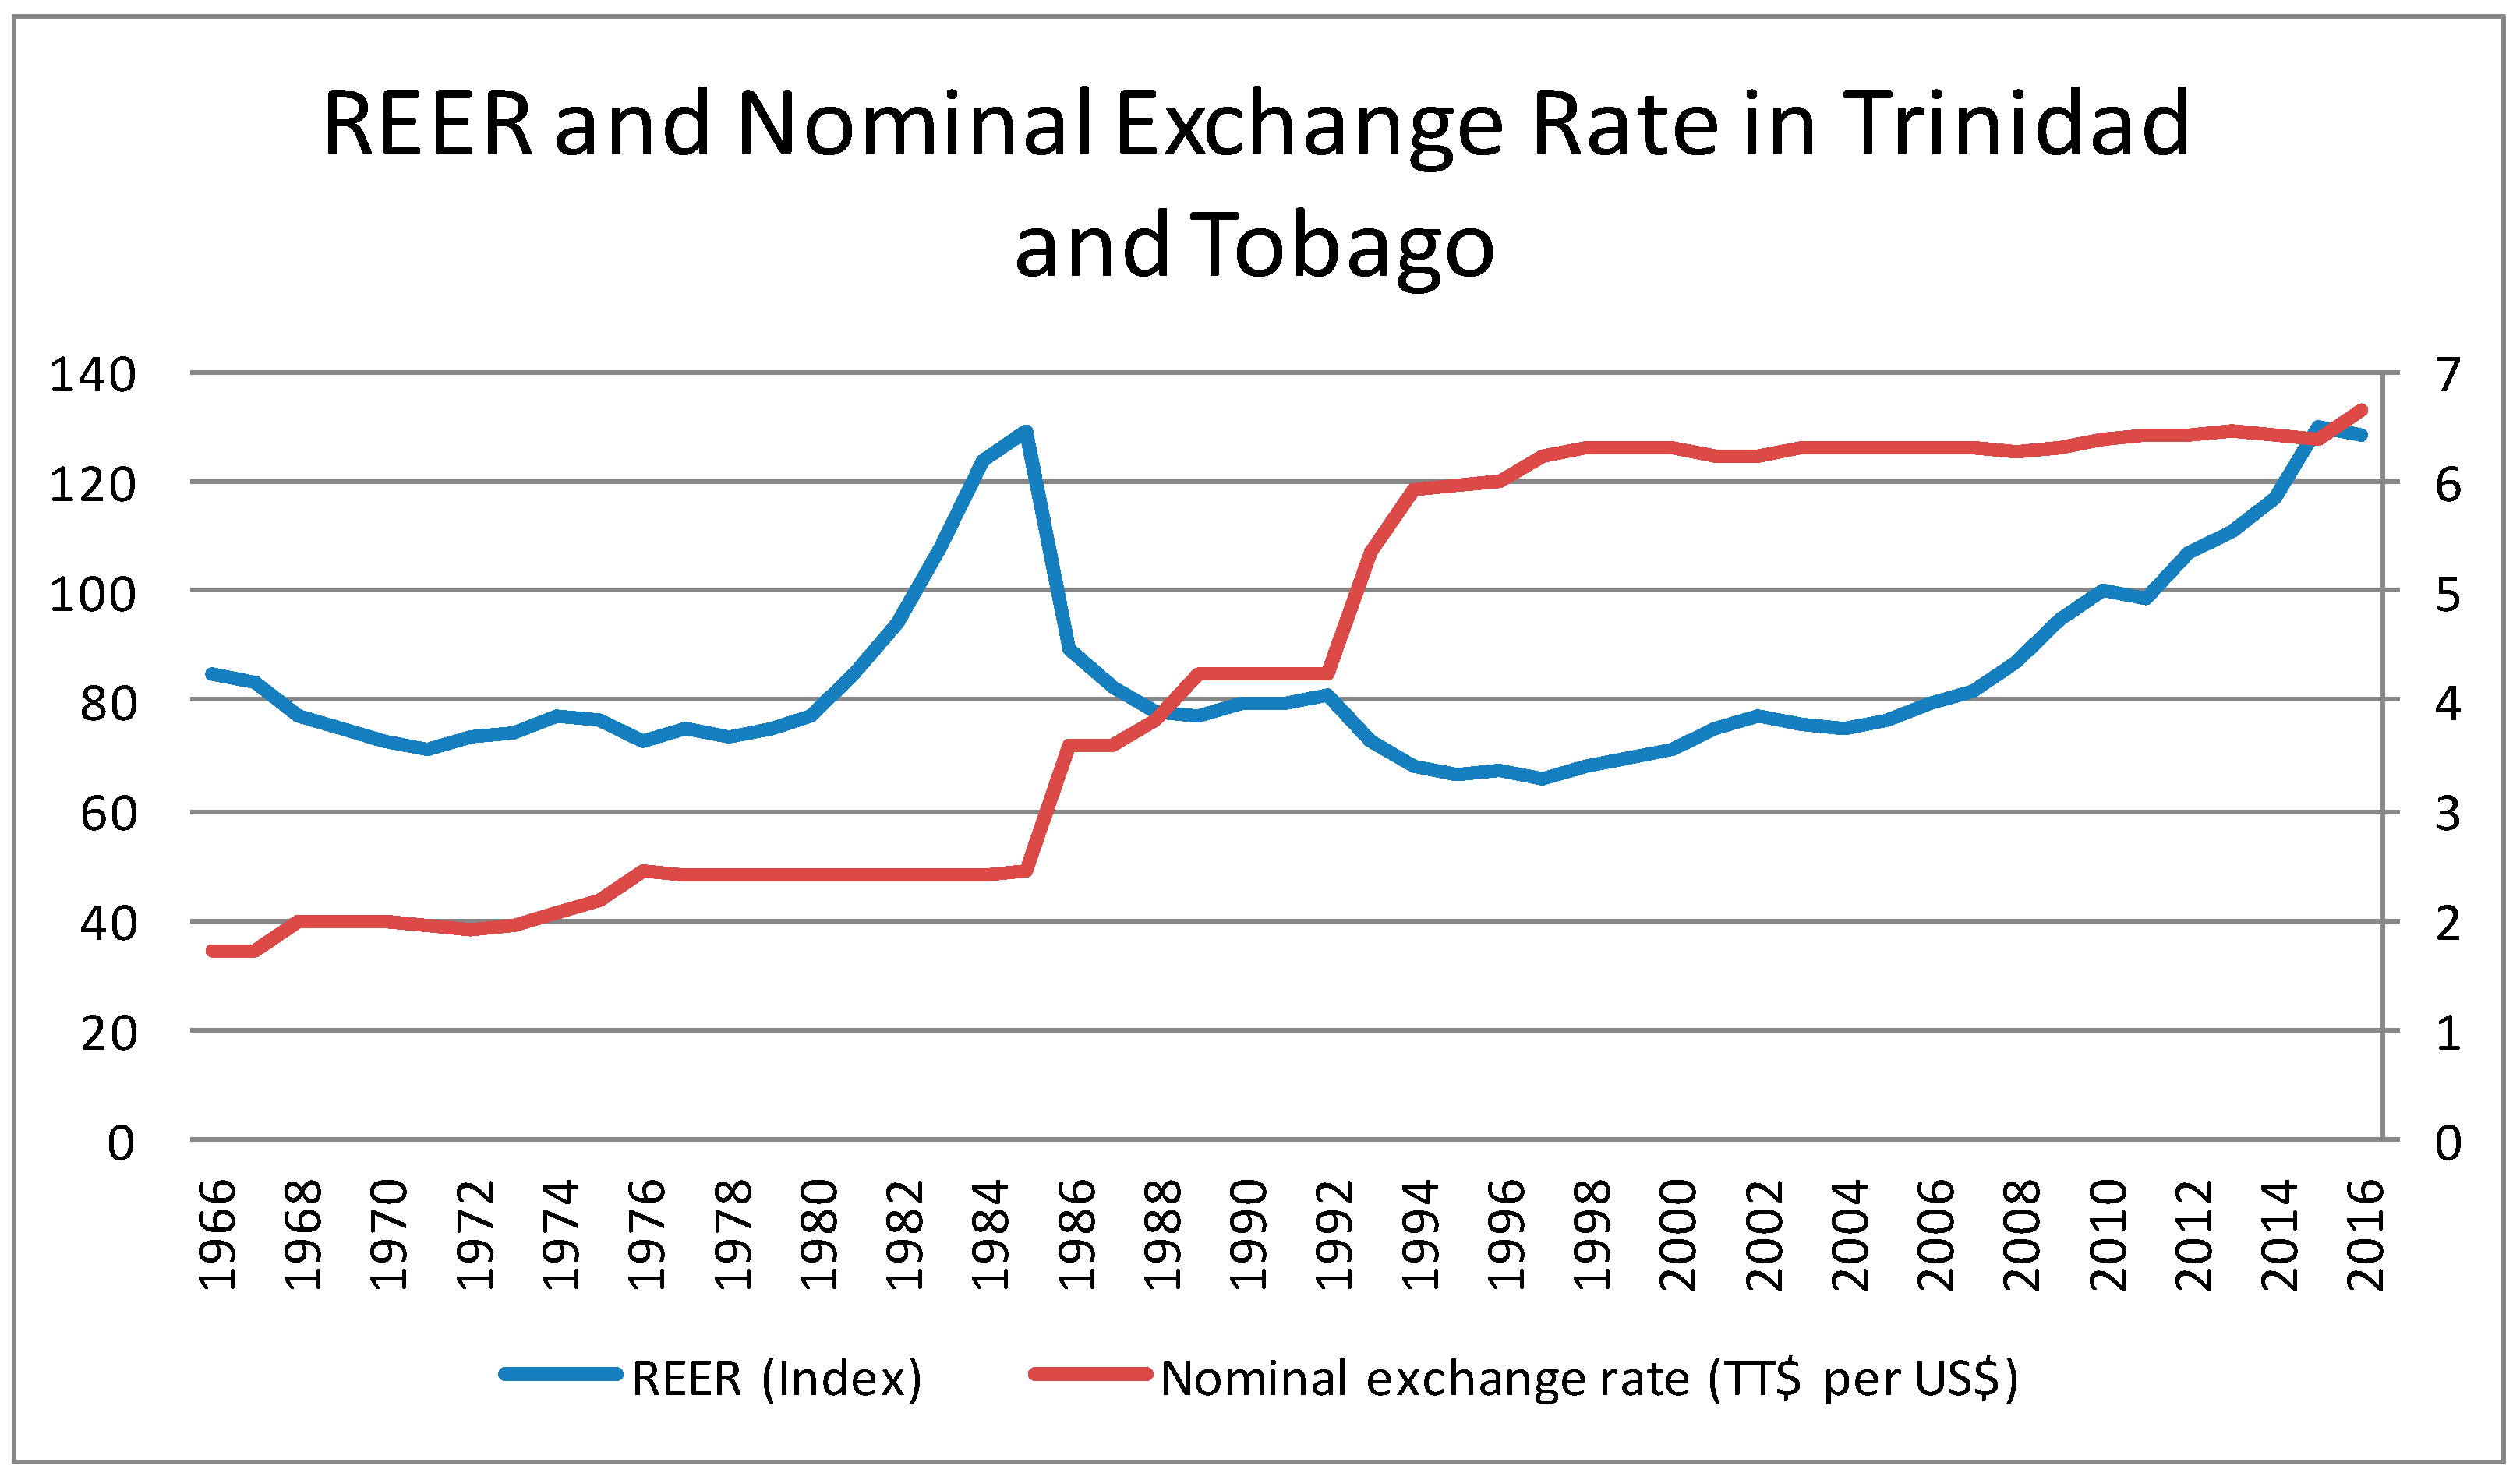
4. Therefore, under a managed float, the official reserves are not equal to zero. In looking at
Figure 1, we see that the managed float exchange rate regime provided stability in the currency value which should have been reflected in price stability in Trinidad and Tobago.
3. Literature Review: The Relationship between Real Exchange Rate Misalignments and Economic Growth
This section of the paper presents a brief overview of the evidence in the literature on the link between REER misalignments and economic growth.
Johnson et al. (
2006) argues that the exchange rate policy acts as a “lever for growth” even in countries with relatively weak institutions. According to
Habib et al. (
2017), whilst politicians are often convinced that a lower exchange rate will spur economic growth, economists on the other hand are generally skeptical that the relative price of two currencies may be a fundamental driver of economic growth over the long run. However, several studies have put forth theoretical arguments in favour of this relationship, see studies done by
Rodrik (
2008),
Aizenman and Lee (
2010),
Di Nino et al. (
2011),
McLeod and Mileva (
2011) and
Glüzmann et al. (
2012). Whilst on the other hand, there has been a plethora of empirical literature in recent times confirming this relationship, see
Aguirre and Calderón (
2005),
Rodrik (
2008),
Rapetti et al. (
2012),
Béreau et al. (
2012) and
Missio et al. (
2015). Furthermore, recent empirical literature surrounding this topic has highlighted that there exists a non-linear effect of currency or exchange rate misalignment on economic growth (see
Aguirre and Calderón (
2005)).
The approach outlined in (
Krueger 1983;
Edwards 1989;
Williamson 1990;
Berg and Miao 2010), which is often referred to as the “Washington consensus view”, holds that the value of the exchange rate should be determined by both internal and external balances. According to
Mbaye (
2013), deviations away from this equilibrium level, i.e., exchange rate misalignments are associated with macroeconomic disequilibrium irrespective of the direction of the misalignment. In sum, under this view, both undervaluations and overvaluations are argued to be harmful to growth. An overvalued currency is associated with a loss of external competitiveness, a squeeze on the tradable sector and increased likelihood of balance of payments and currency crises (see for example
Cottani et al. 1990;
Ghura and Grennes 1993;
Loayza et al. 2005;
Krugman 1979;
Frankel and Rose 1996;
Kaminsky and Reinhart 1999). Furthermore,
Rodrik (
2008) argues that an overvaluation is associated with foreign currency shortages, rent-seeking and corruption, unsustainably large current account deficits, balance of payment crises, and stop-and-go macroeconomic cycles, all of which are damaging to economic growth.
Conversely, undervaluations are discredited on the grounds that it could produce unnecessary inflationary pressures and also limit the resources available for domestic investment, and for this reason curb the growth of supply-side potential according to
Williamson (
1990). Furthermore, as pointed out by
Nunnenkamp and Schweickert (
1990), cost push inflation can occur in the export sector and even diminish the competitiveness of a country’s exports if the country’s export sector relies heavily on imported inputs.
Krugman and Taylor (
1978) note that production may suffer on account of the fact that imported inputs get costlier following a real devaluation.
However, recent empirical studies proffer that overvaluations should be avoided as they impact negatively on economic growth whilst an undervaluation impacts positively on growth. The majority of the recent literature points to the latter, i.e., an undervalued real exchange rate on account of the fact that it leads to increases in private investment in the traded goods sector. An undervalued exchange rate affects growth through two main transmission channels, namely the “capital accumulation channel” and the “total factor productivity (TFP) growth channel” according to
Mbaye (
2013). Under the “capital accumulation channel” an undervalued exchange rate impacts positively on economic growth through an increase in the stock of capital in the economy. This channel operates exclusively in the tradable goods sector whose share in GDP increases, (see
Rodrik (
2008)); while a second string of literature posits that the stock of capital increases through the expansion of overall savings and investment (
Levy-Yeyati and Sturzenegger 2007;
Bhalla 2007).
Levy-Yeyati and Sturzenegger (
2007) show that depreciated exchange rates appear to induce higher growth, but this effect works largely through the deepening of domestic savings and capital accumulation, rather than through import substitution or export booms as argued by the mercantilist view. In other words, depreciated real exchange rates tend to increase the domestic saving rate, and a higher saving rate in turn stimulates growth by increasing the rate of capital accumulation.
The second transmission channel on the other hand places the structure of domestic production at the core of the analysis. An undervalued exchange rate results in an increase in the prices of tradable goods relative to non-tradables, thereby resulting in increased profitability of the tradable goods sector. This results in a shift in production away from non-tradables to tradable goods which are assumed to be characterized by a higher level of productivity, with the end result being an overall increase in productivity in the economy,
Mbaye (
2013)
5. “
Such economy-wide productivity improvement ultimately fosters growth”
Mbaye (
2013, p. 3).
Di Nino et al. (
2011) concluded that undervaluation can lead to increased export activity, particularly in highly productive sectors. In such an instance, there is an incentive to maintain the relative price of traded goods high enough to make it attractive to shift resources into their production. In
Aizenman and Lee (
2010),
McLeod and Mileva (
2011) and
Benigno et al. (
2015), the existence of learning by doing externalities to individual firms in the traded goods sector, calls for a weak exchange rate, i.e., an undervalued exchange rate to support the production of tradables. In these models, exchange rate undervaluation acts as a subsidy to the more efficient tradables sector according to
Habib et al. (
2017).
McLeod and Mileva (
2011) were able to show through a two-sector open economy growth model that a combination of “learning by doing” in the traded goods sector along with a weak REER which acts as a policy lever that moves workers into traded goods production faster, can lead to a surge in total factor productivity (TFP) growth
6. Specifically, their findings indicate that a 10% real depreciation of the exchange rate leads to a 0.2% increase in average annual TFP growth rate. Whilst results generated from a dynamic panel model indicate that the impact can be twice as large, ranging between 0.3% and 0.5%
7. Empirical results derived in
Mbaye (
2013) offer strong support to the TFP growth channel; whereby a 10% increase in undervaluation enhances growth on average by 0.14% via an improvement in productivity
8. Conversely, a 1% increase in overvaluation is associated with a 0.021% contraction in growth on average.
Rodrik (
2008) posits that a weak real exchange rate compensates for institutional weaknesses and market failures which lead to underinvestment in the traded goods sector in developing countries. Under both circumstances, Rodrik notes that an increase in the relative price of traded goods (i.e., through the weakening of the real exchange rate) “
acts as a second-best mechanism to partly alleviate the relevant distortion, foster desirable structural change, and spur growth” (p. 370). A policy measure of this nature encourages structural change, enhances export capacities and improves economic growth by shifting the internal terms of trade in favour of the tradable sector
Rodrik (
2009)
Freund and Pierola (
2008). Rodrik provides evidence via the use of a simple growth model for a small open economy, to support the fact that both institutional weaknesses and market failures (distortions) affect the traded sector more than they affect the non-traded sector.
Rodrik (
2009) is able to demonstrate through his model, that when the distortion in the traded sector is larger than in the non-traded sector, the traded sector is too small in equilibrium and hence a weakening of the exchange rate through a policy or other exogenous shock will have a growth-promoting effect.
Dollar (
1992) empirically illustrates that an overvalued exchange rate hampers economic growth. Conversely, whilst an undervalued exchange rate can spur economic growth, if the exchange rate is grossly undervalued this in turn can harm growth whereas modest undervaluation enhances growth prospects, (see
Aguirre and Calderón 2005).
Aguirre and Calderón (
2005) implemented a generalized method of moments (GMM) model for dynamic models of panel data developed by
Arellano and Bond (
1991) and
Arellano and Bover (
1995). The study consisted of a sample of 60 countries and the analysis spanned the time period 1965–2003. Specifically, the authors find that a small undervaluation of up to 12% is associated with a positive growth response. The authors also calculate the effect an additional 5% real undervaluation has on economic growth for countries with differing initial levels of exchange rate undervaluation. The results highlight that for a country with an initial undervaluation of 10%, a further 5% increase to the undervaluation of the exchange rate would result in a negligible increase in economic growth of only four basis points per year. However, an increase in the degree of real undervaluation from 20 to 25% would reduce the growth rate by 43 basis points per year, while a further increase in the undervaluation from 30 to 35% leads to an even more severe decline in economic growth (approximately 0.9% per year).
4. Model and Data
This study seeks to primarily examine T&T’s exchange rate misalignments over the period 1960 to 2016, and its impact on economic growth. The common thread in the literature to examine exchange rate misalignments is to estimate its deviations away from its equilibrium component utilizing a long run model, (see
Aguirre and Calderón 2005;
Elbadawi et al. 2012).
Montiel (
1999) argued that the long run equilibrium real exchange rate emerges from macroeconomic equilibrium in an economy where policy and exogenous variables are sustainable in the long run. Furthermore, an understanding of the fundamental factors that affect or influence a country’s exchange rate is vital. A proper understanding of those factors that influence an economies exchange rate, i.e., those factors that have an effect on the long run equilibrium exchange rate is key for policy makers on account of the fact that previous research has shown that maintaining REER close to its equilibrium rate is key to ensure the growth and stability of the economy along with maintaining the overall external competitiveness of the economy, (see
Elbadawi and Helleiner 2005;
Aguirre and Calderón 2005). Moreover, as noted earlier in the study, not only avoiding overvaluation is necessary for growth but a mild undervaluation may be good for growth, (see
Aguirre and Calderón 2005).
Following several studies in the literature, we model the fundamentals of T&T’s equilibrium exchange rate for the period 1960 to 2016 using the following econometric specification:
where REER is the real effective exchange rate index; Y is real GDP per capita in US dollars 2010; G is government consumption expenditure as a percent of GDP; NFA is net foreign assets as a percentage of GDP; CRP is domestic credit to the private sector as a percent of GDP; OILP is the real oil price; RESERVES is total reserves as a percentage of GDP and
α and
ε are the constant and error term respectively. All variables are taken from the World Bank’s World Development Indicators (WDI) online database with the exception of REER which is taken from
Darvas (
2012).
To estimate Equation (1), we implement the Autoregressive Distributed Lag (ARDL) approach to assessing cointegration, i.e., whether a long run relation exists amongst our variables, which was introduced by
Pesaran and Smith (
1995) and further developed by
Pesaran et al. (
2001). We choose to utilize this model over other cointegration tests such as the Johansen cointegration test given the number of advantages of using the ARDL approach, which are outlined by
Pesaran et al. (
2001),
Acaravci and Ozturk (
2012) and
Gasmi and Laourari (
2017). A major benefit to utilizing this model is that it can be applied irrespective of whether the series under investigation are stationary at I(0) or I(1) or a mixture of both. In contrast to the Johansen cointegration procedure, the ARDL approach can accommodate different orders of integration of the variables and pre-testing for a unit root is only necessary to ensure there are no I(2) variables, (
Salim et al. 2015;
Gasmi and Laourari 2017;
Nguyen 2017). Another advantage of the ARDL model is the fact that it takes into account the error correction model, which enables the model to simultaneously estimate both short and long-run coefficients, (see
Pesaran et al. 2001;
López Villavicencio and Bara 2008;
Sami and Kreishan 2012). As such, the ARDL model of Equation (1) is outlined below:
where ∆ is the difference operator,
α and
ε are the constant and error term respectively and
p is the optimal lag length which will be determined using Akaike Information Criteria (AIC) and Schwartz Information criteria (SIC) respectively. The coefficients on the differenced terms represent the short run relationships, whereas, the coefficients on the level terms, i.e.,
β1 to
β7 correspond to the long-run relationships.
To assess whether there exists a long-run relation amongst our variables, i.e., whether there exists a cointegrating relation, the ARDL bound test is implemented. If the calculated
F-statistic of the coefficients on the variables in levels is greater than the critical value bounds provided by
Pesaran et al. (
2001), we conclude that there is cointegration among our variables. On the other hand, if the
F-statistic falls between the critical value bounds, the results are inconclusive, or, if the
F-statistic is less than the critical value bounds, there is no evidence of cointegration among the variables. “
However, if the Wald or F-statistic falls inside these bounds, inference is inconclusive and knowledge of the order of the integration of the underlying variables is required before conclusive inferences can be made”,
Pesaran et al. (
2001, p. 290). When the order of integration of the variables under consideration is known and all the variables are integrated of the order of one, the decision is made based on the upper bound, whilst if all the variables under control are integrated of the order of zero I(0), the decision is made based on the lower bound,
Pesaran et al. (
2001).
In this study, due to data limitations, we are forced to utilize a small sample size of 56 observations. However, as pointed out by
Narayan (
2005), the upper and lower critical values of the F-distribution generated by
Pesaran and Pesaran (
1997) and
Pesaran et al. (
2001) were based on large sample sizes of 500 and 1000, as well as 20,000 and 40,000 replications, respectively. As such,
Narayan (
2004) and
Narayan (
2005) argued that the critical values generated by
Pesaran and Pesaran (
1997) and
Pesaran et al. (
2001) are not applicable to small sample sizes.
Narayan (
2004) compared the critical values generated for 31 observations and 4 regressors with the critical values reported in
Pesaran et al. (
2001) and found that the upper bound critical value at the 5% significance level is 4.13 while the corresponding critical value for 1000 observations is 3.49, which is 18.3% lower than the critical value for 31 observations. This along with the small sample size of 43 and 47 observations respectively in this present study led
Narayan (
2005) to calculate critical values for sample sizes ranging from 30 to 80 observations
9. As such, in this paper we also utilize the critical values generated by
Narayan (
2005) as a small sample size correction in order to ensure robustness of our cointegration results.
At this stage, we discuss the a priori expectations between the dependent and each of the independent variables. The literature highlights that an increase in government consumption can have one of two effects on the real exchange rate. This effect on the equilibrium real exchange rate depends on the composition of the consumption expenditure between tradable goods and non-tradable goods, (see
Ibrahim 2016). An increase in government consumption can either lead to an appreciation (positive sign) or depreciation (negative sign) of the exchange rate depending on whether this increased consumption is biased towards non-tradables or tradables respectively, (see
Edwards 1989;
Doroodian et al. 2002;
Naseem et al. 2009;
Wondemu and Potts 2016).
Rodrik (
2008) and
Acosta et al. (
2009) concluded that as GDP increases, the real exchange rate appreciates; hence we expect a positive sign for the GDP coefficient. Similarly to
Rodrik (
2008), we regress the real exchange rate against the per capita GDP to account for the Balassa-Samuelson effect. The reserves variable is expected to carry a negative sign, which suggests that any increases or accumulation of foreign exchange reserves will entail a depreciation of the exchange rate in order for the economy to be on its sustainable equilibrium level, (see
Wondemu and Potts 2016;
Habib et al. 2017). In regards to net foreign assets, Mariano et al. 2016 state that the accumulation of net foreign assets will lead to an appreciation (positive sign) of the exchange rate. Excessive credit to the private sector would boost domestic demand, worsen the CA, and appreciate (positive sign) the real exchange rate.
The a priori expectation is that the equilibrium REER will be more appreciated with higher terms of trade (TOT), (see
Elbadawi et al. 2012;
Doroodian et al. 2002). Given T&T’s large dependence on energy exports, which accounts for, on average, over 80% of the country’s total merchandise exports, we proxy TOT using the oil price.
Beckmann and Czudaj (
2013) expect that during periods of increased oil prices that the currencies of oil-exporting countries will appreciate as wealth is transferred to the oil exporting economies (in US dollar terms) on account of the fact that it is reflected as an improvement in exports and the current account balance in domestic currency terms.
Koranchelian (
2005) and
Zalduendo (
2006) examine the impact of oil price on the real exchange rate in two oil exporters, Algeria and Venezuela, respectively. Both authors conclude that the real oil price has an impact on the real exchange rate for both countries.
Koranchelian (
2005) finds that a 1% increase in the real oil price is associated with an appreciation of the REER of about 0.2% in the Algerian economy, whilst
Zalduendo (
2006) finds that a 1% increase in oil prices has almost a one-to-one effect on the real effective exchange rate (i.e., a 1¼% appreciation) in the Venezuelan economy.
6. Exchange Rate Misalignment
Upon estimation of Equation (2), we estimate the exchange rate misalignments (REERmis) as the difference between the natural log of REER and the natural log of the estimated equilibrium real effective exchange rate (EREER). We follow the works of both
Aguirre and Calderón (
2005) and
Elbadawi et al. (
2012) and compute the EREER by feeding the estimated model with the permanent components of the fundamentals, i.e., we multiply the estimated coefficients generated by the ARDL for Equation (2) by the permanent values of the fundamentals. To estimate the permanent component of the fundamentals, we utilize the Hodrick-Prescott (HP) filter (1997) technique as suggested by
Edwards (
1989) and
Alberola (
2003)
11. According to
Elbadawi et al. (
2012, p. 689) “
these permanent components are characterized as sustainable levels and are, therefore, consistent with the concept of equilibrium”. The results of the exchange rate misalignment are presented in
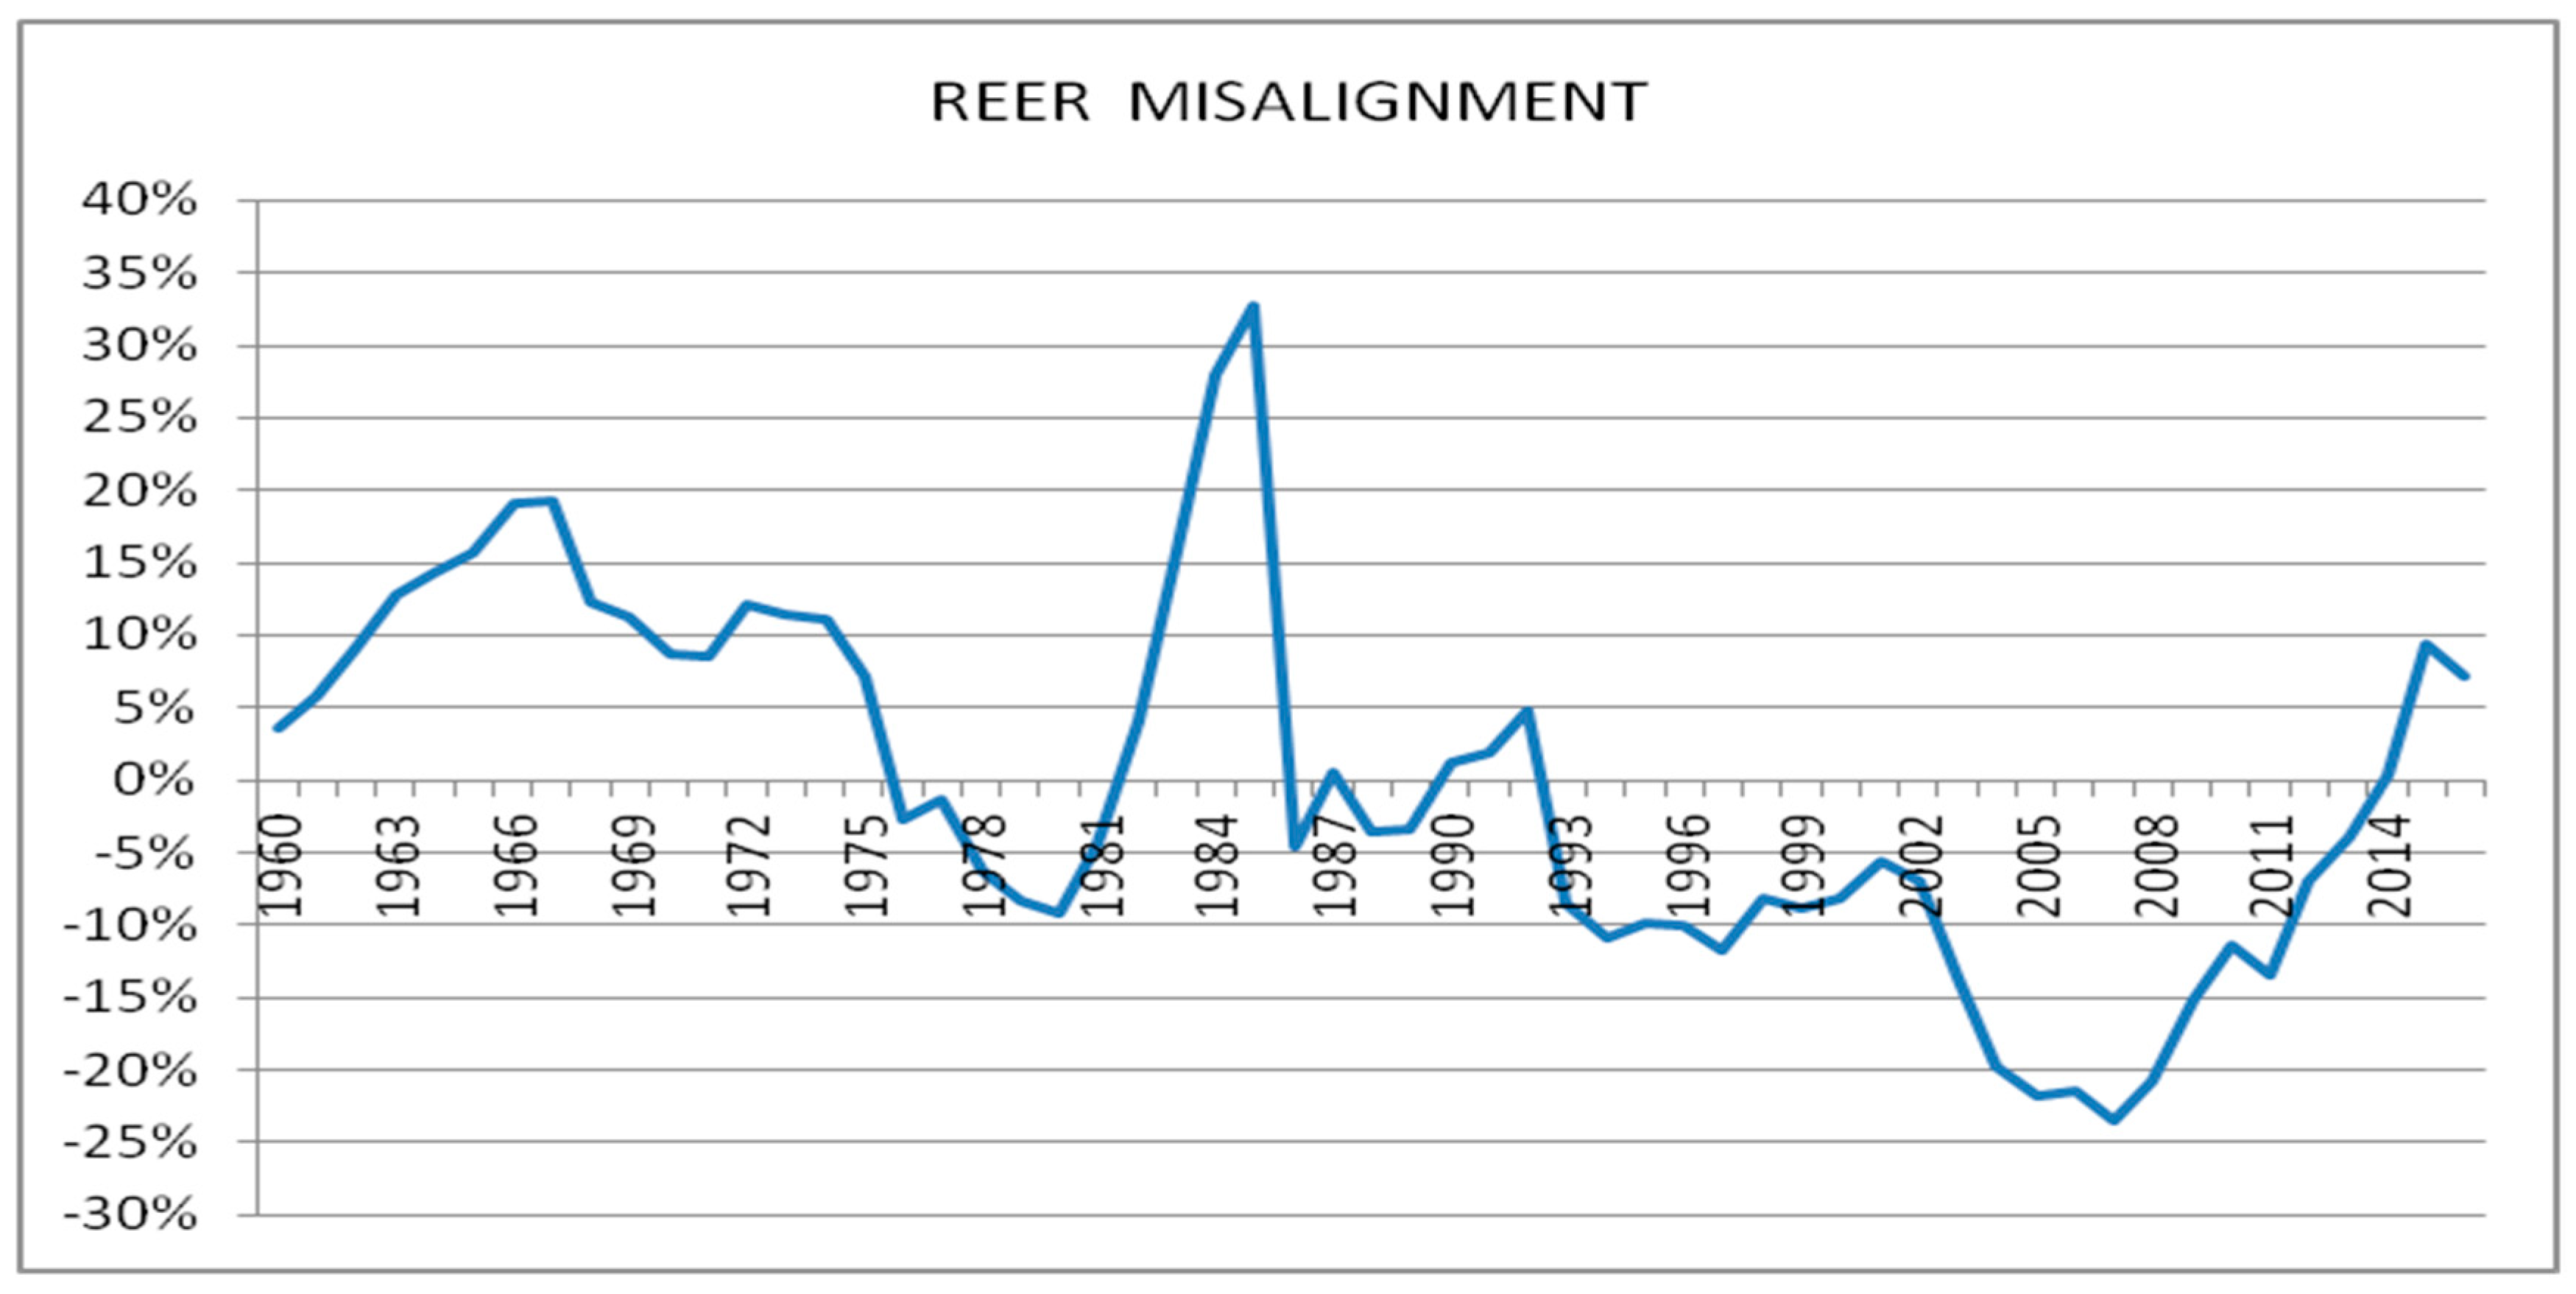
Figure 2.
Figure 2 depicts the extent of overvaluation (above zero in the vertical scale; i.e., depreciation pressures) and undervaluation (below zero in the vertical scale; i.e., appreciation pressures) for the T&T economy for the period 1960 to 2016.
Figure 2 illustrates that the REER had been significantly overvalued from the 1960s to mid-1970s, partly on account of the fixed or pegged nominal exchange rate system adopted in T&T over this period. From 1967 onwards the exchange rate began to move back to equilibrium which can be attributed to several devaluations that took place.
Figure 2 indicates that the real exchange rate was significantly overvalued in the period 1982 to 1985, peaking at 32.73% in 1985 which may have been on account of the drastic decline in growth and foreign exchange reserves experienced in the T&T economy during this time period. Real GDP growth for the period 1983 to 1985 averaged minus 6.73%, with growth declining from 3.8% in 1982 to minus 10.31% in 1983. Foreign reserves also declined rapidly in this period, falling from TT
$7.16 billion in 1982 to TT
$3.58 billion in 1985
12.
Post-1985, there was a drastic devaluation of the currency which was much more drastic and severe as a result of the recessionary pressures on account of depressed oil prices. In 1986, when international oil prices fell to less than US
$15 per barrel, Trinidad and Tobago experienced a precipitous fall in foreign exchange reserves. The Trinidad and Tobago currency was devalued from TT
$2.45 to 1 US
$ in 1985 to TT
$3.60 to 1 US
$ in 1986. These factors outlined contributed significantly to the sharp decline of the equilibrium REER in the short space of one year, which saw the REER moving from being overvalued by 32.73% in 1985 to an undervaluation of 4.62% by 1986. Fiscal adjustments and the implementation of the IMF package as outlined in
Section 2 of the paper resulted in the exchange rate moving back to equilibrium in 1992.
However, in 1993, when the Central Bank of Trinidad and Tobago (CBTT) devalued the nominal exchange rate and shifted to a managed float regime, the REER was undervalued by 8.54%. The exchange rate was further undervalued over the period 2002 to 2008, which was during the second oil boom which resulted in the T&T economy experiencing rapid growth and development, in addition to building up a large stock of foreign reserves which grew from US$2 billion in 2002 to US$10.6 billion in 2008. The exchange rate has been overvalued since 2014, with the majority of this owing to the decline in oil prices which occurred in mid-2014 which subsequently also resulted in a decline in foreign reserves in the T&T economy. This overvaluation can also be linked to the state’s intervention which continues to maintain the nominal exchange rate at a relatively fixed level to the US dollar through the CBTT. Furthermore, real economic activity stalled in the T&T economy, which recorded negative growth rates of 0.58%, 0.58% and 2.27% respectively for the years 2014, 2015 and 2016.
6.1. The Relationship between Real Exchange Rate Misalignment and Economic Growth in T&T
In this section we seek to examine the impact of exchange rate misalignments on the growth performance of T&T. Furthermore, we also test for non-linear effects by examining the impacts of overvaluations and undervaluations on economic growth. As noted earlier, the majority of the literature highlights that an overvalued exchange rate hampers or negatively affects economic growth whilst an undervalued exchange rate is generally thought of to be growth-enhancing in developing economies. However, we first examine the impact of real exchange rate movements on economic growth prior as a preliminary step in our analysis. In short, we aim to investigate the effects of appreciations (increases in the REER) and depreciations (decreases in REER) on economic growth in the Trinidad and Tobago economy which is susceptible to large appreciations due mainly to significant swings in oil prices (see
Table 3 in
Section 5). Other variables that were found to be positive and significant include output, government expenditure and net foreign assets; however, the volatility in these variables is not as pronounced as compared to oil prices in the Trinidad and Tobago economy.
Examining the impact that exchange rate movements have on economic growth is of particular importance in the case of T&T given its large dependence on the energy sector, which can result in the economy experiencing Dutch Disease type effects. The term Dutch Disease was first used by the Economist Magazine in 1977 to describe Netherlands declining manufacturing sector as the Dutch Guilder appreciated and is formally outlined and documented in
Corden and Neary (
1982). In the early 1960s, the Dutch economy experienced an export boom that was initiated by massive gas discoveries that led to an appreciation of the Dutch Guilder, which led to an overall reduction in the competitiveness of the Dutch manufacturing and industrial sectors as the real exchange rate further appreciated. A Dutch Diseased economy also tends to result in a more service-based economy as activity in the non-tradable or services sector picks up due to the influx of foreign exchange in the domestic economy which increases prices and profitability within the sector. The data in
Table A1 in the
Appendix A highlights this taking place in the T&T economy, as following windfall in the energy sector and a more gradual dependence on the energy sector, both manufacturing and agricultural output fell whilst the services sector as a share of GDP increased.
To examine the impact of real exchange rate movements on economic growth in the T&T economy, we estimate the following model:
where Y is real GDP per capita growth, and the control variables include inflation (INFLATION), gross domestic savings (SAVINGS), trade openness defined as the sum of exports and imports over GDP (OPENESS), and credit to the private sector as a percent of GDP (CRP)
13. The variable SAVINGS is deflated using the GDP deflator which was sourced from World Databank’s World Development Indicators (WDI) in order to take into account the effects of inflation on the respective time series.
Table 4 highlights that an increase (appreciation) of the REER impacts negatively on growth whilst on the other hand a decrease (depreciation) of the REER impacts positively on economic growth in the T&T economy. In particular, a 1% appreciation of the REER is associated with a 0.10% decline in economic growth. All coefficient signs are in line with our a priori expectation with the exception of the coefficient signs on trade openness and credit to the private sector, however, both are not statistically significant.
To examine the impact of exchange rate misalignments on economic growth in the T&T economy, we follow the works of
Aguirre and Calderón (
2005),
Elbadawi et al. (
2012),
Habib et al. (
2017) and estimate the following model:
where REERmis is the real exchange rate misalignment variable estimated in
Section 6 and the control variables are the same as in Equation (3).
The results from
Table 5 highlight that real exchange rate misalignments impact negatively on economic growth in the T&T economy. Specifically, a 1% increase in the misalignment is associated with a −0.16% decline in economic growth in the T&T economy.
6.2. Non-Linear Effects of Exchange Rate Misalignment on Economic Growth in T&T
We now examine whether the effects of real exchange misalignments on economic growth in the T&T economy display any non-linear effects. Specifically, we examine the impact of overvaluations and undervaluations respectively on economic growth in the economy. In order to test these hypotheses, we define the dummy variable Dt that takes the value of 1 when the REER is overvalued and 0 otherwise. Then, we define our variables of overvaluation and undervaluation of the REER as OVERVAL = REERmis * Dt and UNDEVAL = REERmis * (1 − Dt).
To examine the impact of overvaluations and undervaluations respectively on economic growth in the T&T economy, we estimate the following two models:
where OVERVAL and UNDERVAL denote the overvaluation and undervaluation indices of the REER respectively and the control variables are the same as in Equation (3).
The results surprisingly do not point to any non-linear effects, with both the dummy for overvaluations and undervaluations returning negative signs (see
Table 6 and
Table 7 respectively).
Table 6 highlights that an overvaluation of 1% is associated with a decline in economic growth in the T&T economy to the order of −0.25%.
Table 7 on the other hand highlights that an undervaluation of 1% is associated with a decline in economic growth in the T&T economy to the order of −0.21%. A possible reason for the fact that we find that an undervaluation does not promote economic growth in the T&T economy is due to its small and underdeveloped manufacturing sector which accounts for roughly 7.4% of GDP for the period 1966 to 2014
14. Furthermore, T&T’s manufacturing sector is heavily import-oriented, i.e., the sector relies heavily on imported materials/inputs in its production process. As such, undervaluations can result in an increase in cost push inflation in T&T’s manufacturing sector which ultimately reduces the competitiveness and profitability of the sector in line with the arguments put forth by
Nunnenkamp and Schweickert (
1990).
The literature highlights that an undervalued exchange rate promotes economic growth in developing economies through an increase in investment in the traded goods sector or manufacturing which is ultimately assumed to be the most productive sector in the economy, and ultimately boosts overall economic growth. However, unlike other developing economies in particular China and other east-Asian economies that experienced rapid and sustained growth through currency undervaluations, T&T as with other resource rich economies tend to be heavily dependent and reliant on its natural resources for both export and output growth in the economy. As such, this study proffers that the recommendation of maintaining a moderately undervalued currency in developing economies proffered in the literature may not be applicable to developing resource-rich economies where the manufacturing sector tends to be small and underdeveloped. Indeed these results serve as a stepping stone for the conduct of further research into this finding for a panel of resource-rich developing economies.
7. Conclusionand Policy Recommendations
This paper examined the impact of exchange rate movements as well as exchange rate misalignments on economic growth for the Trinidad and Tobago economy over the period 1960 to 2016. Empirical studies (
Aguirre and Calderón 2005;
Rodrik 2008) have demonstrated that developing countries experience economic growth through an undervalued exchange rate and that exchange rate overvaluations have negative long-term effects on economic growth. Conversely, the “Washington consensus view” holds that deviations away from REER equilibrium, i.e., both over and undervaluations affect economic growth negatively. In recent times, T&T’s foreign exchange reserves have been on the decline on account of the unexpected decline in oil prices experienced in mid-2014. In addition to waning foreign exchange reserves, the T&T economy also experienced a rapid decline in growth, coupled with an increased stock of debt as fiscal deficits widened in addition to declining current account balances that deteriorated significantly. This resulted in added depreciation/devaluation pressures on the exchange rate for the T&T economy, resulting in agencies such as the IMF indicating that the currency has been significantly overvalued as the state maintained a relative fixed exchange rate to the US
$.
Therefore, this paper firstly examined T&T’s exchange rate misalignments for the period 1960 to 2016 using an ARDL approach to assessing cointegration which was proposed by
Pesaran and Smith (
1995) and further developed by
Pesaran et al. (
2001). The results derived from the ARDL bound test indicated that there does in fact exist a cointegrating relationship amongst the REER and its fundamentals. In particular, the results of the ARDL model indicated that increases in output, government spending, net foreign assets and the oil price all result in an appreciation of the exchange rate in the T&T economy. Conversely, increases in credit to the private sector and the level of foreign exchange reserves has a depreciating impact on the exchange rate, however, the former is not statistically significant at any conventional levels of statistical significance.
Given that a long-run relationship was found, we subsequently estimated T&T’s exchange rate misalignments as the difference between the natural log of REER and the natural log of the estimated equilibrium real effective exchange rate (EREER). The results highlighted that T&T’s exchange rate has in fact been overvalued since 2014, with the average overvaluation amounting to 5.66% with a peak of 9.5% in 2015. The paper subsequently examined the impact of both exchange rate movements and misalignments on economic growth. The results highlighted that both exchange rate appreciation and misalignments impact negatively on economic growth in the T&T economy. Additionally, we find that there exists no non-linear effects of exchange rate misalignments on growth. Specifically, we find statistically significant evidence that both overvaluations and undervaluations hamper economic growth in the Trinidad and Tobago economy.
Given T&T’s heavy reliance on the energy sector, a major policy concern lies in relation to the impact that fluctuations in the price of oil can have on the REER. Oil price fluctuations can be transmitted to the domestic economy through the fiscal channel, see
Pieschacón (
2012) and
Lorde et al. (
2009).
Lorde et al. (
2009) highlighted empirically that oil price volatility is transmitted through the fiscal policy channel on T&T’s domestic economy. Adding to this,
Hosein et al. (
2017) provided empirical evidence that T&T followed a procyclical fiscal stance. This sub-optimal fiscal policy stance can have an overall bearing on the exchange rate during periods of booms and bust in the business cycle, which is strongly related to the energy sector and by extension, the price of oil in T&T’s case. During periods of booms, government spending increases and thus may lead to an appreciation of the currency and conversely, during downturns, government expenditure contracts resulting in depreciating pressures exerted on the currency.
Hasanov et al. (
2017) examined the impact the price of oil has on exchange rate movements for three oil exporters, namely Azerbaijan, Kazakhstan and Russia. The authors point out that policy makers should reconsider the fiscal policy stance adopted in these countries in lieu of a more countercyclical stance, since oil prices lead to an appreciation of the REER mainly through higher domestic prices, which is on account of excessive public spending.
Raymond et al. (
2017) investigated whether a sovereign wealth fund (SWF) helps to reduce real exchange rate misalignments by dampening the transmission of energy prices. In particular,
Raymond et al. (
2017) examined the relationship between a SWF and the REER and found that a SWF reduces the volatility of REER misalignments by dampening the transmission of energy prices. As noted in
Hosein et al. (
2017), a SWF plays a major role in economies such as T&T given its large dependence on these resources. A major policy recommendation stemming from these findings in the paper would be for the critical reassessment of the rules governing T&T’s Heritage and Stabilization Fund (HSF), i.e., T&T’s SWF, as government expenditure was allowed to follow energy revenues due to its current limitations.
The HSF was officially legislated on the 15th of March 2007, replacing the Interim Revenue Stabilization Fund (IRSF) that covered the period 2000 to 2007. The purpose of the Fund is to save and invest surplus petroleum revenues derived from production business in order to achieve three main objectives. See the Heritage and Stabilization Fund Act, 2007 for an outline of these objectives (note this is footnoted in the updated manuscript). The surplus petroleum revenues are invested in external capital and money markets, under the management of the Central Bank of Trinidad and Tobago (CBTT). This investment of surplus petroleum revenues in external markets can then help to limit in the short run the pass through effects of oil price variations to the real exchange rate,
Das et al. (
2011).
Raymond et al. (
2017) points out that the Dutch disease effect, i.e., an appreciation of the real exchange rate following a resource windfall can be mitigated by investing part of the natural resource rents abroad.
It is pivotal, therefore, that the current rules be amended to allow for a larger proportion of the petroleum revenues to be saved in the HSF, which would allow for the decoupling of these revenues from the budgetary process in order to dampen the transmission of energy prices in the domestic economy, see
Hosein et al. (
2017). The rules governing the HSF need to play a significant role, in reducing the effects of oil prices on the domestic economy as well as the REER in the T&T economy.


