Causality in Vietnam’s Parallel Exchange Rate System during 2005–2011: Policy Implications for Macroeconomic Stability


Faculty of Economics, Srinakharinwirot University, Bangkok 10110, Thailand
Economies 2018, 6(4), 68; https://doi.org/10.3390/economies6040068
Submission received: 5 October 2018
/
Revised: 20 November 2018
/
Accepted: 21 November 2018
/
Published: 12 December 2018
(This article belongs to the Special Issue Exchange Rate Dynamics)
Abstract
:As in many transition economies, Vietnam has experienced a multiple exchange rate system with three exchange rates having co-existed. This paper uses the Vector-Error-Correction model and the Granger tests to investigate the relationship between the official and black market exchange rates from January 2005 to April 2011. The results confirm a long-run relationship between the official and parallel market rates of the Vietnam dong against the U.S. dollar. The short-run dynamics of two exchange rates suggest that the official exchange rate causes the black exchange rate, but not vice versa. This conclusion is valid for both a sub-period of stability and a sub-period of vibrant fluctuations, with February 2008 as the cut-off. The findings also reject the efficiency hypothesis of the black market for foreign exchange and support the policy choice of the State Bank of Vietnam not to follow black market signals in managing official exchange rates for macroeconomic stability.
JEL Classification:
F31; E52; E58; C321. Introduction
The exchange rate system in Vietnam has experienced different episodes due to macroeconomic fluctuations and changes in exchange rate policy following the economic reforms in the late 1980s. This includes a period of free floating in early 1990s, and a pegging system during 1993–1996. A de jure “managed floating” regime was declared by the State Bank of Vietnam (SBV) in 1999, although a stability of a nominal official exchange rate was observed in the sub-period of 1999–2007. From 2007 to 2011, there were important changes in exchange rate policy, typically more frequent devaluations towards greater flexibility of the nominal exchange rate.
Under prevalent foreign exchange controls, distorting official market exchange rates, there have been three exchange rates co-existing in Vietnam: a central or reference rate determined by the central bank, a commercial bank exchange rate in the official market, and a parallel market exchange rate.
The theoretical foundation of the multiple exchange rate system in general, and particularly the parallel or black foreign exchange markets, was vigorously studied in 1980s (Dornbusch 1986; Huh et al. 1987; Koveos and Seifert 1985; Nowak 1984; Phillips 1988; Pinto 1988). Agénor (1992) provided an extensive review on the modeling approaches to analyse the operation of the parallel exchange rate system with three major perspectives: the “real trade” approach, the portfolio balance or currency substitution approach, and the monetary approach.
However, studies on the effects of black markets were not paid sufficient attention for most of the 1980s, in regard to analysing stabilization and liberalization policies. In the 1990s, some notable studies that focused on the effects of devaluation and stabilization policies in the presence of black markets were Agénor (1990); Ghei et al. (1997); Kamin (1995); Lizondo (1991); and O’Connell (1995). Another strand of the literature examined the impact of black markets on the outcome of a unification policy. For example, Pinto and Kharas (1989) suggested that relying on nominal exchange rate rules to unify official and parallel rates could be tricky, and that the only way to achieve unification was by abandoning rationing in the official market and moving to a float overnight. Even in this case, a credible fiscal package would be needed to compensate for the loss of revenues as a result of unification. Otherwise, an untenable post-unification rate of inflation could emerge.
The existence of a parallel exchange rate, therefore, has certain implications on the impact of macroeconomic policies. Understanding the relationship between the official and parallel exchange rates is essential. Ghei and Kamin (1999) sketched a partial equilibrium framework to analyse how the parallel market rate could be used as a guide to set the official exchange rate and as an indicator of the long-run equilibrium exchange rate. Azam (1999) presented a simple analytical model for discussing the appropriate pricing policy for exchange rates, and supported the view that the government should select a low and constant rate of crawl, rather than attempt to catch up on the changes in the parallel market. This policy, if credible, would result in a low inflation rate and low parallel market premium. In the case of Vietnam, a study by Bui (2011) estimated that the equilibrium exchange rate in a unified foreign exchange market could be around 5–8 percent higher than the prevailing official rates during 2007–2009, and tested the efficiency hypothesis for this market.
Recent devaluations in Vietnam during 2008–2011 occurred in the context of rising black market exchange rates. Tensions in the official market, and a recorded high level of exchange rate premium, raised some doubts that the black market exchange rates could predict changes in the official rate and that it could reflect the expectation in the official market as well. If this is true, such movement would indicate a reaction of the official market in response to shocks in the unofficial market. At the same time, it would also answer the question on whether the SBV had been passive in managing the foreign exchange market, with policy actions led by the free market. To provide a certain answer for this question, an examination on the causality between official and parallel exchange rate would be a worthy study. Moreover, in a considerably dollarized economy like Vietnam where the effectiveness of monetary policy is limited, exchange-rate policy has important macroeconomic impacts.
This study had three goals. Firstly, it tests a hypothesis that there is a long-run, stable relationship between the official and the parallel market exchange rates in Vietnam’s exchange market. Secondly, it examines the short-run dynamics in the relationship between the two exchange rates. By fulfilling these objectives, the paper contributes to the literature by providing a piece of evidence on the long-run relationship and causality in the foreign exchange markets of developing countries in economic transition and the stabilization process. It also answers the enduring questions of whether the parallel exchange market is efficient and can be used as a guide to setting the official rate in Vietnam. Thirdly, the paper also investigates the linkage of exchange rates to inflation, and vice versa—by which it partly explains the coincidence of high inflation and high premium, in the case of Vietnam.
Our findings were found to be consistent by two different methods: the vector-error-correction model (VECM) (Granger 1983), and the Granger causality test (Granger 1980). As did many empirical studies, we found a long-run relationship between the official and parallel exchange rates. This was also true for both sub-periods, from January 2005 to February 2008 with fairly stable exchange rates, as well as the later period from March 2008 to April 2011 with more vibrant fluctuations and a larger exchange-rate premium. The findings, therefore, justify the SBV’s actions in managing the foreign exchange market. It also rejects claim that the central bank was not being proactive in controlling foreign exchange rate fluctuations since 2008, but rather that it followed the parallel market’s signals which were causing disturbance in the foreign exchange market for U.S. dollars in Vietnam.
The conclusions we made here are somewhat in line with findings from other studies for developing countries. For example, using a monetary approach, Odedokun (1996) used quarterly data from 18 African countries during 1980–1991 to show that the official exchange rate caused the black-market rate. Agénor (1991) also used a monetary model for 12 developing countries, and found that the official rate caused the black-market rate. On the other hand, our results contrast with other papers’ findings, such as that of Apergis (2000) who showed that black market rates Granger caused the official rate in Armenia in the period from November 1993 to April 1994. In the same regards, Baliamoune-Lutz (2010) used the VEC model to estimate monthly data from Morocco to reject weak exogeneity in the case of the official exchange rate, but failed to reject it in the test for the black market exchange rate, thus supporting the efficiency hypothesis of the black market.
1.1. Related Empircal Literature
The period from the 1980s–2000s was a time with a rapid spread of the multiple exchange rate system in the developing world. Following the theoretical framework described in the introduction of this paper, there have been different models and techniques on the empirical side used to examine the long-run and short-run relationship between the parallel and official exchange rates. Those include the general and partial equilibrium model, OLS regressions, error correction model, and the cointegration and Granger causality tests. Empirical results are also diversified in different countries through using different methods. While most of the studies consistently showed a long-run relationship between the two exchange rates, the causality between them in the short-run varies. Some papers found that the official exchange rate caused the free market rate, while others found a vice-versa relationship, where parallel market rates caused official market rates.
A more recent analysis of the parallel exchange rate causality by Baliamoune-Lutz (2010) showed that the black market and official exchange rates had a long-run relationship during the period from January 1974 to December 1992 in Morocco. Using the VEC model estimation on monthly data, the study indicated that the black rate Granger-caused the official exchange rate. It also suggested that participants in the black market were able to anticipate changes in the official market, thus supporting the efficiency hypothesis. In another piece of research for Tunisia during the period of 1972–1998, Baliamoune-Lutz and Lutz (2008) used Granger causality tests to show that in the short run, the black-market exchange rate caused the official rate, and that the black-market rate adjusted to the long-run equilibrium. A test for a structural break was identified at the time of the current account convertibility, and the black market was found to have Granger-caused the official market, though only during the period preceding the break. Conversely, in Nigeria, Ashworth et al. (1999) found that over the period of 1980–1993, the official rate Granger-caused the parallel rate only when accounting for structural breaks. Apergis (2000) found that there were three types of causality directions between official and black-market rates in Armenia for each sub-period during 1993–1997. From November 1993 to May 1994, the black market exchange rate Granger-caused the official exchange rate, whereas from November 1994 to January 1997, vice-versa causality took place; and during the short period in between, a bilateral causality relationship between the two exchange rates was present.
Among the cross-country studies, Agénor (1991) tested a monetary model of the parallel foreign exchange market for a group of 12 developing countries. Econometric results using quarterly data showed that changes in official exchange rates and monetary disequilibria were the major determinants of the behaviour of parallel exchange rates. Agénor and Taylor (1993) examined the causal relationship between official and parallel exchange rates in 19 developing countries, based on the statistical theory of cointegration and Granger causality tests. The application of the procedure to monthly data covering a 13-year period suggested no clear causality pattern across the countries. The latest cross-country study was done by Kula et al. (2014), which found evidence on a proportional long-run relationship between black and official market exchange rates in a sample of 13 Middle East and Northern African (MENA) countries from 1970 to 1998. The hypothesis of the portfolio balance model was also confirmed. However, the short-run dynamics still remain heterogeneous across countries. Similarly, Noorbakhsh and Shahrokhi (1993) tested the causality by using a sample of 12 countries across continents, and showed that for seven countries, black market rates Granger-caused the movements of official rates, while there was no causal relationship between the two rates in the remaining five countries.
Phylaktis and Kassimatis (1994) looked into the long-run dynamic relationship between black and official markets for seven Pacific Basin countries over the period of 1974 to 1989. The evidence showed a constant long-run black-market premium, as well as black-market rate adjustment to eliminate the deviation from its long-run value. The speed of adjustment varied, depending on the financial development of the country. In addition, there was evidence of weak-form inefficiency in the black markets. Similarly, evidence against the standard portfolio theory of black-market behaviour was found in the work of Moore and Phylaktis (2000) in a number of major Pacific Basin countries, over the period of January 1974 to June 1992. In contrast, Diamandis and Drakos (2005) investigated the long-run dynamic relationship between official and black-market exchange rates for four Latin America markets—namely, Argentina, Brazil, Chile, and Mexico. Their findings indicated a constant black-market premium for each country, which was taken as strong support for long-run informational efficiency between the official and black markets for foreign currency. In addition, the evidence of short-run predictability showed the optimal arbitrage by rational economic agents, rather than the violations of market efficiency. Research by Yunus (1997) analysed the dynamics between the official and parallel market exchange rates in five South Asian countries. While the evidence showed a strong long-run relationship between the two rates, evidence of a direct causal relationship between the two rates was very weak.
Finally, with regards to the macroeconomic stabilization policy, Pinto and Kharas (1989) used the assumption on a rationing mechanism to discuss the experience of Bolivian and Pinto (1991) to examine the inflation experience of African countries. They presented an explanation for the dynamics of high inflation based on policy rules governing depreciation of the official nominal exchange rate in the presence of high black-market premia. It showed a common rule-of-thumb that reducing the premium on foreign exchange in the black market, by depreciating the official exchange rate towards the black-market rate, could permit hyperinflation. The fundamental need was to coordinate fiscal and exchange rate policy in either attempting to minimize black market premia or lowering inflation.
In Vietnam, there have been a number of studies looking at the parallel exchange rate of the country, as mentioned in the introduction. To the author’s knowledge, however, the causality between exchange rate in this market has not been investigated adequately, either as an individual case study or cross-country study. The latest study was conducted by Bui (2014) using a two-stage, least-square model to conclude that the official exchange rate also positively affected the parallel market exchange rate with a 1 percent devaluation of the official exchange rate, bringing about a 1.33 percent devaluation in the parallel market during the period of 1995–2007, suggesting that the SBV’s efforts to reduce the market premium would not be successful because devaluation in the official market would lead to depreciation in the parallel market. Our current study covers the later period until June 2011, which includes the episodes of frequent devaluations so as to be able to verify the previous claims and policy suggestions.
1.2. Parallel Foreign Exchange Market in Vietnam
The exchange rate system in Vietnam has experienced different episodes since the country started its “doi moi” economic reforms in 1986. The first episode of free-floating accompanied the period of macroeconomic stabilization in the late 1980s, followed by a pegging system in 1993–96. The financial crisis in Southeast Asian economies in 1997 also caused the State Bank of Vietnam (SBV) to devalue its currency. Since 1999, a de jure managed float regime was declared by the SBV, although noticeable stability of a nominal official exchange rate was observed in the sub-period of 1999–2007. The band for official exchange rate fluctuation was kept unchanged at ±0.25 percent from July 2002 until December 2006. As a result, the exchange rate regime in this period was classified to the category of conventional pegged arrangement, effective from 1 January 2005 according to the IMF de facto classification (IMF 2006). The rate of depreciation was announced by the SBV governor to be within 1 percent. From 2007 to 2011, there were important changes in the exchange rate policy, typically being that more frequent devaluations towards greater flexibility of the nominal exchange rate had been announced. Figure 1 below summarizes the development of the exchange rate regime in Vietnam in each of the periods.
In particular, starting from late 2007 and early 2008, the SBV started widening trading bands for commercial bank foreign exchange transactions, from ±0.5 to ±0.75 percentage points in December 2007, then to ±1 percentage points in March 2008. Tensions in foreign exchange markets were intensified by inflation pressures in the first half of 2008 due to an upsurge in prices of oil and food all over the world, amongst an overheating domestic economy. The inflation rate at the end of the year 2008 was recorded at a very high level of 20 percent. Since October 2008, the economy also had a sign of an economic downturn following the outbreak of a global financial and economic crisis. The foreign exchange market also showed signs of instability. Constant episodes of devaluation, twice in 2008 (June and December), once in 2009 (November), and twice in 2010 (February and August) and February 2011, notably followed several “fevers” in global gold prices and a large gap between the official and parallel market rates. The value of the Vietnam dong had lost 5.4–5.7 percent annually form 2008–2010 in nominal terms. The largest devaluation of 9.3 percent was in February 2011. Takagi and Pham (2011) showed that the regime had shifted from a basket peg to a simple U.S dollar peg following the global crisis in 2008–2009.
Soaring inflation rates, in combination with VND depreciations, have earmarked this period with lots of macroeconomic turbulences. Exchange-rate bands were also continuously extended to ±5% in March 2009, which then shrank to ±3% at the time of devaluation in 2011. The IMF in early 2009 classified the exchange rate system of Vietnam for 2008 as the “other managed arrangement”, which was then reclassified as “stabilized” against the U.S. dollar, effective from 1 January 2009 (IMF 2010).
1.3. Dollarization and Inflation in Vietnam
Under the central bank’s exchange rate management policy and foreign exchange controls, there have been three exchange rates co-existing: a central or reference rate determined by the central bank, a commercial bank exchange rate in the official market, and a free or parallel market exchange rate. Although the exchange rate premium of the two markets has not been very high relative to many less-developed economies, the black market for foreign exchange in Vietnam prevailed for a long time; the size of this market is also believed to be large, given the degree of dollarization in the economy. Typical motives for dollarization had been the hedging for inflation and assurance for the value of money during the early stages of economic reform. Vietnam used to experience a period of hyper-inflation (over 700 percent) in the mid-1980s, which then considerably reduced to 36 percent in 1989, remerging to 67 percent in 1991 when a macroeconomic stabilization policy was implemented. Figure 2 shows that during the mid-1990s to 2007, although inflation had been controlled at acceptable one-digit rates, dollarization was still prevalent in the Vietnam economy. Inflation rate emerged again in 2008 to nearly 20 percent per annum. Monthly data in that year showed that inflation started to speed up during March–April 2008, which was about two months ahead of the widened exchange rate premium in the black market.
The companion to dollarization is a persistent parallel market for foreign exchange in Vietnam. Because of capital controls, residents cannot freely hold foreign assets, so the store of value with foreign currencies is obviously an alternative in the residents’ portfolios. In addition, current account transactions are constrained by exchange controls, and excess demand for foreign currency for imports in the official market can also be satisfied in this parallel market. Therefore, this market serves both purposes.
For the purposes of the portfolio, foreign currencies are both kept in the form of cash and in bank deposits, since foreign currency deposits (FCD) are allowed in Vietnam. Foreign currency cash in circulation may come from different channels, such as overseas Vietnamese remittances, labour compensation paid by non-residents, tourists’ expenditure, and smuggling. Multiple channels and the nature of those sources make it difficult to measure precisely the degree of foreign notes held by households. A study by Nguyen (2002) calculated that about 2.5 billion USD (equivalent to 41 percent) in cash had been accumulated in circulation. However, these numbers might still be underestimating the amount of foreign currencies circulating in cash, because in 1995, the IMF’s calculation showed that there was already about 2.5 billion USD being held in foreign currencies, and about 3 billion USD held in gold by the public. The degree of dollarization was measured as a ratio of foreign currency deposits to M2, which reduced to 20 percent in 2007 (Vo et al. 2000; Vo and Quang 2008).
Goujon (2006) estimated the relevant shares for money supply in 2000. According to these estimates, total foreign currency accounted for a substantial share of 42 percent of the total money supply in Vietnam in 2000, of which foreign currency in circulation was 16 percent, and foreign currency deposits was 26 percent.
The U.S. dollar has also been used as a means of exchange; despite the prevailing foreign exchange regulations forbidding the use of USD for commercial transactions domestically, a large amount of foreign currencies has been used for many payment transactions in a parallel market. The relative size of the parallel market to the official market is not small, though precise measuring is impossible. Nguyen (2006) estimated that the black market accounts for about 20 percent of the total foreign exchange transaction volume. Transactions in the official exchange market between banks and their customers are small compared to the foreign trade volume (import and export), being 53 percent in 2002–2003 and only 33 percent in 2005 (Mai 2007). Similarly, the interbank foreign exchange market was even smaller in terms of market turnover compared to the foreign trade volume at only 0.6–0.8 percent, compared to 4.8 percent in Thailand and 14 percent in Hong Kong in 2007 (Nguyen and Duc-Tho 2009). This fact suggests that a substantial proportion of international trade could be conducted without going through the official foreign exchange market.
There was often some kind of intensified administrative control to scrutinize the operations of the parallel market for foreign exchange, which seemed to be more vibrant—such as the police intervention of the parallel market in Hanoi and Ho Chi Minh city in March 2011 following the largest devaluation in the month before, or the intensified inspection for foreign exchange at all border checkpoints in the past (Vo et al. 2000).
2. Methodology
The data used for the following analyses and tests includes monthly series of the official (reference) exchange rate from the State Bank of Vietnam (SBV) and the official rate which has been defined as the average inter-bank exchange rate at the SBV transaction floor of the previous day since 1999. Meanwhile, the data on parallel or black market exchange rates come from different sources. The selling price of the U.S. dollar was quoted at major gold shops in Hanoi and Ho Chi Minh city, the two largest business centers of the country. This information is available in local newspapers and websites, typically http://vnexpress.net/gl/kinh-doanh and http://currency.vn. Data were recorded on a daily basis in order to calculate the monthly average. This data is reliable in the sense that the SBV used it to publish parallel exchange rates before 2000, which was collected from the same source. Data on commercial bank rates is available, especially from the Joint Stock Commercial Bank for Foreign Trade of Vietnam (Vietcombank), but we preferred not to use that data in most of our tests since it was regulated within the exchange rate bands which were also decided by the SBV in different periods of time.
To perform the analysis, monthly data of official and parallel exchange rates was compiled from January 2005 to April 2011 based on daily series. They must have been subject to the availability of unofficial parallel exchange rate data, since the VEC model does not allow for missing data. We selected the starting point of 2005. This is the year that the IMF classification of Vietnam’s exchange rate system turned into a conventional pegged arrangement (IMF 2006), and the Foreign Exchange Ordinance was promulgated by the Vietnam’s National Assembly, recognizing a full convertibility of the current account. Meanwhile, March 2011 was chosen because it marked the point in time where there was a more “tranquil” latter half of 2011 in the foreign exchange market. It was also a time of preparation for a new Governor’s term at the SBV.
Table 1 provides some statistical characteristics of the data set. The whole period of study is broken down into two sub-periods, with February 2008 as the cut-off point to differentiate the period of fairly stable exchange rates, and the later period with more vibrant exchange rate fluctuations. This was also a time of major change in exchange rate policies in Vietnam. From early 2008, the SBV started to widen the exchange rate band to 1 percentage point following more frequent devaluations, changing the classification of the exchange rate system from “conventional pegged” to a “managed” and “stabilized” arrangement. Figure 3 clearly shows the difference in the performance of multiple exchange rates in Vietnam between the above-mentioned two sub-periods.
In the period preceding March 2008, the means of the three exchange rates are shown to be very similar, and their movements, as shown in Figure 1, are very close because the exchange-rate band regulated by the SBV was a very narrow 0.5–0.75 percentage points from late 1999 to early 2008. The small standard deviations of all three rates also indicate minor fluctuations. Conversely, the later period starting from March 2008 provides a different picture of the foreign exchange market in Vietnam, with higher volatility in all three rates and a larger premium of black-market rates, in comparison to official rates and commercial bank rates. The premiums in between the means are calculated at 5.6 percent and 2.6 percent, respectively. The difference between the official and bank rates in the later period is clearer due to the wider exchange-rate bands allowed by the SBV during that time, from 1–5 percent.
Since exchange-rate series are usually non-stationary, we needed to test for this property first before adopting the methodology of the Vector-Error-Correction (VEC) model. This model was used by Azam (1999) to test for causality between the official and parallel exchange rates. The model’s technique included several steps, such as testing for stationarity, testing for cointegration, and then running the Vector Autoregression (VAR) model.
We also performed for Granger causality tests between the two exchange-rate series using the vector-autoregressive VAR model (Greene 2003) to find the impact of short-term changes in the parallel exchange rates on the short-term changes in official exchange rates, or vice versa, besides the error-correction term. Causality, defined in this sense, was inferred when lagged values of one exchange rate had explanatory power in a regression of another exchange rate on its own lagged values, and which provided information to predict another exchange rate. This Granger causality can be tested for a two-way relationship between the official and parallel rates.
To perform an analysis of causality, we preferred to test the causality between the official reference rate announced by the SBV and the parallel market rate, while ignoring the bank rate. The reason is that reference rates reflect a policy variable, while the bank rates’ movement strictly follows the band set by the SBV. Figure 1 shows that the two official exchange rates tend to have a long-run co-movement, suggesting co-integration. However, the behaviour of the two exchange rates appears to be non-stationary. This needs to be confirmed by formal tests for stationarity.
Phillips-Perron tests are performed to see whether a variable contains a unit root. As suggested by Ashworth et al. (1999), when the parallel market may contain structural change, the Phillips-Perron tests can be considered to be more appropriate than the augmented Dickey-Fuller tests. The tests have been done for two exchange rates, as well as the price indicator, or consumer price index (CPI) for our later analysis on the relation between exchange-rate volatility and price stability. Results in the upper half of Table 2 indicate that we cannot reject the null hypothesis that the two rates and CPI contain unit roots. The transformation into logarithm also does not help to reject the null hypothesis. Logarithmic forms of the two rates and CPI are also non-stationary.
However, first-differencing the two exchange rates as well as their logarithm forms bring opposite test results. The lower half of the table shows that first-difference variables are all stationary at a 1 percent significant level. In other words, the null hypothesis that differenced variables contain unit roots has been rejected with very low p-values. A graphical presentation of the differenced variables is shown in Figure 4. In summary, the two series of exchange rates and price indicator are integrated of order 1, I(1).
3. Results
3.1. Long-Run Cointegration or Equilibrium Relationship
Figure 1 in the above section shows that the two exchange rates tend to have a long-run co-movement, which may cause spurious regression in time-series analysis. Johansen’s framework with the VAR approach was used to estimate the cointegrating rank in Stata software. This test can identify whether there exists a cointegrating vector or linear combination between the two exchange rates, meaning that the two rates have a long-run equilibrium relationship.
Table 3 summarizes the test results for five different model specifications, with respect to constant and trend in co-integrating equations data in level forms. We tested the hypothesis on the maximum number of rank or co-integrating vectors. It was found that for three among five specifications, there is a unique co-integrating vector (specifications 1, 2, 5). No conclusion can be made on the remaining two specifications with trends, since we cannot reject either the null hypothesis that there is no co-integrating vector, or the hypothesis that there is one co-integrating vector at most. Therefore, the long-run equilibrium relationship between the official exchange rate and black market exchange rate can only be confirmed in three out of five Johansen’s specifications without time trends. In such cases, it is possible to estimate the co-integrating relationship, as well as investigate the short-run dynamics of the two rates.
3.2. Short-Run Dynamics and Causality
In this section, we specify the VAR model, taking into account the long-run relationship observed from the above analysis. Suppose there are two I(1) time series, Xt and Yt, which are cointegrated by the cointegrating vector [1, −θ], then the term (Yt − θXt) presents equilibrium errors. The error terms need to be stationary I(0) so that we can estimate the so-called VEC model and examine the short-run dynamics of the relationship between Xt and Yt (Greene 2003).
Table 4 summarizes VECM estimates and the estimated long-run (cointegration) relationship between logarithms of official and black-market rates for three specifications without time trends. Cointegration equations should be read from the lower part of the table. For example, with the specification (1), the equation is logOER = 0.69 + 0.93logBLR. In all three specifications, the coefficients of logBLR (logarithm of black-market rate) are statistically significant at a level of 1 percent. The absolute value around unity suggests a one-for-one long-term association between the two rates. The lower part of Table 4 presents estimation results for error-correction equations, with the correction error representing the rate of adjustment from short-run deviations to long-run equilibrium. All variables in the VEC model are in first-difference form. For example, D_logOER is the first difference of the official exchange rate in logarithm. The negative number 1 in parentheses after the variable names represents the number of lags (by one period). We used the Schwarz Bayesian information criteria (SBIC) and Hannan-Quinn information criteria (HQIC) to pick up the optimal lag. With all data in monthly frequency, we allowed a maximum of 12 lags, and lag one was picked up for the model with the lowest HBIC and HQIC. In each of the three specifications, we present a pair of dynamic equations of the error-correction type. The dependent variable is on the top, with estimated coefficients on the left columns and standard errors on the right columns. The asterisks indicate levels of statistical significance for each coefficient.
On one hand, the three equations with D_logOER as the dependent variable show that black-market exchange rates have no significant impact at all on the official exchange rate. The only factor which has a meaningful impact of the official exchange rate is the correction term. On the other hand, equations with D_logBLR as the dependent variable indicate that the official rate significantly affects the black-market rate in all three specifications, both via the error correction term and the short-run impact term, D_logOER (−1). These results suggest that the black-market exchange rate actually follows the official exchange rate most of the time during the period 2005–2011, though with a lag. In other words, one might say that the official policy rate led or caused the black-market exchange rate. The magnitude of the effect is also consistent across specifications with coefficients around −0.62 to −0.64. This means that, on average, and with all other things equal, a 1 percent depreciation of the Vietnam dong in the official market can cause the black exchange rate to appreciate by 0.6 percent one month later. This means that market expectation is actually formulated based on the change in policy variables, i.e., the official devaluation or appreciation.
In addition, the first coefficient of each regression model representing the speed of adjustments in the error-correction terms are all negative and statistically significant. With these correct negative signs, the model specifications are all plausible. It implies the convergence to the equilibrium of each exchange rate with respect to their past deviation from the equilibrium. Their magnitudes are very similar, ranging from 0.1–0.15, suggesting a fairly equal rate of adjustment of both exchange rates, around 10–15 percent of the deviation from the long-run equilibrium within one month. In other words, it takes about 7–10 months to restore the long-run equilibrium.
Furthermore, one might suspect the causality, as well as the difference in magnitude, of effects between the two exchange rates in two sub-periods, since their behaviour and co-movements are not similar in the two time periods. Table 5 shows the VEC estimates separately for each time period, though only for specification 1 as an example. The same results can be observed in two sub-periods as those in the whole period in Table 4. That is, the black-market rate shows no influence on the official rate, while the short-run variations in official rates reaffirms its significant impact on the variation of the black-market rate in both sub-periods. However, the sign of the coefficients is noticeably different. In the dynamic equation of D_logBLR for the first period, the coefficient of a lagged first difference of official rate in logarithm is 1.137, while it is −0.0723 in the later period, suggesting an opposite direction of influencing. This result helps to explain why the two rates have a very close profile in the first period, whereas the later period shows a larger exchange-rate premium. At the same time, and unsurprisingly, co-integration equations in both periods are similar because they both indicate a long-term relationship of the two rates.
Regarding the speed of adjustments, we found a difference between the two sub-periods. While the coefficients on correction-error terms for the official rates have correctly negative signs, those of the black-market rates have positive and insignificant signs. As suggested in the literature, this is caused by a structural break, which is clearly the issue of our analysis. In the later sub-period of more exchange rate volatility March 2008–April 2011, the results indicate that the adjustment to the long-run equilibrium is done by the official exchange rate, with a higher speed of 16.3 percent. This means that it would take about 6 months to restore the long-run equilibrium.
Our above conclusion on the causality between the official rates and black-market rates can also be further tested by applying the Granger causality Wald tests. Since the short-run variations are of particular interest, after excluding the long-term co-integrated relationship, the first difference for each exchange-rate series in logarithm were used in the Granger test. The test results are shown in Table 6. For the first specification, it shows the whole period of January 2005–April 2011, as well as in each sub-period.
The chi-square statistic, and its corresponding p-values in D_logBLR equations suggest that we can reject the hypothesis of weak exogeneity for the official exchange rate, implying that there is a significant Granger causality between deviations in official rates and deviations in black-market rates from their long-run equilibrium. This is true for the combined period, as well as for each separate sub-period. Conversely, non-Granger causality of the black-market rate to official rates is observed. In summary, test results from different econometric analyses come to the same conclusion that the short-run causality is from the official exchange rates towards the black market rates, but not vice versa.
3.3. Dynamics of Inflation with the Parallel Exchange Rates
This section analyses the link between the CPI and parallel exchange rates. Figure 5 shows the time profile of the official exchange rate, black-market rate, and price level in logarithm. The profiles are clearly divided into two sub-periods of different patterns in early 2008. The price level does not seem to go together with both exchange rates before 2008, but a more apparent co-movement can be identified in a later sub-period where both exchange rates seem to follow the inflation rate, with there being lags most of the time. Before 2008, the premium is small, but also very stable. Over the sub-period of January 2005–February 2008, the average premium is as small as 0.2 percent, with a standard deviation of 0.4 percent.
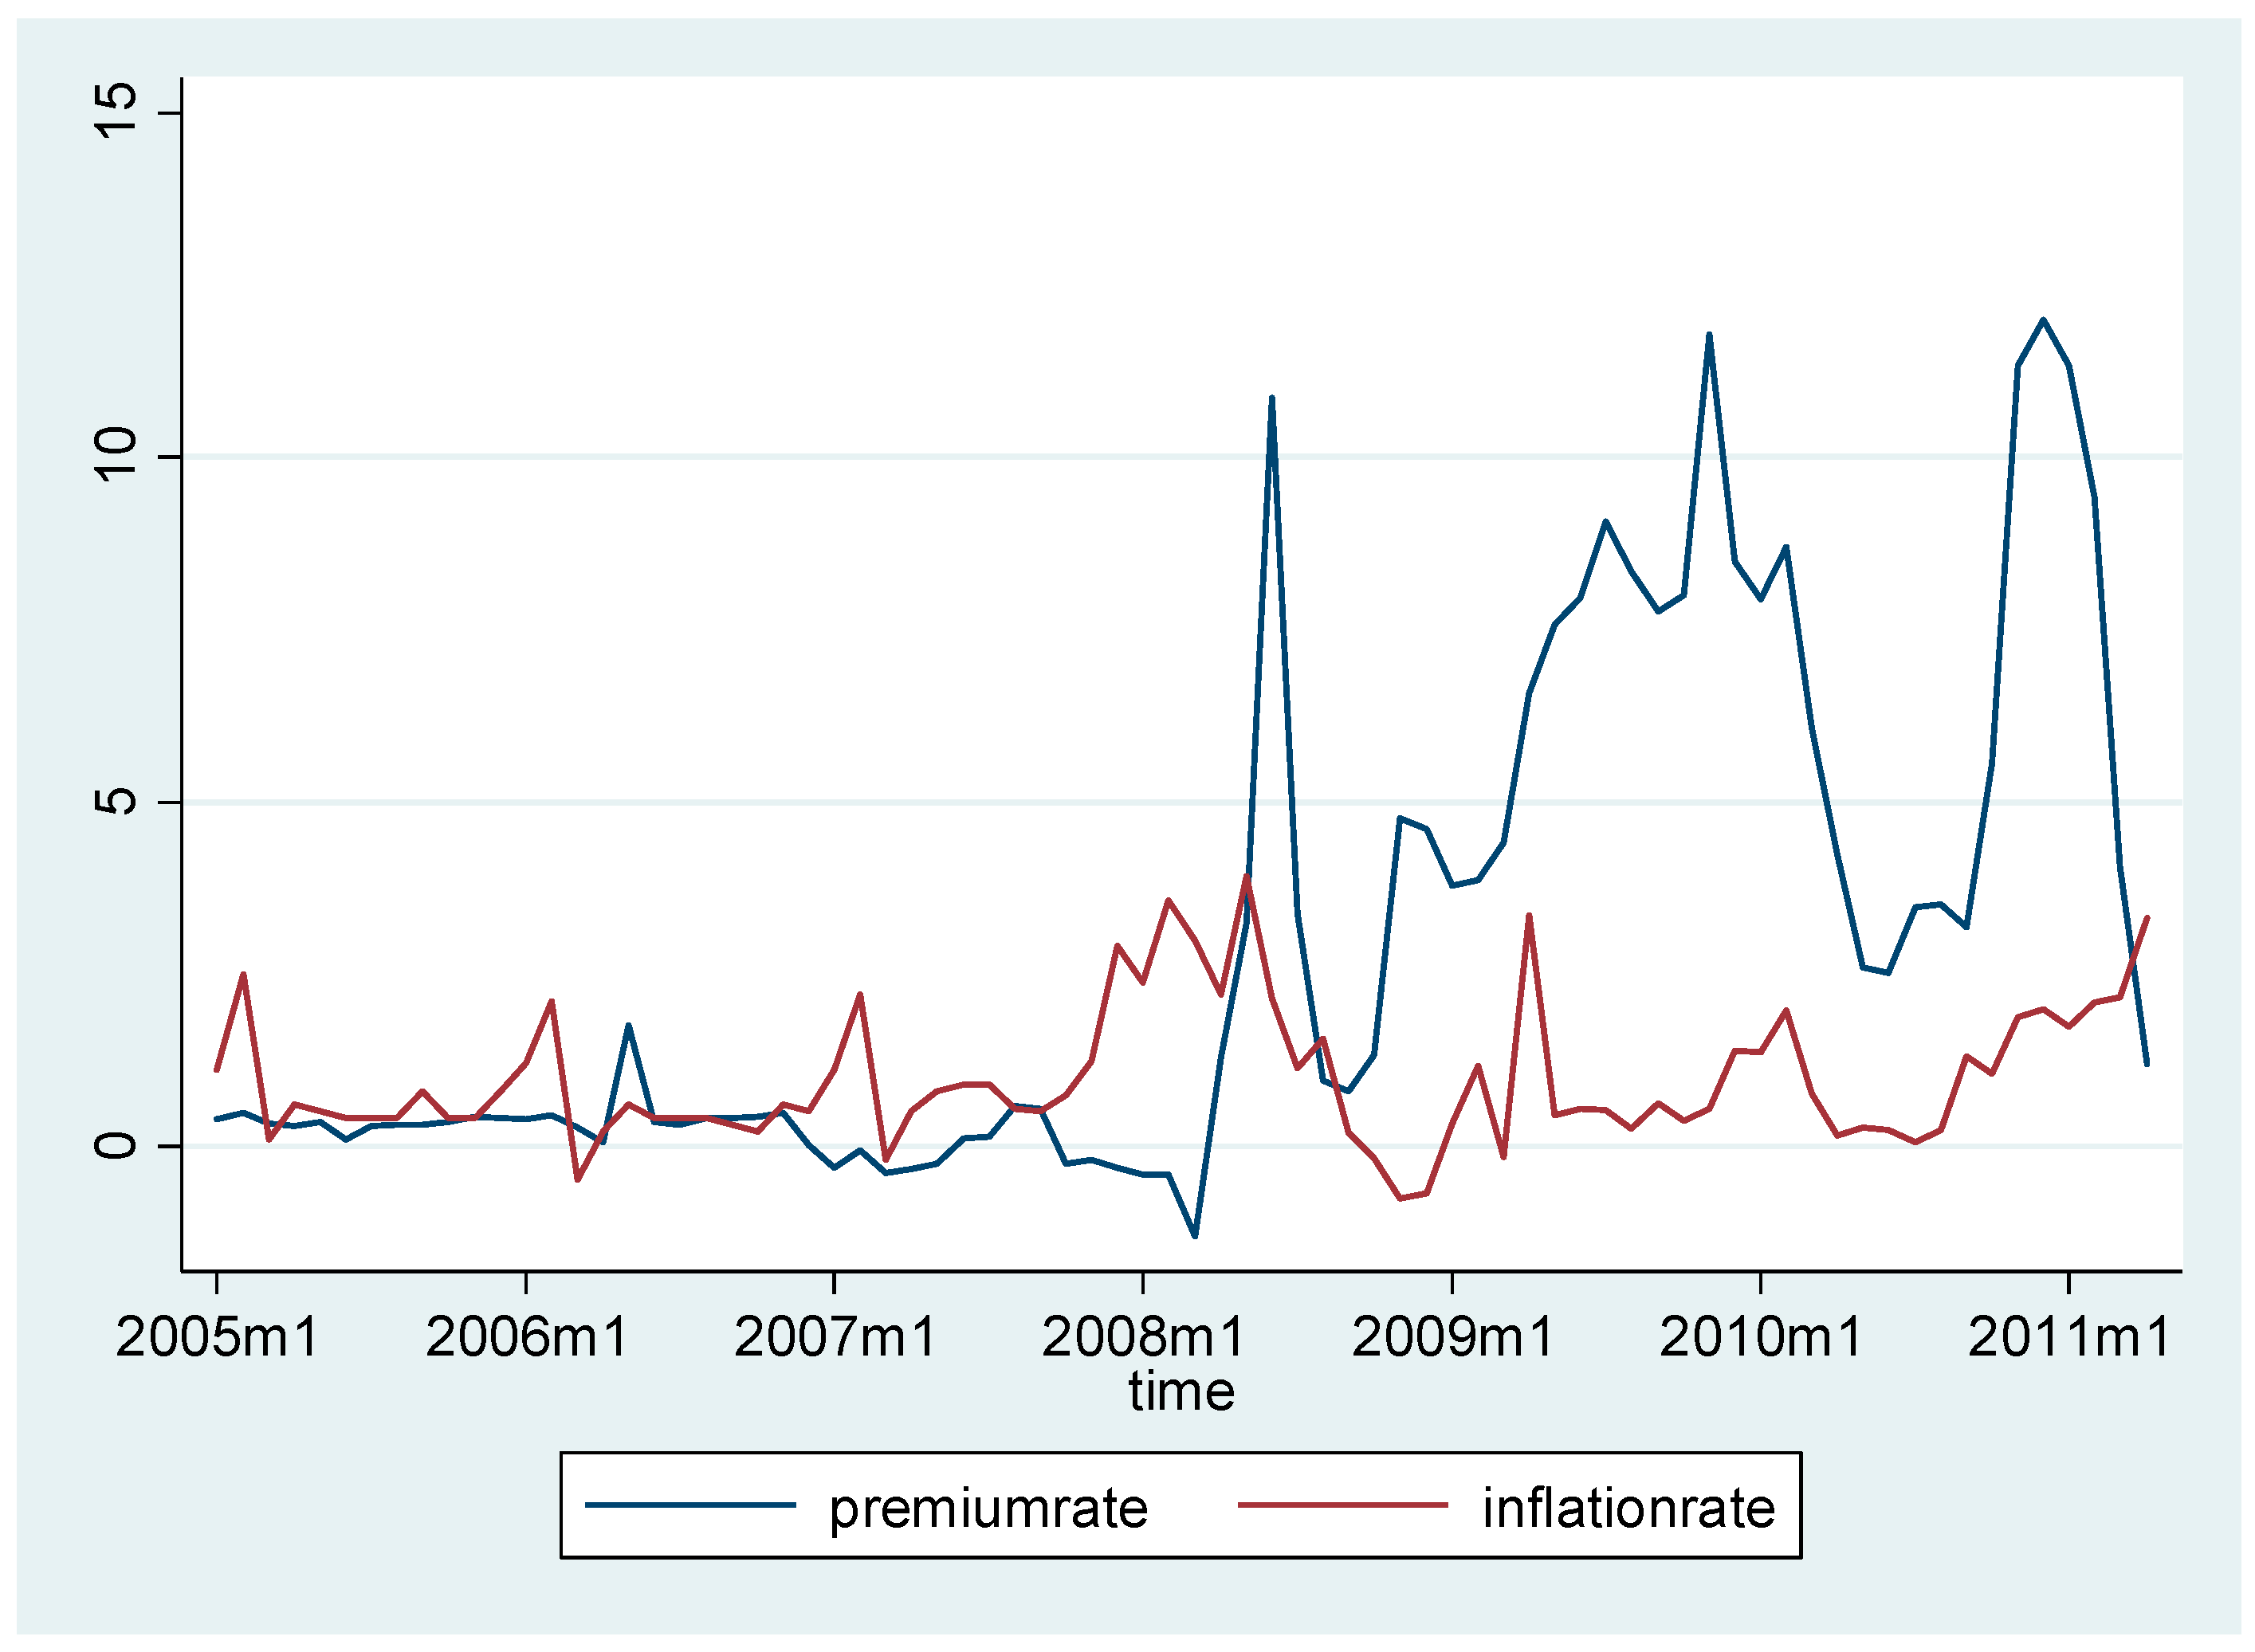
The opposition between the two sub-periods can also be clearly described by Figure 6, showing the fluctuations of the exchange-rate premium in the parallel market (in percentages) and monthly inflation rate. In the later sub-period until April 2011, the premium is larger, with an average of 5.6 percent, as well as more varied, with a standard deviation of 3.5 percent, reaching the peak of 12 percent at the end of 2010 and January 2011. This sudden switch is probably due to the change in the SBV’s exchange rate policy, with official devaluations taking place more often and there being a wider exchange-rate band, within which bank rates were allowed to adjust the reference rate, as mentioned in Section 2.
In the same manner, inflation is under control in the first sub-period. The month-to-month inflation rate is often under 2%, with even some episodes of deflation. A surge in price level started a bit earlier in December 2007 when the black-market exchange rate was even lower than the official rate. Inflation accelerated in the succeeding months, attaining the peak of 3.6 percent in February 2008, then 3.9 percent in May 2008. This situation led to an official devaluation of over 2 percent in 27 June 2008, narrowing the premium of almost 11 percent in the same month. A similar pattern and linkage can also be observed in early 2009 and late 2010, before there was an official devaluation.
The above observation can be tested using econometric analysis. The Dickey-Fuller stationary test shows that the CPI series is non-stationary I(1), and the inflation rate is stationary. We presented an error-correction mechanism of a dynamic relationship between exchange rate and price level. The optimal lags are also identified by the same information criteria, HQIC and HBIC. The longer leg-lengths in this model than those in previous models of the two exchange rates implies that it takes more time for the shock in exchange rates to influence price changes. Literature on the exchange rate pass-through in Vietnam also suggests a period of 6–10 months (Van Minh 2009). Table 7 indicates that in both sub-periods, there is a short-run linkage between the official exchange rate and price level, with a significant coefficient at 5 percent and 10 percent, respectively, for each sub-period. In the first sub-period, there seems to be an immediate effect, whereas there is a lag of 5 months for a change in official rate to realize effects on price level in the later sub-period. However, there is no statistically significant causal linkage from price level to official exchange rate, since this rate is a policy autonomous variable determined by the central bank. In addition, there is a strong long-run positive association between price level and official rate from 2008.
There is also a noticeable difference in the speed of adjustment between the two sub-periods. In the sub-period of exchange stability, we do not find a significant adjustment toward long-run equilibrium for both official exchange rate and CPI. In contrast, during the sub-period of exchange rate volatility, it was the official exchange rate that corrects about 10 percent of the deviation from the long-run equilibrium within 1 month.
The relationship between black market exchange rate (or premium) and price level CPI (or inflation rate) is also examined using the same technique. We found a long-run association between price level and black exchange rate with a positive significant coefficient during the second sub-period but not in the first sub-period. However, a short-run causal relationship from the price level to black exchange rate can be identified before 2008. At 10 percent significant level, an increase of 1 percent in price index would cause to a rise of 0.05 percent in black market exchange rate. This fact is fitted with the currency substitution effects where people buy more foreign currency in the black market in order to hedge against domestic inflation, pushing up the exchange rate in that market.
However, no vice versa effect is identified because the price of imported consumption goods is mainly based on official exchange rate rather than the black market rate. In the later period from 2008, although the error-correction mechanism does not confirm a short-run causal relationship between CPI and black exchange rate, a Granger causality test shows that the price level significantly Granger causes to a change in black market rate with a positive and instant effect of 1.5 percent for each increase 1 percent in price level as shown in Table 8. Similar to the adjustment to long-run relationship between exchange rate and inflation we also identified the black market exchange rate correct the short-run deviation at the rate of 9.5 percent within a month to restore a long-run equilibrium.
4. Discussion
This paper used monthly data on the official reference exchange rate and the black (parallel) market exchange rate in Vietnam for the period January 2005 to April 2011 to test for the existence of a long-run equilibrium relationship between the black and official exchange rates between the Vietnam dong and the U.S. dollar. Econometric analysis confirms that the two exchange rate series are co-integrated, and there is an almost one-for-one long-run stable association between the two rates. Investigation into the short-run dynamics of the two series reveals that the official reference rate in the inter-bank foreign exchange market managed by the State Bank of Vietnam actually caused the black-market rate. Meanwhile, the black-market rate has no significant influence on the policy variable, says the official exchange rate. This result was shown to be consistent through two methods: the vector-error-correction model (VEC) and the Granger causality test. It was also especially true for both sub-periods: from January 2005 to February 2008, with fairly stable exchange rates in both markets; and the later period from March 2008–April 2011, with more volatility and a larger exchange-rate premium. To the author’s knowledge, this type of conclusion drawn from an econometric analysis has not previously been available for Vietnam’s multiple exchange-rate system. Therefore, this present study justified the SBV’s actions in managing the foreign exchange market, and also rejects complaints that the central bank was not pro-active enough in controlling foreign exchange-rate fluctuations since 2008. It is also not evident from our analysis that the SBV even followed parallel market signals causing disturbance in the foreign exchange market for U.S. dollars in Vietnam.
The conclusion we made here is in line with findings from other studies for developing countries. For example, Odedokun (1996) confirmed that the official exchange rate caused the black market rate in 18 African countries during 1980–91. Agénor (1991) also found that the official rate caused the black market rate in 12 developing countries. On the other hand, the results of this paper also contradicts with other findings. For instance, Apergis (2000) showed some statistical evidence that the black market rates Granger-caused the official rate in Armenia in the period of November 1993 to April 1994. Baliamoune-Lutz (2010) used the VEC model, estimating monthly data from Morocco to reject weak exogeneity in the case of the official exchange rate, but failed to reject the test for the black market exchange rate, supporting the efficiency hypothesis of the black market.
The results from this study could be a contribution to the policy debate over exchange-rate management and reforms toward a unified foreign exchange market in Vietnam. Taking into consideration the link of a multiple exchange rate system with inflation, the study shows that in the case of Vietnam, it is the official exchange rate which can lead to an inflation rate, because the majority of international trade goes through the official market. Meanwhile, there is no significant feedback of inflation or change in price level onto the official rate. Combining this with the first conclusion on causality between the two exchange rates, it seems that the official rate is an autonomous policy variable directed by the SBV. On the other hand, the black market exchange rate is influenced by changes in the price level, mostly due to the currency substitution effect, where people want to hold more foreign currency to hedge against domestic inflation.
These conclusions can be beneficial to the Vietnam government’s goal in macroeconomic stabilization. Since May 2011, until more recently in 2012, a more stable foreign exchange market in Vietnam has been observed, which is even considered as being “almost unification”. It can be considered as the results of a wise exchange-rate management policy of the SBV over that period. The official exchange rate needs not to be indexed to the parallel market rate in order to keep the exchange rate premium low. Instead, the movement of official exchange rate should be regarded as a signal for market expectation formulation. Furthermore, the unification of the exchange rate system is not simply about a catch-up between the two rates, but as suggested in literature, it is a problem of choosing an appropriate exchange regime consistent with underlying fiscal and monetary policies (Pinto 1988).
Funding
This research was funded by the School of Economics and Public Policy, Srinakharinwirot University Thailand, ECON-2555.
Acknowledgments
I am grateful to Vo Tri Thanh, Nguyen Duc Khuong, and the anonymous referees for helpful comments and suggestions.
Conflicts of Interest
The author declares no conflict of interest.
References
- Agénor, Pierre-Richard. 1990. Stabilization Policies in Developing Countries with a Parallel Market for Foreign Exchange. Staff Papers (International Monetary Fund) 37: 560–92. [Google Scholar] [CrossRef]
- Agénor, Pierre-Richard. 1991. A Monetary Model of the Parallel Market for Foreign Exchange. Journal of Economic Studies 18. [Google Scholar] [CrossRef]
- Agénor, Pierre-Richard. 1992. Parallel Currency Markets in Developing Countries: Theory, Evidence, and Policy Implications. Available online: https://ssrn.com/abstract=885142 (accessed on 20 December 2012).
- Agénor, Pierre-Richard, and Mark P. Taylor. 1993. The causality between official and parallel exchange rates in developing countries. Applied Financial Economics 3: 255–66. [Google Scholar] [CrossRef]
- Apergis, Nicholas. 2000. Black Market Rates and Official Rates in Armenia: Evidence from Causality Tests in Alternative Regimes. Eastern Economic Journal 26: 335–44. [Google Scholar] [CrossRef]
- Ashworth, John, Lynne Evans, and Ayo Teriba. 1999. Structural breaks in parallel markets?: The case of Nigeria, 1980–1993. Journal of Development Economics 58: 255–64. [Google Scholar] [CrossRef]
- Azam, Jean-Paul. 1999. Dollars for Sales: Exchange Rate Policy and Inflation in Africa. World Development 27: 1843–59. [Google Scholar] [CrossRef]
- Baliamoune-Lutz, Mina. 2010. Black and official exchange rates in Morocco: An analysis of their long-run behaviour and short-run dynamics (1974–1992). Applied Economics 42: 3481–90. [Google Scholar] [CrossRef]
- Baliamoune-Lutz, Mina, and Stefan Lutz. 2008. Official and black market exchange rates in Tunisia. Journal of Business and Behavioral Sciences 19: 113–22. [Google Scholar]
- Bui, Thi Minh Tam. 2011. Who Gains and Who Loses From the Exchange Rate System in Vietnam? The Thammasat Economic Journal 29: 3. [Google Scholar]
- Bui, Duy Hung. 2014. An Empirical Analysis on the Parallel Foreign Exchange Market: The Case of Vietnam. Available online: https://econpapers.repec.org/paper/ekd006356/6719.htm (accessed on 15 October 2014).
- Diamandis, Panayiotis F., and Anastassios A. Drakos. 2005. Long-run dynamics of official and black-market exchange rates in Latin America. Global Finance Journal 15: 219–37. [Google Scholar] [CrossRef]
- Dornbusch, Rudiger. 1986. Special Exchange Rates for Capital Account Transactions. The World Bank Economic Review 1: 3–33. [Google Scholar] [CrossRef]
- Ghei, Nita, and Steven B. Kamin. 1999. The use of the parallel market rate as a guide to setting the official rate. In Exchange Rate Misalignment: Concept and Measurement for Developing Countries. Edited by Lawrence E. Hinkle and Peter J. Montiel. Oxford: Oxford University Press, pp. 405–64. [Google Scholar]
- Ghei, Nita, Miguel A. Kiguel, and Stephen A. O’Connell. 1997. Parallel Exchange Rates in Developing Countries: Lessons from Eight Case Studies. In Parallel Exchange Rates in Developing Countries. Edited by Kiguel Miguel, A. Saul Lizondo and Stephen O’Connell. London: MacMillan Press. [Google Scholar]
- Goujon, Michaël. 2006. Fighting Inflation in a Dollarized Economy: The Case of Vietnam. Journal of Comparative Economics 34: 564–81. [Google Scholar] [CrossRef]
- Granger, Clive W. J. 1980. Testing for causality. A personal Viewpoint. Journal of Economic Dynamics and Control 2: 329–52. [Google Scholar] [CrossRef]
- Granger, Clive W. J. 1983. Co-Integrated Variables and Error-Correcting Models. Ph.D. thesis, University of California at San Diego, La Jolla, CA, USA. [Google Scholar]
- IMF. 2006. Annual Report on Exchange Arrangements and Exchange Restrictions 2005 (Yearbooks). Washington, DC: International Monetary Fund, pp. 1288–95. [Google Scholar]
- IMF. 2010. Vietnam: Selected Issues. IMF Country Report No. 10/442. Washington, DC: International Monetary Fund. [Google Scholar]
- Greene, H. William. 2003. Econometric Analysis, 5th ed. Upper Saddle River: Prentice Hall Pearson. [Google Scholar]
- Huh, Kyong Mo, Benedicte Vibe Christensen, Kyong Mo Huh, Peter J. Quirk, and Toshihiko Sasaki. 1987. Floating Exchange Rates in Developing Countries. IMF Occasional Paper 53. Washington, DC: International Monetary Fund. [Google Scholar]
- Kamin, Steven B. 1995. Contractionary devaluations with black markets for foreign exchange. Journal of Policy Modeling 17: 39–57. [Google Scholar] [CrossRef]
- Koveos, Peter, and Bruce Seifert. 1985. Purchasing Power Parity and Black Markets. Financial Management 14: 40–46. [Google Scholar] [CrossRef]
- Kula, Ferit, Alper Aslan, and Ilhan Ozturk. 2014. Long run tendencies and short run adjustments between official and black market exchange rates in MENA countries. International Journal of Economics and Financial Issues 4: 494. [Google Scholar]
- Lizondo, Jose Saul. 1991. A Note on Dual Foreign Exchange Markets with Official Rationing: Predetermined Versus Floating Official Exchange Rate. Journal of Development Economics 44: 429–39. [Google Scholar] [CrossRef]
- Mai, Thu Hien. 2007. Solutions for exchange rate policy of transition economy of Vietnam. Ph.D. dissertation, Martin-Luther-Universität Halle-Wittenberg, Halle, Saxony-Anhalt, Germany. [Google Scholar]
- Moore, Michael, and Kate Phylaktis. 2000. Black and official exchange rates in the Pacific Basin: Some tests of dynamic behaviour. Applied Financial Economics 10: 361–69. [Google Scholar] [CrossRef]
- Nguyen, Thi Hong. 2002. Dollarisation of financial assets and liabilities of the household sector, the enterprises sector and the banking sector in Vietnam. Paper presented at the JICA-State Bank of Vietnam Joint Research Project, Hanoi, Vietnam, July 5. [Google Scholar]
- Nguyen, Van-Tien. 2006. Tai chinh Quoc te [International Finance]. Hanoi: Statistics Publisher. [Google Scholar]
- Nguyen, Tran Phuc, and Nguyen Duc-Tho. 2009. Exchange Rate Policy in Vietnam, 1985–2008. ASEAN Economic Bulletin 26: 137–63. [Google Scholar]
- Noorbakhsh, Abbas, and Manuchehr Shahrokhi. 1993. The official and black (parallel) foreign exchange markets: Causal relationships: Empirical evidence. Global Finance Journal 4: 65–76. [Google Scholar] [CrossRef]
- Nowak, Michael. 1984. Quantitative Controls and Unofficial Markets in Foreign Exchange: A Theoretical Framework (Contrôles quantitatifs et marchés non officiels de change: un cadre théorique) (Controles cuantitativos y mercados no oficiales de divisas: Un marco téorico). Staff Papers (International Monetary Fund) 31: 404–31. [Google Scholar] [CrossRef]
- O’Connell, Stephen A. 1995. Parallel Exchange Rates in Developing Countries. The World Bank Research Observer 10: 21–52. [Google Scholar]
- Odedokun, Matthew O. 1996. Monetary Model of Black Market Exchange Rate: Evidence from African Countries. Journal of Economic Studies 23: 31–49. [Google Scholar] [CrossRef]
- Phillips, Ronnie J. 1988. ‘War news’ and black market exchange rate deviations from purchasing power parity: Wartime South Vietnam. Journal of International Economics 25: 373–78. [Google Scholar] [CrossRef]
- Phylaktis, Kate, and Yiannis Kassimatis. 1994. Black and official exchange rates in the Pacific Basin countries: An analysis of their long-run dynamics. Applied Economics 26: 399–407. [Google Scholar] [CrossRef]
- Pinto, Brian. 1988. Black Markets for Foreign Exchange, Real Exchange Rates, and Inflation: Overnight versus Gradual Reform in Sub-Saharan Africa. Washington, DC: World Bank Publications, vol. 84. [Google Scholar]
- Pinto, Brian. 1991. Black Market for Foreign Exchange, Real Exchange Rates and Inflation. Journal of International Economics 30: 121–35. [Google Scholar] [CrossRef]
- Pinto, Brian, and Homi Kharas. 1989. Exchange Rate Rules, Black Market Premia and Fiscal Deficits: The Bolivian Hyperinflation. The Review of Economic Studies 56: 435–47. [Google Scholar]
- State Bank of Vietnam. 1994–2012. Annual Report. Hanoi: State Bank of Vietnam. [Google Scholar]
- Takagi, Shinji, and Thi Hoang Anh Pham. 2011. Responding to the global financial crisis: Vietnamese exchange rate policy, 2008–2009. Journal of Asian Economics 22: 507–17. [Google Scholar] [CrossRef]
- Van Minh, Vo. 2009. Exchange Rate Pass-Through and Its Implications for Inflation in Vietnam. Working Paper 902. Hanoi: Vietnam Development Forum. [Google Scholar]
- Vo, Tri Thanh, and Pham Chi Quang. 2008. Managing Capital Flows: The Case of Vietnam. ADB Institute Discussion Paper No. 105. Tokyo: ADB Institute. [Google Scholar]
- Vo, Tri Thanh, Dinh Hien Minh, Do Xuan Truong, Hoang Van Thanh, and Pham Chi Quang. 2000. Exchange Rate in Vietnam: Arrangement, Information Content and Policy Options. Individual Research Project, East Asian Development Network, July, Hanoi. Occasional Paper 53. Washington, DC: International Monetary Fund. [Google Scholar]
- Yunus, Mohammad. 1997. Long-run Dynamics and Causality in the South Asian Foreign Exchange Markets. The Bangladesh Development Studies 25: 43–72. [Google Scholar] [CrossRef]
Figure 1.
Exchange rate performance in Vietnam (1990–2011). Source: Nguyen and Duc-Tho (2009) and Bui (2011).
Figure 1.
Exchange rate performance in Vietnam (1990–2011). Source: Nguyen and Duc-Tho (2009) and Bui (2011).

Figure 2.
Inflation rate per annum in Vietnam (1992–2010). Source: (State Bank of Vietnam 1994–2012).
Figure 2.
Inflation rate per annum in Vietnam (1992–2010). Source: (State Bank of Vietnam 1994–2012).

Figure 3.
Movements of multiple exchange rates in two sub-periods. Source: (State Bank of Vietnam 1994–2012), Vietcombank, and author’s own calculations.
Figure 3.
Movements of multiple exchange rates in two sub-periods. Source: (State Bank of Vietnam 1994–2012), Vietcombank, and author’s own calculations.

Figure 4.
Stationarity of first-differenced variables (official rate and black market rate).

Figure 5.
Monthly consumer price index and parallel exchange rates in logarithm.

Figure 6.
Parallel market premium and month-to-month inflation rate.


Table 1.
Statistical summary of official reference, commercial bank, and black-market rates.
| Variables | Obs | Mean | Std. Dev. | Min | Max |
|---|---|---|---|---|---|
| January 2005–February 2008 | |||||
| Official reference rate | 38 | 15,976 | 134 | 15,742 | 16,165 |
| Commercial bank rate | 38 | 15,979 | 110 | 15,783 | 16,212 |
| Black market rate | 38 | 16,008 | 120 | 15,802 | 16,256 |
| March 2008–March 2011 | |||||
| Official reference rate | 38 | 17,666 | 1271 | 15,960 | 20,714 |
| Commercial bank rate | 38 | 18,189 | 1311 | 15,911 | 20,884 |
| Black market rate | 38 | 18,670 | 1559 | 15,795 | 21,899 |
Source: Author’s own calculations from data of Vietcombank and the State Bank of Vietnam (State Bank of Vietnam 1994–2012).
Table 2.
Phillip-Perron test results for unit root.
| Variables | Adjusted t-Statistics | Critical Value (1% Level) | p-Value |
|---|---|---|---|
| Level | |||
| Offrate | 3.502 | −3.545 | 1.000 |
| Blkrate | 0.491 | −3.545 | 0.985 |
| CPI | 0.984 | −3.545 | 0.994 |
| LogOFR | 3.531 | −3.545 | 1.000 |
| LogBLKR | 0.442 | −3.545 | 0.983 |
| LogCPI | 0.312 | −3.545 | 0.978 |
| Difference | |||
| Doffrate | −6.041 | −3.546 | 0.000 |
| Dblkrate | −8.311 | −3.546 | 0.000 |
| DCPI | −7.380 | −3.546 | 0.000 |
| DlogOFR | −6.188 | −3.546 | 0.000 |
| DlogBLKR | −8.442 | −3.546 | 0.000 |
| DlogCPI | −7.759 | −3.546 | 0.000 |
Source: Author’s own calculations.
Table 3.
Co-integrating rank of the two exchange rate logarithms by Johansen’s test.
| Model Specification | Maximum Rank | Eigen-Value | Trace Statistic | Critical Value (5% Level) | ||
|---|---|---|---|---|---|---|
| 1. With an unrestricted constant | 0 | 0.00 | 16.60 | 15.41 | ||
| 1 | 0.17 | 3.05 | * | 3.76 | ||
| 2. With a restricted constant | 0 | 0.00 | 24.34 | 19.96 | ||
| 1 | 0.21 | 6.52 | * | 9.24 | ||
| 3. With a linear trend in CE & | 0 | 0.00 | 13.14 | 18.17 | ||
| a quadratic trend in data | 1 | 0.16 | 0.05 | 3.74 | ||
| 4. With a restricted trend | 0 | 0.00 | 21.39 | 25.32 | ||
| 1 | 0.18 | 6.93 | 12.25 | |||
| 5. No trend and no constant | 0 | 0.00 | 21.17 | 12.53 | ||
| 1 | 0.21 | 3.38 | * | 3.84 |
* Level of significance of 10%. Source: Author’s own calculations.
Table 4.
Cointegration and error-correction equations for official and parallel exchange rates.
| Spec. (1) with Unrestricted Constant | Spec. (2) with Restricted Constant | Spec. (5) No Trend and No Constant | |||||||||||||||||||||
|---|---|---|---|---|---|---|---|---|---|---|---|---|---|---|---|---|---|---|---|---|---|---|---|
| Vector Error-Correction Model | |||||||||||||||||||||||
| D_logOER | D_logBLR | D_logOER | D_logBLR | D_logOER | D_logBLR | ||||||||||||||||||
| Coeff. | Std. Err. | Coeff. | Std. Err. | Coeff. | Std. Err. | Coeff. | Std. Err. | Coeff. | Std. Err. | Coeff. | Std. Err. | ||||||||||||
| Correc. error (−1) (rate of adjustment) | −0.145 | *** | 0.039 | −0.066 | 0.080 | −0.105 | *** | 0.025 | −0.12 | ** | 0.051 | −0.105 | *** | 0.027 | −0.127 | ** | 0.056 | ||||||
| D_logOER (−1) | 0.138 | 0.108 | −0.620 | *** | 0.220 | 0.103 | 0.110 | −0.636 | *** | 0.227 | 0.103 | 0.109 | −0.617 | *** | 0.224 | ||||||||
| D_logBLR (−1) | 0.025 | 0.065 | 0.020 | 0.132 | 0.041 | 0.063 | −0.011 | 0.130 | 0.041 | 0.063 | −0.011 | 0.130 | |||||||||||
| constant | −0.002 | 0.002 | 0.004 | 0.003 | |||||||||||||||||||
| R-squared | 0.37 | 0.14 | 0.36 | 0.12 | 0.4 | 0.12 | |||||||||||||||||
| Cointegrating Equations | |||||||||||||||||||||||
| logOER | 1.000 | 1.000 | 1.000 | ||||||||||||||||||||
| logBLR | −0.930 | *** | 0.086 | −1.041 | *** | 0.116 | −1.000 | *** | 0.001 | ||||||||||||||
| constant | −0.690 | 0.392 | 1.132 | ||||||||||||||||||||
| Log likelihood | 450.00 | 448.27 | 448.25 | ||||||||||||||||||||
| Observations | 74 | 74 | 74 | ||||||||||||||||||||
** and *** correspond to the levels of significance of 5% and 1%, respectively.
Table 5.
Cointegration and error-correction equations for sub-periods (specification 1).
| January 2005–February 2008 | March 2008–April 2011 | |||||||||||
|---|---|---|---|---|---|---|---|---|---|---|---|---|
| Vector Error-Correction Model | ||||||||||||
| D_logOER | D_logBLR | D_logOER | D_logBLR | |||||||||
| Coeff. | Std. Err. | Coeff. | Std. Err. | Coeff. | Std. Err. | Coeff. | Std. Err. | |||||
| Correc. error (−1) (rate of adjustment) | −0.112 | 0.077 | 0.503 | *** | 0.187 | −0.163 | ** | 0.072 | 0.117 | 0.1387 | ||
| D_logOER (−1) | 0.014 | 0.181 | 1.137 | *** | 0.441 | 0.140 | 0.156 | −0.723 | ** | 0.2991 | ||
| D_logBLR (−1) | −0.032 | 0.076 | −0.029 | 0.184 | 0.019 | 0.095 | 0.102 | 0.1818 | ||||
| Constant | 4 × 10⁻⁴ | 0.000 | 1 × 10⁻⁴ | 0.001 | 0.007 | 0.003 | 0.010 | ** | 0.0048 | |||
| R-square | 0.19 | 0.37 | 0.37 | 0.24 | ||||||||
| Cointegrating Equations | ||||||||||||
| logOER | 1.000 | 1.000 | ||||||||||
| logBLR | −1.170 | *** | 0.118 | −0.955 | *** | 0.124 | ||||||
| Constant | 1.646 | −0.379 | ||||||||||
| Log likelihood | 342.10 | 209.86 | ||||||||||
| Observations | 36 | 38 | ||||||||||
** and *** correspond to the levels of significance of 5% and 1%, respectively.
Table 6.
Granger causality test for official and parallel exchange rates (specification 1).
| Whole Period January 2005–April 2011 | Sub-Period January 2005–February 2008 | Sub-Period March 2008–April 2011 | |||||||||||||||||||||
|---|---|---|---|---|---|---|---|---|---|---|---|---|---|---|---|---|---|---|---|---|---|---|---|
| VAR Model of the First Differences | |||||||||||||||||||||||
| D_logOER | D_logBLR | D_logOER | D_logBLR | D_logOER | D_logBLR | ||||||||||||||||||
| Coeff. | Std. Err. | Coeff. | Std. Err. | Coeff. | Std. Err. | Coeff. | Std. Err. | Coeff. | Std. Err. | Coeff. | Std. Err. | ||||||||||||
| D_logOER (−1) | 0.294 | *** | 0.124 | −0.491 | ** | 0.234 | −0.060 | 0.176 | 1.260 | *** | 0.456 | 0.264 | 0.167 | −0.602 | ** | 0.304 | |||||||
| D_logOER (−2) | −0.186 | 0.133 | −0.224 | 0.250 | −0.185 | 0.191 | −0.384 | 0.496 | −0.264 | 0.183 | −0.385 | 0.334 | |||||||||||
| D_logBLR (−1) | 0.096 | 0.066 | 0.025 | 0.125 | 0.087 | 0.064 | −0.363 | ** | 0.167 | 0.057 | 0.092 | −0.054 | 0.168 | ||||||||||
| D_logBLR (−2) | 0.013 | 0.065 | −0.007 | 0.123 | 0.094 | 0.061 | −0.204 | 0.158 | −0.007 | 0.088 | −0.045 | 0.161 | |||||||||||
| constant | 0.003 | ** | 0.001 | 0.006 | *** | 0.002 | 0.001 | ** | 0.000 | 0.000 | 0.001 | 0.006 | ** | 0.002 | 0.014 | 0.004 | |||||||
| R-square | 0.16 | 0.10 | 0.08 | 0.29 | 0.14 | 0.19 | |||||||||||||||||
| Log likelihood | 437.40 | 328.35 | 206.95 | ||||||||||||||||||||
| Observations | 74 | 35 | 38 | ||||||||||||||||||||
| Granger Causality Wald Test | |||||||||||||||||||||||
| Chi-square | 2.126 | 1.299 | ** | 3.054 | 9.034 | ** | 0.396 | 7.337 | ** | ||||||||||||||
| p-value | 0.345 | 0.026 | 0.217 | 0.011 | 0.820 | 0.026 | |||||||||||||||||
** and *** correspond to the levels of significance of 5% and 1%, respectively.
Table 7.
Co-integration and error-correction equations for official exchange rate and CPI.
| January 2005–February 2008 | March 2008–April 2011 | |||||||||||
|---|---|---|---|---|---|---|---|---|---|---|---|---|
| Vector Error-Correction Model | ||||||||||||
| D_logOER | D_logCPI | D_logOER | D_logCPI | |||||||||
| Coeff. | Std. Err. | Coeff. | Std. Err. | Coeff. | Std. Err. | Coeff. | Std. Err. | |||||
| Correc. error (−1) (rate of adjustment) | −0.015 | 0.009 | −0.470 | 0.258 | 0.213 | ** | 0.092 | −0.097 | * | 0.053 | ||
| D_logCPI (−1) | 0.005 | 0.009 | 0.286 | 0.262 | 0.231 | 0.313 | 0.087 | 0.180 | ||||
| D_logCPI (−2) | 0.008 | 0.008 | 0.265 | 0.247 | 0.060 | 0.273 | 0.464 | *** | 0.157 | |||
| D_logCPI (−3) | 0.008 | 0.008 | 0.192 | 0.243 | 0.017 | 0.295 | 0.288 | * | 0.170 | |||
| D_logCPI (−4) | 0.002 | 0.008 | 0.208 | 0.243 | −0.220 | 0.268 | −0.292 | * | 0.155 | |||
| D_logCPI (−5) | 0.002 | 0.008 | 0.191 | 0.233 | 0.068 | 0.279 | −0.208 | 0.161 | ||||
| D_logOER (−1) | −0.106 | 0.199 | −13.66 | ** | 6.012 | 0.379 | ** | 0.180 | 0.071 | 0.104 | ||
| D_logOER (−2) | −0.249 | 0.234 | −4.629 | 7.064 | −0.252 | 0.191 | 0.039 | 0.110 | ||||
| D_logOER (−3) | −0.075 | 0.256 | −6.565 | 7.740 | 0.052 | 0.256 | −0.041 | 0.148 | ||||
| D_logOER (−4) | −0.066 | 0.252 | −2.241 | 7.620 | −0.142 | 0.247 | −0.225 | 0.142 | ||||
| D_logOER (−5) | −0.214 | 0.242 | −1.640 | 7.313 | 0.105 | 0.265 | −0.285 | * | 0.153 | |||
| constant | 0.000 | 0.001 | 0.000 | 0.016 | 0.004 | 0.005 | 0.009 | 0.003 | ||||
| R-squared | 0.28 | 0.27 | 0.44 | 0.84 | ||||||||
| Cointegrating Equations | ||||||||||||
| logCPI | 1.00 | 1.000 | ||||||||||
| logOER | 7.49 | *** | 1.444 | −1.36 | *** | −1.084 | ||||||
| constant | −77.32 | 8.250 | ||||||||||
| Log likelihood | 231.04 | 258.09 | ||||||||||
| Observations | 32 | 38 | ||||||||||
*, ** and *** correspond to the levels of significance of 10%, 5%, and 1%, respectively.
Table 8.
Co-integration and error-correction equations for black market exchange rate and consumer price index (CPI).
Table 8.
Co-integration and error-correction equations for black market exchange rate and consumer price index (CPI).
| January 2005–February 2008 | March 2008–April 2011 | |||||||||||
|---|---|---|---|---|---|---|---|---|---|---|---|---|
| Vector Error-Correction Model | ||||||||||||
| D_logBLR | D_logCPI | D_logBLR | D_logCPI | |||||||||
| Coeff. | Std. Err. | Coeff. | Std. Err. | Coeff. | Std. Err. | Coeff. | Std. Err. | |||||
| Correc. error (−1) (rate of adjustment) | −0.150 | 0.096 | 1.308 | 1.095 | −0.954 | *** | 0.332 | 0.136 | 0.133 | |||
| D_logCPI (−1) | 0.054 | * | 0.032 | −0.069 | 0.363 | 0.678 | 0.509 | 0.321 | 0.204 | |||
| D_logCPI (−2) | −0.038 | 0.037 | 0.511 | 0.417 | 0.222 | 0.516 | 0.383 | 0.206 | ||||
| D_logCPI (−3) | 0.029 | 0.038 | −0.457 | 0.428 | 0.017 | 0.533 | 0.166 | 0.213 | ||||
| D_logCPI (−4) | −0.023 | 0.038 | 0.046 | 0.439 | −0.730 | 0.506 | −0.262 | 0.203 | ||||
| D_logCPI (−5) | −0.022 | 0.034 | 0.114 | 0.392 | −0.674 | 0.521 | −0.011 | 0.208 | ||||
| D_logBLR (−1) | 0.229 | 0.351 | −3.26 | 4.008 | 0.378 | 0.274 | −0.086 | 0.109 | ||||
| D_logBLR (−2) | −0.289 | 0.345 | 3.72 | 3.935 | 0.126 | 0.231 | −0.028 | 0.093 | ||||
| D_logBLR (−3) | 0.196 | 0.359 | −2.70 | 4.101 | 0.019 | 0.200 | −0.007 | 0.080 | ||||
| D_logBLR (−4) | −0.115 | 0.352 | −1.15 | 4.018 | −0.105 | 0.186 | −0.044 | 0.074 | ||||
| D_logBLR (−5) | −0.267 | 0.281 | 0.15 | 3.208 | −0.109 | 0.176 | −0.011 | 0.070 | ||||
| constant | 0.001 | 0.001 | 0.000 | 0.010 | 0.001 | 0.009 | 0.007 | 0.003 | ||||
| R-squared | 0.40 | 0.15 | 0.44 | 0.76 | ||||||||
| Cointegrating Equations | ||||||||||||
| logBLR | 1.00 | 1.00 | ||||||||||
| logCPI | −0.04 | 0.837 | −0.83 | *** | 0.435 | |||||||
| constant | −9.47 | −5.65 | ||||||||||
| Log likelihood | 231.04 | 258.09 | ||||||||||
| Observations | 32 | 38 | ||||||||||
*, ** and *** correspond to the levels of significance of 10%, 5%, and 1%, respectively.
© 2018 by the author. Licensee MDPI, Basel, Switzerland. This article is an open access article distributed under the terms and conditions of the Creative Commons Attribution (CC BY) license (http://creativecommons.org/licenses/by/4.0/).
Share and Cite
MDPI and ACS Style
Bui, M.T. Causality in Vietnam’s Parallel Exchange Rate System during 2005–2011: Policy Implications for Macroeconomic Stability. Economies 2018, 6, 68. https://doi.org/10.3390/economies6040068
AMA Style
Bui MT. Causality in Vietnam’s Parallel Exchange Rate System during 2005–2011: Policy Implications for Macroeconomic Stability. Economies. 2018; 6(4):68. https://doi.org/10.3390/economies6040068
Chicago/Turabian StyleBui, Minh Tam. 2018. "Causality in Vietnam’s Parallel Exchange Rate System during 2005–2011: Policy Implications for Macroeconomic Stability" Economies 6, no. 4: 68. https://doi.org/10.3390/economies6040068
Note that from the first issue of 2016, this journal uses article numbers instead of page numbers. See further details here.