The Impact of the Global Financial Crisis on Profitability of the Banking Industry: A Comparative Analysis

1
Transylvania University, Lexington, KY 40508, USA
2
Department of Business, Embry-Riddle Aeronautical University, Daytona Beach, FL 32114, USA
*
Author to whom correspondence should be addressed.
Economies 2018, 6(4), 66; https://doi.org/10.3390/economies6040066
Submission received: 12 September 2018
/
Revised: 21 November 2018
/
Accepted: 26 November 2018
/
Published: 11 December 2018
(This article belongs to the Special Issue International Financial Markets)
Abstract
:In this paper, the effects of the recent global financial crisis on efficiency and profitability of financial institutions were analyzed. In a comparative study, the impacts of the global financial crisis on the performance of Islamic and commercial banks were examined. The fundamental difference between Islamic and conventional banking is that Islamic banking is founded upon the ethical principles of Islamic tradition and law (Sharia). By utilizing a sample of eight Islamic banks and eleven commercial banks, the impact of the global financial crisis on efficiency and profitability of the banking sector was evaluated. This study covered the period from 2006 to 2013. The results of this research were obtained from the Altman Z-score model, ratio analysis, the data envelopment analysis (DEA) method, and the seemingly unrelated regression (SUR) model. The results show that during the study period, Islamic banks (IBs) managed to maintain their efficiency while most commercial banks (CBs) suffered a loss in their efficiency. Furthermore, this study found that the financial crisis did not have a significant impact on the profitability of Islamic banks.
JEL Classification:
G00; G01; G201. Introduction
The global financial crisis of 2007–2009 caused many researchers to investigate the profitability and efficiency of alternative banking systems in order to prevent similar financial crises in the future. In particular, researchers examined key issues concerning the stability and resilience of the Islamic financial system. Islamic banking complies with the Sharia (Islamic religious law), therefore it is a free-interest banking system. Modern Islamic banking was established with the creation of the Dubai Islamic Bank in 1975. Islamic banking has grown rapidly since the 1980s. Islamic finance is based on the principles of risk sharing, a profit-and-loss sharing arrangement, and individuals’ rights.
The fundamental difference between Islamic banks (IBs) and commercial banks (CBs) is that Islamic banking is founded upon the ethical principles of Islamic tradition and law (Sharia). While conventional finance is debt-based and focuses on transferring risk, Islamic banking is built on an asset-based and risk-sharing model, which forbids profiting via interest (Riba). IBs do not engage in financial derivatives, which would allow conversion of long-term assets into liquidity. Therefore, Islamic banks are not allowed to have off-balance sheet liabilities, such as collateralized debt obligations (CDO) or credit default swaps. Evidence suggests that the performance of Sharia-compliant financial institutions fared significantly better than their commercial counterparts during the financial crisis.
The Glass–Steagall Act (also known as the Banking Act of 1933) separated commercial and investment banking activities and prevented them from investing in non-investment grade securities. The Glass–Steagall Act also prevented banks from acquiring equity securities for their own accounts and from acting as equity securities dealers. In 1999, President Bill Clinton signed the Financial Services Modernization Act, commonly known as the Gramm–Leach–Bliley Act (GLBA). The GLBA repealed some key sections of the Glass –Steagall Act, allowing for commercial banks, investment banks, securities firms, and insurance companies to merge. Some Glass–Steagall supporters argue that the GLBA’s partial repeal of the Glass–Steagall Act led to the 2007–2009 financial crisis (Kuttner 2007). The repeal of the Glass–Steagall Act, alongside the then newly adopted GLBA, allowed investment banks to speculate with their depositors’ funds that were held in their associated commercial banks.
Today, banking practices based on Islamic principles are considered a viable alternative to commercial, interest-based banking. In a highly competitive market environment, banks utilize different techniques to help identify and compare the performance of various units during a given time period. As such, banks are able to effectively allocate resources and motivate portfolio managers to achieve optimal results. In this study, the data envelopment analysis (DEA) model was employed to determine the relative efficiency of selected Islamic and commercial banks. Additionally, the Altman Z-score method (based on five financial ratios) was employed to compare the financial performance of selected Islamic and commercial banks. Furthermore, the seemingly unrelated regression (SUR) model was used to estimate the impact of economic shocks on financial institutions under different business structures. The goal of this research was to provide empirical evidence on the performance of IBs during the global financial crisis of 2007–2009. Empirical results suggest that IBs displayed higher efficiency than CBs during the study period of 2006–2013.
Islamic banks’ investment decisions and capital structures differ from commercial banks as they are based on the principles of Sharia (Islamic religious law). Sharia originates from the rules commanded by the Quran and Sunna (religious practices and teachings of the Prophet Mohammad). While CBs consider the time value of money as a justification for charging interest on their loans, Islamic scholars contend interest rates are determined by market forces without any moral or ethical considerations, and therefore prohibit most forms of interest-based lending. IBs and CBs also differ greatly in capital structure. Islamic banks are fully supported by funds invested in them. IBs rely on asset-based intermediation, as opposed to the debt-based intermediation of CBs (Hasan and Dridi 2011). IBs are very similar to Western mutual funds, where diversified portfolios of equities (investment funds) are sold in investment accounts. Mutual funds collect funds from many investors to invest in a combination of stocks, bonds, and other financial assets. Mutual fund investors own shares (equity investment) in the fund, receiving a proportionate share of the assets held by the fund. These mutual fund units (shares) grow with a mutual fund’s investment (similar to investments of IBs). Islamic banks are financed through deposits such as Musharaka, which allow for the participation in investment projects.
Islamic banking is interest-free banking in which participants earn returns on their investment only by participating in profit-and-loss sharing arrangements. A key principle of Islamic banking is profit-sharing and loss-bearing banking, meaning each party in a transaction must share the risk and reward associated with the transaction. Such equity-based financing provides a buffer to IBs during a financial crisis. Asset growth of IBs is mainly due to their greater capital adequacy ratios. Commercial banks are mainly concerned with managing deposits and withdrawals, as well as supplying short-term loans to individuals and business firms. In contrast to CBs, IBs function through a system of sharing profits and losses rather than receiving deposits. Depositors make interest-free loans to IBs and become investors. Generally, IBs have a higher cash-to-asset ratio (excess reserves) and higher cash-to-deposit ratio compared to CBs. Furthermore, CBs tend to have a higher debt-to-asset ratio than IBs. Consequently, CBs are exposed to higher liquidity risk than IBs. The profit-and-loss sharing arrangement of Islamic banks makes the lending practices safer due to their stake in all business dealings. An Islamic bank will only collect returns on its investment if the borrower is making profit. Prohibition of Riba is the main principle of the Islamic financial system. Islam supports the earning of profits but bans charging interest since profit is determined ex post, whereas interest is determined ex ante (i.e., guaranteed regardless of the performance of the investment). Given that IBs do not charge interest, IBs were less inclined to get involved in the subprime mortgage market that put many commercial banks in the risky situations that inevitably crashed them into the financial crisis. IBs operate in accordance with Islamic law (Sharia), which prohibits the payment of interest or usury (Riba). Therefore, IBs do not offer services like commercial banks’ deposits and loan accounts. IBs will only earn returns on their investments if the businesses of the borrowers of bank funds are successful. The profit-sharing arrangement of the Islamic banking system leads to safer lending practices due to its consideration of the welfare of all parties involved.
The remainder of this paper is organized as follows. Section 2 provides a review of the existing empirical literature on the effects of the recent global financial crisis on the performance of Islamic and commercial banks. Section 3 describes the data and methodology of our empirical analysis to measure the efficiency and profitability of financial institutions. Section 4 discusses the main results on efficiency and profitability of Islamic and commercial banks. Finally, Section 5 presents a summary, conclusions, and policy implications of the study.
2. Review of Literature
The global financial crisis of 2007–2009 was largely a result of the subprime lending crisis, which affected the financial performance of commercial banks that traded mortgage-backed securities. These risky mortgage-backed securities were packaged as collateralized debt obligations (CDOs) and sold off to investors in the secondary market, providing more liquidity in the economy. In order to receive higher credit ratings, conventional banks were repacking the residential mortgage-backed securities (RMBS) into CDOs. Credit rating agencies and investors did not anticipate the risks involved with mortgage-related financial products such as CDOs. In 2008, a series of conventional bank failures required unprecedented U.S. government intervention.
In October 2008, to address the subprime mortgage crisis, the U.S. Treasury, through the Troubled Asset Relief Program (TARP), purchased preferred stock from numerous banks and other financial institutions. For example, Citigroup, Bank of America, J.P. Morgan Chase, and Wells Fargo received preferred stock investments ($25 billion each) from the U.S. Treasury (The New York Times 2008). These banks had a very high debt-to-asset ratio (total liabilities/total assets) of around 90 percent during the period of 2007–2009. This ratio measures the percentage of a bank’s assets that are financed with debt. Generally, any ratio above 75 percent indicates that the institution is highly leveraged, suggesting potential problems of paying off its debts. Like many other major U.S. banks, the Union Bank of Switzerland (UBS) was heavily invested in subprime mortgage lending practices, experiencing billions of dollars in losses during the crisis. As a result, the UBS obtained billions of dollars from the Swiss government.
In 2006, 600 billion dollars of subprime loans were originated, accounting for 23.5 percent of all mortgage loan origination (Financial Crisis Inquiry Commission 2011). Citigroup, one of the largest commercial and investment banking conglomerates in the world, was heavily exposed to CDOs. The Financial Crisis Inquiry Commission (FCIC) reported that Citigroup’s leverage ratio was 32:1 by the end of 2007. That year, Citigroup purchased 947 million dollars in mortgage-backed bonds. In order to bypass the capital requirement regulation for mortgages, these bonds were then sold off to another company and omitted from Citigroup’s balance sheet (Financial Crisis Inquiry Commission 2011). Similarly, Bank of America’s leverage ratio was 27:1 in 2007 (Financial Crisis Inquiry Commission 2011). According to the Federal Commission’s report, the leverage ratio in 2007 for Citigroup and Bank of America would have been 53% and 28% higher, respectively, if off-balance sheet assets had been included (Financial Crisis Inquiry Commission 2011). These high leverage ratios made conventional banks increasingly more vulnerable to a financial crisis, as they had less capital to absorb losses. Furthermore, acquisitions of a number of smaller banks by larger banks in the United States increased the concentration in the U.S. banking industry. Consequently, the credit crunch in 2008 created a much larger problem than if the risk had been distributed across a larger number of financial institutions. It is important to note that Islamic banks maintain a much lower leverage ratio (assets/capital) than commercial banks.
Empirical research comparing the performance of Islamic banks (IBs) and commercial banks (CBs) reveals that, generally, IBs outperformed CBs during and after the global financial crisis of 2007–2009. However, IBs experienced slower growth rates and lower real-estate values on their property holdings during this period. The capital structure and investment decisions of IBs are religiously influenced. The better performance of IBs relative to CBs stems from their unwillingness to borrow from other banks and depositors, making them less vulnerable to a financial crisis. Alqahtani and Mayes (2018) examined the financial stability of Islamic and commercial banks during the global financial crisis by utilizing panel data of 76 banks in the Gulf Cooperation Council region. Their study revealed small Islamic banks were more stable during the financial crisis, escaping the instability of other financial systems (financial instruments, markets, and institutions). Cerović et al. (2017) compared the stability and efficiency of conventional and Islamic banks before, during, and after the recent global financial crisis. Their study showed Islamic banks experienced more stability and efficiency than conventional banks. They contended the regulation of financial markets and financial institutions is very important for the financial stability and efficiency of the banking system.
Turki Alshammari in his 2017 study (Alshammari 2017) found that the 2008 subprime crisis affected the performance of CBs, but not the IBs in Saudi Arabia, Kuwait, and United Arab Emirates. Mollah et al. (2017) examined whether the difference in governance structures influences the performance of Islamic banks compared to commercial banks. They used a sample of 52 Islamic banks and 104 conventional banks in 14 countries during the period of 2005–2013. They concluded that the governance structure of Islamic banks played a critical role in their financial performance and helped IBs achieve better performance than conventional banks. Similarly, Farooq and Zaheer (2015) used financial data from Pakistan to compare Islamic and commercial banks during the financial crisis. Their findings indicate that IBs were less exposed to withdrawals of deposits during the financial crisis.
According to a comparative study by Ambreen Zeb Khaskhelly (2015) of six IBs and six CBs in the Gulf Cooperation Council (GCC) countries, IBs were less affected by the recent global financial crisis than CBs. In addition, the study revealed that IBs were equity-based financed, while CBs were debt-based financed. Furthermore, selected IBs experienced a higher growth rate on their total assets (22%) than selected CBs (18%) over the study period of 2005–2010. In contrast, Beck et al. (2013) found little difference in efficiency between Islamic and conventional banking. Nevertheless, these results showed that IBs are less likely to fail during a financial crisis due to their higher capitalization and higher liquidity reserves, which in turn explains their better performance relative to CBs during the global financial crisis of 2007–2009. Furthermore, risk-sharing intermediation and observance of Sharia-compliant banking banned IBs from investing in high-risk securities, which helped contribute to the crisis.
Bourkhis and Nabi (2013) used regression analysis to examine the comparative financial stability of 34 Islamic banks and 34 commercial banks. The authors found that there was no significant difference in terms of the effect of the recent global financial crisis on the stability of the two types of banks. Rajhi and Hassairi (2013) applied the Altman Z-score model to examine the insolvency risk of IBs and CBs in a sample of 16 Middle East, North African, and South East Asian countries. Their results showed that Islamic banks were more stable (higher Z scores) than conventional banks. Al-Deehani et al. (2015) studied the performance of 13 Islamic banks and 12 commercial banks in the Gulf Council Countries (GCC) during the 2001–2012 period. By utilizing a multivariate general linear model (GLM), they tested for differences in performance during the 2008 economic downturn. Their results revealed statistically significant differences in performance between IBs and CBs. The liquidity ratios for IBs increased while the liquidity ratios decreased for CBs during the crisis. Ouerghi (2014) examined the performance of IBs and CBs by comparing profitability, capital adequacy, and leverage for the period of 2007–2010. He used return on average assets (ROAA) and return on average equity (ROAE) as profitability ratios. For the capital adequacy ratio, the capital asset ratio was used. The loan-to-deposit ratio (LTD), as well as the net loans-to-total assets ratio (NLTA) were used for liquidity ratios. He considered the cost-to-income ratio for the efficiency ratio. For the leverage ratio, the equity-to-total asset ratio, as well as the equity-to-total liabilities ratio were utilized. The results of this study demonstrated that large IBs outperformed large CBs, whereas small banks performed better than large banks. He argued that the lower leverage ratios allowed IBs to finance investment projects without fear of insolvency during a financial crisis. Furthermore, IBs have significantly higher liquidity ratio relative to CBs, thereby lowering the risk for insolvency during a financial crisis.
Parashar and Venkatesh (2010) measured the relative financial performance of IBs during the period of 2006–2009. They concluded that IBs performed better in terms of profitability than CBs, attributable to their greater capital adequacy and liquidity ratios. Hasan and Dridi (2011) in a cross-country analysis found that, during the 2007–2009 global financial crisis, IBs performed better than CBs in terms of asset growth, indicating a growing market and higher solvency. Generally, businesses with higher solvency ratios are more likely to meet their obligations. Diamond and Dybvig (1983) argue that “CBs, as financial intermediaries, are inherently unstable since they function mainly as depository institutions.” IBs function primarily as investment institutions, obtaining capital through profit-sharing and equity investment. Investment accounts of IBs are not liabilities, as they are not guaranteed like demand deposits of CBs.
Some researchers, such as Nafis Alam (2012), have tried to estimate the relationship between the risk and efficiency of the Islamic banking system. Alam applied the Zellner (1962) seemingly unrelated regression (SUR) analysis to allow for simultaneity between banks’ risk and efficiency. His results show that countries with a better regulatory framework for the Islamic banking system improved their efficiency during the period of 2000–2010. A SUR model can be regarded as a simultaneous equations system in which exogenous variables can be endogenous variables. By using the generalized least squares (GLS) technique, the SUR model approach allows for simultaneous relationships between the error terms, making the error terms uncorrelated between the equations.
3. Data and Methodology
The information in our study covers the period of 2006–2013. During 2007–2009, the world economy faced its most serious crisis since the Great Depression of the 1930s. In a comparative analysis, the efficiency and profitability of Islamic banks (IBs) were compared to commercial banks (CBs). The Great Recession of the early twenty-first century caused the closure of hundreds of banks by the Federal Deposit Insurance Corporation (FDIC) in the United States. The U.S. financial crisis of December 2007–June 2009 was caused primarily by the collapse of the housing market and the subprime mortgage crisis. Banks made loans to borrowers with a weak credit history and greater risk of default. Many subprime loans were packaged into mortgage-backed securities (MBS). Banks sold these MBS to investors, thereby trigging the 2008 housing market crash. The following commercial and Islamic banks were used in this study.
3.1. Selected Commercial Banks (CBs)
We selected the following eleven large commercial banks based on total assets and total revenue, as these are the most commonly used measure of bank size:
Wells Fargo (WF), USA; ICBC, China; JP Morgan Chase (JPMC), USA; China Construction Bank (CCB); Bank of America (BAC), USA; HSBC, UK; Bank of China (BOC); Citigroup (CITI), USA; Commonwealth Bank of Australia (CBA); Banco Santander (BS), Spain; and USB, Switzerland.
3.2. Selected Islamic Banks (IBs)
A major obstacle in research is the availability and quality of data. We used annual reports and publicly accessible websites of many Islamic banks and selected the following eight banks:
Dubai Islamic Bank (DIB), UAE; Al Baraka (ABK), Bahrain; CIMB Bank Berhad, Malaysia; Public Islamic Bank Berhad (PIBB), Malaysia; Syariah Mandiri (SM), Indonesia; Islamic Bank Bangladesh (IBB); Kuwait Finance House (KFH); and Meezan Bank (MZN), Pakistan.
In this study, we used the following four different methodologies to develop a comprehensive framework for measuring banking solvency.
4. Altman Z-Score Analysis
The purpose of this paper was to measure and contrast the impact of the global financial crisis of 2007–2009 on the financial performance of selected Islamic and commercial banks, using the financial data from their financial statements. This was achieved by utilizing the Altman Z-score model (Altman 1968) to measure the efficiency and insolvency of eleven commercial and eight Islamic banks around the world. One of the main concerns regarding both Islamic and commercial banks is the risk of insolvency, in which banks can no longer pay back their debts. In 1968, Edward Altman developed the “Altman Z-score” for predicting bankruptcy of different business firms. The Altman Z-score is a linear combination of four or five (four-factor or five-factor model) financial ratios, weighted by different coefficients. Table 1 displays the 5-factor model of the Altman Z-score. Altman utilized the Z-score model to determine a company’s financial health. For fifty years, this model has been used to analyze the financial stability of business firms, testing whether or not a company is likely to become bankrupt. In his 1968 study entitled “Financial Ratios, Discriminant Analysis and the Prediction of Corporate Bankruptcy,” Altman calculated Z-scores for 66 publicly traded companies to determine their financial health. Table 2 shows the interpretation of the Altman Z-score. From reviewing the literature on the assessing bankruptcy risk of business corporations, it is evident that the Z-score is one of the most accurate predictors for failed financial institutions. Most studies found the model to be between 80–90% accurate in predicting bankruptcy one year before actual bankruptcy (Altman 2013). However, the Z-score is only as good as the financial data used in its computation. If a company were to manipulate data to appease its stockholders, the data would not be a true, nor a fair representation of the company’s financial performance.
Altman’s Z-scores, as described earlier, were calculated for nineteen financial institutions, comprised of eight IBs and eleven CBs. The results of Altman’s Z-score are illustrated below in Figure 1, which shows that all selected IBs outperformed the selected CBs. As shown in Figure 1, among the financial institutions investigated in this study, selected CBs suffered tremendously due to the global financial crisis, while the negative impacts on selected IBs were much lower. The empirical findings indicate that both CBs and IBs were experiencing severe financial difficulties (as presented with lower Altman Z-scores), but IBs were performing much better than their counterparts (higher Altman Z-scores).
Weighted Z-scores calculation: First, the debt/asset ratios for all banks were compiled for a given year. Then, the sum of all debt/asset ratios was computed and used to calculate a weighted average for the debt/asset ratio, which implies a lesser weight for banks with greater debt/asset ratios. Then, a weighted average of the actual Z-scores was calculated (weighted Z-score).
5. Ratio Analysis
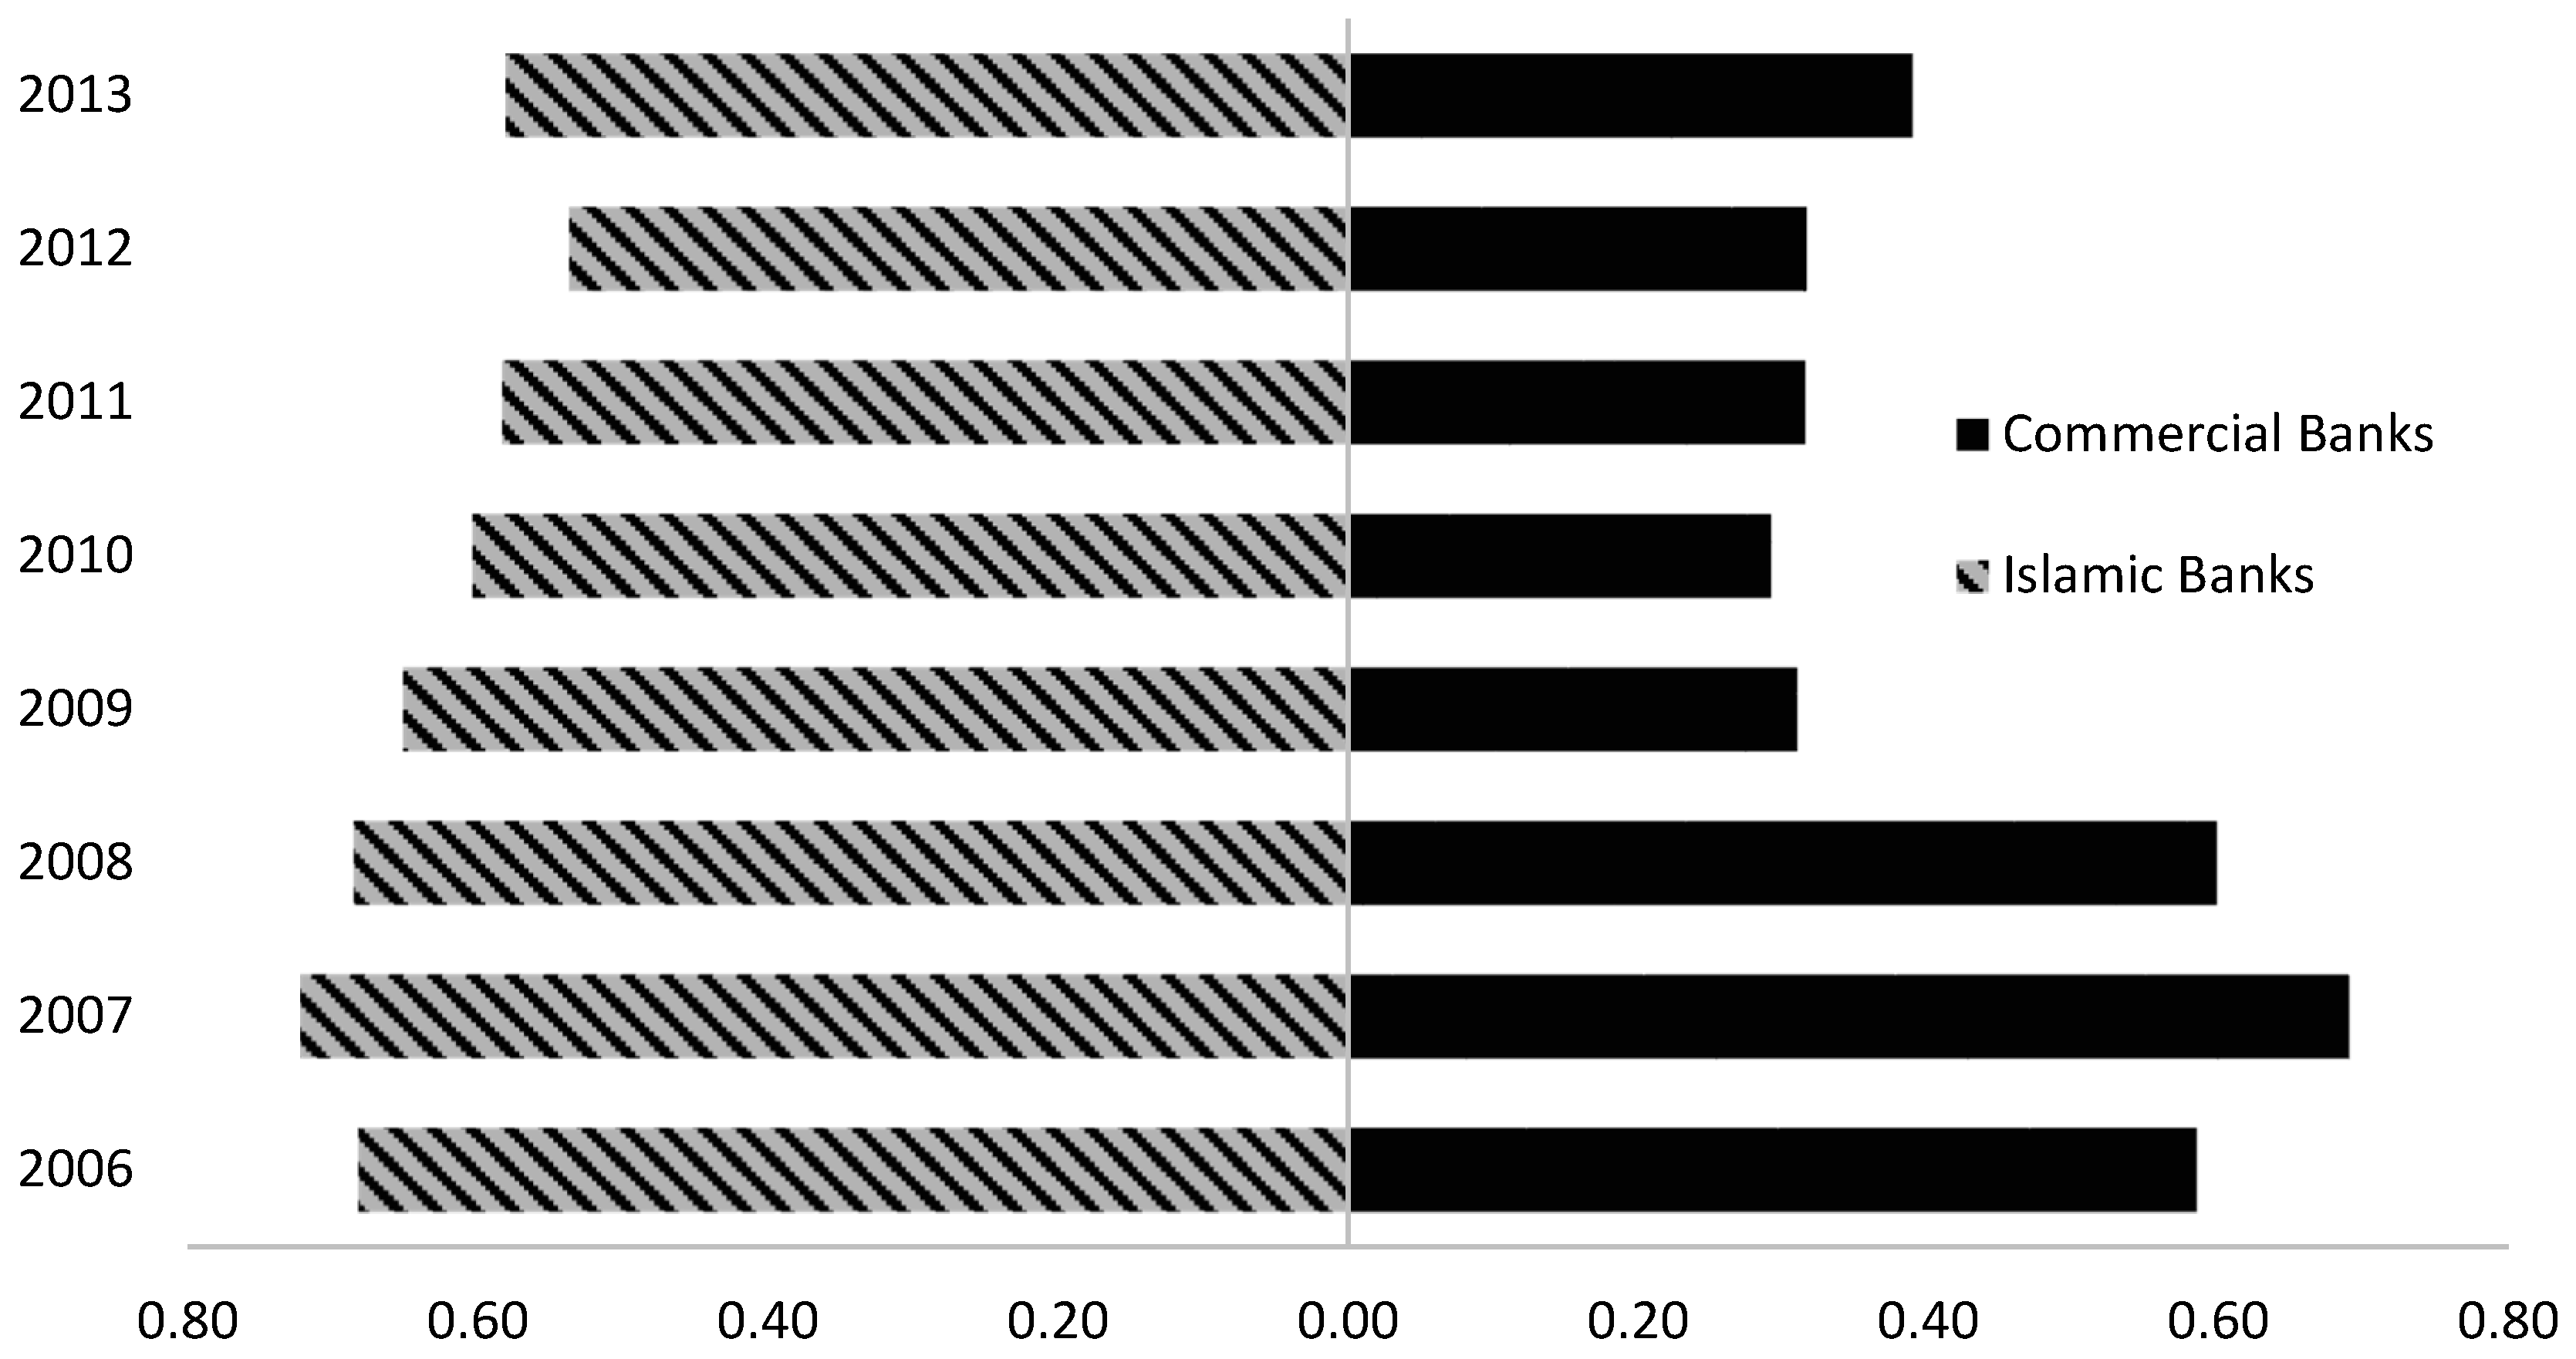
The debt-to-asset ratio was calculated for all selected banks, using their publicly available financial statements. In order to examine whether CBs have a higher proportion of capital financed by debt in comparison to IBs, the average debt/asset ratios for commercial and Islamic banks for the period of 2006–2013 were compared (Figure 2). The analysis suggests that the debt/asset ratios of CBs were significantly higher than IBs. In general, banks with a higher debt/asset ratio will have more difficulty in remaining solvent.
- Islamic banks enjoy a lower debt/asset ratio—the less leverage a bank is using, the stronger its equity position.
- A higher debt/asset ratio (0.7 or higher) means that the bank has more debt to service and makes it more difficult to borrow money.
6. Data Envelopment Analysis (DEA)
In an attempt to confirm our results obtained earlier, we employed the non-parametric data envelopment analysis (DEA) method to evaluate the relative efficiency (output–input ratio) of Islamic and commercial banks used in this study. DEA compares all observed outputs and inputs for all units of an organization to measure the degree of efficiency. DEA is a non-parametric, multiple input–output efficiency technique, which measures the relative efficiency of decision-making units (DMUs), using a linear programming model. It compares each DMU with the most efficient DMUs in the sample. Charnes et al. (1978) originally developed the DEA methodology to evaluate relative efficiencies and performance of decision-making units (DMUs). In this study, the DEA methodology was utilized to estimate the “relative” efficiency of a bank (DMU), and to compare each bank with the most efficient banks (DMUs).
Assuming there are m inputs, s outputs, and n decision-making units (DMUs), the basic model is equivalent to solving the following linear programming model:
- Maximize: uy0
- Subject to: vx0 = 1
- −vX + uY ≤ 0
- ≥ 0, u ≥ 0
where:
- X denotes the m × n matrix of all DMU inputs.
- Y denotes the s × n matrix of all outputs.
- x0 and y0 are the input and output column matrix.
- v and u are the input and output weights, determined by the DEA linear programming model.
In this study, eight Islamic banks and eleven commercial banks were analyzed. A DEA was applied to compare different decision-making units (DMUs) based on the inputs and outputs. The inputs used in this study were total equity, current assets, and total assets. The outputs used were gross earnings (sales), and earnings before interest and taxes (EBIT). All the variables were calculated as a weighted average taken over the years from 2006 to 2013.
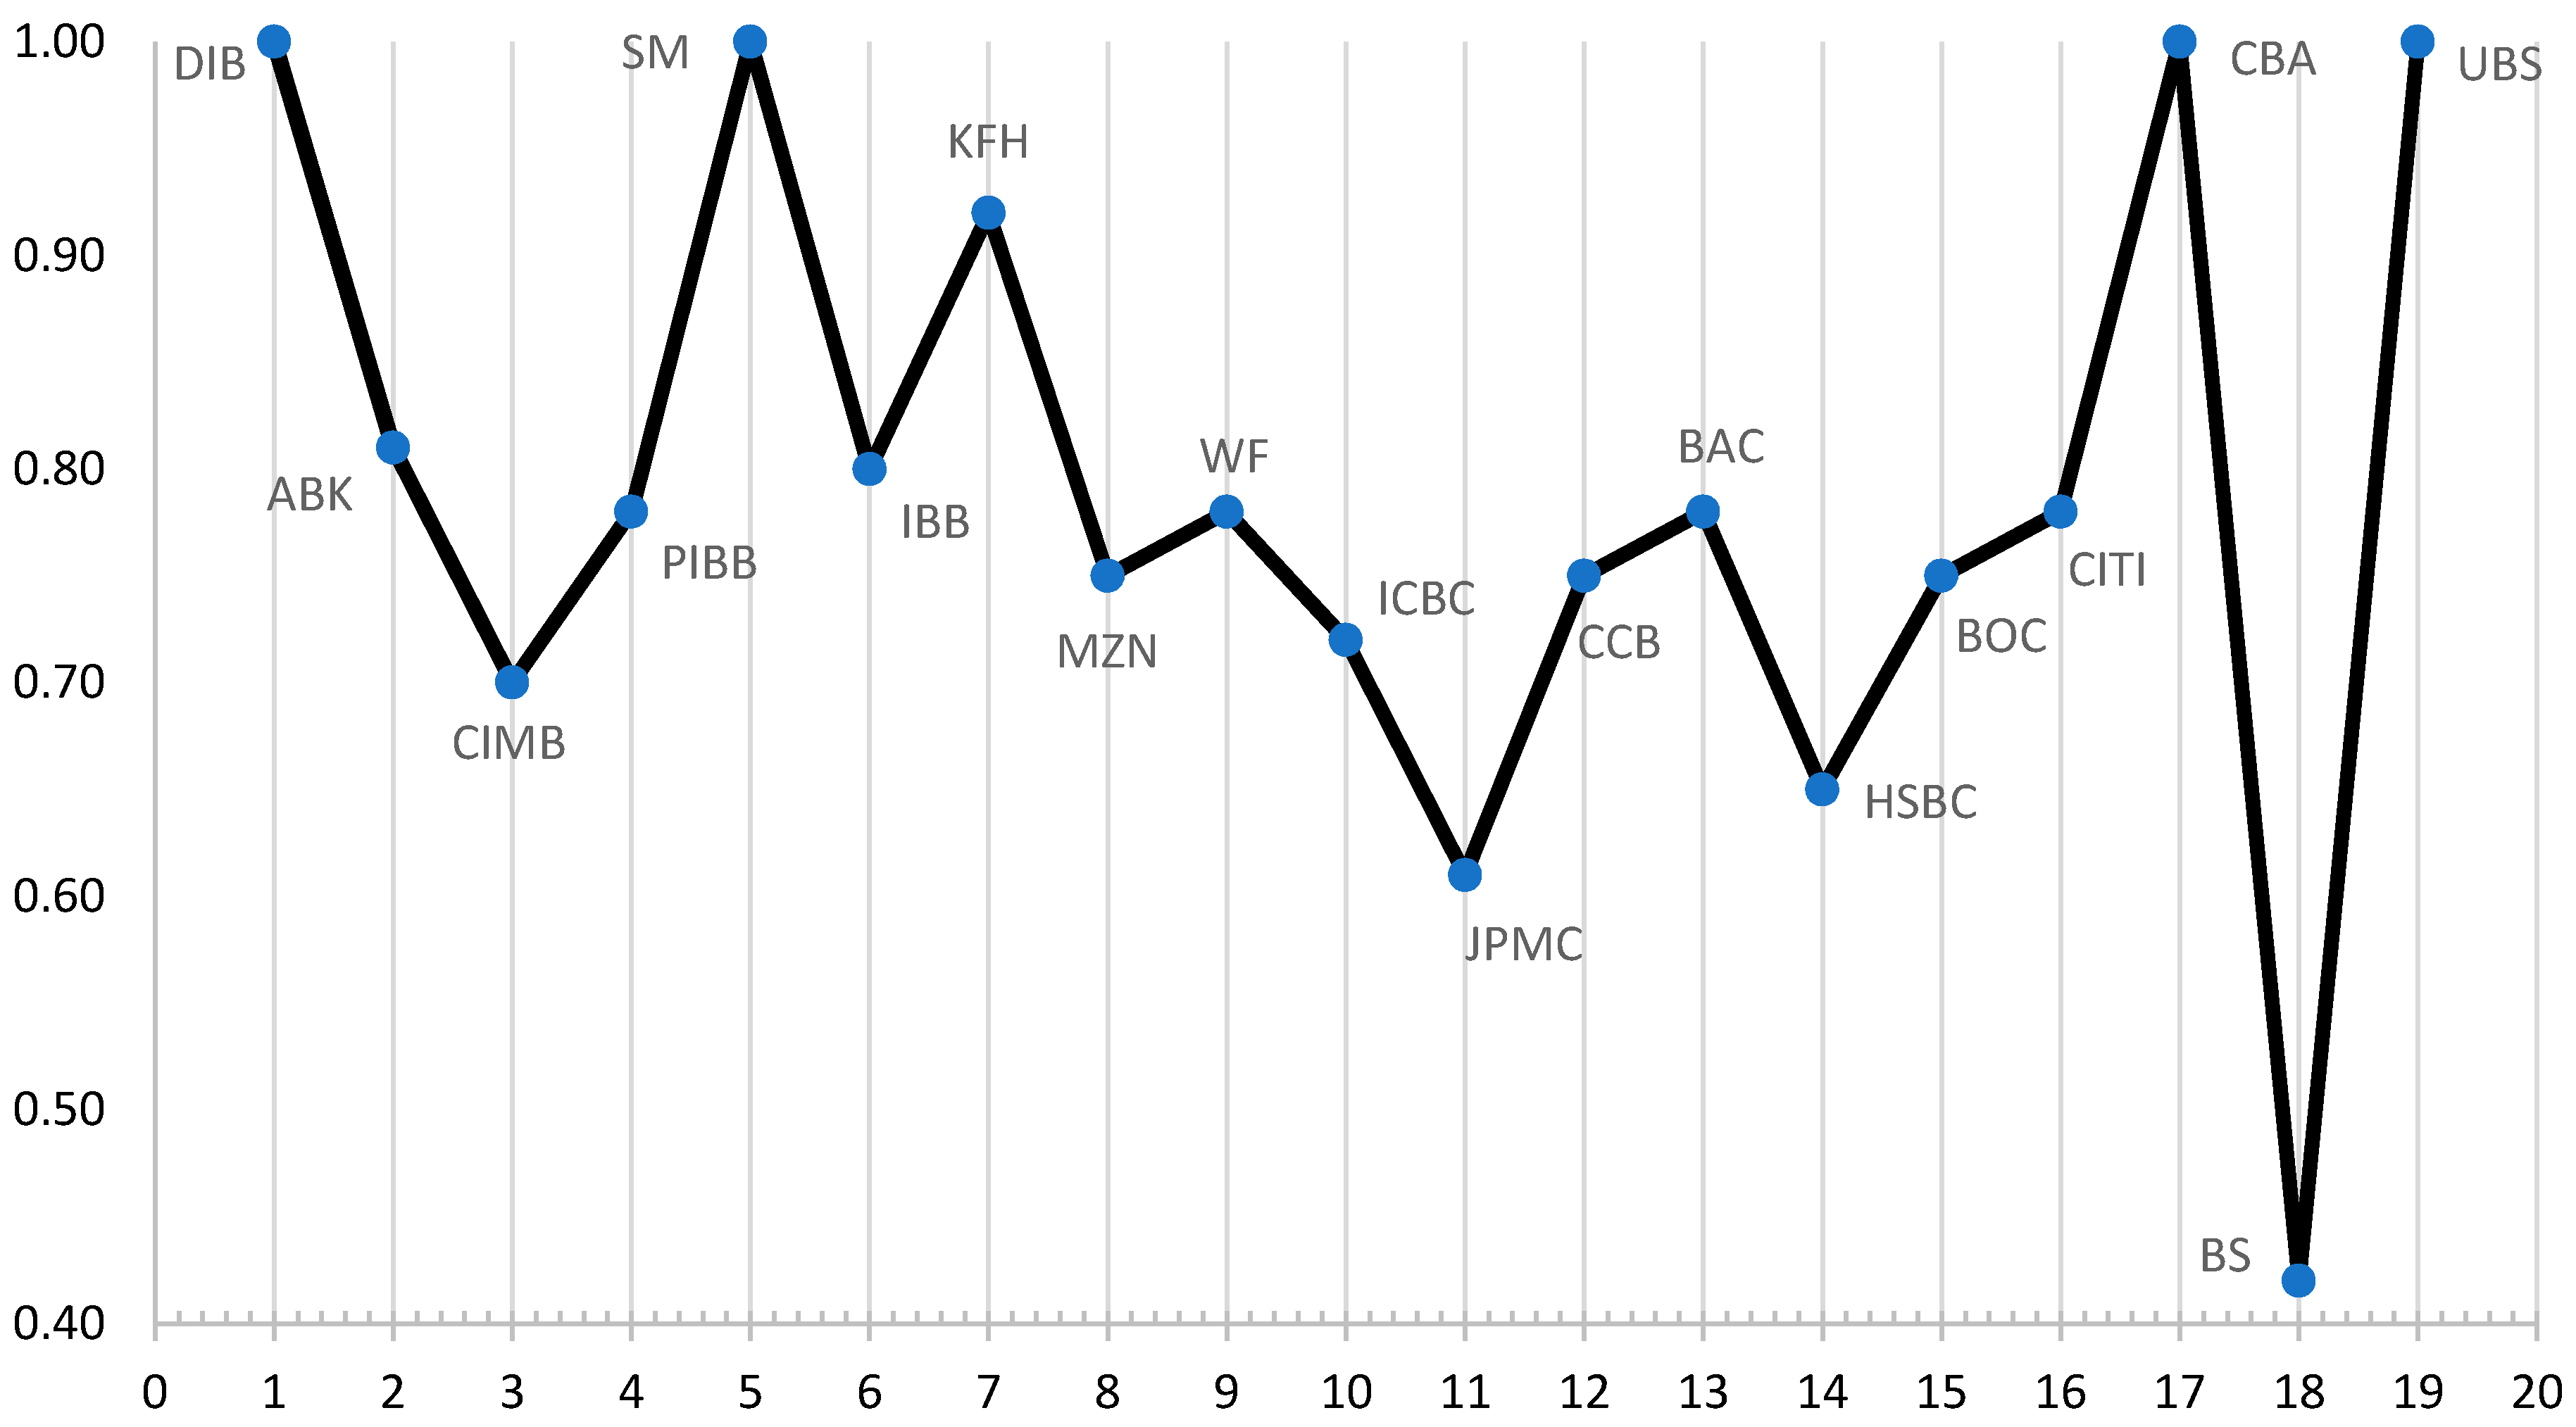
The main purpose of this DEA analysis was to study the effect of the financial crisis of the late 2000s on Islamic and commercial banks. As seen in Figure 3, based on the DEA with the constant return to scale (CRS) model, the relative efficiency for two Islamic banks (DIB and SM) and two commercial banks (CBA and UBS) was 100 percent. During the same period (2006–2013), the relative efficiency for most of the commercial banks was lower than the Islamic banks. IBs had an almost even spread of relative efficiencies. The fluctuations in efficiencies of the commercial banks were much larger than the Islamic banks. During this period, the Islamic banks managed to maintain their efficiency, while most of the profit-oriented commercial banks suffered a loss in efficiency. Figure 3 shows the results of the relative efficiency of selected Islamic and commercial banks.
The most efficient banks in the sample were DIB, SM, CBA, and UBS. It is interesting to note that the majority of the commercial banks were less efficient than the Islamic banks. The least efficient banks in the sample were CIMB, HSBC, JPMC, and BS.
7. Seemingly Unrelated Regression (SUR) Analysis
In this section, the seemingly unrelated regression (SUR) method was used to estimate the impact of economic shocks on financial institutions under different business structures. Arnold Zellner developed the SUR model in 1962. Unlike the ordinary least squares (OLS) regression model, the SUR model explains the variation of a set of dependent variables rather than one dependent variable. The SUR method is appropriate when there is more than one regression equation, each having their own dependent (endogenous) variable and different sets of explanatory (exogenous) variables. The SUR model estimates the parameters of all equations simultaneously, thus the parameters of each single equation obtain information from the other equations. The SUR model is a special case of a simultaneous equations model, where the right-hand side (RHS) contains endogenous variables such as the following matrix:
In the above matrix:
- n = number of equations.
- m = number of independent variables.
- Y = vector of dependent variables.
- β = vector of coefficients.
- X = independent variables.
- ε = vector of residual values.
In this section, we use two equations to run the SUR model, one for Islamic banks and one for commercial banks. The SUR model gives more efficient parameter estimates, as it accounts for cross equation dependence. The base model for Z-scores composition consists of two single equations (CBs and IBs) to simultaneously predict insolvencies. Consider the following model, which is based on the Zellner’s seemingly unrelated regression model:
The dependent variables are Altman Z-scores. The independent variables that affect the solvency of a bank are the liquidity (working capital), profitability (retained earnings), equity, the return on assets, and sales, where:
- A = working capital
- B = retained earnings
- C = total equity capital
- D = total sales/revenue
- αs and βs are the regression coefficients.
- εCB and εIB are the error terms in the model.
- DUM = dummy variables: DUM = 0 if an observation is not from 2007–2008, DUM = 1 if an observation is from 2007–2008.
The SUR results in Table 3 support that the Islamic banks have performed differently from the commercial banks during the global financial crisis of 2007–2009. The results also show that Islamic banks were more financially solvent than commercial banks (CBs) during the crisis.
Solvency measures the ability of a business to fulfill its long-term, as well as short-term financial obligations. Working capital is a liquidity ratio that measures a bank’s ability to pay off its current liabilities with current assets. A company’s short-term solvency is determined by the working capital-to-total assets ratio. The results of this study indicate that on average the CBs require almost twice the working capital of IBs to achieve the same level of financial solvency, and similarly with respect to the retained earnings.
Total bank equity capital includes retained earnings as well as common and perpetual preferred stock. IBs try to prevent debt-financing by using equity-financing, similar to venture capitalism. Venture capital business firms, like IBs, share the risks of the businesses they finance. We found that the coefficient of equity for the CBs is 1.01 and is 0.43 for the IBs. A positive coefficient for equity indicates a direct relationship between equity and solvency, as was expected. The global financial crisis of 2007–2009 had a negative impact on the solvency of the financial institutions. Furthermore, by looking at the coefficient of dummy variables, the financial crisis had greater impacts on CBs than IBs.
8. Results
In our empirical analysis, we utilized four different methodologies: (a) The Altman Z-score model, (b) ratio analysis, (c) the data envelopment analysis (DEA) method, and (d) seemingly unrelated regression (SUR) analysis. The results show that during the global financial crisis of 2007–2009, Islamic banks (IBs) managed to maintain their efficiency, while most commercial banks (CBs) suffered a loss in their efficiency.
This study found that the financial crisis did not have a significant impact on the profitability of Islamic banks. In particular, the results confirm that Islamic banks overall were more financially solvent as compared to commercial banks during the study period of 2006–2013. Islamic banking is based on the Islamic faith and must comply with the Sharia (Islamic Law). The foundation of Islamic banking is based on three fundamental principles: (a) Avoiding speculation, (b) investing ethically, and (c) prohibiting paying or receiving interest (Riba) on Sharia transactions. While conventional finance is built on a debt-based and risk transferring model, the Islamic banking system is built on an asset-based and risk-sharing model. The profit-loss sharing arrangement of the Islamic banking system leads to safer lending practices. Financial institutions, mainly large commercial banks, took excessive risks as part of their aggressive growth policies. Commercial banks attained their high growth rates by significantly increasing their mortgage lending to the public. This increase in financing mortgages enhanced upward pressure on home prices. Furthermore, commercial banks made a prevalent pattern of issuing loans to borrowers with a weak credit history and greater risk of default, thereby triggering the 2008 housing market crash.
The main causes of the crisis were the deregulation of the financial market and the emergence of new financial instruments. Changing banking regulations and limiting commercial banks’ risky financial practices could help prevent another financial crisis. In 2010, as a response to the 2007–2009 financial crisis, former President Barack Obama signed the Dodd–Frank Act into law. The Dodd–Frank Act is a piece of financial reform legislation, which restricts how commercial banks invest and limits their speculative transactions. The new changes in banking regulations are contributing positively to the stability of the financial system.
9. Summary and Conclusions
The goal of this study was to assess the profitability of financial institutions during the global financial crisis of 2007–2009. Islamic finance has developed Sharia-compliant interest-free banking as an alternative to Western interest-based financial intermediaries. Islamic banks (IBs) offer a number of faith-based, asset-backed, and interest-free financial products to compete with the interest-based financing of commercial banks (CBs). This research analyzed the impact of the global financial crisis on financial institutions through utilization of the Altman Z-score model, ratio analysis, the data envelopment analysis (DEA) method, and the seemingly unrelated regression (SUR) model. The objective of this research was to provide empirical evidence on the performance of Islamic banks in the world during and following the global financial crisis of 2007–2009. The results show that during this period, Islamic banks managed to maintain their operating efficiency while most commercial banks suffered a loss in efficiency. The empirical results support the resilience of the Islamic banking system, as the financial crisis did not have a significant impact on the profitability of the Islamic banks.
The data envelopment analysis (DEA) technique and seemingly unrelated regression (SUR) method were applied to measure the relative economic solvencies of Islamic and commercial banks. The results suggest that Islamic banks overall were more financially solvent as compared to commercial banks during the study period. Islamic banks endured the impact of the global financial crisis much better than commercial banks. This study used a sample study period of 2006–2013, which includes the recent global financial crisis. The main limitation of the study was the availability of data with respect to Islamic banks. The number of Islamic banks covering the study period of 2006–2013 was eight, which limited the scope of our study. To increase the accuracy of the empirical analysis, future studies on the financial performance of Islamic banks versus commercial banks should include additional countries and larger data collection. Islamic banking has become one of the fastest growing sectors of the global financial system. It will be interesting to see how Islamic banking, as an ethical alternative to conventional banking, grows to satisfy the growing global demand for financial services (including non-Muslim investors). In conclusion, Islamic banks presented less volatility in financial solvency than their counterpart, commercial banks, during the global financial crisis of 2007–2009.
Author Contributions
G.R.E.: Investigation/Theory/Writing; B.V.: Methodology.
Funding
This research received no external funding.
Conflicts of Interest
The authors declare no conflict of interest.
References
- Alam, Nafis. 2012. Risk-Efficiency Relationship in Islamic Banking: Global Evidence. Journal of Islamic Economics, Banking and Finance 8: 49–66. [Google Scholar]
- Al-Deehani, Talla M., Hasan Mounir El-Sadi, and Mohammad T. Al-Deehani. 2015. Performance of Islamic Banks and Conventional Banks before and during Economic Downturn. Investment Management and Financial Innovations 12: 238–50. [Google Scholar]
- Alqahtani, Faisal, and David G. Mayes. 2018. Financial stability of Islamic banking and the global financial crisis: Evidence from the Gulf Cooperation Council. Economic Systems 42: 346–60. [Google Scholar] [CrossRef]
- Alshammari, Turki. 2017. Performance differences between Islamic and Conventional Banking forms. Banks and Bank Systems 12: 237–46. [Google Scholar] [CrossRef]
- Altman, Edward I. 1968. Financial Ratios, Discriminant Analysis and the Prediction of Corporate Bankruptcy. Journal of Finance 23: 589–609. [Google Scholar] [CrossRef]
- Altman, Edward I. 2013. Predicting Financial Distress of Companies: Revisiting the Z-Score and Zeta Models. In Handbook of Research Methods and Applications in Empirical Finance. Edited by Adrian R. Bell, Chris Brooks and Marcel Prokopczuk. New York: Stern School of Business, New York University, Chp. 17. pp. 428–56. [Google Scholar]
- Beck, Thorsten, Asli Demirg-Kunt, and Ouarda Merrouche. 2013. Islamic vs. Conventional Banking: Business Model, Efficiency and Stability. Journal of Banking and Finance 37: 433–47. [Google Scholar] [CrossRef]
- Bourkhis, Khawla, and Mahmoud S. Nabi. 2013. Islamic and Conventional Banks’ Soundness during the 2007–2008 Financial Crisis. Review of Financial Economics 22: 68–77. [Google Scholar] [CrossRef]
- Cerović, Ljerka, Stella Suljić Nikolaj, and Dario Maradin. 2017. Comparative Analysis of Conventional and Islamic Banking: Importance of Market Regulation. Ekonomska Misao 26: 241–63. [Google Scholar]
- Charnes, Abraham, William W. Cooper, and Edwardo Rhodes. 1978. Measuring the Efficiency of Decision Making Units. European Journal of Operational Research 2: 429–44. [Google Scholar] [CrossRef]
- Diamond, Douglas W., and Philip H. Dybvig. 1983. Bank Runs, Deposit Insurance, and Liquidity. Journal of Political Economy 91: 401–19. [Google Scholar] [CrossRef]
- Farooq, Moazzam, and Sajjad Zaheer. 2015. Are Islamic Banks More Resilient during Financial Panics? Pacific Economic Review 20: 101–24. [Google Scholar] [CrossRef]
- Financial Crisis Inquiry Commission. 2011. The Financial Crisis Inquiry Report: Final Report of the National Commission on the Causes of the Financial and Economic Crisis in the United States; Washington, D.C.: Government Printing Office.
- Hasan, Maher, and Jemma Dridi. 2011. The Effects of the Global Crisis on Islamic and Conventional Banks: A Comparative Study. Journal of International Commerce, Economics and Policy 2: 163–200. [Google Scholar] [CrossRef]
- Khaskhelly, Ambreen Zeb. 2015. Comparative Analysis of Performance of Islamic Vis a Vis Conventional Banking of Pakistan during Global Financial Crisis 2007–2010. Journal of Islamic Banking and Finance 32: 45–55. [Google Scholar]
- Kuttner, Robert. 2007. The Alarming Parallels between 1929 and 2007. In Testimony of Robert Kuttner before the Committee on Financial Services. Washington, D.C.: US House of Representatives, October 2. [Google Scholar]
- Mollah, Sabur, M. Kabir Hassan, Omar Al Farooque, and Asma Mobarek. 2017. The Governance, Risk-taking, and Performance of Islamic Banks. Journal of Financial Services Research 51: 195–219. [Google Scholar] [CrossRef]
- Ouerghi, Feryel. 2014. Are Islamic Banks More Resilient to Global Financial Crisis Than Conventional Banks? Asian Economic and Financial Review 4: 941–55. [Google Scholar]
- Parashar, Sat, and Jyothi Venkatesh. 2010. How did Islamic Banks do during the Global Financial Crisis? Banks and Bank Systems 5: 54–62. [Google Scholar]
- Rajhi, W. Wassim, and Slim A. Hassairi. 2013. Islamic banks and financial stability: A comparative empirical analysis between MENA and Southeast Asian countries. Région et Développement 37: 150–77. [Google Scholar] [CrossRef]
- The New York Times. 2008. Bailout: The Rescue Plan & the Largest Recipients. The New York Times, October 13. [Google Scholar]
- Zellner, Arnold. 1962. An Efficient Method of Estimating Seemingly Unrelated Regression Equations and Tests of Aggregation Bias. Journal of the American Statistical Association 57: 348–68. [Google Scholar] [CrossRef]
Figure 1.
Islamic banks versus commercial banks. Altman weighted Z-scores (2006–2013).

Figure 2.
Average debt/asset ratios. Commercial vs. Islamic banks, 2006–2013.

Figure 3.
Relative efficiency of selected banks, 2006–2013.


Table 1.
Financial ratios of the Altman Z-score.
| Z-Score = 1.2A + 1.4B + 3.3C + 0.6D + 1.0E (Altman’s Z-score Equation) |
|---|
| A = Working Capital/Total Assets |
| Working Capital = Current Assets − Current Liabilities |
| This measures a company’s ability to cover its short-term financial obligations (efficiency and financial health). Positive working capital means that the company is able to meet its short-term obligations. |
| B = Retained Earnings/Total Assets |
| The lower the ratio, the more a company is funding its assets by borrowing rather than through retained earnings, which increases the risk of bankruptcy of the firm. |
| C = Earnings Before Interest & Tax (EBIT)/Total Assets |
| A measure of a firm’s profit that excludes interest payments and income taxes. EBIT (or operating profit) is the difference between operating revenues and operating expenses. The greater a company’s earnings in proportion to its assets (the greater this ratio), the more effectively the company is using its assets. |
| D = Market Value of Equity/Total Liabilities |
| The ratio of market value of equity (as measured by market capitalization, multiplying the company’s stock price by its number of outstanding shares) to total liabilities. The higher the market capitalization of a company, the higher the probability that the firm can survive in the future. |
| E = Sales/Total Assets |
| The sales-to-total-assets ratio (asset turnover) measures the amount of sales generated by a company for every dollar of its assets. Sales growth is one of the most important determinants of company performance. The higher this ratio, the more efficient the company is in using its assets to generate sales. |
Table 2.
Interpretation of the Altman Z-score.
| ABOVE 3.0 | BETWEEN 2.70–2.99 | BELOW 1.80 |
|---|---|---|
| Safe Zone | Gray Zone | Distress Zone |
| The company is safe | Probably safe but with a good chance of going bankrupt | Very high probability of bankruptcy |
Table 3.
Seemingly unrelated regression estimation results of Islamic and commercial banks.
| Altman Index | Constant | A Working Capital | B Retained Earnings | C Total Equity | D Total Sales | E Dummy Variable 2007–2008 | R2 |
|---|---|---|---|---|---|---|---|
| CBs | −0.92 ** (−2.3) | 0.79 * (1.89) | 0.37 * (1.79) | 1.01 *** (6.56) | 0.35 * (1.92) | −0.89 * (2.02) | 0.46 |
| IBs | 1.08 * (1.78) | 0.43 * (1.96) | 0.22 * (2.00) | 0.43 * (1.96) | 0.15 * (1.95) | −0.44 * (1.86) | 0.49 |
Notes: Figures in parentheses are t-statistics. * Significant at 90% level; ** Significant at 95% level; *** Significant at 99% level. Number of Observations = 152.
© 2018 by the authors. Licensee MDPI, Basel, Switzerland. This article is an open access article distributed under the terms and conditions of the Creative Commons Attribution (CC BY) license (http://creativecommons.org/licenses/by/4.0/).
Share and Cite
MDPI and ACS Style
Erfani, G.R.; Vasigh, B. The Impact of the Global Financial Crisis on Profitability of the Banking Industry: A Comparative Analysis. Economies 2018, 6, 66. https://doi.org/10.3390/economies6040066
AMA Style
Erfani GR, Vasigh B. The Impact of the Global Financial Crisis on Profitability of the Banking Industry: A Comparative Analysis. Economies. 2018; 6(4):66. https://doi.org/10.3390/economies6040066
Chicago/Turabian StyleErfani, G. Rod, and Bijan Vasigh. 2018. "The Impact of the Global Financial Crisis on Profitability of the Banking Industry: A Comparative Analysis" Economies 6, no. 4: 66. https://doi.org/10.3390/economies6040066
Note that from the first issue of 2016, this journal uses article numbers instead of page numbers. See further details here.