Is Political Ideology Stable? Evidence from Long-Serving Members of the United States Congress


1
Center for Economic Education, Columbus State University, Columbus, GA 31907, USA
2
Department of Economics, Boston College, Chestnut Hill, MA 02467, USA
3
Department of Economics, University of New Haven, West Haven, CT 06516, USA
*
Author to whom correspondence should be addressed.
Economies 2019, 7(2), 36; https://doi.org/10.3390/economies7020036
Submission received: 18 March 2019
/
Revised: 26 April 2019
/
Accepted: 30 April 2019
/
Published: 6 May 2019
(This article belongs to the Special Issue Public Choice)
Abstract
:This study extends the political science and political psychology literature on the political ideology of lawmakers by addressing the following question: How stable is a legislator’s political ideology over time? In doing so, we employ Nokken–Poole scores of legislators’ political ideology for members of the United States (U.S.) House of Representatives and the U.S. Senate who were elected prior to the 103rd Congress that began in early 1991 and who served consecutively through the 115th Congress, which ended in early 2019. Results from individual time-series estimations suggest that political ideology is unstable over time for a sizable portion of the members of both major political parties who serve in the U.S. Congress, while analysis of the pooled data suggests that, after accounting for inertia in political ideology and individual legislator effects, Republican legislators become more conservative over time. These results run somewhat counter to the finding in prior studies that the political ideologies of lawmakers and other political elites are stable over time.
Keywords:
political ideology; roll-call voting; public choice; public policy; United States CongressJEL Codes:
D70; D721. Introduction
The voting behavior of the electorate and the actions of elected officials are largely shaped by core political values and political party affiliations. In the United States (U.S.), the Republican Party is, as indicated in seminal studies by Carmines and Stanley (1990, 1992); Levine et al. (1997); Abramowitz and Saunders (1998), generally associated with conservative political ideology, while the Democratic Party tends to be associated with liberal political ideology. As Layman and Carsey (2000) point out, the studies listed above demonstrate that, as an element of political partisanship, political ideology has risen in importance relative to social structure and performance. Other studies in political science have shown that voters associate specific issue ownership to political parties (Seeberg 2017), that voters tend to vote for candidates from parties aligned with their own political ideologies (Wright et al. 1985; Goren 2005), and that shifting political ideologies explains party-switching decisions by incumbent lawmakers (Nokken and Poole 2004).
The psychology literature also addresses the political psychology of ideology formation. For example, Jost et al. (2009) discuss the number and types of dimensions individuals employ in formulating their political opinions. More specifically, these authors delve into what they refer to as “elective affinities” between the situational and dispositional needs of individuals in terms of political ideology, as well as the consequences of political ideology vis-à-vis voter attitudes and judgments (Jost et al. 2009). Next, a more recent study by Ksiazkiewicz et al. (2016) explores the genetics of political ideology, and finds that measures of cognitive style (i.e., the need for cognition, the need for cognitive closure) account for distinct genetic variance in political ideology. Lastly, a new study by Naumann et al. (2017) examines data from a sample of U.S.-born Mexican Americans and finds that strength of Mexican identity, stronger integration acculturation attitudes, weaker assimilation attitudes, and lower socioeconomic status are associated with exhibiting a more liberal political ideology.1
The current study extends the political science and political psychology literature on the political ideology of lawmakers, particularly the studies by Nokken and Poole (2004) and Jost et al. (2009), respectively, by addressing the following question: How stable is a legislator’s political ideology over time? In doing so, we employ Nokken–Poole scores (Nokken and Poole 2004) of legislators’ political ideology for members of the U.S. House of Representatives and the U.S. Senate who were elected prior to the 103rd Congress that began in early 1991 and who served consecutively through the 115th Congress, which ended in early 2019. Results from individual time-series estimations suggest that political ideology is unstable over time for a sizable portion of the members of both major political parties serving in the U.S. Congress. Additionally, analysis of the pooled data suggests that, after accounting for inertia in political ideology and individual legislator effects, Republican legislators become more conservative over time. These results, which run somewhat counter to the finding in prior studies of stability in the political ideologies of lawmakers and other political elites by Jennings (1992) and Jewitt and Goren (2016), not only have implications for how well legislators represent the interests of their constituents in representative democracy, they also provide a rationale for new avenues of empirical investigation in the public choice literature.
2. Prior Literature: A Brief Review
There is a body of emerging research that concerns “issue ownership” by local and national political parties. Issue ownership is defined in these studies as a “reputation for policy and program interest, produced by a history of attention, initiative and innovation towards problems which leads voters to believe that one of the parties is more sincere and committed to do something (Petrocik 1996, p. 826).” Overall, issue ownership is a key source of information used by voters in evaluating political parties and the legislative behavior of elected officials. Recent research on issue ownership has explored the concept of stability with regard to how voters attach issues to specific political parties over time. For example, Seeberg (2017) analyzes voter perceptions of political parties located at both ends of the ideology continuum (i.e., the liberal-conservative spectrum) for 17 countries across three decades and concludes that issue ownership is not only stable (and similar) over time and across countries, but it is also a “critical constant” in voting and party behavior. Other studies using large surveys to track the partisan attitudes of respondents in the United States over time have also found stability in the core political predispositions and partisan identities of the electorate (Sears and Funk 1999; and Goren 2005).
In addition to research on issue ownership, prior academic research has also found significant interstate variation in electorate political ideology. A seminal study by Wright et al. (1985) analyzes 76,000 responses to 51 separate CBS News and New York Times polls from 1974 through 1982 and finds that “both partisan and ideological differences matter in the behavior of state electorates, and that they are differentially important depending upon the nature of the choices offered to the voters (Wright et al. 1985, p. 488).” Moreover, while significant interstate variations continue to exist, the majority of more recent studies that explore the stability of state-level political ideology also show intra-state variability over time (e.g., see Berry et al. 1998, 2007).2
As in the case of research on constituent ideology, there is large body of work, showing mixed results, on the stability of the political ideology of elected officials.3 An important study by Jennings (1992) employing survey data finds that political party elites exhibit significantly more stable political preferences in terms of the traditional liberal-conservative dimension than do ordinary citizens, including those among the most politically active among the electorate.4 An analysis of 16 million individual roll call votes over two centuries in seminal research by Poole and Rosenthal (1997) shows that over 80 percent of a legislator’s voting decisions can be attributed to a consistent ideological position. On the other hand, Nokken and Poole (2004), using data on political party and roll call voting behavior between 1795 and 1995, find significant shifts in party-switching roll-call voting behavior during periods of high ideological polarization. More recent work by Lupton et al. (2015) contends that the political ideologies of political leaders fit the traditional unidimensional framework, while those of the general electorate are multidimensional.5 Results from survey data similar to those used by Jennings (1992) comparing structural political ideologies of political leaders and those of the mass public from 1980 to 2004 support their contention. Relatedly, Jewitt and Goren (2016) also use these survey data to examine whether the political ideologies of more engaged members of the electorate, whom they count as holding strong ideological identities, who are politically informed, and who participate actively in public affairs, are similar in terms of structure and stability to those of political elites. In doing so they conclude that, in 1980, ideologically engaged citizens exhibited more stable political ideologies than their less engaged counterparts, but less stable political ideologies than those of political leaders. However, by 1992, stability in the political ideologies of engaged citizens reached parity with that of political elites (Jewitt and Goren 2016).6
Our study extends this body of research by investigating stability of political ideology through the voting behavior of long-serving members of the U.S. Congress. In doing so, we first present our conceptual approach to voting behavior using the unidimensional policy space described in the public choice literature (e.g., see Krehbiel 1998). After a discussion of our conceptual approach, we discuss the data and statistical analyses that are the main focus of this study.
3. Political Ideology in the U.S. Congress: A Conceptual Approach
As a foundation of our empirical exploration into the stability of the political ideology of long-serving federal legislators in the U.S., we assert that collective choice occurs through voting on proposals that can be arranged along a unidimensional policy space. Following Krehbiel (1998, p. 21), it “is convenient and intuitive to think of the policy space as a continuum on which liberal policies are located on the left, moderate policies are located in the center, and conservative policies are located on the right. Because the policy space is continuous, it is possible to consider policies at any point between liberal and conservative extremes.” The policy space referred to above consists of the lawmakers’ ideal points, where a given lawmaker’s ideal point represents that policy that provides the lawmaker with greater benefits than all other policies (Krehbiel 1998, p. 22).7
Figure 1 presents a spatial model of policy preferences in the U.S. Senate, where each point on the liberal-conservative continuum represents an ideal point for one of the 100 lawmakers in the U.S. Senate.8 Here, the vertical line (see Figure 1) separates the most liberal lawmakers from the most conservative lawmakers. Lastly, in order to provide additional exposition, two individual lawmakers, m1 and m2, are highlighted in Figure 1. These two unnamed lawmakers represent pivotal lawmakers in the sense that they represent the potential majority vote on any bill under consideration by the U.S. Senate (Krehbiel 1998, p. 24).9 For example, when Republicans hold a majority in the U.S., as they do in 2019, m1, represents the majority pivot in the sense that any bill emanating from the Republican majority would have to win the favor of m1, and all the lawmakers to his or right on the policy space, in order to win a majority of votes in that body (i.e., 51 votes).10 Similarly, in a U.S. Senate administered by a Democratic majority, m2 represents the majority pivot along the policy space.11
The unidimensional (i.e., liberal-conservative) political ideology scores maintained by Boche et al. (2018) and Lewis et al. (2018) include the traditional NOMINATE measures developed in Poole and Rosenthal (1997, 2000) that have been employed extensively in the political science and public choice economics literature to construct the type of policy space presented in Figure 1. However, these estimates assume that a legislator’s political ideology is static over the duration of his or her legislative career (Boche et al. 2018). The Nokken–Poole estimates, on the other hand, assume that each Congress is entirely separate in terms of a legislator’s political ideology. To compute these scores, Nokken and Poole (2004) allow for movement of legislators along the unidimensional policy space from Congress to Congress.12 As with the NOMINATE scores, the Nokken–Poole scores range from −1 to +1, with Democrats generally falling along the 0 to −1 policy space (i.e., the left half of the policy space in Figure 1), while Republicans typically occupy the 0 to +1 portion of the policy space (i.e., the right half of the policy space in Figure 1).
If converted into percentages, the Nokken–Poole scores discussed above range from −100% to +100%. Therefore, to facilitate efficient discussion of the Nokken–Poole scores, we follow the convention in finance of quoting interest rates using the permyriad concept of a basis point, which is equal to one-hundredth of one percent. Using this convention, the policy space in Figure 1 encompasses, using Nokken–Poole scores, 20,000 basis points, with half of this total constituting each half of the policy space. Thus, the maximum variation in political ideology for either Democrats or Republicans is expected to be (about) 10,000 basis points. In this case, an increase in one’s Nokken–Poole score from 0.345 to 0.435, or 0.090, represents a movement of 900 basis points along the policy space. This would represent a relatively conservative member of the legislative body becoming more conservative in the absolute sense, and, if he or she moves to the right of another member of the legislative body, also more conservative in the relative sense.
4. Political Ideology in the U.S. Congress: Data and Methodology
In order to gather enough information on the stability of the political ideology of federal legislators, Nokken–Poole scores for members of the 115th U.S. Congress (i.e., 2017–2019) who were elected prior to 1991, and who held congressional seats without interruption over this period, are collected by the authors. We divided the sample into several subsamples. The Early Cohorts subsample include members of the U.S. Congress who were elected before 1976. Those elected from 1976 through 1980 are placed in the Late 1970s Cohort, while those elected from 1981 through 1985 are included in the Early 1980s Cohort. Lastly, those members of the U.S. Congress who were elected from 1986 through 1989 are placed in the Late 1980s Cohort. In all cases, members of party leadership are omitted from the subsamples.
Table 1 presents the demographic data for members of the U.S. Congress who are included in these subsamples. In each case, the member’s name, political party, home state, Congressional Chamber and year elected are provided. As indicated near the top of Table 1, the Early Cohorts subsample includes three legislators, two Democrats and one Republican. Only two legislators, both Republicans, are included in the Late 1970s Cohort, while seven legislators are listed in the Early 1980s Cohort. Among these, three are Democrats and four are Republicans. Lastly, the Late 1980s Cohort is the largest of the four cohorts, with 14 members. Eight of these are Democrats, and six are Republicans.
Given the relatively small size of the U.S. Senate, the number of long-serving legislators in the U.S. Senate is, as expected, smaller than that for the U.S. House of Representatives. In terms of the information contained in Table 1, only five of the 26 legislators across the four cohorts are members of the U.S. Senate. The remaining 21 legislators are members of the U.S. House of Representatives. As such, our empirical approach, which is explained below, provides a clearer picture of the stability of political ideology in this latter-mentioned branch of the U.S. Congress.
Our empirical investigation of stability of political ideology of lawmakers is two-pronged. First, we investigate political instability at the individual level by collecting both the largest and smallest Nokken–Poole scores over each U.S. Representative’s legislative career, referred to here as NPL and NPS, respectively, and compute,
for each Representative. Here, (1) captures the absolute deviation in political ideology (over time) for each lawmaker, where smaller (larger) values represent greater stability (instability) of political ideology.
An alternative approach to investigating stability of political ideology of lawmakers relies on regression analysis employing a legislator’s Nokken–Poole scores. This entails estimation by Ordinary Least Squares (OLS) of the specification below,
where the dependent variable, IDEOLt, is a given legislator’s Nokken–Poole score in year t. This variable is explained by TRENDt, which is an indicator of the number of Congressional sessions served by a given legislator by year t, and IDEOLt−2, which is the lagged value (by one Congressional session, or two years) of IDEOLt.13 The number of observations, n, in each case is determined by the length of each U.S. Representative’s legislative career, which is measured in Congressional sessions.
IDEOLt = a0 + b1TRENDt + b2IDEOLt−2 + et,
One expects that a legislator’s political ideology during a given Congressional session will exhibit a positive relationship to his or her political ideology during the previous Congressional session. If so, the coefficient estimate attached to IDEOLt−2 will be positively-signed and statistically significant. Next, and more importantly, failure to reject the null hypothesis that b1, the coefficient estimate attached to TRENDt, is equal to 0 would, in this case, support a finding of stability in one’s political ideology from Congressional session to Congressional session. Of course, rejection of this null hypothesis would support a finding of instability in political ideology, with the sign of the estimate attached to b1 indicating whether the member of Congress is becoming more liberal or more conservative from one Congressional session to the next. Here, a positively-signed coefficient estimate describes a trend toward greater conservatism, while a negatively-signed coefficient estimate describes a trend toward greater liberalism.
5. Political Ideology in the U.S. Congress: Empirical Results and Discussion
This section of the study presents the results of our empirical analyses of the Nokken–Poole data on legislator ideology in the U.S. Congress. Following this presentation, we (1) highlight the importance to economists and political scientists of our findings regarding the stability of ideology, and (2) discuss some of the limitations relating to the data employed on political ideology in our study.
5.1. Empirical Results
Our empirical analysis of the stability of political ideology of lawmakers begins with the four cohorts from the U.S. House of Representatives sample. As indicated near the top of Table 2, the Early Cohorts subsample includes two legislators, one Democrat and one Republican. In both cases, a noteworthy degree of instability of political ideology, as measured by (1) above, is exhibited. For example, the value of (1) for John Conyers, a Democrat from Michigan, is 0.423, meaning that variation in his political ideology over the course of his legislative career spans 4230 basis points. In the case of Donald Young, a Republican from Alaska, variation in exhibited political ideology spans 2470 basis points (from low to high) along the policy space. A graphical representation of the instability in political ideology in each of these two cases is presented in Figure 2. There, and throughout this study, the Republican’s time series is depicted in red, while the time series representing his or her Democratic counterpart is depicted in blue.
Next, the remaining portions of Table 2 present data on political ideology from the other, larger cohorts in the U.S. House of Representatives. In terms of the widest ranges, Christopher Smith, a Republican from New Jersey is first among the Early 1980s Cohort, with an ideology range of 2490 basis points, while Sander Levin, a Democrat from Michigan, exhibits the narrowest, although nontrivial (at 990 basis points), range along the policy space. Again, the size of each of the ideology ranges in this cohort points toward instability in political ideology. Figure 3 presents the Nokken–Poole time series for Smith and Peter Visclosky, a Democrat from Indiana, who exhibits the widest Nokken–Poole range among those Democrats in the Early-1980s Cohort of the U.S. House of Representatives. Visclosky’s political ideology exhibits a range of 1990 basis points along the policy space.
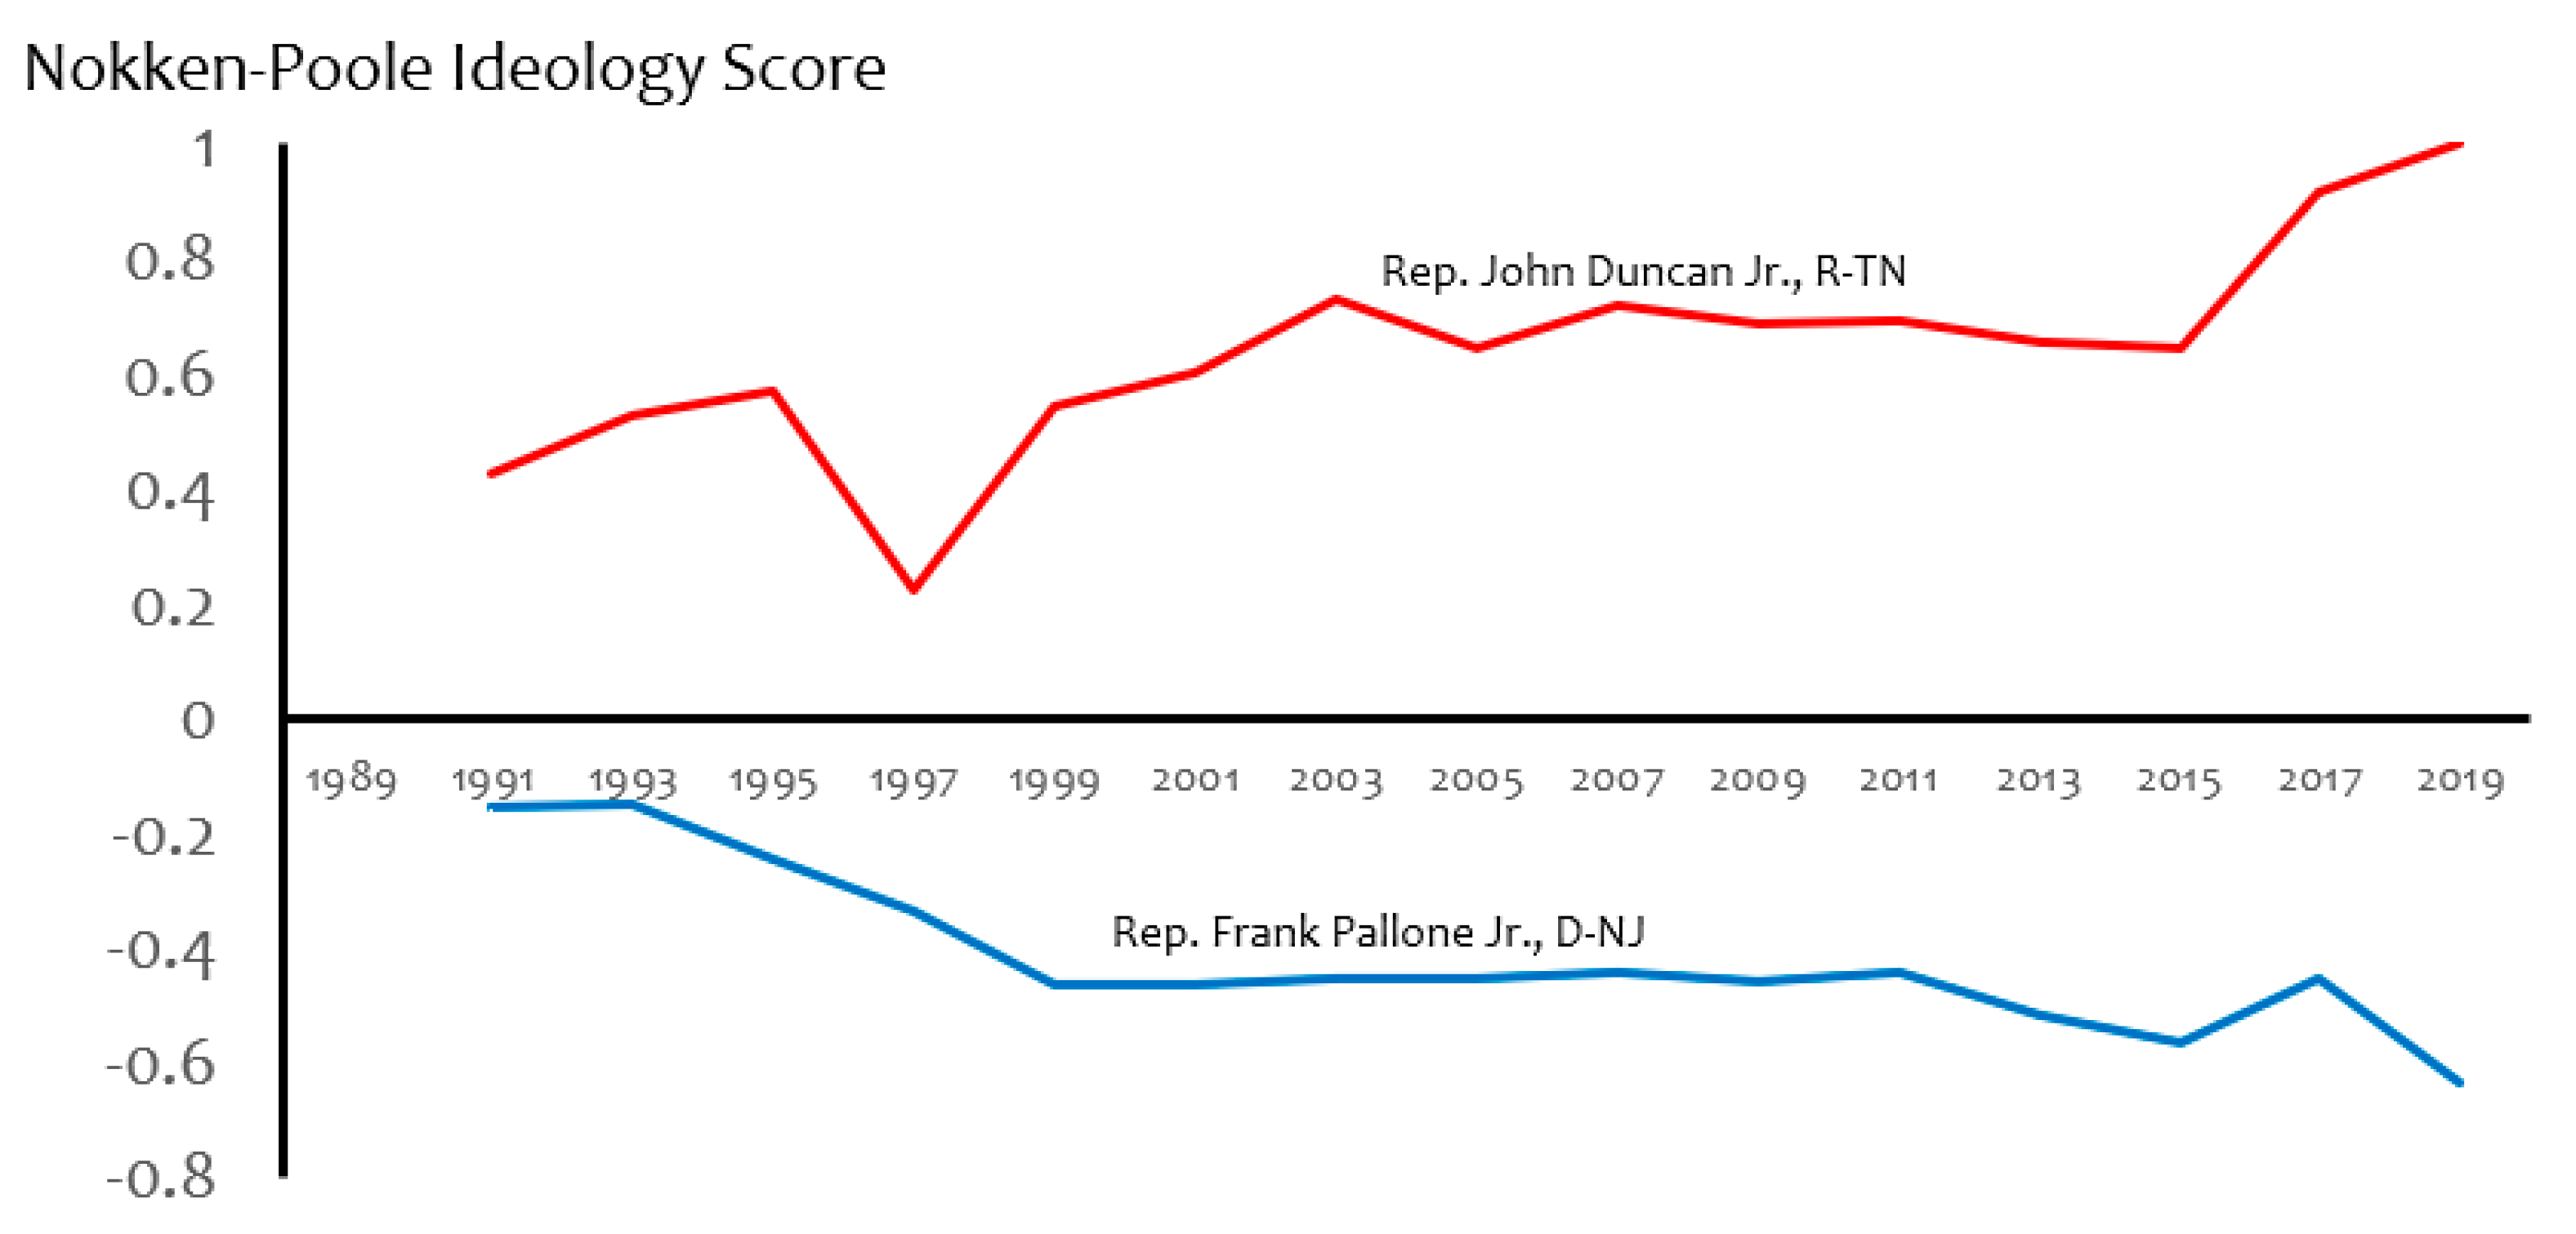
The Nokken–Poole ranges from the Late 1980s Cohort span from a low of 840 basis points (absolute value), which is nontrivial, to a high of 7760 basis points, which is quite remarkable. This latter range belongs to John Duncan, a Republican from Tennessee, while the former belongs to Nita Lowey, a Democrat from New York. While Duncan exhibits the least stable political ideology among Republicans in the Late-1980s Cohort for the U.S. House of Representatives, that position among Democrats belongs to Frank Pallone of New Jersey, whose political ideology swings 4840 basis points (absolute value) along the policy space in Figure 1. Figure 4 presents the Nokken–Poole time series for both Duncan and Pallone.
A comparison of Visclosky, from the Early 1980s Cohort, and Pallone, from the Late 1980s Cohort, illustrates some of the issues explored in this study. First, these two time series are good examples of how political ideology exhibits instability in the absolute sense. As stated previously, the political ideologies of these two Democratic Senators swing 1880 and 4840 basis points, respectively, across the policy space in Figure 1. If the time period of their voting activity is restricted to 1997 through 2001, Visclosky’s political ideology again exhibits sizable instability in the absolute sense, as it changes by 1820 basis points. On the other hand, Pallone’s political ideology is relatively stable in the absolute sense over that same time period, as it swings by only 20 basis points along the policy space. However, Pallone lies to the left of Visclosky along the policy space at the beginning of this brief period (i.e., 1997), whereas Visclosky lies to the left of Pallone by the end of the period (i.e., 2001). Thus, in this case a sizable shift in political ideology in the absolute sense led to a rearrangement of legislators along the policy space in Figure 1. Did Visclosky’s constituents in Indiana anticipate such a sizable absolute shift in his political ideology over this brief period? More importantly, did these same constituents expect their congressman to move to the left of a Democratic legislator from New Jersey over this brief period of time, as occurred in this particular situation?14
The remaining portion of Table 2 presents statistical tests of the stability of political ideology among long-serving members of the U.S. House of Representatives. These tests estimate (by OLS) the specification in Equation (2) above. Estimates of b1 for each legislator listed in Table 2 are presented under the column heading “TRENDt” in Table 2. The two columns to the right contain significance levels for each estimate and the number of observations in each case, respectively.15 Overall, the results indicate that Democrats tend to become more liberal in their political ideology with the passage of time, while Republicans tend to become more conservative. Of the 12 long-serving Democrats listed in Table 2, nine (i.e., 75 percent) become more liberal, while three (i.e., 25 percent) became more conservative.16 Of the nine long-serving Republicans listed in Table 2, six (i.e., about 67 percent) became more conservative, and three (i.e., about 33 percent) became more liberal over time. In terms of only the statistically significant coefficients, three of the five Republicans (i.e., 60 percent) became more conservative over time, while two (i.e., 40 percent) became more liberal. For Democrats, four of five (i.e., 80 percent) became more liberal, while one (i.e., 20 percent) became more conservative.17
In eight of the 10 cases where instability in political ideology is statistically significant, the legislator’s political ideology changes, in one direction or the other, from 20 to 80 basis points per Congressional session.18 This is noteworthy given that it indicates that over the course of a 20-year legislative career (i.e., 10 Congressional sessions), the political ideology of many U.S. Representatives swings, in one direction or the other, up to 800 basis points. Even more remarkable are the coefficient estimates for Duncan and Pallone, which indicate movements in political ideology of 320 and 130 basis points per Congressional session, respectively. As such, movements in political ideology cover 1600 and 650 basis points, respectively, over just five consecutive Congressional sessions (i.e., 10 years) served.
Table 3 presents the empirical results for members of the U.S. Senate. As indicated near the top of Table 3, the Early Cohorts subsample includes only one Senator—Patrick Leahy, a Democrat from Vermont. In his case, a noteworthy degree of instability of political ideology is exhibited by his Nokken–Poole range of 2540 basis points (absolute value). A graphical representation of the instability in Leahy’s political ideology is presented in Figure 5.
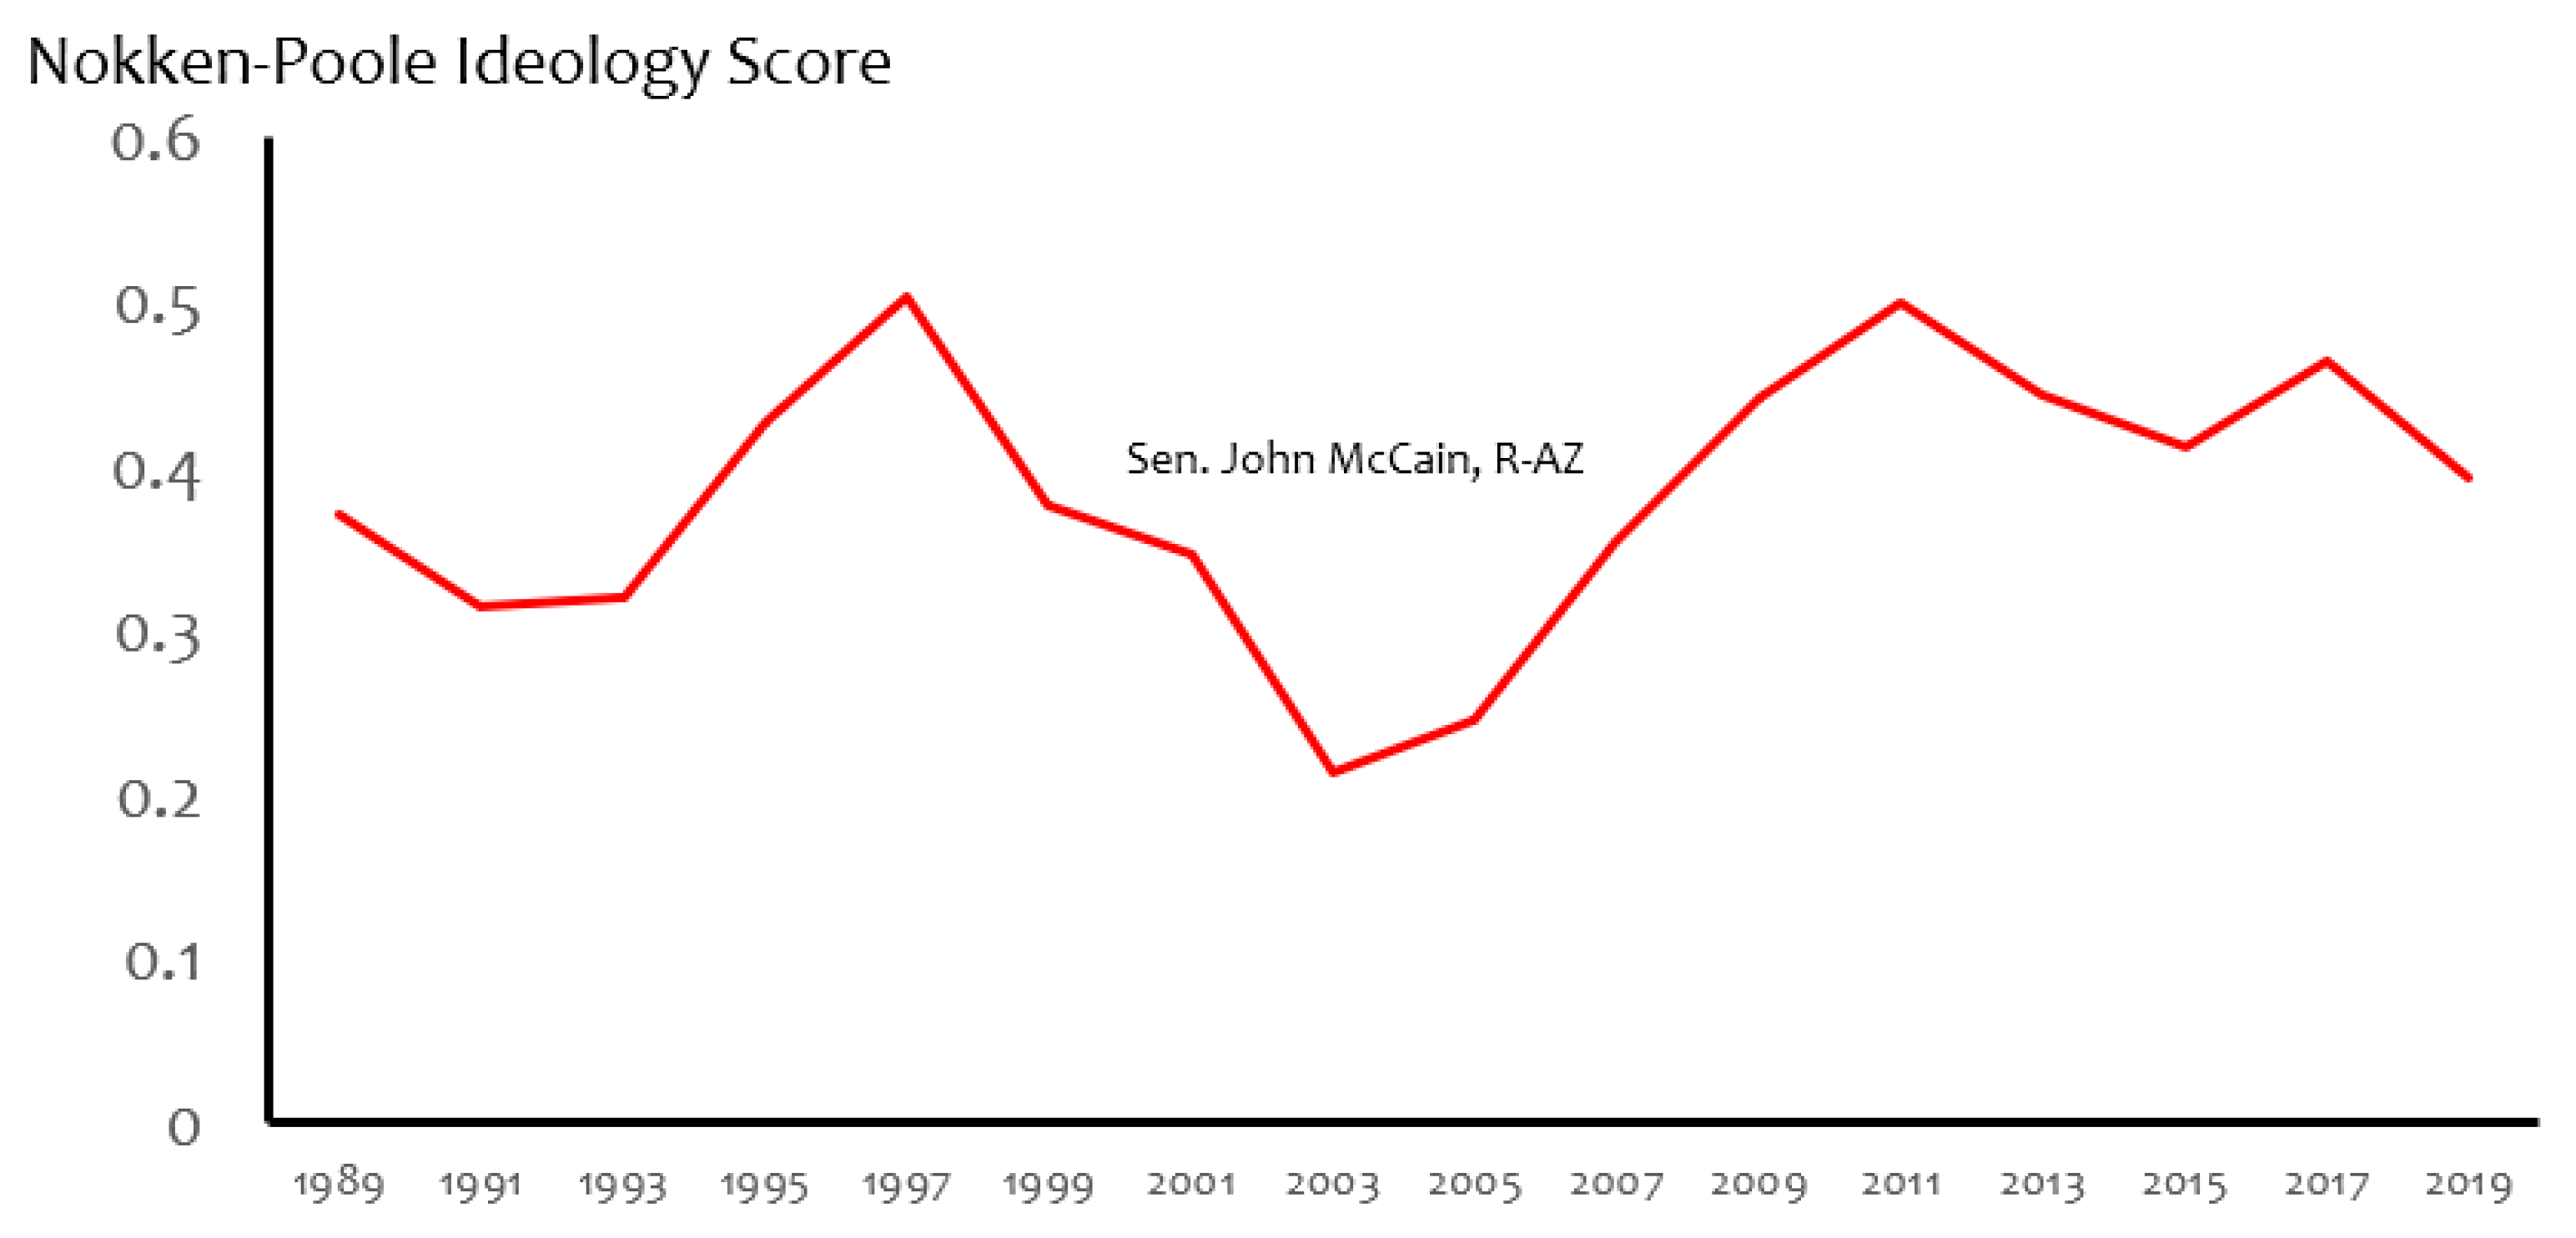
As with Table 2, the remaining portions of Table 3 present data on political ideology from the other cohorts in the U.S. Senate. In terms of the widest range, Charles Grassley, a Republican from Iowa who represents the Early 1980s Cohort, exhibits a political ideology range, using Nokken–Poole scores, of 3900 basis points. Next, Orrin Hatch, a Republican from Utah, leads the Late 1970s Cohort with a political ideology range of 2390 basis points, while the late John McCain, a Republican who represented Arizona, leads the Late 1980s Cohort with a political ideology range of 2890 basis points. Graphical representations of the instability of the political ideology of these three U.S. Senators are, beginning with the Late 1970s Cohort and proceeding to the Late 1980s Cohort, presented in Figure 6, Figure 7 and Figure 8.
The remaining portion of Table 3 also presents statistical tests of the stability of political ideology among long-serving members of the U.S. Senate. These tests follow those discussed above for long-serving members of the U.S. House of Representatives. Overall, the results indicate that of the four long-serving Republicans listed in Table 3, three became more conservative and one became more liberal over time.19 In terms of only the statistically significant coefficients, each of the two Republicans exhibiting instability in their political ideology became more conservative over time. Additionally, in one of the two cases where the legislator becomes more conservative, the legislator’s political ideology changes by 60 basis points per Congressional session. Again, this is noteworthy given that it indicates that over the course of a 20-year legislative career (i.e., 10 Congressional sessions), the political ideologies of some U.S. Senators swing, in one direction or the other, up to 600 basis points. Even more remarkable, however, is the coefficient estimate for Grassley, which indicates a movement in political ideology of 150 basis points per Congressional session. At this rate, movement in one’s political ideology would cover 1500 basis points over just five consecutive Congressional sessions (i.e., 10 years) served.
To provide a more general examination of the stability of political ideology of elected officials, Table 4 presents estimations of Equation (2) above using various pooled subsamples. The first two sets of results employ data from long-serving members of the U.S. House of Representatives from each of the two major political parties. As indicated there, both models are jointly significant and produce an R2 of 0.811 or greater. The first model suggests that the typical Democrat enters the U.S. House with a Nokken–Poole score of −0.272, which is 2720 basis points to the left of center on the policy space in Figure 1. After that, he or she becomes more conservative over time, in this case at a rate of 10 basis points per Congressional session. However, this tendency or trend is not statistically significant at usual levels. Lastly, and as expected, past political ideology is positively and statistically significantly related to current political ideology.
The second set of results cover the long-serving Republicans in the U.S. House of Representatives. As suggested by these results, the typical Republican enters the U.S. House of Representatives with a Nokken–Poole score of 0.090, which is 900 basis points to the right of center on the policy space in Figure 1. After that, he or she becomes more conservative over time, in this case at a rate of 20 basis points per Congressional session, a result that is statistically significant. Lastly, and again as expected, past political ideology is positively and statistically significantly related to current political ideology.
The final set of results presented in Table 4 employ data from long-serving Republicans in the U.S. Senate. As indicated in Table 4, this model is jointly significant and produces an R2 of 0.410. In terms of the long-serving Republicans in the U.S. Senate, the results in Table 4 suggest that the typical Republican enters the U.S. Senate with a Nokken–Poole score of 0.144, which is 1440 basis points to the right of center on the policy space in Figure 1. After that, he or she becomes more conservative over time, in this case at a rate of 30 basis points per Congressional session, a result that is again statistically significant.20 The significance of the instability of legislators’ political ideology over time in this and the previous case calls into question the alignment of Republicans’ political ideologies to those of their constituencies.
5.2. Relevance and Limitations of the Findings
The main finding in our study—that the political ideology of federal legislators exhibits some instability over time—contributes to the economics literature in a number of ways. Among these, it extends seminal studies wherein economists examine the economics of information and its links to advertising, search and signaling (Stigler 1961; Darby and Karni 1973; Spence 1973; Nelson 1970, 1974). According to this foundational work, and the empirical studies that have emerged since, the quantity, quality and form of advertising and information provision are functions of goods (and buyer) characteristics, as well as relative prices (Ekelund et al. 1995; Mixon et al. 2009).21 Nelson (1970, 1974) first suggested an analytical classification of goods with search and experience characteristics, wherein search (experience) goods are those for which judgments about the goods’ attributes can (cannot) be made (at low cost) prior to purchase.22 In the case of experience goods, such judgments are possible only after purchase. As such, goods and services can be placed on a continuum much like that presented above in Figure 1, although one where “search characteristics” and “experience characteristics” replace the “Liberal” and “Conservative” political ideology tags, respectively, at the two ends of the continuum.
The notion that the “legislative services” provided by representatives to their constituents lie somewhere along a search-experience characteristics continuum, using the categories in Nelson’s (1974) analytical classification of goods and services, has been put forth in prior economics studies. As Mixon et al. (2009, p. 84) indicate, one point of view (e.g., Nelson 1976) holds that political services are more like search goods, given that candidates’ records are available to the public, and thus a candidate’s actual performance can be compared with his or her advertised performance. Another point of view asserts that political services are more like experience goods, given that it is difficult for voters to draw inferences about the future behavior of candidates (Telser 1976) and that that the costs of investigating candidates’ political records can be high (Ferguson 1976).23 The findings of this study, that the political ideologies of legislators exhibits instability over time, certainly reinforces the argument by Telser (1976) that it is difficult for voters to draw inferences about the future behavior of candidates for political office.
In terms of the relevance of our findings to political scientists, there is a line of argument in the political science literature that relates to the discussion above regarding goods/services typology. As noted in Mixon et al. (2005), Boudreaux (1996) points out that the plethora of issues facing voters, combined with the fact that voting opportunities (e.g., elections for national office) are, at best, infrequently presented to voters suggests that decisions made by voters in the political realm are likely to be relatively uninformed. As such, and contrary to Wittman (1995), these decisions are unlikely to promote efficient policies or outcomes.24 Boudreaux’s (1996) arguments are based in part on Downs (1957), who asserts that if the voter does not pursue politics as a hobby, he or she will be badly informed. The phenomenon described above, which Downs (1957) termed “rational ignorance,” leads voters to seek low-cost informational cues in choosing from among political candidates.25 Within a framework asserting that political information is costly to acquire, seminal work by Kramer (1971) argues that voters support the incumbent if his or her recent political performance has been satisfactory on the basis of some relatively simple standard (e.g., real GDP growth).
Another research stream, based on early research by Lewis-Beck and Rice (1983), suggests that, ceteris paribus, voters prefer local candidates to more distant candidates in political contests. As Faith and Tollison (1983) point out, the advantage to voters of home grown candidates stems from the human capital advantage that local candidates have in the form of information about the political conditions/desires that exist in the home district.26 In addition to this advantage, Kjar and Laband (2002) add that because it is costly to “fire” a representative for poor performance, voters will prefer local candidates with longstanding ties to the district. These candidates implicitly put more specific human and/or other types of capital at risk as a type of performance bond (see Telser 1980; Klein and Leffler 1981; Shapiro 1983) than do candidates with lesser ties to a district (Kjar and Laband 2002, p. 144).27 As in the case of how the findings in this study are situated within the academic literature on the economics of information, the suggestion from our results that the political ideologies of legislators exhibits instability over time creates difficulties for voters with regard to attempts to employ low-cost information cues, such as geographical proximity, at the polls. For example, our finding that a Democratic representative from Indiana became more liberal, over time, than his colleague from New Jersey likely caused some consternation among the Indiana electorate. A similar pattern in state-level politics in Indiana would devalue the practice of localism (in voting) in that state.
Although the findings presented in this study have particular relevance to both the economics and political science branches of the academic literature, our work is not without limitations, particularly in its use of political ideology scores. Our use of Nokken and Poole (2004) scores as a measure of political ideology follows what Jackson and Kingdon (1992, p. 805) refer to as the typical approach by economists to the study of legislators and legislatures, wherein the framing and passing of legislation is posed as a competition between a legislator’s political ideology and the economic interests of his or her local constituency. Jackson and Kingdon (1992, p. 806) assert that commonly-used measures of ideological preferences, such as ADA scores or other compilations of roll call votes (e.g., Nokken–Poole scores), lead to a statistical bias that overestimates the influence of personal ideology and underestimates the relationship with other variables.28 More specifically, they argue that the votes that constitute a political ideology score are affected by a number of systematic factors, such as interest group pressures, presidential agendas, committee activities, the persuasions of party leaders, and the consequences of the agenda-setting process (Jackson and Kingdon 1992, p. 813).
Jackson and Kingdon (1992, p. 815) support the use of ideological measures that are constructed independently of roll call votes in order to understand the impact of political ideology on the behavior of elected officials. Using such measures requires studying political ideology directly, as in the case of survey research and more intensive approaches (e.g., see Converse 1964; Inglehart 1988), or through analyses of the contents of the writings and speeches of politicians. As Jackson and Kingdon (1992, p. 815) point out, there is a long tradition in political science of probing the beliefs, values and preferences of politicians (e.g., see Miller and Stokes 1963; Fenno 1978, 1986; Aberbach et al. 1981; Kingdon 1989). Acknowledgment of our study’s limitations, at least in the ways stated by Jackson and Kingdon (1992), would point toward inclusion of regressors in our econometric model that capture the systematic factors referred to above that influence political ideology scores, or, alternatively, use of survey data and/or results from content analysis instead of traditional scores of political ideology. Perhaps future research, which we discuss in greater depth in the final section of the study, could delve into these and other issues.
6. Conclusions and Recommendations for Future Research
Given that previous public choice studies have shown that voters tend to vote for candidates from parties who are aligned with their own political ideologies, the present study addresses the important question: How stable is a legislator’s political ideology over time? To address this particular question, we employ numerical scores of legislators’ political ideology for long-serving members of the U.S. House of Representatives and the U.S. Senate. As indicated above, results from individual time-series estimations suggest that political ideology is unstable over time for a sizable portion of the members of both major political parties who serve in the U.S. Congress. These results run somewhat counter to those in early work by Jennings (1992), and in more recent research by Jewitt and Goren (2016). Additionally, analysis of the pooled data suggests that, after accounting for inertia in political ideology and individual legislator effects, Republican legislators become more conservative over time.
Taken individually, these sets of results generate additional research questions for public choice scholars to ponder. These begin with the recommendation that future research delve further into the apparent differences in the instability of political ideology by major political party in the U.S. Is the apparent difference between the instability in conservative political ideology and liberal political ideology one of a statistically significant nature, as indicated here? Or, would additional empirical analysis, using a larger data set than employed in this study, find a statistically significant degree of instability in the political ideologies of Democrats in the U.S. Congress?
Taken together, the results presented in this paper point toward deeper scientific study of the stability of political ideology in the legislative body. For example, future research could explore the correlates of political ideology, beginning with the demographics of legislators who comprise a particular legislative chamber. Panel data, using samples from the U.S. and elsewhere, might flesh out the important explanatory variables, such as gender, age, prior education and experience, to name a few, that shape political ideology and its stability. Moreover, empirical approaches that link the ideologies of legislators to those of their constituencies could explore whether shifts in the ideologies of legislators is aligned with shifts in electorate ideology, or whether a misalignment is occurring in this process. If ideology misalignment is indeed occurring, then further exploration into the type of echo chamber that a legislative body constitutes may point toward secondary constituencies that influence the political ideologies of elected officials. This line of inquiry could follow Mixon et al. (2009) by examining the role of campaign contributions plays in the importance of positioning along the traditional unidimensional policy space discussed in the public choice literature.
Author Contributions
F.G.M., research question, empirical model and estimation, original draft; C.S., literature review, original draft, editing; K.P.U., empirical model and estimation, editing.
Funding
This research received no external funding.
Acknowledgments
The authors thank two anonymous reviewers for many helpful comments on a prior version. The usual caveat applies.
Conflicts of Interest
The authors declare no conflicts of interest.
References
- Aberbach, Joel D., Robert D. Putnam, and Bert A. Rockman. 1981. Bureaucrats and Politicians in Western Democracies. Cambridge: Harvard University Press. [Google Scholar]
- Abramowitz, Alan I. 1994. Issue Evolution Reconsidered: Racial Attitudes and Partisanship in the U.S. Electorate. American Journal of Political Science 38: 1–24. [Google Scholar] [CrossRef]
- Abramowitz, Alan I., and Kyle L. Saunders. 1998. Ideological Realignment in the U.S. Electorate. Journal of Politics 60: 634–52. [Google Scholar] [CrossRef]
- Bartle, John. 2000. Political Awareness, Opinion Constraint and the Stability of Ideological Positions. Political Studies 48: 467–84. [Google Scholar] [CrossRef]
- Berry, William D., Evan J. Ringquist, Richard C. Fording, and Russell L. Hanson. 1998. Measuring Citizen and Government Ideology in the American States, 1960–1993. American Journal of Political Science 42: 327–48. [Google Scholar] [CrossRef]
- Berry, William D., Evan J. Ringquist, Richard C. Fording, and Russell L. Hanson. 2007. The Measurement and Stability of State Citizen Ideology. State Politics & Policy Quarterly 7: 111–32. [Google Scholar]
- Boche, Adam, Jeffrey B. Lewis, Aaron Rudkin, and Luke Sonnet. 2018. The New Voteview.com: Preserving and Continuing Poole’s Infrastructure for Scholars, Students and Observers of Congress. Public Choice 176: 17–32. [Google Scholar] [CrossRef]
- Boudreaux, Donald J. 1996. Was Your High School Civics Teacher Right after All? The Independent Review 1: 111–28. [Google Scholar]
- Brace, Paul, Kevin Arceneaux, Martin Johnson, and Stacy G. Ulbig. 2004. Does State Political Ideology Change over Time? Political Research Quarterly 57: 529–40. [Google Scholar]
- Brennan, Geoffrey, and Loren Lomasky. 1993. Democracy and Decision: The Pure Theory of Electoral Preference. New York: Cambridge University Press. [Google Scholar]
- Carmines, Edward G., and Geoffrey C. Layman. 1997. Issue Evolution in Postwar American Politics: Old Certainties and Fresh Tensions. In Present Discontents: American Politics in the Very Late Twentieth Century. Edited by Byron E. Shafer. Chatham: Chatham House. [Google Scholar]
- Carmines, Edward G., and Harold W. Stanley. 1990. Ideological Realignment in the Contemporary South: Where have all the Conservatives Gone? In The Disappearing South? Studies in Regional Change and Continuity. Edited by Robert P. Steed, Laurence W. Moreland and Tod A. Baker. Tuscaloosa: University of Alabama Press. [Google Scholar]
- Carmines, Edward G., and Harold W. Stanley. 1992. The Transformation of the New Deal Party System: Social Groups, Political Ideology, and Changing Partisanship among Northern Whites, 1972–1988. Political Behavior 14: 213–37. [Google Scholar] [CrossRef]
- Carmines, Edward G., and James A. Stimson. 1989. Issue Evolution: Race and the Transformation of American Politics. Princeton: Princeton University Press. [Google Scholar]
- Cebula, Richard J., and Franklin G. Mixon Jr. 2012. Dodging the Vote? Military Conscription and U.S. Voter Participation, 1948–2006. Empirical Economics 42: 325–43. [Google Scholar] [CrossRef]
- Converse, Philip E. 1964. The Nature of Belief Systems in Mass Publics. In Ideology and Discontent. Edited by David E. Apter. New York: The Free Press of Glencoe. [Google Scholar]
- Crain, W. Mark, and Brian L. Goff. 1988. Televised Legislatures: Political Information Technology and Public Choice. Boston: Kluwer Academic. [Google Scholar]
- Darby, Michael R., and Edi Karni. 1973. Free Competition and the Optimal Amount of Fraud. Journal of Law and Economics 16: 67–88. [Google Scholar] [CrossRef]
- Disarro, Brian, Jillian Barber, and Tom W. Rice. 2007. The Home State Effect in Presidential Elections: Advances in the Study of Localism. Presidential Studies Quarterly 37: 558–66. [Google Scholar] [CrossRef]
- Downs, Anthony. 1957. An Economic Theory of Democracy. New York: Harper & Row. [Google Scholar]
- Ekelund, Robert B., Jr., Franklin G. Mixon Jr., and Rand W. Ressler. 1995. Advertising and Information: An Empirical Study of Search, Experience and Credence Goods. Journal of Economic Studies 22: 33–43. [Google Scholar] [CrossRef]
- Faith, Roger L., and Robert D. Tollison. 1983. Voter Search for Efficient Representation. Research in Law and Economics 5: 211–24. [Google Scholar]
- Fenno, Richard F., Jr. 1978. Home Style: House Members in their Districts. Boston: Little and Brown. [Google Scholar]
- Fenno, Richard F., Jr. 1986. Observation, Context, and Sequence in the Study of Politics. American Political Science Review 80: 3–16. [Google Scholar] [CrossRef]
- Ferguson, James M. 1976. Political Information: Comment. Journal of Law and Economics 19: 341–46. [Google Scholar] [CrossRef]
- Goren, Paul. 2005. Party Identification and Core Political Values. American Journal of Political Science 49: 881–96. [Google Scholar] [CrossRef]
- Harring, Niklas, and Jacob Sohlberg. 2017. The Varying Effects of Left-Right Ideology on Support for the Environment: Evidence from a Swedish Survey Experiment. Environmental Politics 26: 278–300. [Google Scholar] [CrossRef]
- Hotelling, Harold. 1929. Stability in Competition. The Economic Journal 39: 41–57. [Google Scholar] [CrossRef]
- Inglehart, Ronald. 1988. The Renaissance of Political Culture. American Political Science Review 82: 1203–230. [Google Scholar] [CrossRef]
- Jackson, John E., and John W. Kingdon. 1992. Ideology, Interest Group Scores, and Legislative Votes. American Journal of Political Science 36: 805–23. [Google Scholar] [CrossRef]
- Jennings, M. Kent. 1992. Ideological Thinking among Mass Publics and Political Elites. Public Opinion Quarterly 56: 419–41. [Google Scholar] [CrossRef]
- Jewitt, Caitlin E., and Paul Goren. 2016. Ideological Structure and Consistency in the Age of Polarization. American Politics Research 44: 81–105. [Google Scholar] [CrossRef]
- Jost, John T., Christopher M. Federico, and Jaime L. Napier. 2009. Political Ideology: Its Structure, Functions, and Elective Affinities. Annual Review of Psychology 60: 307–37. [Google Scholar] [CrossRef]
- Kahane, Leo H. 2009. It’s the Economy, and then Some: Modeling the Presidential Vote with State Panel Data. Public Choice 139: 343–56. [Google Scholar] [CrossRef]
- Kingdon, John D. 1989. Congressmen’s Voting Decisions. Ann Arbor: University of Michigan Press. [Google Scholar]
- Kjar, Scott A., and David N. Laband. 2002. On ‘Home Grown-ness’ in Politics: Evidence from the 1998 Election for Alabama’s Third Congressional District. Public Choice 112: 143–50. [Google Scholar] [CrossRef]
- Klein, Benjamin, and Keith B. Leffler. 1981. The Role of Market Forces in Assuring Contractual Performance. Journal of Political Economy 89: 615–41. [Google Scholar] [CrossRef]
- Knoke, David. 1979. Stratification and the Dimensions of American Political Orientations. American Journal of Political Science 23: 772–91. [Google Scholar] [CrossRef]
- Kramer, Gerald H. 1971. Short-Term Fluctuations in U.S. Voting Behavior, 1896–1964. American Political Science Review 65: 131–43. [Google Scholar] [CrossRef]
- Krehbiel, Keith. 1998. Pivotal Politics: A Theory of U.S. Lawmaking. Chicago: University of Chicago Press. [Google Scholar]
- Ksiazkiewicz, Aleksander, Steven Ludeke, and Robert Krueger. 2016. The Role of Cognitive Style in the Link between Genes and Political Ideology. Political Psychology 37: 761–76. [Google Scholar] [CrossRef]
- Laband, David N. 1986. Advertising as Information: An Empirical Note. Review of Economics and Statistics 68: 517–21. [Google Scholar] [CrossRef]
- Laband, David N. 1989. The Durability of Informational Signals and the Content of Advertising. Journal of Advertising 18: 13–18. [Google Scholar] [CrossRef]
- Laband, David N. 1991. An Objective Measure of Search Versus Experience Goods. Economic Inquiry 29: 497–509. [Google Scholar] [CrossRef]
- Layman, Geoffrey C., and Thomas M. Carsey. 2000. Ideological Realignment in Contemporary American Politics: The Case of Party Activists. Unpublished Manuscript. [Google Scholar]
- Leach, Robert. 2015. Political Ideology in Britain. London: Palgrave Macmillan. [Google Scholar]
- Lee, Robert D. 2013. Religion and Politics in the Middle East: Identity, Ideology, Institutions, and Attitudes. New York: Routledge. [Google Scholar]
- Levine, Jeffrey, Edward G. Carmines, and Robert Huckfeldt. 1997. The Rise of Ideology in the Post-New Deal Party System, 1972–1992. American Politics Quarterly 25: 19–34. [Google Scholar] [CrossRef]
- Lewis, Jeffrey B., Keith T. Poole, Howard Rosenthal, Adam Boche, Aaron Rudkin, and Luke Sonnet. 2018. Voteview: Congressional Roll-Call Votes Database. Available online: https://voteview.com/ (accessed on 1 May 2019).
- Lewis-Beck, Michael S., and Tom W. Rice. 1983. Localism in Presidential Elections: The Home State Advantage. American Journal of Political Science 27: 548–56. [Google Scholar] [CrossRef]
- Lupton, Robert N., William M. Myers, and Judd R. Thornton. 2015. Political Sophistication and the Dimensionality of Elite and Mass Attitudes, 1980–2004. Journal of Politics 77: 368–80. [Google Scholar]
- Melville, Andrei. 2018. Russian Political Ideology. In Russia: Strategy, Policy and Administration. Edited by Irvin Studin. London: Palgrave Macmillan. [Google Scholar]
- Miller, Warren E., and Donald E. Stokes. 1963. Constituency Influence in Congress. American Political Science Review 57: 45–56. [Google Scholar] [CrossRef]
- Mixon, Franklin G., Jr. 1995. Advertising as Information: Further Evidence. Southern Economic Journal 61: 1213–18. [Google Scholar] [CrossRef]
- Mixon, Franklin G., Jr. 2002. Does Legislative Television alter the Relationship between Voters and Politicians? Rationality and Society 14: 109–28. [Google Scholar] [CrossRef]
- Mixon, Franklin G., Jr. 2013. Warm Springs Ran Deep: Friends-and-Neighbors Voting in the U.S. Presidential Elections of 1940 and 1944. Journal of Politics and Law 6: 105–15. [Google Scholar] [CrossRef]
- Mixon, Franklin G., Jr. 2018. Glass Houses and Friends-and-Neighbors Voting: An Exploratory Analysis of the Impact of Political Scandal on Localism. Economies 6: 48. [Google Scholar] [CrossRef]
- Mixon, Franklin G., Jr., and J. Matthew Tyrone. 2004. The ‘Home Grown’ Presidency: Empirical Evidence on Localism in Presidential Voting, 1972–2000. Applied Economics 36: 1745–49. [Google Scholar] [CrossRef]
- Mixon, Franklin G., Jr., and Kamal P. Upadhyaya. 2002. Legislative Television as an Institutional Entry Barrier: The Impact of C-SPAN2 on Turnover in the U.S. Senate, 1946–1998. Public Choice 112: 433–48. [Google Scholar] [CrossRef]
- Mixon, Franklin G., Jr., and Kamal P. Upadhyaya. 2003. Legislative Television as Political Advertising: A Public Choice Approach. New York: Universe. [Google Scholar]
- Mixon, Franklin G., Jr., M. Troy Gibson, and Kamal P. Upadhyaya. 2003a. Has Legislative Television changed Legislator Behavior? C-SPAN2 and the Frequency of Senate Filibustering. Public Choice 115: 139–62. [Google Scholar] [CrossRef]
- Mixon, Franklin G., Jr., Rand W. Ressler, and M. Troy Gibson. 2003b. Congressional Memberships as Political Advertising: Evidence from the U.S. Senate. Southern Economic Journal 70: 414–24. [Google Scholar] [CrossRef]
- Mixon, Franklin G., Len J. Treviño, and Taisa C. Minto. 2005. Are Legislative TV and Campaign Finance Regulations Complementary Entry Barriers? Evidence from the USA. Applied Economics 37: 387–96. [Google Scholar] [CrossRef]
- Mixon, Franklin G., Jr., Ernest W. King, and Matthew L. Lawing. 2008. Modeling the Impact of Localism in U.S. Presidential Elections. Journal of Public Finance and Public Choice 26: 3–18. [Google Scholar]
- Mixon, Franklin G., Jr., Rand W. Ressler, and M. Troy Gibson. 2009. False Advertising and Experience Goods: The Case of Political Services in the U.S. Senate. Public Choice 138: 83–95. [Google Scholar] [CrossRef]
- Naumann, Laura P., Verónica Benet-Martínez, and Penelope Espinoza. 2017. Correlates of Political Ideology among U. S.-Born Mexican Americans: Cultural Identification, Acculturation Attitudes, and Socioeconomic Attitudes. Social Psychology and Personality Science 8: 20–28. [Google Scholar] [CrossRef]
- Nelson, Phillip. 1970. Information and Consumer Behavior. Journal of Political Economy 78: 311–29. [Google Scholar] [CrossRef]
- Nelson, Phillip. 1974. Advertising as Information. Journal of Political Economy 82: 729–54. [Google Scholar] [CrossRef]
- Nelson, Phillip. 1976. Political Information. Journal of Law and Economics 19: 315–36. [Google Scholar] [CrossRef]
- Nokken, Timothy P., and Keith T. Poole. 2004. Congressional Party Defection in American History. Legislative Studies Quarterly 29: 545–68. [Google Scholar] [CrossRef]
- Peña, Alejandro M. 2016. Transnational Governance and South American Politics. London: Palgrave Macmillan. [Google Scholar]
- Petrocik, John R. 1996. Issue Ownership in Presidential Elections, with a 1980 Case Study. American Journal of Political Science 40: 825–50. [Google Scholar] [CrossRef]
- Poole, Keith T., and Howard Rosenthal. 1997. Congress: A Political-Economic History of Roll Call Voting. New York: Oxford University Press. [Google Scholar]
- Poole, Keith T., and Howard L. Rosenthal. 2000. Voteview Manual. Pittsburgh: Carnegie Mellon University. [Google Scholar]
- Rice, Tom W., and Alisa A. Macht. 1987. Friends and Neighbors Voting in Statewide General Elections. American Journal of Political Science 31: 448–52. [Google Scholar] [CrossRef]
- Sears, David O., and Carolyn L. Funk. 1999. Evidence of the Long-Term Persistence of Adults’ Political Predispositions. Journal of Politics 61: 1–28. [Google Scholar] [CrossRef]
- Seeberg, Henrik B. 2017. How Stable is Political Parties’ Issue Ownership? A Cross-Time, Cross-National Analysis. Political Studies 65: 475–92. [Google Scholar] [CrossRef]
- Shapiro, Carl. 1983. Premiums for High Quality Products as Returns to Reputation. Quarterly Journal of Economics 98: 659–79. [Google Scholar] [CrossRef]
- Spence, Michael. 1973. Job Market Signalling. Quarterly Journal of Economics 87: 355–79. [Google Scholar] [CrossRef]
- Stigler, George J. 1961. The Economics of Information. Journal of Political Economy 69: 213–25. [Google Scholar] [CrossRef]
- Telser, Lester G. 1976. Political Information: Comment. Journal of Law and Economics 19: 337–40. [Google Scholar] [CrossRef]
- Telser, Lester G. 1980. A Theory of Self-Enforcing Agreements. Journal of Business 53: 27–44. [Google Scholar] [CrossRef]
- Wittman, Donald. 1995. The Myth of the Democratic Failure. Chicago: University of Chicago Press. [Google Scholar]
- Wright, Gerald C., Robert S. Erikson, and John P. McIver. 1985. Measuring State Partisanship and Ideology with Survey Data. Journal of Politics 47: 469–89. [Google Scholar] [CrossRef]
| 1 | Naumann et al. (2017) conclude that political campaigns should pay attention to differences in cultural identifications and acculturation attitudes when targeting Latino constituents. |
| 2 | A study by Brace et al. (2004) finds that state political ideology does not change over time. However, Berry et al. (2007) dismiss the findings of this study as being logically and methodologically flawed. |
| 3 | Although the current study focuses on stability of political ideology in the U.S., recent research focusing on other countries also abounds (e.g., Lee 2013; Leach 2015; Peña 2016; Harring and Sohlberg 2017; Melville 2018). |
| 4 | |
| 5 | Lupton et al. (2015) argue that political sophistication constrains the ideologies of political leaders to a single ideological dimension. |
| 6 | |
| 7 | This conceptualization of the political ideology of political actors is not without its critics. Seminal work by Converse (1964), which indicates that only 2.5 percent of Americans qualify as political ideologues, argues for an absence of political ideology across the American political landscape. On the other end of the spectrum lies an alternative stream of research (e.g., Knoke 1979; Carmines and Stimson 1989; Abramowitz 1994; Carmines and Layman 1997) that considers political ideology to be multidimensional, consisting of distinct attitudes toward social welfare, racial, and cultural issues (see Layman and Carsey 2000). Despite these critiques, Jost et al. (2009) indicate that many of life’s domains are explained along the type of left-right policy space described here, such as implicit and explicit preferences for tradition, conformity, order, stability, traditional values, and hierarchy (versus those for progress, rebelliousness, chaos, flexibility, feminism, and equality, respectively). |
| 8 | |
| 9 | This representation assumes that there are 50 Senators on each side of the vertical line in Figure 1. |
| 10 | Put differently, lawmaker m1 occupies the fifty-first point from the right end of the policy space in Figure 1. |
| 11 | In other words, lawmaker m2 occupies the fifty-first point from the left end of the policy space in Figure 1. |
| 12 | Nokken and Poole (2004) apply these scores in a comparison of legislators who switched political parties during their careers to those who maintained political party membership. |
| 13 | For example, if t is equal to 1995, and the legislator under consideration is Frank Pallone (see Table 1), then IDEOLt is equal to −0.246, which represents Pallone’s Nokken–Poole score for the Congressional session ending in 1995. This particular Congressional session was also Pallone’s third session as a member of the U.S. House of Representatives. As such, TRENDt is equal to 3 in this case. The second regressor, IDEOLt−2, is in this case equal to −0.149, which is Pallone’s Nokken–Poole political ideology score from the previous Congressional session, which ended in 1993. It is worth noting here that Pallone was more liberal in his voting patterns during the Congressional session ending in 1995 than he was during the preceding Congressional session. More specifically, his Nokken–Poole score fell by 970 basis points from one session to the next in this case. |
| 14 | U.S. President Donald Trump (R-NY) captured 57.2 percent of the popular vote in Indiana during the 2016 presidential election. His opponent, Hillary Clinton (D-NY), won 37.9 percent of the popular vote in Indiana. In New Jersey, on the other hand, Trump garnered only 41.8 percent of the popular vote, whereas Clinton carried the state with 55 percent of the popular vote. This result, among others, indicates that voters in Indiana prefer more conservative policies than do their counterparts in New Jersey. |
| 15 | Given the presence of the lagged value of a legislator’s Nokken–Poole score, the SAS statistical package recommends use of the Durbin t test statistic to test for autocorrelation. |
| 16 | Autocorrelation is a problem in two of the nine cases of increasing liberalism among the long-serving Democrats in the U.S. House of Representatives. |
| 17 | Autocorrelation is a problem in one of the four cases of a statistically significant increase in liberalism among the long-serving Democrats in the U.S. House of Representatives. |
| 18 | Again, autocorrelation is a problem in one of these eight cases of a statistically significant trend among the long-serving lawmakers in the U.S. House of Representatives. |
| 19 | Autocorrelation is a problem in one of the three cases of increasing conservatism among the long-serving Republicans in the U.S. Senate. |
| 20 | As in the previous models, past political ideology is positively and statistically significantly related to current political ideology. |
| 21 | |
| 22 | Darby and Karni (1973) suggest a third classification of goods—credence goods—for which judgments about the good’s attributes are prohibitively costly even after purchase. |
| 23 | For examples of prior empirical work on this topic, see Crain and Goff (1988), Mixon (2002), Mixon and Upadhyaya (2002, 2003), Mixon et al. (2003a), Mixon et al. (2003b) and Mixon et al. (2009). |
| 24 | Boudreaux (1996, pp. 117–18) points out that the typical national election involves perhaps thousands of highly aggregated issues—from abortion to school choice. Moreover, each voter has a maximum of nine national ballots to cast during a six-year span, suggesting that political decisions by voters, as opposed to market decisions by households/consumers, are invariably cluttered with “romance pollution” (see also Brennan and Lomasky 1993). |
| 25 | Cebula and Mixon (2012) point out that Downs’ (1957) work forms the foundation of scholarly research on voter participation in the U.S. that focuses on whether or not the decision to vote, in general, is rational. |
| 26 | Faith and Tollison (1983) and Kjar and Laband (2002) also add that the search costs associated with detecting the merits of home district candidates will generally be lower than those associated with discovery of the merits of more distant candidates. |
| 27 | In other words, voters understand and appreciate the implied efficiency of casting ballots in favor of candidates who have much to lose locally from nonperformance in the legislative arena (Kjar and Laband 2002, p. 144). For a look at some of the empirical research on presidential elections from this stream of literature, see Lewis-Beck and Rice (1983), Rice and Macht (1987), Kjar and Laband (2002), Mixon and Tyrone (2004), Disarro et al. (2007), Mixon et al. (2008), Kahane (2009) and Mixon (2013, 2018). |
| 28 | Jackson and Kingdon (1992, p. 813) assert that this issue is exacerbated in the case of a single dimension, as would occur when using League of Conservation Voters scores of political ideology to analyze voting on strip mining legislation. |
Figure 1.
Spatial model of policy preferences.

Figure 2.
Early Cohorts, U.S. House of Representatives.

Figure 3.
Early-1980s cohort examples, U.S. House of Representatives.

Figure 4.
Late-1980s cohort examples, U.S. House of Representatives.

Figure 5.
Early cohort example, U.S. Senate.

Figure 6.
Late-1970s cohort example, U.S. Senate.

Figure 7.
Early-1980s cohort example, U.S. Senate.

Figure 8.
Late-1980s cohort example, U.S. Senate.


Table 1.
Demographics of congressional subsamples.
| Name | Political Party-State | Congressional Chamber | Year Elected |
|---|---|---|---|
| Early Cohorts | |||
| Conyers, John | D-MI | House | 1965 |
| Leahy, Patrick | D-VT | Senate | 1975 |
| Young, Donald | R-AK | House | 1973 |
| Late 1970s Cohort | |||
| Cochran, Thad | R-MS | Senate | 1979 |
| Hatch, Orrin | R-UT | Senate | 1977 |
| Early 1980s Cohort | |||
| Barton, Joe | R-TX | House | 1985 |
| Grassley, Charles | R-IA | Senate | 1981 |
| Kaptur, Marcy | D-OH | House | 1983 |
| Levin, Sander | D-MI | House | 1983 |
| Rogers, Hal | R-KY | House | 1981 |
| Smith, Christopher | R-NJ | House | 1981 |
| Visclosky, Peter | D-IN | House | 1985 |
| Late 1980s Cohort | |||
| DeFazio, Peter | D-OR | House | 1987 |
| Duncan, John Jr. | R-TN | House | 1989 |
| Engel, Eliot | D-NY | House | 1989 |
| Lewis, John | D-GA | House | 1987 |
| Lowey, Nita | D-NY | House | 1989 |
| McCain, John | R-AZ | Senate | 1987 |
| Neal, Richard | D-MA | House | 1989 |
| Pallone, Frank Jr. | D-NJ | House | 1989 |
| Rohrabacher, Dana | R-CA | House | 1989 |
| Ros-Lehtinen, Ileana | R-FL | House | 1989 |
| Serrano, José | D-NY | House | 1989 |
| Slaughter, Louise | D-NY | House | 1987 |
| Upton, Frederick | R-MI | House | 1987 |
| Smith, Lamar | R-TX | House | 1987 |
Table 2.
Political ideology in the U.S. House of Representatives.
| Name | TRENDt | p-Value | n | AC | |
|---|---|---|---|---|---|
| Early Cohorts | |||||
| Conyers, John | 0.423 | 0.008* | 0.004 | 26 | no |
| Young, Donald | 0.247 | 0.003 | 0.101 | 22 | no |
| Late 1970s Cohort | |||||
| Early 1980s Cohort | |||||
| Barton, Joe | 0.107 | −0.003 † | 0.052 | 16 | no |
| Kaptur, Marcy | 0.188 | −0.004 † | 0.090 | 17 | no |
| Levin, Sander | 0.099 | −0.002 † | 0.073 | 17 | no |
| Rogers, Hal | 0.173 | 0.3 × 10⁻³ | 0.426 | 18 | no |
| Smith, Christopher | 0.249 | 0.008 ‡ | 0.027 | 18 | no |
| Visclosky, Peter | 0.199 | −0.003 | 0.148 | 16 | no |
| Late 1980s Cohort | |||||
| DeFazio, Peter | 0.355 | 0.005 | 0.201 | 15 | no |
| Duncan, John Jr. | 0.776 | 0.032 ‡ | 0.013 | 14 | no |
| Engel, Eliot | 0.185 | 0.002 | 0.300 | 14 | no |
| Lewis, John | 0.144 | −0.3 × 10⁻³ | 0.458 | 15 | yes |
| Lowey, Nita | 0.084 | −0.001 | 0.235 | 14 | no |
| Neal, Richard | 0.125 | −0.003 † | 0.075 | 14 | yes |
| Pallone, Frank Jr. | 0.484 | −0.013 † | 0.066 | 14 | no |
| Rohrabacher, Dana | 0.229 | −0.005 * | 0.008 | 14 | no |
| Ros-Lehtinen, Ileana | 0.129 | −0.005 | 0.349 | 14 | no |
| Serrano, José | 0.141 | −0.005 | 0.225 | 14 | no |
| Slaughter, Louise | 0.319 | −0.001 | 0.395 | 15 | no |
| Upton, Frederick | 0.202 | 0.002 | 0.280 | 15 | no |
| Smith, Lamar | 0.231 | 0.006† | 0.052 | 15 | no |
Notes: One-tailed p-values reported above. *(‡)[†] denote the 0.01(0.05)[0.10] level of significance. AC = autocorrelation. The null hypothesis of “no autocorrelation” is tested using the Durbin t test statistic.
Table 3.
Political ideology in the U.S. Senate.
| Name | TRENDt | p-Value | n | AC | |
|---|---|---|---|---|---|
| Early Cohorts | |||||
| Leahy, Patrick | 0.254 | −0.005 ‡ | 0.038 | 21 | yes |
| Late 1970s Cohort | |||||
| Cochran, Thad | 0.156 | 0.006 * | 0.001 | 19 | no |
| Hatch, Orrin | 0.239 | −0.003 | 0.173 | 20 | no |
| Early 1980s Cohort | |||||
| Grassley, Charles | 0.390 | 0.015 * | 0.001 | 18 | no |
| Late 1980s Cohort | |||||
| McCain, John | 0.289 | 0.003 | 0.258 | 15 | yes |
Notes: One-tailed p-values reported above. *(‡) denote the 0.01(0.05) level of significance. AC = autocorrelation. The null hypothesis of “no autocorrelation” is tested using the Durbin t test statistic.
Table 4.
OLS results—pooled subsamples.
| Variables | U.S. House Subsamples | U.S. Senate Subsample | |
|---|---|---|---|
| Democrats | Republicans | Republicans | |
| constant | −0.272 * (−6.54) | 0.090 * (3.98) | 0.144 * (4.12) |
| TRENDt | 0.001 (0.99) | 0.002 ‡ (2.12) | 0.003 † (1.78) |
| IDEOLt−1 | 0.615 * (11.08) | 0.563 * (7.33) | 0.450 * (4.18) |
| Legislator Effects | yes | yes | yes |
| n | 191 | 146 | 72 |
| F-statistic | 58.40 * | 123.4 * | 9.15 * |
| R2 | 0.811 | 0.901 | 0.410 |
Notes: The numbers in parentheses above are t-values. *(‡)[†] denote the 0.01(0.05)[0.10] level of significance.
© 2019 by the authors. Licensee MDPI, Basel, Switzerland. This article is an open access article distributed under the terms and conditions of the Creative Commons Attribution (CC BY) license (http://creativecommons.org/licenses/by/4.0/).
Share and Cite
MDPI and ACS Style
Mixon, F.G., Jr.; Sankaran, C.; Upadhyaya, K.P. Is Political Ideology Stable? Evidence from Long-Serving Members of the United States Congress. Economies 2019, 7, 36. https://doi.org/10.3390/economies7020036
AMA Style
Mixon FG Jr., Sankaran C, Upadhyaya KP. Is Political Ideology Stable? Evidence from Long-Serving Members of the United States Congress. Economies. 2019; 7(2):36. https://doi.org/10.3390/economies7020036
Chicago/Turabian StyleMixon, Franklin G., Jr., Chandini Sankaran, and Kamal P. Upadhyaya. 2019. "Is Political Ideology Stable? Evidence from Long-Serving Members of the United States Congress" Economies 7, no. 2: 36. https://doi.org/10.3390/economies7020036
Note that from the first issue of 2016, this journal uses article numbers instead of page numbers. See further details here.