Abstract
The purpose of this study was to detect mind-wandering experienced by pre-service teachers during a video learning lecture on physics. The lecture was videotaped and consisted of a live lecture in a classroom. The lecture was about Gauss’s law on physics. We investigated whether oculomotor data and eye movements could be used as a marker to indicate the learner’s mind-wandering. Each data was collected in a study in which 24 pre-service teachers (16 females and 8 males) reported mind-wandering experience through self-caught method while learning physics video lecture during 30 min. A Tobii Pro Spectrum (sampling rate: 300 Hz) was used to capture their eye-gaze during learning Gauss’s law through a course video. After watching the video lecture, we interviewed pre-service teachers about their mind-wandering experience. We first used the self-caught method to capture the mind-wandering timing of pre-service teachers while learning from video lectures. We detected more accurate mind-wandering segments by comparing fixation duration and saccade count. We investigated two types of oculomotor data (blink count, pupil size) and nine eye movements (average peak velocity of saccades; maximum peak velocity of saccades; standard deviation of peak velocity of saccades; average amplitude of saccades; maximum amplitude of saccades; total amplitude of saccades; saccade count/s; fixation duration; fixation dispersion). The result was that the blink count could not be used as a marker for mind-wandering during learning video lectures among them (oculomotor data and eye movements), unlike previous literatures. Based on the results of this study, we identified elements that can be used as mind-wandering markers while learning from video lectures that are similar to real classes, among the oculomotor data and eye movement mentioned in previous literatures. Additionally, we found that most participants focused on past thoughts and felt unpleasant after experiencing mind-wandering through interview analysis.
1. Introduction
Recent years have witnessed a rapid increase in the use of online video lectures aimed both at young and adult learners [1]. In fact, in the United States, more than 25% of students enrolled in institutions of higher learning register for online video lecture courses [2]. In addition, 84.3% of Korean high school students have experienced learning through the Education Broadcasting System online video lectures [3]. The proliferation of online video learning may be attributed to its numerous advantages over traditional classroom lectures.
First, it is not affected by the barriers of time, place, and circumstances [4]. It is also more cost-effective than traditional classroom-based learning [5] and reduces private education expenses [3]. However, the lack of face-to-face interaction with a teacher is a major problem pertaining to video learning. In video-based instruction, the teacher cannot observe a student’s attentional lapse or extend attention-aware tutoring [1]. Attention is important for successful learning because students who cannot sustain their attention are more likely to make frequent mistakes and tend to become more engaged in off-task behaviors [6]. Such abstractions negatively affect learning. For instance, a recent study by [7] found that the academic achievement of students who reported being in a state of attentional lapse during video learning fell below those who reported that they were on-task and task related thought (TRT). This consequence is natural because students who cannot hold their attention are likely to miss the essence of the intended learning and such fundamental conceptual clarity is closely linked to academic achievement [8,9].
Scholars are focusing on mind-wandering (MW), a kind of attentional lapse. Recent studies have demonstrated that MW is very prevalent when students watch videos [10]. Additionally, people’s minds wandered frequently, no matter what they did. Wandering of the mind occurred in 46.9% of the samples in research [11]. Accordingly, some researchers have contended that detecting and preventing MW would be helpful to learning [12] and have tried to understand the phenomenon and to investigate the timing of its occurrence. However, while the observable actions of attentional lapse (yawning, chatting with friends in adjacent seats, staring elsewhere) were easily grasped, it was very difficult to determine MW through observation. MW denotes an attentional shift from TRT to internal task-unrelated thinking [13] and includes the state of reduced awareness [14]. It is for this reason that it is very difficult to judge MW solely through external observation.
Previously, scholars would have to depend on retrospective reports from participants. However, attention is deeply related to eye movements (fixation and saccade). Recent developments in eye-tracking technology have accorded researchers the opportunity to detect and to identify MW purely as eye movement data, which is also labeled the “eye-mind” [15].
Studies based on the “eye-mind” have been conducted to identify MW using eye-tracking. However, most of these investigations have been accomplished in very limited experimental environments (sustained attention related task vigilance task, idea projection). Of course, trials in laboratory environments can eliminate elements that are intrusive to the purpose of the experiment. However, MW represents an attention shift to internal thought and occurs naturally in our daily lives [13]. The detection of MW data in a limited experimental environment may differ from the determination of MW as it occurs during the viewing of a video lecture. The frequency of mind-wandering in our real-world was considerably higher than is typically seen in laboratory experiments [11]. Therefore, this study purposed to examine the eye-tracking data element (sampling rate: 300 Hz) to detect MW using videos that recorded the lectures delivered by a teacher in a real class as is commonly utilized for video-based learning.
The self-caught method was used to approximate the MW spot during the watching of video lectures. Subsequently, more accurate MW segments were determined by comparing fixation duration with the saccade count. Finally, the oculomotor data and eye movements were investigated to ascertain which could be used as a marker indicating a learner’s MW. Additionally, we interviewed participants about their MW experience after watching video lecture. This was due to our goal to determine at which temporal point (past, present, or future) they focused on during MW and their feelings after the MW experience.
2. Related Work
Numerous studies have tried to detect MW over the last decade. These may be classified into two large groups: those based on eye-tracking and those that do not employ eye-tracking.
2.1. Detecting MW without Eye-Tracking
Studies that have attempted to determine MW without using eye-tracking have been sporadic in many ways. In [16], researchers extracted facial and body features using a commercial version of the Computer Emergency Response Team computer and applied the self-caught method in which participants reported MW while watching video content.
Participants can report their experiences concerning MW by self-reporting and probing methods. Self-caught is a method in which the participant reports their MW experience using a mouse click or a signal after experiencing MW. If the participant accurately and quickly reports their thoughts and feelings after the MW experience, the researcher can pinpoint the exact temporal point of occurrence of MW. On the other hand, the probing method periodically signals a participant and asks whether they have experienced MW just before giving a signal. This latter method is suitable for measuring MW frequency.
In [17], researchers captured MW through heartbeats measured via the fingers of participants using sensors on smart phones as they witnessed massive open online course lectures. Ref. [12] also detected MW through the conductivity and temperature of the skin of participants as they read books.
Meanwhile, in [18], researchers used the functional magnetic resonance imaging (fMRI) to observe changes in neuromodulation when participants were performing tasks and thinking of ideas unrelated to tasks to ascertain whether the occurrence of MW increases the default mode network. In [19], researchers found slow fluctuations during MW through event-related potential (ERP) analysis by using the electroencephalography (EEG). This result supported the decoupling hypothesis. According to the decoupling hypothesis, the amplitude of evoked neurocognitive responses is reduced during MW (off-task) compared to the on-task state (see Figure 1). Additionally, MW was detected using ERP analysis.
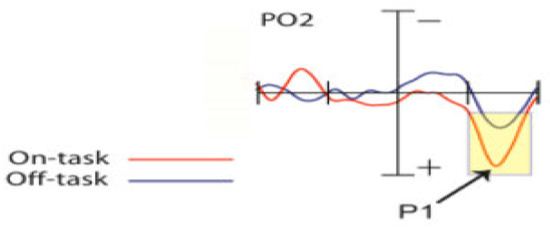
Figure 1.
The amplitude difference of evoked neurocognitive responses at PO2 electrode sites [19]; p.18 (P1: Visually-evoked event-related potential (ERP)).
2.2. Detecting MW by Eye-Tracking
In [20], researchers distinguished MW through the self-caught method as participants counted their breaths and extracted eye movement data characteristic of the MW period by analyzing the attributes of eye movements during MW. In addition, in [21], researchers detected MW through probe method and eye movement data during MW episodes during the performance of a sustained attention-related task (SART). The term SART refers to an assignment that requires participants to respond to the numbers displayed on all other screens without responding to the target number 3 of the numbers 0 to 10. During a SART, the participants’ task-unrelated thoughts (TUT) rate gradually increased over time (see Figure 2). Furthermore, TUT is closely related to MW. The researchers were able to capture TUT reports that both increased in frequency over time and analyzed the characteristics of the participants’ gaze in the MW state.

Figure 2.
Proportion of thought response ([22]; p.201).
However, these studies did not attempt to ascertain the MW that occurred in an actual learning environment. Therefore, recent researchers have used Eye Tribe, the commercialized eye tracking equipment, to detect MW when learners are watching a video lecture in order to identify the timing of the occurrence of MW in real-life situations such as video learning and have examined the features of the eye movements of participants during the MW period [1,10].
However, the abovementioned studies utilized commercial eye tracking equipment called Eye Tribe, which is designed for consumers and is limited in measuring accurate saccade metrics even though it is economical [23]. Also, in [10], researchers restricted their study to only two elements (fixation duration, fixation dispersion) to distinguish MW from attention. In addition, the video lectures used in these studies are different from the video lessons that feature actual instructors. Instead, the researchers of these studies utilized slide and simulation type lecture formats such as Guru tutor.
3. Method
3.1. Participants
The present study’s participants comprised 24 pre-service teachers (16 females and 8 males) who volunteered to participate in the study. The average age of the participants was 23.5.
This study measured human eye movement and oculomotor data with the approval of the Bioethics Review Board of the Korean National University of Education (project identification code: KNUE-2019-H-00225, date of approval: August 29, 2019). We fully explained the purpose of the study, the principles of measuring oculomotor data and eye movement, and the potential benefits and risks of participating in the study to the participants and confirmed whether they were willing to participate in the experiment voluntarily. All participants expressed their willingness to participate in the study voluntarily.
3.2. Stimuli and Apparatus
The study used a 30 min videotape of a live classroom lecture on Gauss’s law course on physics. This address was selected because it was believed to relate to real-world video lectures most commonly used by learners, unlike the slide or simulation-type Guru tutor. Oculomotor data and eye movements were recorded through an A Tobii Pro Spectrum (sampling rate: 300 Hz). A Tobii Pro Spectrum is more flexible in detecting head motion than any other eye trackers. At the same time, it can measure saccate data very accurately. In [23], Eye Tribe (commercial eye tracker) could not measure saccade data accurately. This function better elucidates the details of human behavioral observation and awareness. Additionally, fast movements such as saccades can be measured without controlling the heads of the subjects.
Eye-tracking data was analyzed through an A Tobii Pro Lab which is the software designed for performing experimental study with Tobii Pro Spectrum.
3.3. Procedure
First, participants were trained by researchers to distinguish attention from MW and from attention such as TRT (task related thought) and on-task attention. Afterwards, they practiced the self-caught method of reporting MW immediately after recognizing their experience with MW. The participants’ distance from the screen and the height of their chairs were adjusted through pre-testing so that their eye movements could easily be tracked as they took positions that would be comfortable for a 30-min duration. The measurement was conducted in a slide room so that participants could watch the video lectures alone and without interruption. Precautions were provided for 20 s after the eye tracker was adjusted through 9-point calibrations.
Subsequently, the participants were asked to stare at the “ㅁ” in a picture that captured the first video lecture scene to measure the baseline of their pupil sizes. According to [24], it is important to consider the baseline when measuring the size of the pupil because the baseline is a basic assessment of the individual’s physical and mental condition of the physiological data collected before the subject is exposed to experimental stimuli. A green screen was shown for 30 s before and after the baseline screen for accurate measurement. Finally, the video was played and the students were asked to place their finger on the upper left corner of the mouse throughout the watching of the video to prepare for self-capture. The oculomotor data and eye movements of the participants were recorded by the eye tracker during the test. This test process is illustrated in Figure 3 and the MW self-report process is illustrated in Figure 4.

Figure 3.
Trial process with Tobii Pro Lab software.

Figure 4.
Mind wandering (MW) self-caught reporting: After participants experience MW, they click the mouse and then the MW reporting time is recorded on the Tobii Pro Lab timeline.
After watching a video lecture, participants were immediately interviewed about their MW experience, while watching an eye-tracking video and the time point of MW reporting through Tobii Pro Lab software.
3.4. Data Analysis
The data were assessed through two major stages: first, the correct MW segments were identified and second, the differences between the oculomotor data and the eye movement data were distinguished vis-à-vis the found MW segments and the attention span.
3.4.1. Detect the Correct MW Segment
First, 60 TOI (time of interest) sections were analyzed in 1 s increments for 1 min prior to the MW time point reported by the participants to determine the correct MW interval. TOI can analyze the saccade metrics within the part by setting it in a specific segment that the researcher wants to analyze in the participant’s eye movement timeline (see Figure 5).
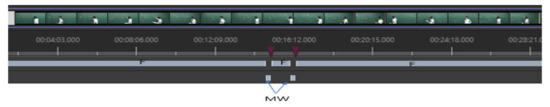
Figure 5.
Time of interest (TOI) set up: F (attention spans), MW (MW segments), red arrow (MW time point reported by the participants).
Then, the correct MW interval was detected by comparing the analyzed saccade metrics data and the fixation duration prior to the MW reporting spot on the raw data. The fixation duration on raw data was compared to the saccade metrics because the number of saccades and the fixation duration evince a negative correlation. For example, when MW occurs, the number, velocity, and amplitude of the saccade are rapidly reduced or are not recorded, whereas the fixation duration is large, relative to the sustained attention. Therefore, MW segments can be detected more accurately when they are compared.
3.4.2. Oculomotor Data and Eye Movement Data
Second, two oculomotor data (blink count, pupil size) and 9 eye movements (average peak velocity of saccades; maximum peak velocity of saccades; standard deviation of peak velocity of saccades; average amplitude of saccades; maximum amplitude of saccades; total amplitude of saccades; saccade count/s; fixation duration; fixation dispersion) were analyzed in the MW segment and the attention span of the participants detected in the first stage. Of the total 11 sets of data, the blink count, saccade count, pupil size, fixation duration, and fixation dispersion were analyzed through raw data. The rest of the data were analyzed through saccade metrics. Then, finally, we performed planned t-tests to compare data between MW and attention.
4. Result
Through this study, we received a total of 69 MW reports from 18 students. The characteristic of eye movements and oculomotor data for each MW segments and attention span were compared.
4.1. Eye Movement Element
4.1.1. Fixation Duration
The fixation duration in the MW segments of participants was significantly longer than the fixation duration in the attention span (see Table 1). During MW, participants do not need to look at visual information and do not track it during MW. Thus, there appear to be no saccades and longer duration of the fixation. The average fixation duration in the present study was longer than the outcomes obtained by [10] because they removed data above the fixation duration of 2000 MS during the analysis process and averaged the results. But in this study, we averaged all fixation duration.

Table 1.
Fixation duration (MS) difference.
4.1.2. Fixation Dispersion
Fixation dispersion was indicated via a 0 to 1 scale by dividing the maximum dispersion at each part (MW segments and attention span) on the slide area (i.e., the two ends of the area’s diagonal) [10]. A smaller value in fixation dispersion signifies that the participant’s fixation is limited to a smaller part of the screen. Bigger values of fixation dispersion mean that the participant’s fixation is more active towards the screen. As a result, the fixation dispersion values were smaller in MW segments than the values denoting attention span (see Table 2). In other words, fixation dispersion was limited to a smaller part of the screen during MW. Additionally, we can also confirm fixation dispersion difference through eye-tracking heat map (see Figure 6). The heatmap shows that the heat range is very limited on the MW section. On the other hand, the heatmap of the attention span is very broad. This indicates that when participants’ attention is present, the eye moves along the instructor’s explanation and writing, but this is not true in the MW state.
Table 2.
Fixation dispersion difference.
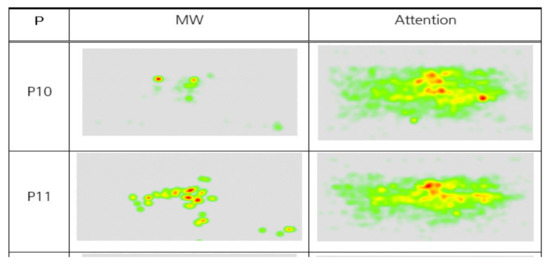
Figure 6.
Heat map difference. Note: The fixation dispersion was limited to a smaller part on the screen during the MW than attention.
4.1.3. Saccade Metrics
The results indicated more active eye movement in the attention state than in the MW state (see Table 3). Since the writing on the board and explanations tendered by the instructors were presented continuously in the video-based lecture, the eye movements of the participants were more active and were required to scan the board to maintain focus. Thus, the amplitude of the saccade of attention was inevitably larger than that of MW. In addition, the velocity of the saccades during attention spans was larger than the MW segments because when the amplitude value is large, the movement of the saccade over the same period of time is faster than when the amplitude value is small. A prior study has evidenced that the velocity of the saccade increases along with the saccade amplitude [25,26].
Table 3.
Average difference of saccade metrics (amplitude in pixels, velocity in pixels per second).
4.1.4. Saccade Count
Comparing to the number of saccades per second in the MW and attention sections during video watching of participants, the average was 1.24 (/1sec) in the MW segments and 3.22 (/1sec) in the attention span (see Table 4). There were a lot of saccades in the span of sustained attention because of the movement of eyes. On the other hand, gaze was fixed or limited in the MW segment.
Table 4.
Saccade count (/1sec) difference.
The results that fixation was static, and saccade was restricted during the MW segment were confirmed from the results of the trial. These outcomes can be explained through perceptual decoupling. The MW state can order a decoupling of attention from perception to separate competing streams of internal and external information. This process of decoupling could prevent unimportant external events from disrupting an internal train of thought [27,28].
4.2. Oculomotor Element
4.2.1. Pupil Size
The pupil sizes in the MW segments of the participants and their attention spans were respectively compared to their baseline sizes. The length of time in each interval was the same. This study used the Beatty and Wagoner method [29], in which the average pupil size was measured from the MW and the attention state minus the baseline size of the individual to consider the individual variations in pupil size. The results evinced that the pupil size was larger at MW than at attention (see Table 5). Additionally, it was evidenced that the size of the pupil decreased rapidly after the MW report (see Figure 7).
Table 5.
Average pupil size (mm) difference with baseline.
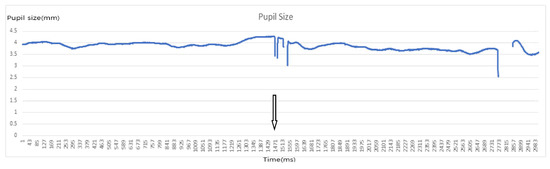
Figure 7.
Pupil size graph. Note: Arrow is MW reporting time and after MW reporting, rapid reduction, and unrecorded part in pupil size is shown.
4.2.2. Blink Count
The blink counts were more during attention span than the MW segment in the same period (for 10 sec), unlike previous literatures (see Table 6). The pupil size graph can also be checked (see Figure 7). An unrecorded part of the pupil size is expected to cause an eye blink. The graph shows that there are more unrecorded areas of pupil size after MW reporting.
Table 6.
Average blink count (per 10 sec) difference.
4.3. Interview Analysis
An analysis was conducted on 24 pre-service teacher’ interviews, which were processed after the experiment. The first data of interest was the temporal point at which they focused on during MW and the second data set was the participants’ mood after experiencing MW. Although they reported a total of 69 MWs, they were only able to recall and explain about 48 MWs during the interview.
4.3.1. What is Temporal Point at Which They Focus during the MW?
Table 7 shows that most participants focused the past, followed by the future as the contents of thoughts. The present was least thought of. The most thoughts of the past consisted of unpleasant thoughts and feelings, such as regret, anger, sad memories, etc.
Table 7.
Focused temporal point and memory (unpleasant, neutral, and pleasant).
4.3.2. Did You Feel Unpleasant after Experiencing MW and Why?
We found that many participants felt unpleasant emotions, such as guilt, after their MW experience. About 54.1% of participants said they felt unpleasant and 29.1% said they felt neutral. The remaining 16.6% said they felt pleasant. Of the participants who felt unpleasant, 30.7% said that the reason was their inability to focus on what they were doing, while 46.1% reported that the unpleasant memories that they remembered during MW affected their present mood.
5. Discussion
5.1. Suggestions for MW Distinguishing Factor during Video Lecture
Until recently, MW has only been measured in cognitive science research in terms of MW frequency, gaze features, and theoretical exploration in very limited experimental environments (SART, vigilance task, counting breath) that are not practical [1]. Recently, researchers conducted investigations to measure the MW of students while watching video lectures [1,7,10]. However, these three studies exhibit limitations with regard to the video lecture task and the MW distinguishing factor. These studies utilized slides and Guru tutor as their types of video lectures, which are very different from the actual video-recorded classroom lectures that are generally used for such learning [1,10].
Additionally, in [10], researchers used only two elements (fixation duration and dispersion) to distinguish between MW segment and attention span. The present investigation employed the lecture capture format type of video [30] that is similar to the real-world classroom situation to resolve the issues presented by the previous studies. Further, it utilized 2 types of oculomotor data and 9 types of eye movements as MW discrimination factors. The results obtained from the present study suggest that all 10 other features of the 2 types of oculomotor data and 9 types of eye movements except for the difference in the number of eye blinks can be used as factors to detect the MW state in students during video lectures.
In [27], researchers compared pupil size during MW and pupil size during the attention span using the probing method, whereas, in [20], researchers compared pupil sizes using the self-reporting method. In a study by [27], the pupil size during the MW state was larger compared to the pupil size in the attention state, but the study by [20] reported conflicting results. The result of this present study supports the study by [27], which is that the pupil size during the MW state is larger than the pupil size during the attention state. However, the average difference between the MW state and the attention state was not that large. This is because the size of the pupil decreases significantly after MW reporting but also quickly recovers. Perhaps this was why [20,27] reported conflicting results.
The number of eye blinks has been studied to occur more frequently in the MW state than in the attention state [31,32]. However, this study found that the number of blinks was fewer during the MW than during the same period of attention, apparently due to the nature of the task. Investigations conducted by [31,32] compared deliberately constrained internally directed cognition (IDC) and think states such as problem-solving thoughts and creative idea generation, among other types of thoughts.
However, the video class, which is the subject of this study, is continuously one-sided as taught by an instructor. Thus, the thoughts of the participants comprised spontaneous IDC such as dreaming and MW, rather than deliberately constrained IDC ideas such as problem-solving and creative idea generation.
5.2. Detection of Accurate MW Segment through Comparing Saccade Metrics to Fixation Duration
Simply, in [20], researchers determined segment extracted from 10 s before the MW report as a MW segment and extracted attention span from 10 s after the re-focusing button was pressed. In addition, in [10], researchers compared the MW reporting 40 s before and 10 s after the MW reporting and compared the eye movement data and oculomotor data of the two parts, respectively. However, this method simply assumed the interval before and after the MW report and could not accurately detect the participant’s MW segment, and thus could not extract the exact eye movement data and oculomotor data. The present study was able to find accurate MW segment by comparing the saccade metrics to the fixation duration in the raw data to extract eye movement data and oculomotor data during the MW period.
5.3. An Investigation into Feelings after Experiencing MW
People felt uncomfortable after experiencing MW in the real world [11]. However, the reason behind their discomfort is unknown. Our results showed that many people focus on unpleasant memories of the past when experiencing MW. Therefore, the reason for the displeasure after experiencing MW is that the unpleasant memories of the past may have affected the present mood, as well as the interference of MW to the participants’ tasks. This consequence is natural because they were in an off-task state during the task (watching a video lecture) and this made them feel guilty. In addition, unpleasant memories they experienced during MW affected their present mood continuously.
6. Conclusions
The result was that the blink count could not be used as a marker for mind-wandering during learning video lectures among them (oculomotor data and eye movements), unlike previous literatures. On the other hand, the other elements could be used as a mind-wandering marker. Pupil size, fixation duration was bigger during MW segment than attention span. But fixation dispersion, saccade count, and 6 types of saccade metrics (average peak velocity of saccades; maximum peak velocity of saccades; standard deviation of peak velocity of saccades; average amplitude of saccades; maximum amplitude of saccades; total amplitude of saccades) values were bigger during the attention span than MW segments. Based on the results of this study, we identified elements that can be used as mind-wandering markers while learning from video lectures that are similar to real classes, among the oculomotor data and eye movement mentioned in previous literatures. In addition, many students focused on unpleasant memories of the past during the MW and this experience affected mood after the MW experience.
7. Applications
7.1. For the Development of Video Learning
The present study identified the elements of eye movement data and oculomotor data that can be used as markers to detect MW during learning video lectures. Thus, MW can be automatically and accurately detected in the future by applying these results to machine learning. In addition, since video lectures are not in the same space as instructors and learners, it is impossible to detect a learner’s attention lapse or change in mood. However, if a computer can detect the learner’s MW automatically, it will become possible to develop a program that can quickly alter the learner’s attention when MW occurs during video learning.
7.2. For Attention Research on Students
This study revealed that both excellent and average students become stressed about their attention lapses during lectures. Younger learners are more likely to experience MW than adult learners [33]. Until the present, however, studies on MW triggers have been conducted only on the characteristics of books (volume and boredom) and familiarity with repeated memorization of words. The main challenge that the field of current MW research is facing is to identify events that directly trigger and control the occurrence of MW [34]. Therefore, many numbers of elementary students should be studied to comprehensively research the triggers to MW during class. The present study’s methodology and results can be applied to detect and study MW and MW triggers in many students.
7.3. For Psychological Counseling on Students
The results of this study showed that psychological discomfort may exist for students who experience MW during learning. Therefore, it is necessary to have an attitude to empathize with and approach the student’s stress resulting from experiencing MW during learning.
Author Contributions
Conceptualization, D.J.; Data curation, D.J.; Investigation, D.J.; Methodology, D.J., I.Y. and S.K.; Resources, D.J.; Software, D.J.; Supervision, I.Y. and S.K.; Writing—original draft, D.J.; Writing–review & editing, D.J. and I.Y.; Visualization, D.J. All authors have read and agreed to the published version of the manuscript.
Funding
This research received no external funding.
Conflicts of Interest
The authors declare no conflict of interest.
References
- Hutt, S.; Krasich, K.; Mills, C.; Bosch, N.; White, S.; Brockmole, J.M.; D’Mello, S.K. Automated gaze-based mind wandering detection during computerized learning in classrooms. User Modeling User Adapt. Interact 2019, 29, 821–867. [Google Scholar] [CrossRef]
- Allen, I.E.; Seaman, J. Online Report Card. In Tracking Online Education in the United States; Babson Survey Research Group, Babson College: Babson Park, MA, USA, 2016. [Google Scholar]
- Jang, J.J.; Go, I.S.; Jeong, C. The impacts of e-learning system characteristics on learner commitment and satisfaction. J. Inf. Technol. Appl. Manag. 2008, 15, 99–116. [Google Scholar]
- Bates, A.W. Technology, E-Learning and Distance Education, 2nd ed.; Taylor & Francis e-Library: Abingdon, VA, USA, 2005; pp. 175–193. [Google Scholar] [CrossRef]
- Twigg, C.A. Improving learning and reducing costs for online learning. In Encyclopedia of Distance Learning; IGI Global: Hershey, PA, USA, 2005; pp. 1054–1060. [Google Scholar] [CrossRef]
- Forbes-riley, K.; Litman, D. When does disengagement correlate with learning in spoken dialog computer tutoring. In Artificial Intelligence in Education; Biswas, G., Bull, S., Kay, J., Mitrovic, A., Eds.; Springer: Berlin/Heidelberg, Germany; Auckland, New Zealand, 2011; pp. 81–89. [Google Scholar] [CrossRef]
- Was, C.A.; Hollis, R.B.; Dunlosky, J. Do students understand the detrimental effects of mind wandering during online learning? Comput. Educ. 2019, 135, 113–122. [Google Scholar] [CrossRef]
- Robertson, I.H.; Manly, T.; Andrade, J.; Baddeley, B.T.; Yiend, J. Oops!’: Performance correlates of everyday attentional failures in traumatic brain injured and normal subjects. Neuropsychologia 1997, 35, 747–758. [Google Scholar] [CrossRef]
- Smallwood, J.; McSpadden, M.; Schooler, J.W. When attention matters: The curious incident of the wandering mind. Mem. Cogn. 2008, 36, 1144–1150. [Google Scholar] [CrossRef] [PubMed]
- Zhang, H.; Miller, K.; Sun, X.; Cortina, K. Wandering eyes: Eye movements during mind-wandering in video Lecture. PsyArXiv Prepr. 2019. [Google Scholar] [CrossRef]
- Killingsworth, M.A.; Gilbert, D.T. A wandering mind is an unhappy mind. Science 2010, 330, 932–933. [Google Scholar] [CrossRef]
- Blanchard, N.; Bixler, R.; Joyce, T.; D’Mello, S. Automated physiological-based detection of mind wandering during Learning. In Lecture Notes in Computer Science [Internet]; Springer International Publishing: Cham, Switzerland, 2014; pp. 55–60. [Google Scholar] [CrossRef]
- Smallwood, J.; Schooler, J.W. The restless mind. Psychol. Bull. 2006, 132, 946–958. [Google Scholar] [CrossRef]
- Smallwood, J.; Schooler, J.W. The science of mind wandering: Empirically navigating the stream of consciousness. Annu. Rev. Psychol. 2015, 66, 487–518. [Google Scholar] [CrossRef]
- Deubel, J.H.; Schneider, W.X. Saccade target selection and object recognition: Evidence for a common attentional mechanism. Vis. Res. 1996, 36, 1827–1837. [Google Scholar] [CrossRef]
- Stewart, A.; Bosch, N.; D’Mello, S.K. Generalizability of face-based mind wandering detection across task contexts. International Educational Data Mining Society. In Proceedings of the International Conference on Educational Data Mining (EDM), Wuhan, China, 25–28 Junuary 2017. [Google Scholar]
- Pham, P.; Wang, J. Attentive learner: Improving mobile MOOC learning via implicit heart rate tracking. In International Conference on Artificial Intelligence in Education; Springer: Cham, Swizterland, 2015; pp. 367–376. [Google Scholar] [CrossRef]
- Mittner, M.; Boekel, W.; Tucker, A.M.; Turner, B.M.; Heathcote, A.; Forstmann, B.U. When the brain takes a break: A model-based analysis of mind wandering. J. Neurosci. 2014, 34, 16286–16295. [Google Scholar] [CrossRef]
- Kam, J.W.; Dao, E.; Farley, J.; Fitzpatrick, K.; Smallwood, J.; Schooler, J.W.; Handy, T.C. Slow fluctuations in attentional control of sensory cortex. J. Cogn. Neurosci. 2011, 23, 460–470. [Google Scholar] [CrossRef]
- Grandchamp, R.; Braboszcz, C.; Delorme, A. Oculometric variations during mind wandering. Front. Psychol. 2014, 5, 31–41. [Google Scholar] [CrossRef]
- Mrazek, M.D.; Smallwood, J.; Franklin, M.S.; Chin, J.M.; Baird, B.; Schooler, J.W. The role of mind-wandering in measurements of general aptitude. J. Exp. Psychol. Gen. 2012, 141, 788–798. [Google Scholar] [CrossRef]
- McVay, J.C.; Kane, M.J. Conducting the train of thought: Working memory capacity, goal neglect, and mind wandering in an executive-control task. J. Exp. Psychol. Learn. Mem. Cogn. 2009, 35, 196–204. [Google Scholar] [CrossRef]
- Dalmaijer, E.; Mathôt, S.; Van der Stigchel, S. PyGaze: An open-source, cross-platform toolbox for minimal-effort programming of eyetracking experiments. Behav. Res. Methods 2014, 46, 913–921. [Google Scholar] [CrossRef]
- Stanney, K.M.; Hale, K.S. (Eds.) Advances in Cognitive Engineering and Neuroergonomics; CRC Press: Boca Raton, FL, USA, 2012. [Google Scholar]
- Zuber, B.L.; Stark, L.; Cook, G. Microsaccades and the velocity–amplitude relationship for saccadic eye movements. Science 1965, 150, 1459–1460. [Google Scholar] [CrossRef]
- Baloh, R.W.; Sills, A.W.; Kumley, W.E.; Honrubia, V. Quantitative measurement of saccade amplitude, duration, and velocity. Neurology 1975, 25, 1065–1070. [Google Scholar] [CrossRef]
- Smallwood, J.; Brown, K.S.; Tipper, C.; Giesbrecht, B.; Franklin, M.S.; Mrazek, M.D.; Schooler, J.W. Pupillometric evidence for the decoupling of attention from perceptual input during offline thought. PLoS ONE 2011, 6, e18298. [Google Scholar] [CrossRef]
- Head, J.; Helton, W.S. Perceptual decoupling or motor decoupling? Conscious. Cogn. 2013, 22, 913–919. [Google Scholar] [CrossRef]
- Beatty, J.; Wagoner, B. The pupillary system. In Handbook of Psychophysiology; Cacioppo, T.J., Tassinary, G.L., Berntson, G.G., Eds.; Cambridge University Press: Cambridge, UK, 2000; Volume 2, pp. 142–162. [Google Scholar]
- Chen, C.M.; Wu, C.H. Effects of different video lecture types on sustained attention, emotion, cognitive load, and learning performance. Comput. Educ. 2015, 80, 108–121. [Google Scholar] [CrossRef]
- Brashier, B.; Salvi, S. Measuring lung function using sound waves: Role of the forced oscillation technique and impulse oscillometry system. Breathe 2015, 11, 57–65. [Google Scholar] [CrossRef]
- Walcher, S.; Körner, C.; Benedek, M. Looking for ideas: Eye behavior during goal-directed internally-focused cognition. Conscious. Cogn. 2017, 53, 165–175. [Google Scholar] [CrossRef]
- McVay, J.C.; Meier, M.E.; Touron, D.R.; Kane, M.J. Aging ebbs the flow of thought: Adult age differences in mind wandering, executive control, and self-evaluation. Acta Psychol. 2013, 142, 136–147. [Google Scholar] [CrossRef]
- Vannucci, M.; Pelagatti, C.; Marchetti, I. Manipulating cues in mind wandering: Verbal cues affect the frequency and the temporal focus of mind wandering. Conscious. Cogn. 2017, 53, 61–69. [Google Scholar] [CrossRef]
© 2020 by the authors. Licensee MDPI, Basel, Switzerland. This article is an open access article distributed under the terms and conditions of the Creative Commons Attribution (CC BY) license (http://creativecommons.org/licenses/by/4.0/).