2. Literature Review
To evaluate the efficiency in the field of education, several educational assessment methodological tools have been proposed, which often appear dissimilar. The Data Envelopment Analysis (DEA) comprises a remarkably wide-spread methodology, whereby the effectiveness of collective decisions can be estimated with a non-parametrical process. DEA accepts that the decision unit (school) is a productive unit which consumes resources to produce several outputs.
Measuring the technical efficiency of an administrative authority requires the measurement of its efficiency limit [
1]. A method used in recent decades to measure technical efficiency by comparing inputs and outputs across a large number of educational units is the “Data Envelopment Analysis” (DEA) developed by Charnes, Cooper, and Rhodes [
2] (pp. 429–444), and described by Coelli, Rao, and Battese [
3] and Cooper, Seiford, and Tone [
4].
In the simplest case where a process or unit has a single input or a simple output, efficiency is defined as:
The most common processes and organic units have multiple disproportionate inputs and outputs, and this complexity can be included in a performance measurement by defining efficiency as follows:
DEA is a technique based on linear programming to measure the relative performance of organic educational units, where the presence of multiple inputs and outputs makes it difficult to compare [
5] (pp. 1–15). DEA is designed for cases where the profits on the scale of continuous economies of scale are continuous and where there are no market prices [
6]. It is an approach comparing the efficiency of organic units—such as local education authorities, schools, universities—that produce several separate outputs using various inputs.
The advantages of DEA are that it is simple to include multiple outflows and inputs in the model [
1] and gives us some clues as to where to look for efficiency improvements. It allows for exchanges between outflows of different types and gives us a small but clear set of efficient educational units that can be compared with an inefficient educational unit [
7]).
The increasing cost for education (at least relatively to the average inflation) leads to a growing literature on the efficiency of education [
8].
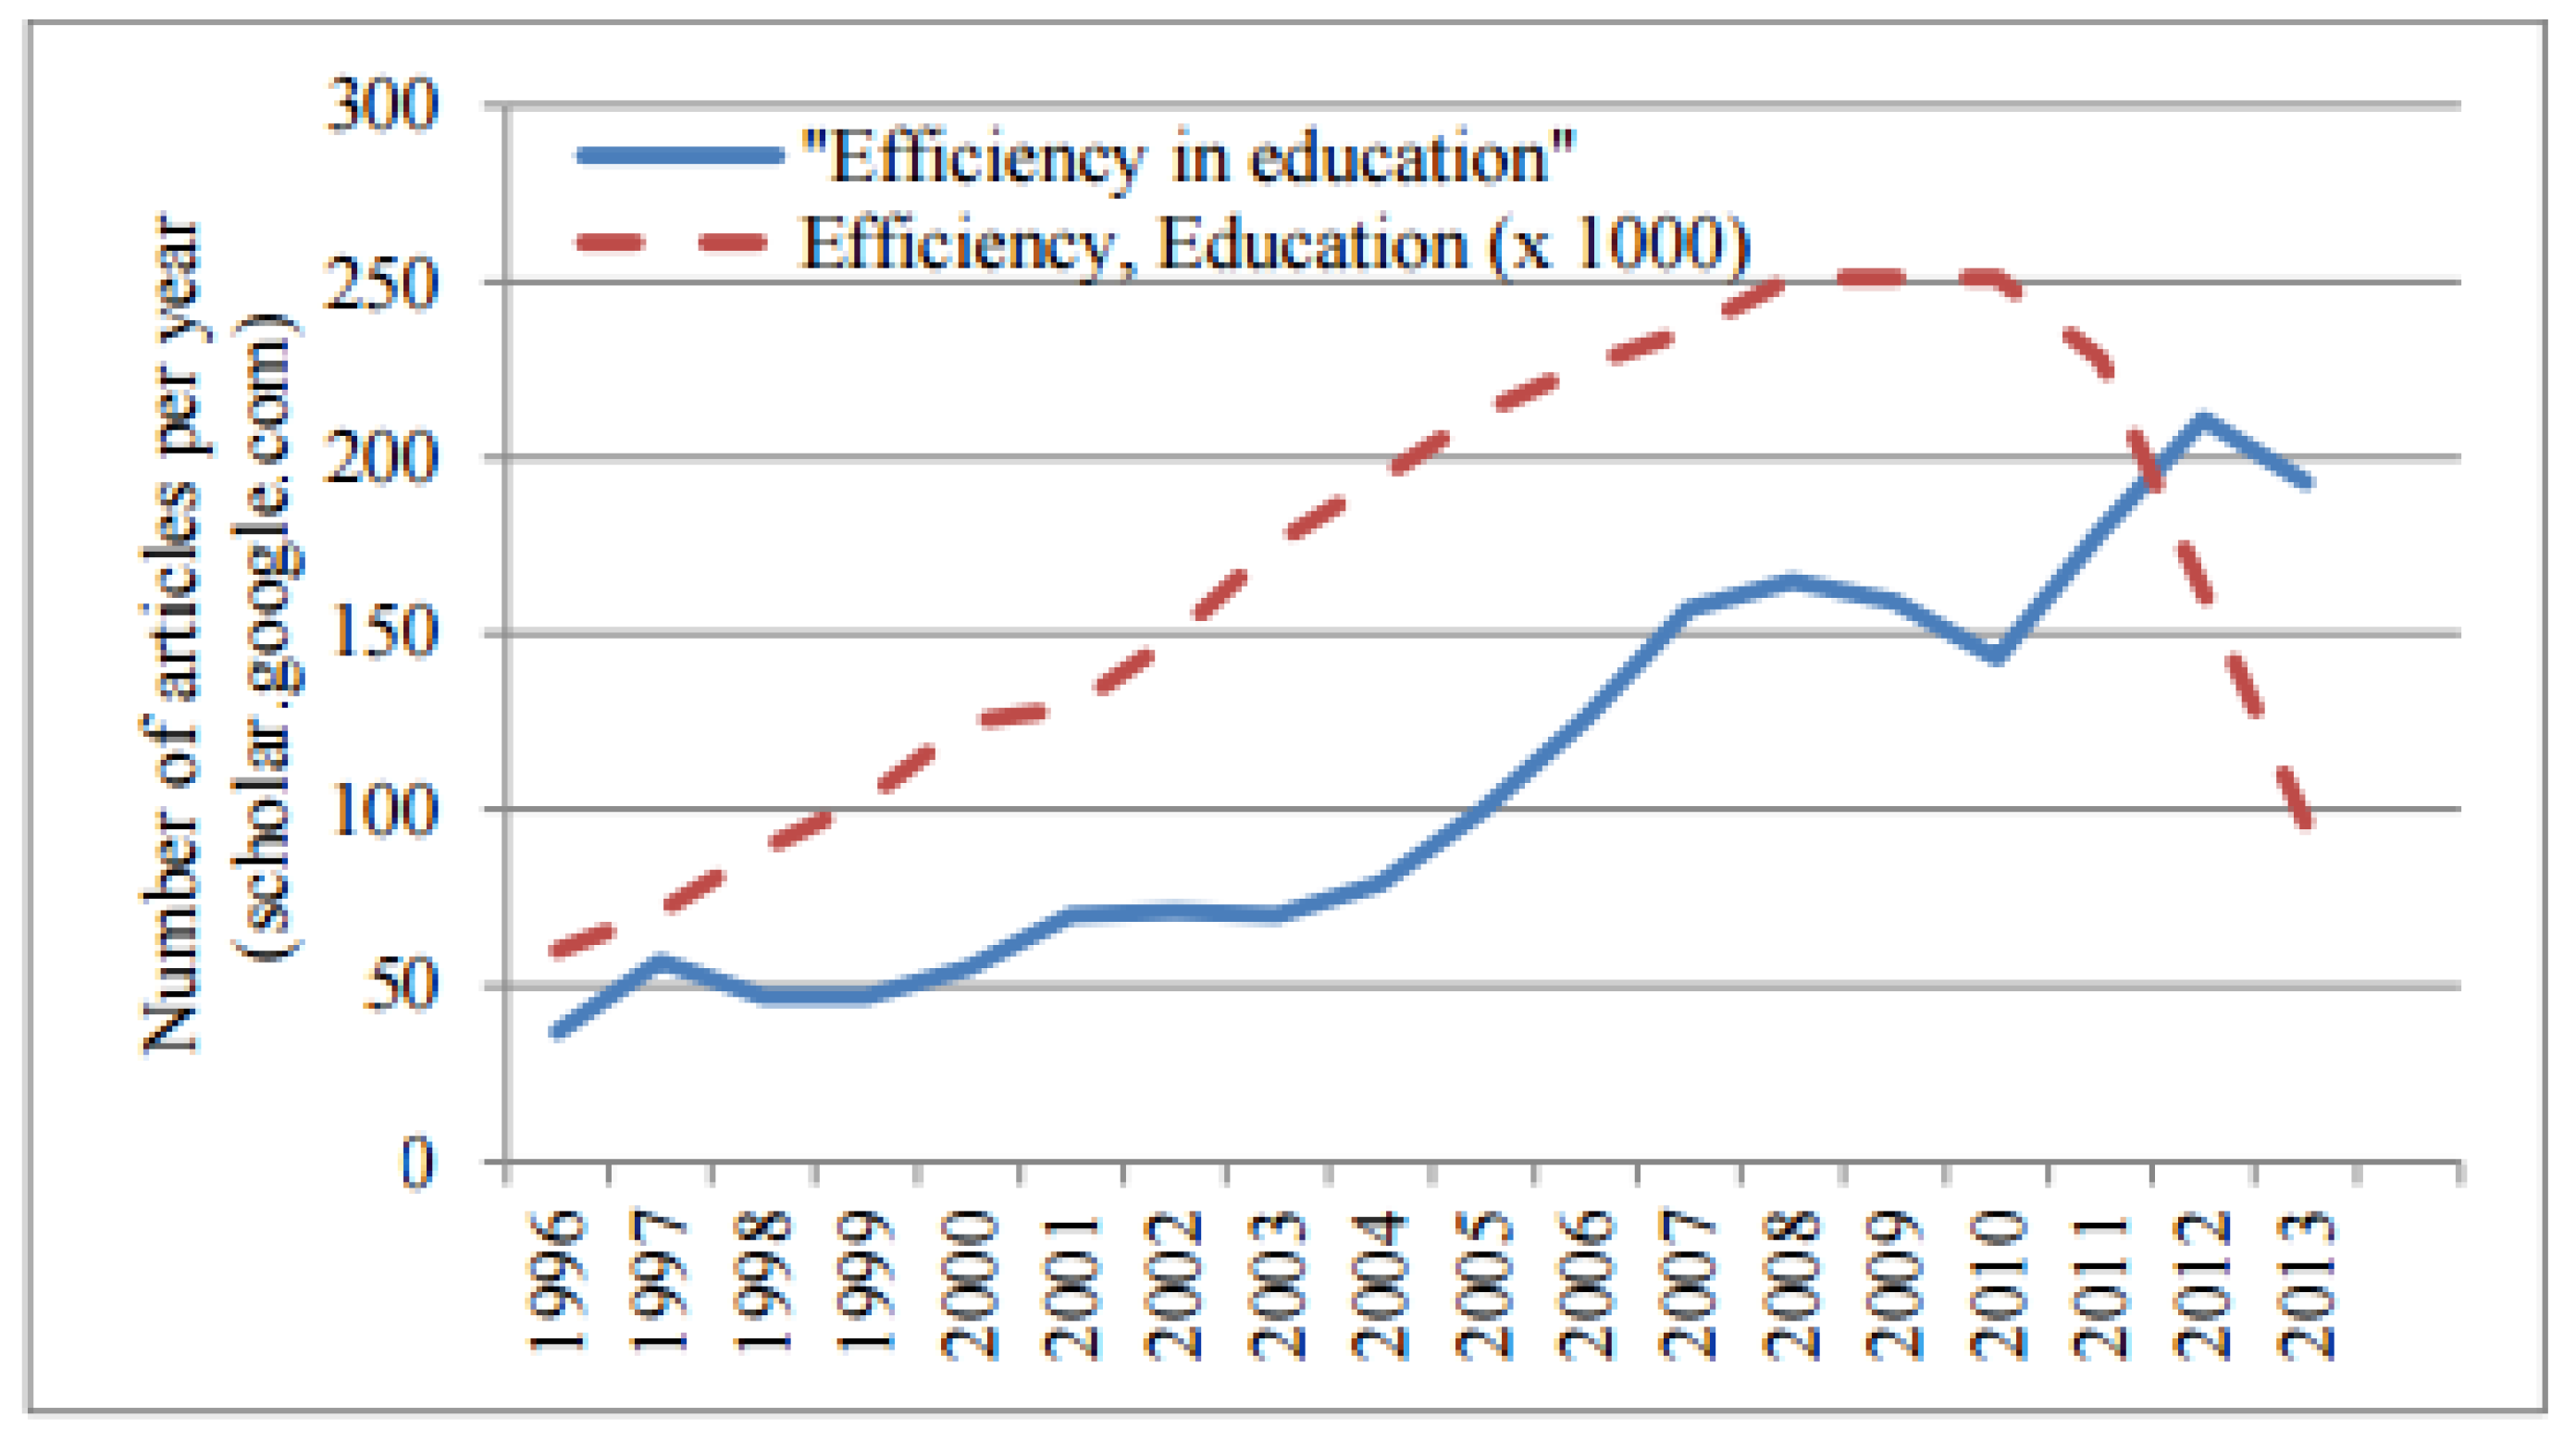
Figure 1 taken by De Witte and Lopez-Torres [
9] (pp. 339–363) presents the number of papers in a given year as referenced on Google.scholar.com.
For most years, there is an increasing number of papers on the themes of efficiency and education (dashed line if the words are used separately in the paper), and ‘efficiency of education’ (full line if the words have been used in this exact phrase). As governments around the world struggle with doing more with less, efficiency analysis climbs to the top of the policy agenda [
10].
Key studies as far as efficiency measures of secondary education is concerned, include the computing of efficiency for more than 8600 schools in 30 countries, using PISA 2012 data and a bootstrap version of Data Envelopment Analysis as a method [
10]. This study found that given current levels of inputs it would be possible to increase achievement by as much as 27% if schools improved the way they use these resources and realized efficiency gains, and that efficiency scores vary considerably both between and within countries.
Another interesting empirical analysis on this topic, is the measurement of technical efficiency in New Jersey School Districts in 1993 by Mc Carty and Yaisawang [
11]. By using DEA models, they found big differences in technical efficiency scores between districts.
As far as Greece is concerned, up to date, there is only one study, referred to the measurement of technical efficiency for High Schools in the region of Central Macedonia, during the school years 2007–2008 and 2010–2011, before the economic crisis in Greece and during it accordingly [
12]. (This study used three inputs and two outputs in two models: the first focused on the decrease of inputs on certain outputs (input oriented model) and the latter on the possible maximization of the outputs on certain inputs (output oriented model). The study concluded that for the school year 2010–2011, which falls in the period of the economic crisis in Greece, the efficiency scale of the general Senior High Schools in the region of Central Macedonia is superior to the one measured in 2007–2008 (before the economic crisis).
3. Estimating Methodology and Data
Two alternative methodological approaches for measuring efficiency are used: (i) estimation of a stochastic production frontier (using Stochastic Frontier Analysis); and (ii) data envelopment analysis (DEA), which allows identification of the efficient production frontier of the schools analyzed nonparametrically. Each of these techniques has advantages and limitations. The main advantage of DEA is that it does not require any information more than input and output quantities. The efficiency is measured relative to the highest observed performance rather than an average. However, a DEA-based estimate is sensitive to measurement errors or other noise in the data because DEA is deterministic and attributes all deviations from the frontier to inefficiencies. The strength of SFA is that it considers stochastic noise in data and also allows for the statistical testing of hypotheses concerning production structure and degree of inefficiency. Its main weaknesses are that it requires an explicit imposition of a particular parametric functional form representing the underlying technology and also an explicit distributional assumption for the inefficiency terms.
For the purpose of this study, DEA was considered more convenient, especially due to the few available observations.
The main objective of this study is to examine and evaluate the technical efficiency of the twenty-three Schools of General Education (Twenty one General Lyceums and two Junior High Schools with classes of Lyceum) of the prefecture of Fthiotida, with the following additional specific objectives:
To consider whether maximum technical efficiency is achieved in General Lyceums.
To find out if there are differences among the General Lyceums in terms of technical efficiency and then, if any, investigate the reasons for these differences.
To investigate, on the basis of the results, whether it is advantageous for the state to implement a policy of General Lyceums mergers in the prefecture of Fthiotida.
According to Boussofiane et al. [
5] a problem arising from the DEA model is that of the choice of inputs and outputs to be included in the comparisons. To decide which inputs and outputs we can use to compare educational units, we first have to look at what these are and then think about what information is available about them. It is clear that any source used by an educational unit should be included as an input. In addition, once a unit converts resources to produce outputs, the latter must include all the products or services produced by the unit that may differ in quality. Three inputs and four outflows will be used in this study.
As far as inputs are concerned, it is clear that the teaching staff of an educational unit is a key resource and will be measured in this study based on the ratio of students to the teaching staff. In addition, the ratio of the number of students to the number of each school (average number of students per class) and the average annual expenditure per pupil (ratio of annual expenditure to the number of students) will be used as an input.
The outputs to be studied is the quality of graduates in terms of (1) the percentage of students admitted in University; (2) the percentage of students admitted in Higher Education Technological Institutes; (3) the percentage of students that had excellent performance in the entrance to University Exams by General Grade of Access (GGA) between 18 and 20; and (4) the number of graduates not admitted in Higher Education. The number of graduates not admitted in Tertiary Education will be introduced in the model with a negative sign, since a higher number of students not admitted indicates lower quality.
The output of teaching is calculated in relation to the number of graduates. Comparisons are made between General Lyceums. Of course, particular attention is paid to the number of units needed to make a valid comparison. Through its effort to prove higher efficiency, an educational unit may shed all its weight on a single input or a single output [
5].
In this study, 23 General Education Lyceums are compared in terms of efficiency (21 General Lyceums and 2 Junior High Schools with Lyceum classes) of the Directorate of Secondary Education of the l region of Fthiotida for the year 2015.
The analysis of quantitative data, which is the observations for several economic units at a specific time (cross-sectional data, which is the limitation of this study) was conducted using the Social Sciences Statistics Program, IBM SPSS Statistics v.24 and the MS Office Excel 2007.
All data were obtained from the Regional Directorate of Education and the Local Authority of Fthiotida.
4. Findings
Appendix A (p. 12) presents the values of the variables related to the “School Unit Size” and “Educational Personnel” thematic axes. These variables are: X1 (Number of Students), X2 (Number of Classes), X3 (Number of Teachers) and X4 (Number of Teachers not completing the required Teaching Hours) for the General Lyceums of Fthiotida for the school year 2014–2015.
Appendix B (p. 12 ) presents the values of the variables related to the thematic axis “Details of Study and Performance of Students of the third grade”. These variables are: X5 (third grade lyceum students), X6 (number of students with excellent performance) with a General Grade of Access from 18 to 20 out of 20, X7 (number of students admitted to universities), X8 (number of students admitted to Technological Institutes) and X9 (number of students not admitted in tertiary education) for the lyceums of Fthiotida for the school year 2014–2015.
In
Table 1 we see that the average number of students per unit is 140.30, clearly lower than the corresponding average of the country with 192 students (Greek Statistical Service)) and considerably smaller than the EU average of 633 students (Eurydice 2012).
From
Table 2, we note that the average annual salary expenditure of teachers per unit is 295,265.65 with the largest payroll cost being equal to 643,500 € and recorded in the 4th Lyceum of Lamia and the lowest payroll cost is equal to 111,850 € and recorded in Moschochori Lyceum.
The average operational cost of the school units is 7.762 €. The total annual expenditure has an average of € 314,973.91 with a maximum of € 654,940 being recorded in the 4th Lyceum of Lamia.
In
Table 3, we observe that the Lyceums of Fthiotida have an average cost of 2.245 € per student. The highest average cost per student is recorded in Ypati Lyceum (6172 € per student) and the lowest average cost per student is recorded in the 1st Lyceum of Lamia (1728 € per student).
Table 4 presents the results of the variables defined as outputs in the DEA model.
From the results in
Table 5, we see that 8 out of the 23 school units, which is 34.8%, achieve maximum technical efficiency of 100% while the remaining 15 schools are inefficient (technical efficiency < 100%).
Appendix C (p. 13) presents the technical efficiency results derived from DEA applied in
Table 5.
Discussion of the Results
From the recording, the processing and the analysis of the quantitative data, the following conclusions were drawn:
The Lyceums of Fthiotida have an average of 140 students, smaller than the one of the Lyceums of the country and significantly smaller than the one in the EU countries.
The average size of the school units of the urban municipality—only in the city of Lamia—is much higher (three times) than that of the semi-urban municipalities of Fthiotida Region.
School units within Fthiotida have an average of 20.8 students per class.
School units within Fthiotida have an average of 10.44 students per teacher.
The average annual cost per student is 2245 €.
The average annual cost per student decreases with the increase in size of the school unit up to a point.
The optimal size of Lyceums is significantly larger than the existing size.
School units of Fthiotida in the performance of the third-grade students results that have an average of 4.38% of students with excellent performance and a GPA between 18 and 20 out of 20. There is a weak, positive correlation between the size of the third-grade class and the percentage of students with GPAs from 18 to 20 out of 20 (
Table 6).
School units of Fthiotida have an average of 36.43% of students who do not continue their studies in Tertiary Education.
Characteristic of the results is that the average number of students per class was equal to 20.8 which is considered very satisfactory while the maximum average number per class reached the 24.3 students at the Lyceum of Atalanti, when the upper allowed limit is 25 students per class, plus 10%. Greece has one of the lowest rates of teaching hours per teacher, according to the OECD list of countries and one of the lowest rates of number of students per class. Greece is a country with very small schools. More than 1300 Primary Schools have less than 25 students and more than 250 Junior High Schools and 70 Senior High Schools have less than 50 students in total.
Moreover, it was confirmed in the 23 examined Lyceums of Fthiotida that the average ratio of students/teachers and the number of students per class in Greece is significantly lower than in most European countries. More specifically, in the 23 Lyceums of Fthiotida an average of only 10.44 students per teacher was revealed.
The measurement of the technical efficiency of the 23 units examined in the prefecture of Fthiotida was based on the DEA method. Data analysis revealed significant findings and significant differences between schools in terms of their technical efficiency. Indeed, the analysis of the data revealed that 8 of the 23 schools, corresponding to 34.8% of the total units of the Prefecture of Fthiotida that we examined in the present study, achieve maximum technical efficiency (100%). The schools with the highest technical efficiency are: 1st Lamia, 4th Lamia, 5th Lamia, Pelasgia Lyceum, Atalanti Lyceum, Kato Tithoreas Lyceum, Malesina Lyceum and Martino Lyceum, while the worst technical efficiency was observed in the Moschochori Lyceum. In fact, we can conclude that about the 1 out of the 3 units examined in the Regional District of Fthiotida achieves the maximum yield based on the input available.
In addition, 7 out of the 23 (30.4%) examined units of the Prefecture of Fthiotida (3rd Lyceum of Lamia, Ypati Lyceum, 6th Lyceum of Lamia, Lyceum of Amfiklia, the school unit of Monastirio, 2nd Lyceum of Lamia and the Lyceum of Spercheiada) achieve very high technical efficiency ranging from 91.79% to 99.45%. Finally, 8 out of the 23 school units examined (Makrakomis Lyceum, Elatia Lyceum, Stylida Lyceum, Kamena Vourla Lyceum, Livanates Lyceum, Molos Lyceum, Domokos Lyceum and the school unit of Moschochori) reach very low performance with their technical efficiency ranging from 49.99% to 77.17%. Among the above, 2 out of 3 of the schools examined have a technical efficiency of 91.79% up to 100%. The average technical efficiency of inefficient school units was calculated at 79.86%.
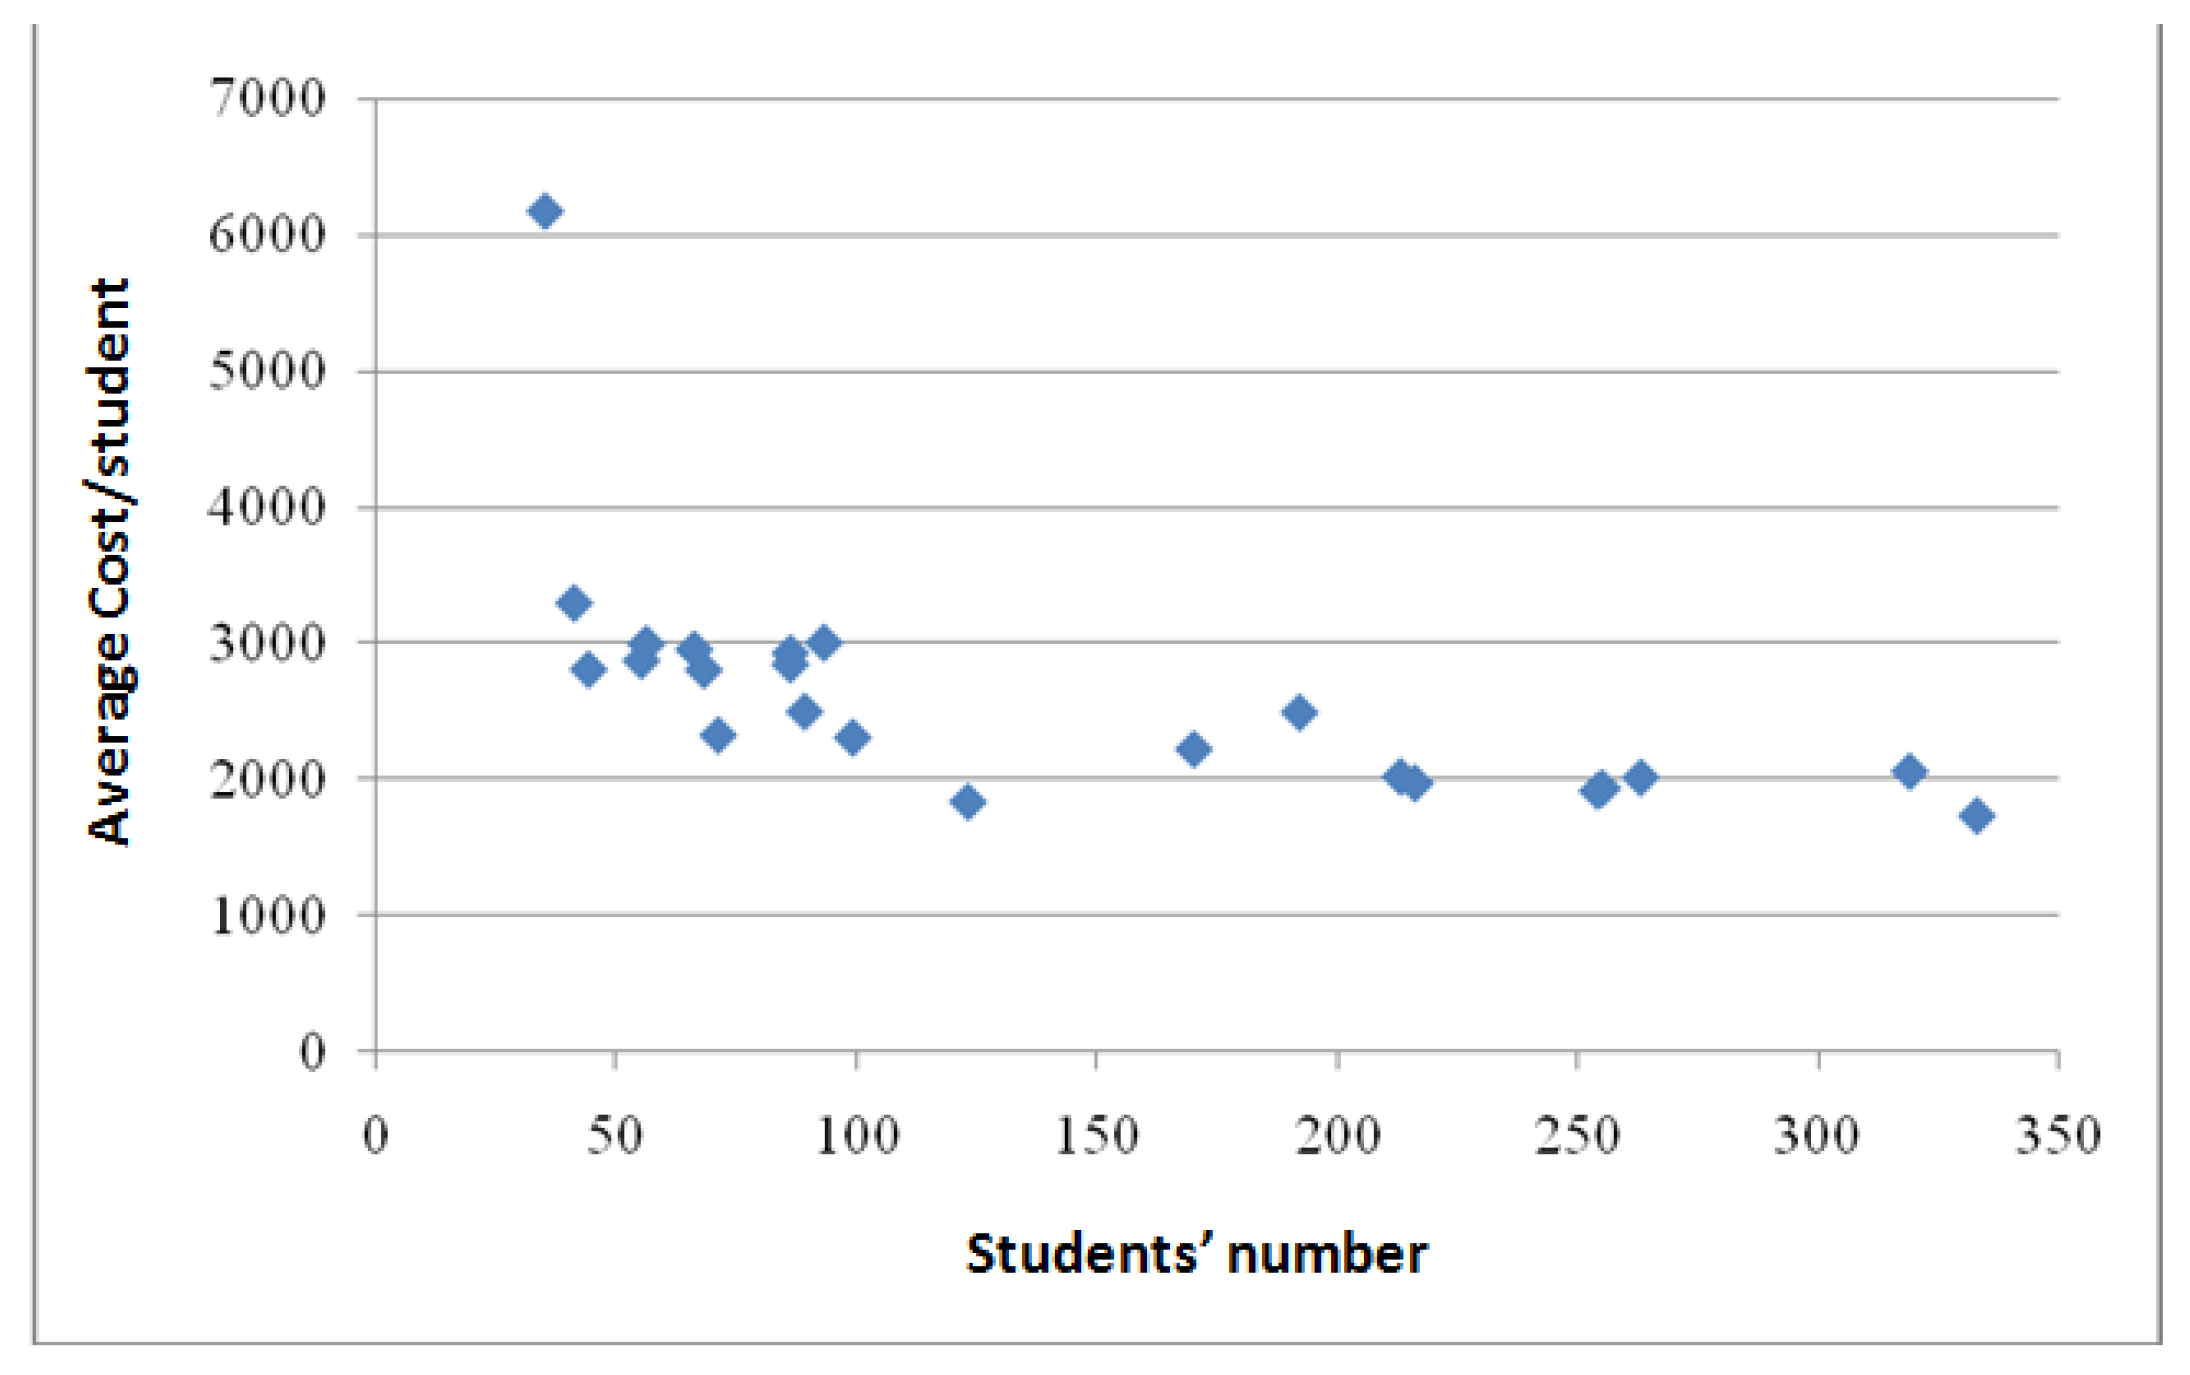
The results of technical efficiency show the very low technical efficiency achieved by schools that are decentralized, with few students and for which high average costs per pupil are recorded. These school units are at the extremes in the Dispersion Diagram
Figure 2 and the corresponding coordinates of their points
differ greatly from the coordinates of the ideal point
.
To calculate the optimal number of students per school at which the annual public cost is minimized (scale efficiency), the model of least squares is used, and more specifically regression analysis.
Table 7 shows the spread of the variables students (s) and average cost per (c/s).
The prices of volatility coefficients are: CVS = 67.5% και CVC = 34.7% accordingly, and both of them are higher than 10%.
Table 8 shows that the Pearson correlation coefficient of variables (S) and (C) is
, and it is statistically significant at (p)a = 0.01. The negative sign indicates the co-volatility of (s) and © variables of opposite direction, at least up to a certain price of (s).
In the next
Table 9 there is a grouping of school units, according to their number of students, in groups of 50 students per each school of this […–…] form.
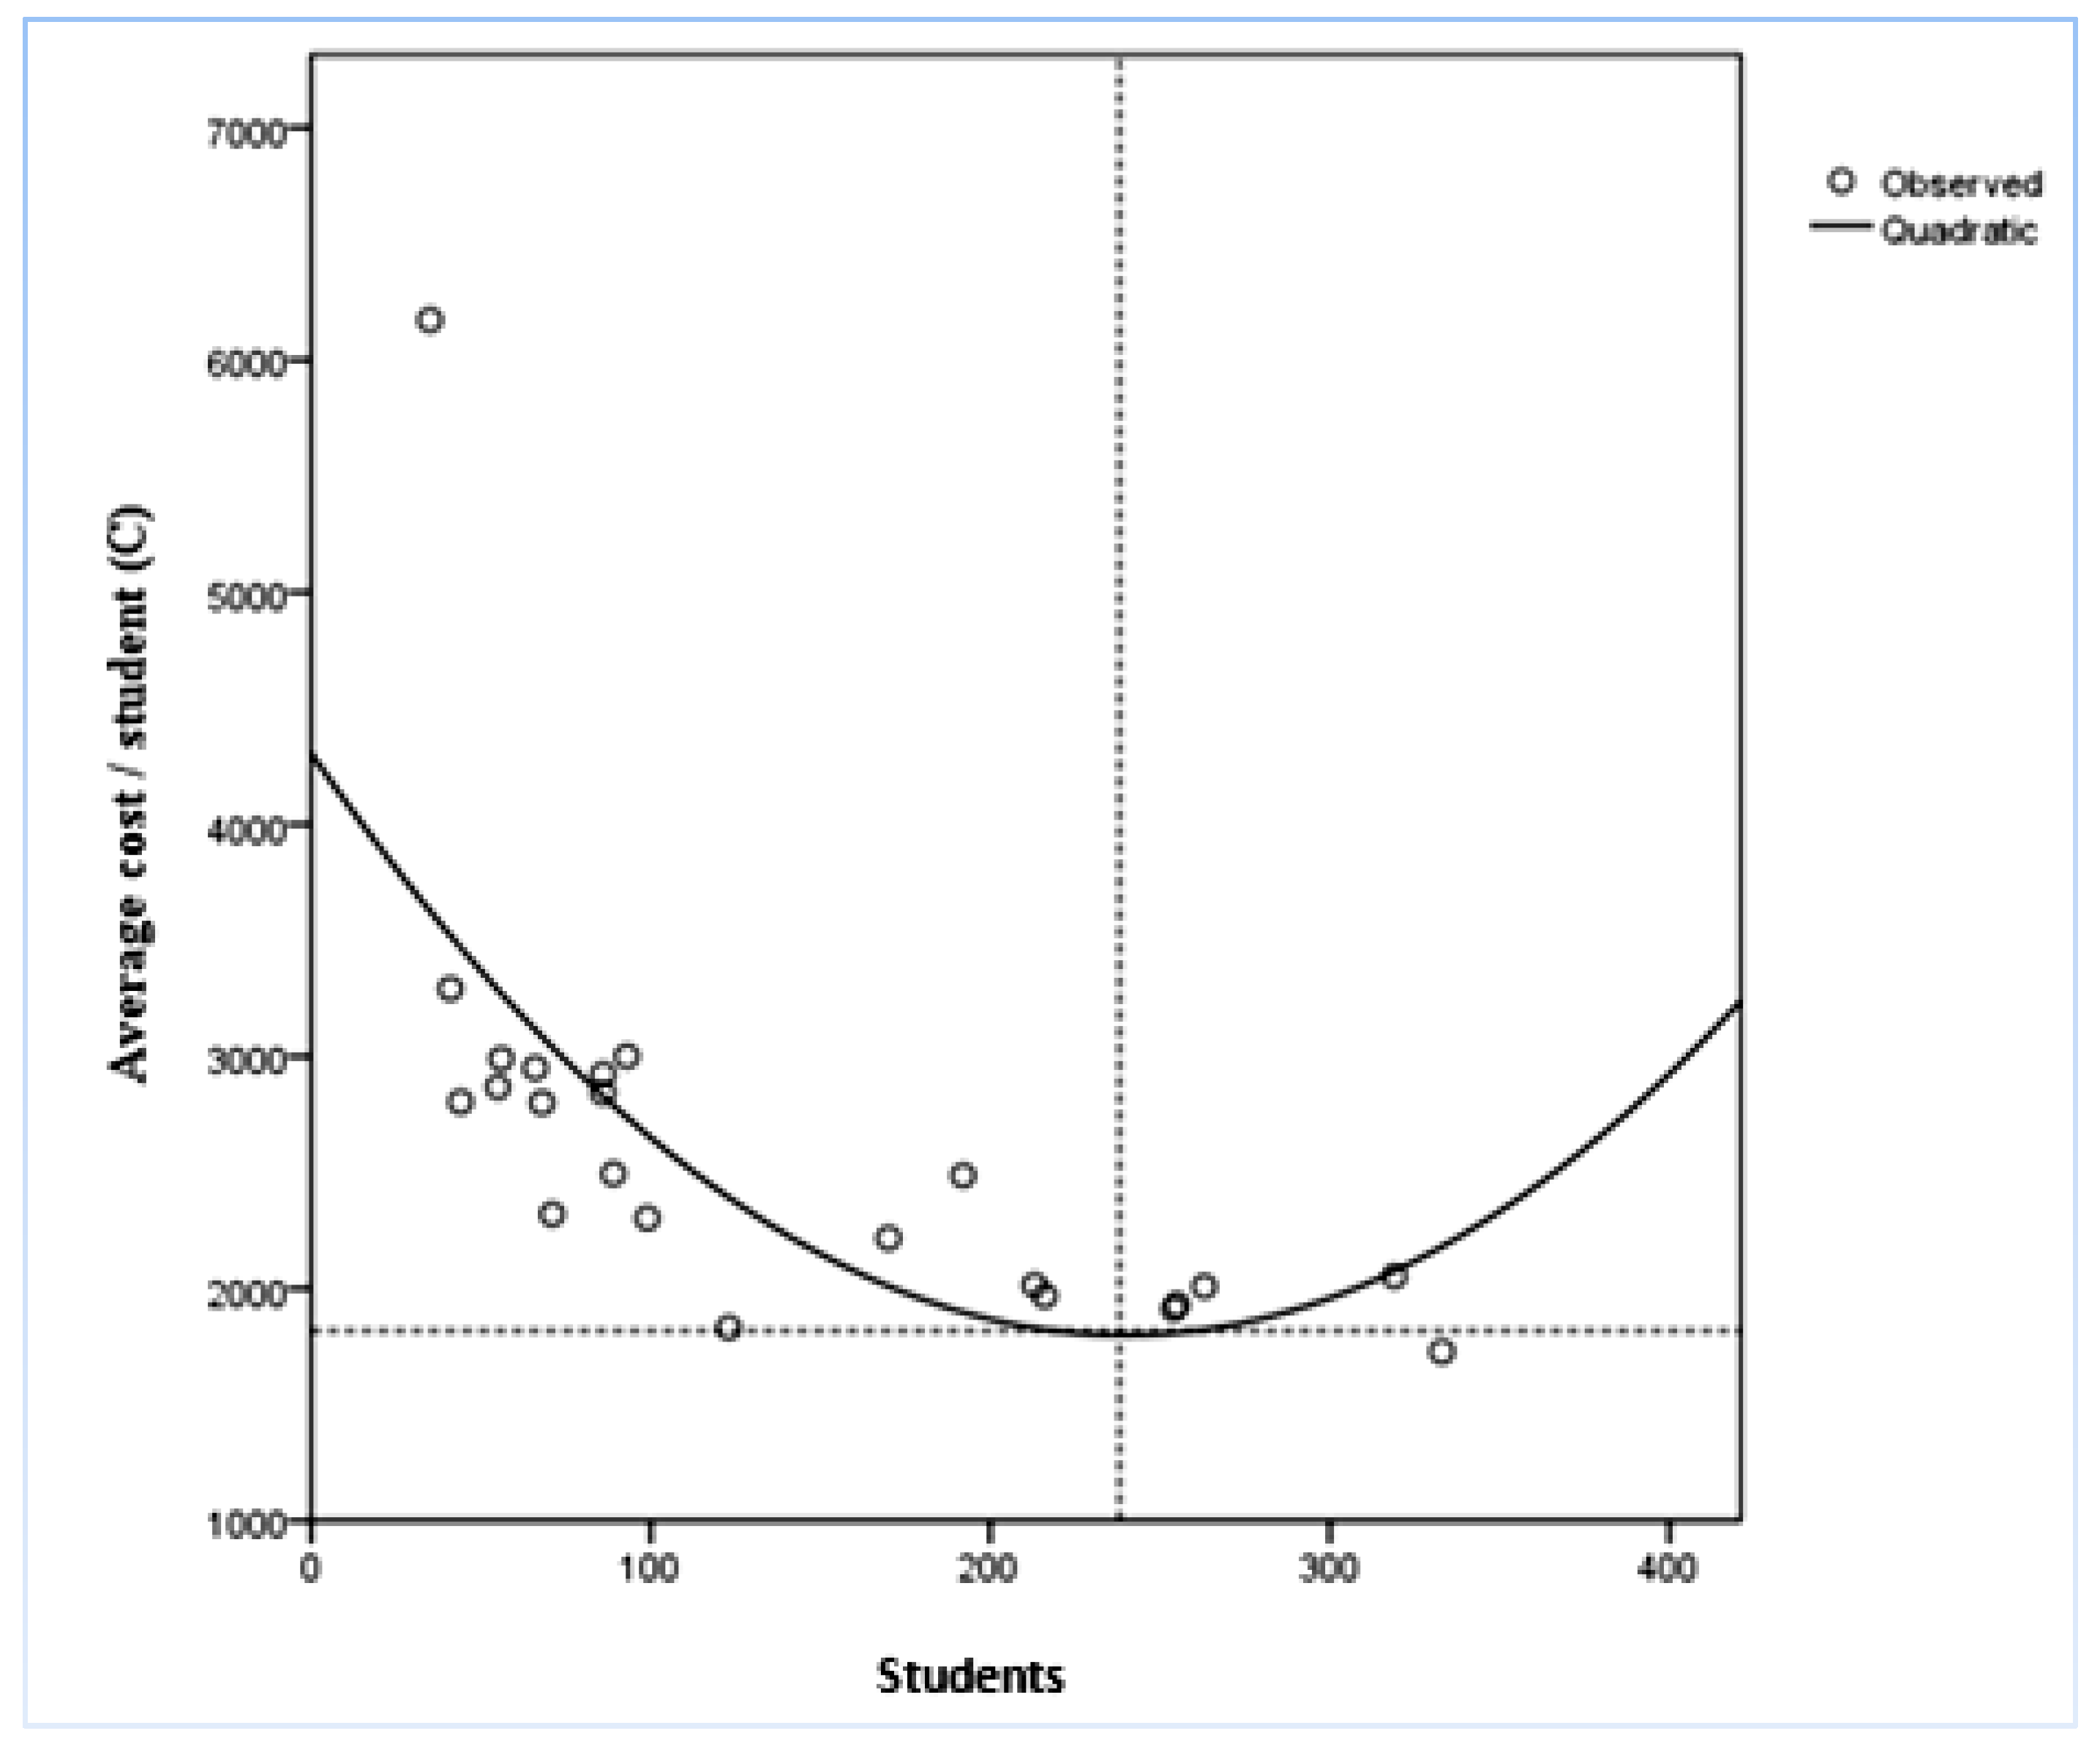
Table 9 and the regression curve (
Figure 3) seem to confirm the economic theory of production cost, which is the average cost of production, both in short and long run, shapes a “U” curve, with the velors looking upwards. The curve gives us information about the allocation of average cost prices (input-dependent variable), as to the number of students (output-independent variable).
Figure 3 depicts the cloud of 23 school units, where (s
i, c
i) for i = 1, 2, … 23, is the regression curve of function (2) and the optimal point is
as the intersection of vertical dotted lines.
The mathematical regression model is:
where
the expected annual average cost per student,
number of students,
regression coefficients.
Table 10 presents the prices of the regression coefficients, which are calculated with the model of least squares, by using SPSS v.24.
From
Table 10 we conclude that the models’ coefficients prices are:
The prices of (b) and (c) are statistically significant because the equivalent price of every p-price is lower than 0.05, while the price of (a) is equal to 0.05. The model explains 49% of volatility, because .
Therefore, the equation is:
We estimate the extremes of the function C(S), which is defined by (2).
❖ 1st derivative of (2)
Consequently, the average cost per student is minimized when they reach the number of 238 per school unit (optimal), and the equivalent least cost is: €.
School units with 238 students function at the optimal efficient level. School units with a lower or higher number of students have diseconomies of scale, therefore they are characterized by waste of resources.
5. Conclusions and Suggestions
High Schools play a significant role in the formation of human capital. Since their operation is funded with taxpayers’ money, the efficiency by which inputs produce desired output is therefore an important public policy issue. In this paper, DEA was used to estimate technical and scale efficiency for the High Schools in the Greek prefecture of Fthiotida for the school year 2014–2015. Several inputs and outputs were used. The technical and scale efficiency results suggest that the above mentioned schools operate at a low level of efficiency relative to each other, thus there is a need from improvement in several schools (without quality deterioration).
From the previous statistical processing, analysis and interpretation of the quantitative data on the technical efficiency of the school units that we have examined in the present study and with the aim of improving it, we propose the following changes:
a. Merge/unite school units
From the spatial distribution of the examined schools, we find the following:
In all the semi-urban municipalities of Fthiotida there are small to very small Lyceums. 73.33% of the schools of the semi-urban municipalities have a size of less than 100 students. In the urban municipality, in the Lamia City Planning Complex, only five of the schools examined (21.73%) were found to have a size greater than the optimum of 238 students per school unit as it emerged from the regression analysis, while outside the town planning complex the two smaller schools had a size of less than 50 students.
Indicative is the fact that in the same Municipality of Makrakomi there are two homogeneous Lyceums operating at a distance of 5 km, the Lyceum of Sperchiada with 86 students, with an average of 17.2 students per class, an average rate of 7.82 students per teacher, and the 8th position in terms of technical efficiency with a percentage of 91.79%. Accordingly, the lyceum of Makrakomi has 86 students, with an average of 17.2 students per class, an average rate of student per teacher 9.56, and the 9th position in terms of technical efficiency and a percentage of 77.17%.
The kilometric proximity between the Municipalities in which the schools that we have examined in the present study are small to very small.
We propose, in the light of the above findings, the merging of school units at the level of Municipalities, given the generation of financial results on a yearly basis (because they will operate close to the optimal size), creating better working conditions for teachers (reducing stress) avoiding moving them to different schools to complete their compulsory teaching schedule, better learning conditions for students by developing healthy competition between them (larger average number of students per class), etc.
b. Management of teaching staff
From the study of the available data on the completion of the compulsory weekly teaching hours of the teachers working with an organic working relationship in the schools examined, a significant number of teachers did not complete their compulsory weekly teaching schedule.
To address the existing situation and better manage the teaching staff, as the principles of Human Resource Management recommend, we propose that:
An attempt is made to rationalize the placement system—organic placements, supernumeraries, availability—of the teaching staff.
Move/disposition of teachers to complete their compulsory hours between adjacent school units of the same prefecture.
Considering the specialty of the teachers, their posting/delivery to public institutions beyond the school units (indicatively we mention some examples of teachers that have problems with the completion of teaching hours such as: Physical Education teachers could work in sports structures of the Municipalities, as well as teachers of ICT could similarly be occupied).
c. Redistribution of students in the High Schools of Fthiotida
Considering the following data:
During the school year 2014–2015, 3.227 students were divided into 155 general education classes (average 20.8 students/section),
In the coming years no demographic/population changes are foreseen,
The measuring of the technical efficiency of twenty-three (23) school units,
The administrative structure of the Prefecture of Fthiotida,
We propose that the new geographical structure in the distribution of General Lyceums should provide for the Prefecture of Fthiotida as an optimal number the operation of 15 school units instead of the 23 existing ones (35% reduction) during the reference school year 2014–2015 with the distribution of the students in 134 classes (13.55% decrease) and an average of 24 students/class (15.38% increase).
The proposed distribution of Lyceums to the respective Municipalities is the following: Lamieon 7, Stylida 1, Makrakomi * 1, Domokou * 1, Lokron * 2, Amfiklia—Elatia 1 and Molos—Agios Konstantinos * 2. (In the municipalities of Makrakomis, Domokos, Lakron, the merged Lyceums are smaller than the optimum, while in the Municipality of Molos - Agios Konstantinos the merger of the two Lyceums into one would be larger than the optimal size).
Table 11 shows that the expected total annual financial benefit is estimated to be € 1,028,790, which is 14.2% of the total annual cost. This benefit derived by reducing by € 1,213,000, the payroll cost, the operating expenses by € 45,790 and by increasing students’ transportation costs by € 230,000.
The results of this study are of great importance for policy makers since they will be able to allocate scarce resources, especially in a period of dramatic economic crisis in Greece, to secondary education in a more efficient way. Of course, since this is a small-scale investigation, further research is needed for the whole country.


