A Systems Biology Approach to Understanding the Mechanisms of Action of an Alternative Anticancer Compound in Comparison to Cisplatin


 ,
,
Abstract
:1. Introduction
2. Experimental Section
2.1. Reagents and Suppliers
2.2. Media, Yeast Strains and Growth Conditions
2.3. Tag Microarray
2.4. Sensitivity Confirmation
2.5. Protein Sample Preparation and Extraction
2.6. 1D SDS Polyacrylamide Gel Electrophoresis
2.7. Tris-Tricine Polyacrylamide Gel Electrophoresis
2.8. 2D SDS Polyacrylamide Gel Electrophoresis
2.9. Staining and Quantitative Analysis
2.10. Mass Spectrometric Analysis
2.11. Bioinformatics
3. Results


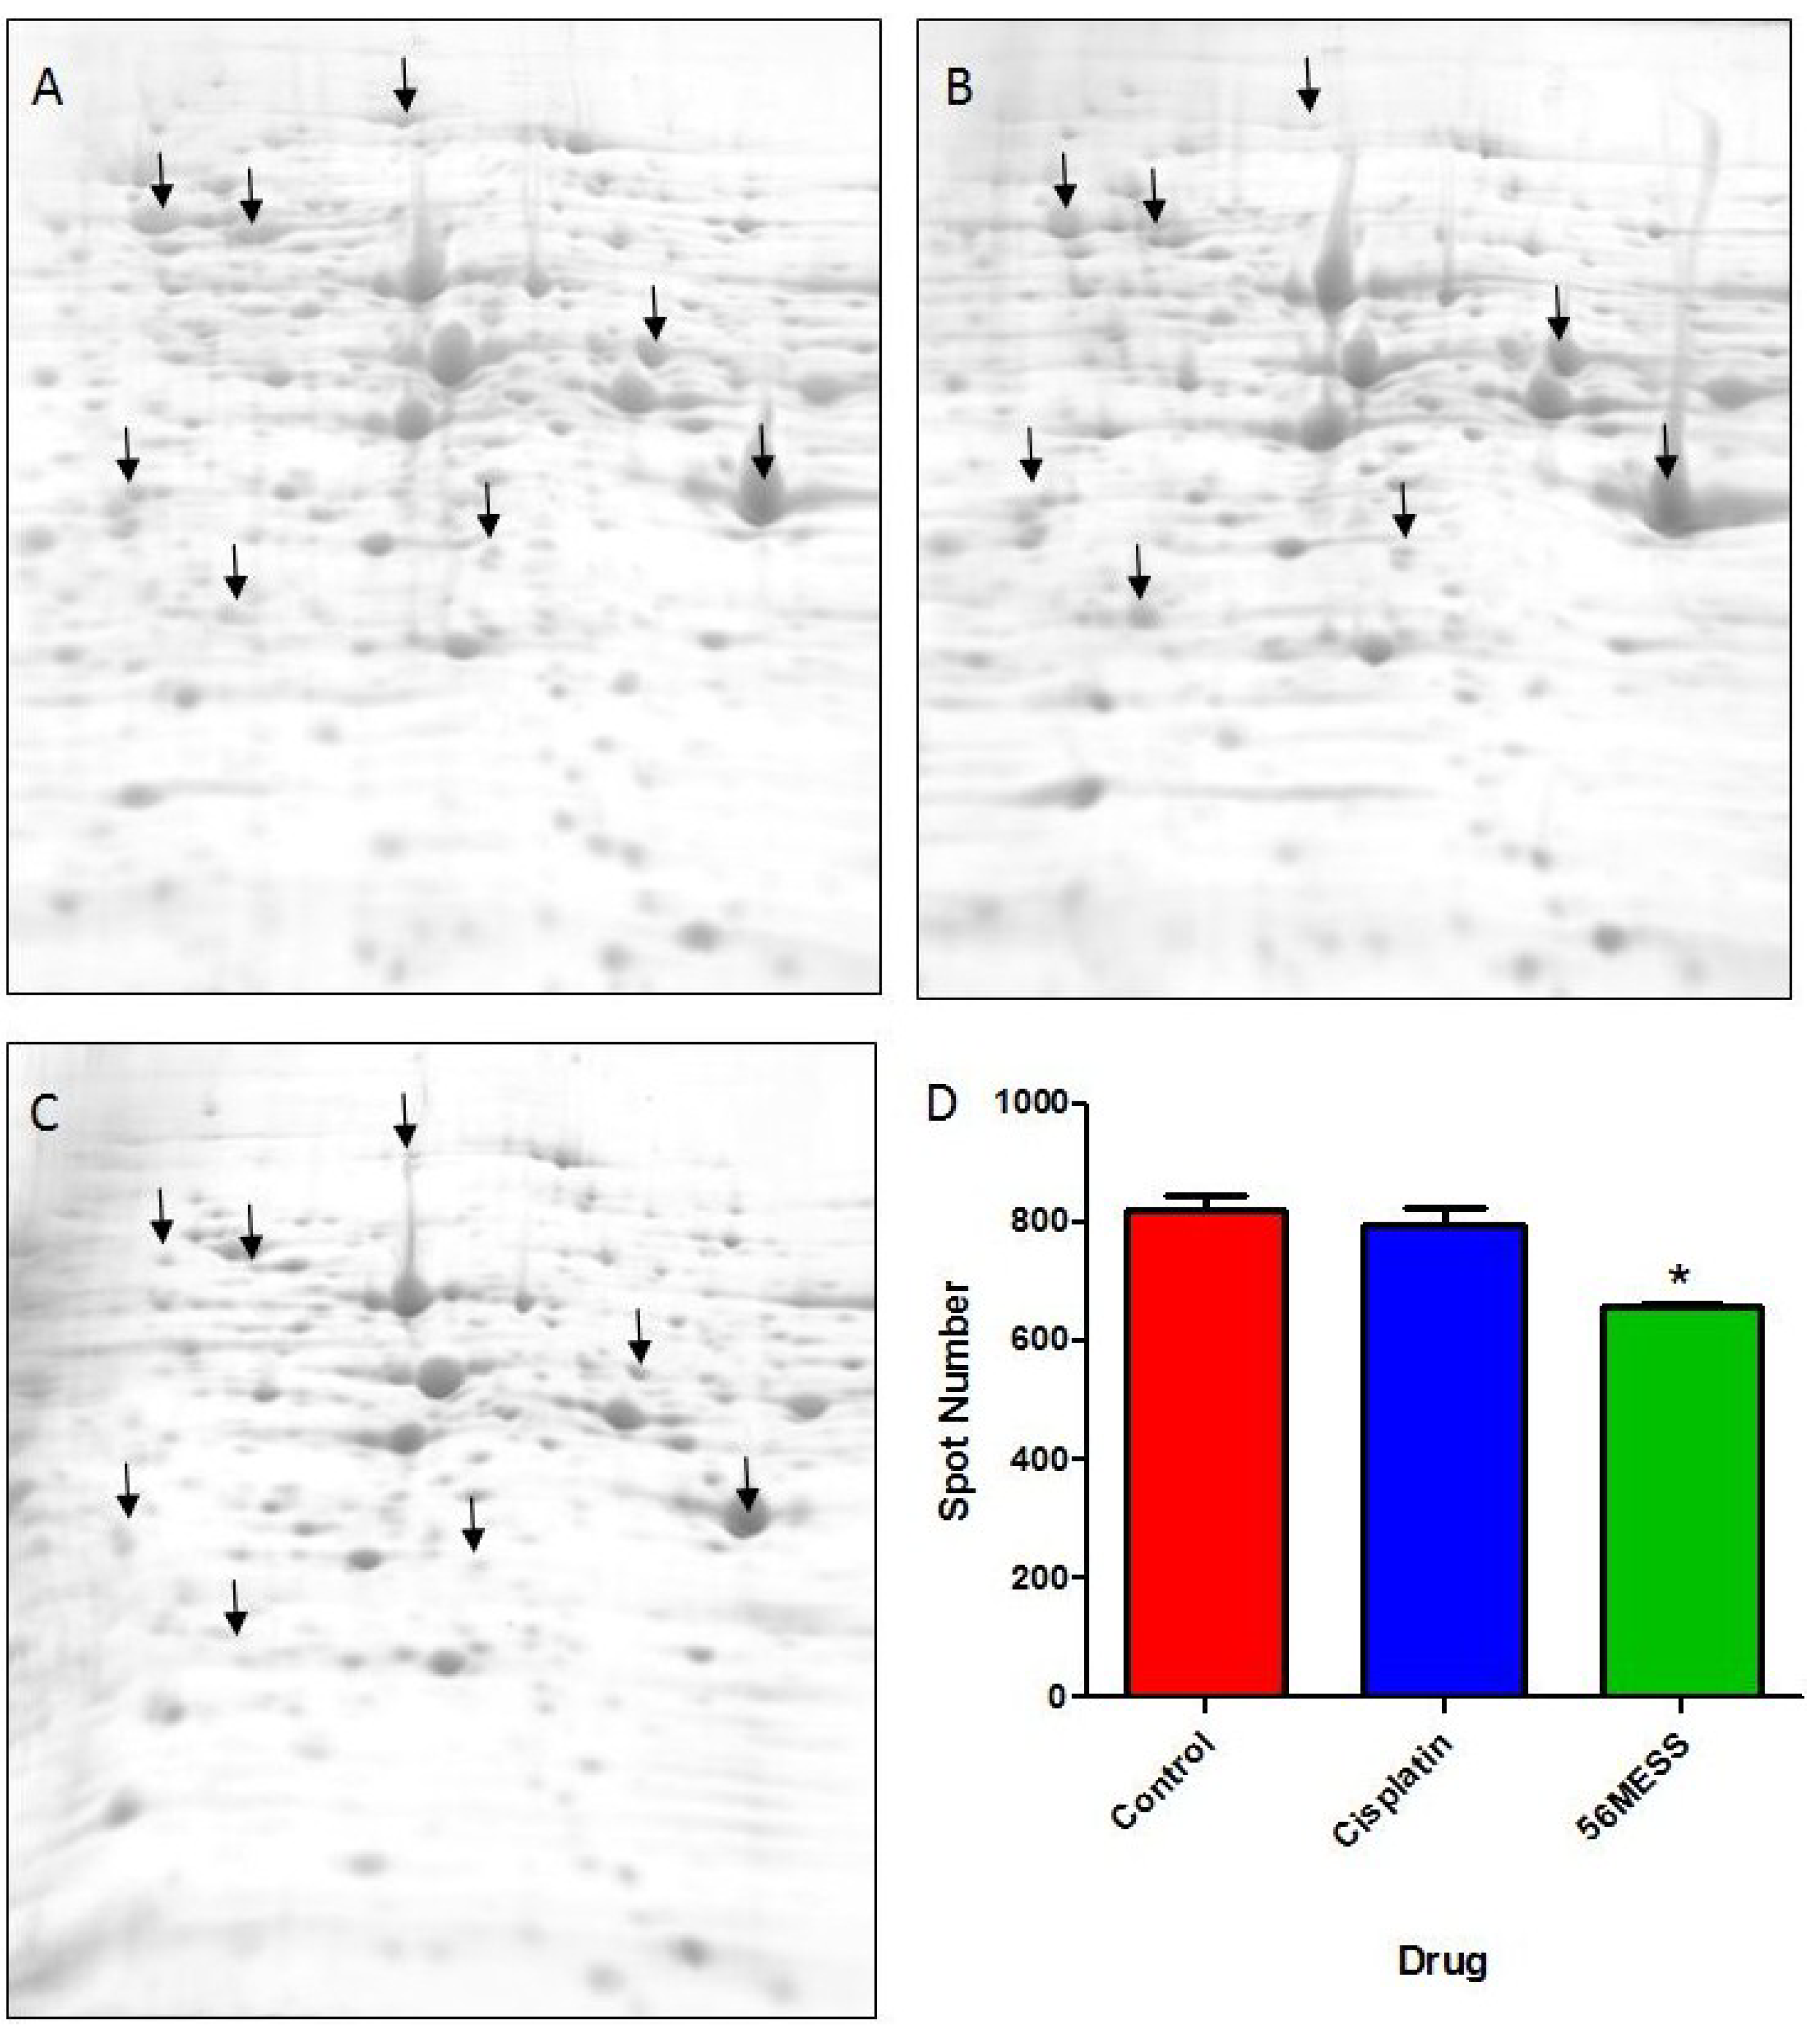
 control;
  1 mM cisplatin;
  2 mM 56MESS. Error bars represent SEM. ‘*’ indicates p = 0.0064 (n = 3).
control; 1 mM cisplatin; 2 mM 56MESS. Error bars represent SEM. ‘*’ indicates p = 0.0064 (n = 3).
2 mM 56MESS. Error bars represent SEM. ‘*’ indicates p = 0.0064 (n = 3).
control; 1 mM cisplatin; 2 mM 56MESS. Error bars represent SEM. ‘*’ indicates p = 0.0064 (n = 3).
 Control;
  1 mM cisplatin;
  2 mM 56MESS. Error bars represent SEM. ‘*’ indicates p < 0.05 (n = 3).
Control; 1 mM cisplatin; 2 mM 56MESS. Error bars represent SEM. ‘*’ indicates p < 0.05 (n = 3).
2 mM 56MESS. Error bars represent SEM. ‘*’ indicates p < 0.05 (n = 3).
Control; 1 mM cisplatin; 2 mM 56MESS. Error bars represent SEM. ‘*’ indicates p < 0.05 (n = 3).


| Mascot ID | Gene | Score | Theoretical | Observed | Coverage | Peptides | E-value | ||
|---|---|---|---|---|---|---|---|---|---|
| P10591 | SSA1/member of the heat shock family | 1551 | 69.6 | 5.0 | 72.2 | 4.4 | 42% | K.ATAGDTHLGGEDFDNR.L | 9.50E-06 |
| K.SQVDEIVLVGGSTR.I | 6.20E-05 | ||||||||
| K.LVTDYFNGKEPNR.S + Deamidated (NQ) | 3.80E-04 | ||||||||
| K.NQAAMNPSNTVFDAK.R + Oxidation (M) | 1.70E-03 | ||||||||
| R.SINPDEAVAYGAAVQAAILTGDESSK.T | 2.00E-03 | ||||||||
| K.DAGTIAGLNVLR.I | 2.30E-03 | ||||||||
| K.ATAGDTHLGGEDFDNR.L | 1.00E-02 | ||||||||
| K.ELQDIANPIMSK.L + Oxidation (M) | 1.00E-02 | ||||||||
| R.IINEPTAAAIAYGLDK.K | 4.90E-02 | ||||||||
| P00925 | ENO2/Enolase II, phosphopyruvate hydratase | 997 | 47 | 5.6 | 31.4 | 5.1 | 37% | K.TAGIQIVADDLTVTNPAR.I | 1.10E-05 |
| K.DGKYDLDFKNPESDK.S | 2.80E-05 | ||||||||
| K.AVDDFLLSLDGTANK.S | 4.40E-05 | ||||||||
| R.SGETEDTFIADLVVG.L | 5.80E-05 | ||||||||
| K.LGANAILGVSMAAAR.A + Oxidation (M) | 8.40E-04 | ||||||||
| K.IGLDCASSEFFK.D + Propionamide (C) | 2.30E-03 | ||||||||
| K.VNQIGTLSESIK.A | 3.30E-02 | ||||||||
| P00560 | PGK1/3-phosphoglycerate kinase | 494 | 44.7 | 7.1 | 19.7 | 5.8 | 23% | K.ASAPGSVILLENLR.Y | 1.70E-02 |
| K.VLENTEIGDSIFDK.A | 1.30E-05 | ||||||||
| E7NIQ9 | ENO1/Enolase I, phosphopyruvate hydratase | 309 | 34 | 5.7 | 17.6 | 6.7 | 16% | R.GNPTVEVELTTEK.G | 1.60E-02 |
| K.AVDDFLLSLDGTANK.S | 2.60E-04 | ||||||||
| P10592 | SSA2/ stress induced heat shock protein | 4809 | 69.4 | 5.0 | 72.2 | 4.8 | 67% | K.KAEETIAWLDSNTTATKEEFDDQLK.E | 1.50E-08 |
| K.NTISEAGDKLEQADKDAVTK.K + Deamidated (NQ) | 5.90E-08 | ||||||||
| R.SINPDEAVAYGAAVQAAILTGDESSK.T | 2.40E-07 | ||||||||
| K.LDKSQVDEIVLVGGSTR.I | 3.40E-07 | ||||||||
| K.ATAGDTHLGGEDFDNR.L | 1.80E-06 | ||||||||
| K.AVGIDLGTTYSCVAHFSNDR.V + Propionamide (C) | 3.20E-06 | ||||||||
| K.NQAAMNPANTVFDAKR.L + Oxidation (M) | 4.90E-06 | ||||||||
| K.TQDLLLLDVAPLSLGIETAGGVMTK.L + Oxidation (M) | 7.70E-06 | ||||||||
| R.IINEPTAAAIAYGLDKK.G | 7.80E-06 | ||||||||
| K.LVTDYFNGKEPNR.S + Deamidated (NQ) | 3.40E-05 | ||||||||
| K.KSEVFSTYADNQPGVLIQVFEGER.A | 8.90E-05 | ||||||||
| K.ATAGDTHLGGEDFDNR.L | 1.10E-04 | ||||||||
| K.MKETAESYLGAK.V + Oxidation (M) | 2.40E-04 | ||||||||
| K.SQVDEIVLVGGSTR.I | 3.00E-04 | ||||||||
| K.NFTPEQISSMVLGK.M + Oxidation (M) | 3.60E-04 | ||||||||
| K.KAEETIAWLDSNTTATKEEFDDQLK.E | 1.50E-08 | ||||||||
| P32589 | SSE1/ATPase involved in the Hsp90 complex | 1986 | 77.3 | 5.2 | 82.3 | 4.9 | 36% | F.GLDLGNNNSVLAVAR.N | 6.40E-07 |
| K.KDDLTIVAHTFGLDAK.K | 1.00E-06 | ||||||||
| K.DDLTIVAHTFGLDAK.K | 6.90E-06 | ||||||||
| K.PLSTTLNQDEAIAK.G | 1.00E-05 | ||||||||
| F.GLDLGNNNSVLAVAR.N + Deamidated (NQ) | 2.70E-05 | ||||||||
| K.HVFSATQLAAMFIDK.V + Oxidation (M) | 1.70E-04 | ||||||||
| R.EELEELVKPLLER.V | 2.70E-04 | ||||||||
| R.GIDIVVNEVSNR.S | 4.90E-04 | ||||||||
| K.QVEDEDHMEVFPAGSSFPSTK.L + Oxidation (M) | 5.20E-04 | ||||||||
| R.IVNDVTAAGVSYGIFK.T | 7.50E-04 | ||||||||
| R.KNTLEEYIYTLR.G | 8.00E-04 | ||||||||
| K.QSISEAFGKPLSTTLNQDEAIAK.G | 1.30E-03 | ||||||||
| R.GKLEEEYAPFASDAEK.T | 2.40E-03 | ||||||||
| K.YEELASLGNIIR.G | 2.60E-03 | ||||||||
| R.IIGLDYHHPDFEQESK.H | 3.60E-03 | ||||||||
| K.GAAFICAIHSPTLR.V + Propionamide (C) | 3.90E-03 | ||||||||
| K.LNELIEKENEMLAQDK.L + Oxidation (M) | 2.40E-02 | ||||||||
| E7KFS3 | HSP60/Chaperonin mediates protein refolding after stress | 2189 | 60.7 | 5.2 | 61.2 | 4.8 | 52% | K.TNEAAGDGTTSATVLGR.A | 5.30E-10 |
| K.QIIENAGEEGSVIIGK.L | 3.90E-08 | ||||||||
| K.EITTSEEIAQVATISANGDSHVGK.L + Deamidated (NQ) | 1.20E-06 | ||||||||
| K.GVETLAEAVAATLGPK.G | 2.80E-06 | ||||||||
| K.SEYTDMLATGIIDPFK.V + Oxidation (M) | 1.50E-05 | ||||||||
| R.TLEDELEVTEGMR.F + Oxidation (M) | 1.00E-04 | ||||||||
| K.VEFEKPLLLLSEK.K | 1.20E-04 | ||||||||
| K.DRYDDALNATR.A | 1.60E-04 | ||||||||
| R.VGGASEVEVGEK.K | 5.00E-04 | ||||||||
| K.GSIDITTTNSYEK.E + Deamidated (NQ) | 2.10E-03 | ||||||||
| R.VLDEVVVDNFDQK.L | 2.00E-02 | ||||||||
| P05317 | RPP0/Conserved ribosomal protein involved in translational elongation | 582 | 33.7 | 4.8 | 24.4 | 4.7 | 22% | K.SLFVVGVDNVSSQQMHEVR.K | 3.70E-09 |
| K.TSFFQALGVPTK.I | 8.50E-04 | ||||||||
| K.GNVGFVFTNEPLTEIK.N | 3.30E-03 | ||||||||
| R.GTIEIVSDVK.V | 4.20E-02 | ||||||||
| P00549 | CDC19/Pyruvate kinase | 3074 | 54.5 | 7.6 | 57.0 | 7.2 | 74% | F.VFEKEPVSDWTDDVEAR.I | 8.50E-04 |
| K.ACDDKIMYVDYK.N + Oxidation (M); Propionamide (C) | 2.90E-02 | ||||||||
| K.AIIVLSTSGTTPR.L | 4.30E-04 | ||||||||
| K.EPVSDWTDDVEAR.I | 3.60E-04 | ||||||||
| K.GVNLPGTDVDLPALSEK.D | 1.20E-02 | ||||||||
| K.IENQQGVNNFDEILK.V | 3.00E-03 | ||||||||
| K.KGDTYVSIQGFK.A | 3.60E-07 | ||||||||
| K.NGVHMVFASFIR.T + Deamidated (NQ); Oxidation (M) | 4.00E-02 | ||||||||
| K.PTSTTETVAASAVAAVFEQK.A | 4.10E-04 | ||||||||
| K.SEELYPGRPLAIALDTK.G | 2.60E-02 | ||||||||
| K.SNLAGKPVICATQMLESMTYNPR.P + 2 Oxidation (M); Propionamide (C) | 2.10E-05 | ||||||||
| K.TNNPETLVALR.K | 2.10E-03 | ||||||||
| R.AEVSDVGNAILDGADCVMLSGETAK.G + Oxidation (M); Propionamide (C) | 3.20E-04 | ||||||||
| R.EVLGEQGKDVK.I | 4.50E-02 | ||||||||
| R.KSEELYPGRPLAIALDTK.G | 2.70E-04 | ||||||||
| R.LTSLNVVAGSDLR.R | 4.40E-04 | ||||||||
| R.NCTPKPTSTTETVAASAVAAVFEQK.A + Propionamide (C) | 5.50E-03 | ||||||||
4. Discussion
4.1. Yeast as a Tool for Systems Biology Analyses of Drug Actions
4.2. The Yeast Response to 56MESS
5. Conclusions
Supplementary Materials
Supplementary File 1Abbreviations
| 56MESS | [(5,6-dimethyl-1,10-phenanthroline)(1S,2S-diaminocyclohexane)platinum(II)]2+ |
| AFD | automated frozen disruption |
| Camp | cyclic adenosine monophosphate |
| CHAPS | 3-[(3-cholamidopropyl)dimethylammonio]-2-hydroxy-1-propanesulfonate |
| DTT | dithiothreitol |
| IEF | isoelectric focusing |
| IPG | immobilised pH gradient |
| MW | molecular weight |
| PM | perfect match |
| RT | room temperature |
| SDS PAGE | sodium dodecyl sulphate polyacrylamide gel electrophoresis |
| SGD | Saccharomyces Genome Database |
| SNARE | Soluble N-ethylmaleimide sensitive fusion protein Attachment Protein Receptor |
| SRXRF | synchrotron radiation X-ray fluorescence |
| YPD | Yeast Proteome Database |
Acknowledgements
Author Contributions
Conflicts of Interest
References
- Kostova, I. Platinum complexes as anticancer agents. Recent Pat. Anticancer Drug Discov. 2006, 1, 1–22. [Google Scholar] [CrossRef] [PubMed]
- Boulikas, T.; Vougiouka, M. Cisplatin and platinum drugs at the molecular level. Oncol. Rep. 2003, 10, 1663–1682. [Google Scholar] [PubMed]
- Reedijk, J. New clues for platinum antitumor chemistry: Kinetically controlled metal binding to DNA. Proc. Natl. Acad. Sci. USA 2003, 100, 3611–3616. [Google Scholar] [CrossRef] [PubMed]
- Reedijk, J. Improved understanding in platinum antitumour chemistry. Chem. Commun. 1996, 801–806. [Google Scholar] [CrossRef]
- Brabec, V.; Kasparkova, J. Molecular aspects of resistance to antitumor platinum drugs. Drug Resist. Updates 2002, 5, 147–161. [Google Scholar] [CrossRef]
- Wang, D.; Lippard, S.J. Cellular processing of platinum anticancer drugs. Nat. Rev. Drug Discov. 2005, 4, 307–320. [Google Scholar] [CrossRef] [PubMed]
- Wong, E.; Giandomenico, C.M. Current status of platinum-based antitumor drugs. Chem. Rev. 1999, 99, 2451–2466. [Google Scholar] [CrossRef] [PubMed]
- Johnson, J.R.; Williams, G.; Pazdur, R. End points and United States food and drug administration approval of oncology drugs. J. Clin. Oncol. 2003, 21, 1404–1411. [Google Scholar] [CrossRef] [PubMed]
- Kelland, L. The resurgence of platinum-based cancer chemotherapy. Nat. Rev. Cancer 2007, 7, 573–584. [Google Scholar] [CrossRef] [PubMed]
- Wishart, D.S.; Knox, C.; Guo, A.C.; Cheng, D.; Shrivastava, S.; Tzur, D.; Gautum, B.; Hassanali, M. DrugBank: A knowledgebase for drugs, drug actions and drug targets. Nucleic Acids Res. 2008, 36, D901–D906. [Google Scholar] [CrossRef]
- Butcher, E.C.; Berg, E.L.; Kunkel, E.J. Systems biology in drug discovery. Nat. Biotech. 2004, 22, 1253–1259. [Google Scholar] [CrossRef]
- Cox, J.; Mann, M. Quantitative, high-resolution proteomics for data-driven systems biology. Annu. Rev. Biochem. 2011, 80, 273–299. [Google Scholar] [CrossRef] [PubMed]
- Wheate, N.J.; Brodie, C.R.; Collins, J.G.; Kemp, S.; Aldrich-Wright, J.R. DNA intercalators in cancer therapy: Organic and inorganic drugs and their spectroscopic tools of analysis. Mini-Rev. Med. Chem. 2007, 7, 627–648. [Google Scholar] [CrossRef] [PubMed]
- Wan, K.X.; Shibue, T.; Gross, M.L. Non-covalent complexes between DNA-binding drugs and double-stranded oligodeoxynucleotides: A study by ESI ion-trap mass spectrometry. J. Am. Chem. Soc. 2000, 122, 300–307. [Google Scholar] [CrossRef]
- Cusumano, M.; Di Pietro, M.L.; Giannetto, A.; Vainiglia, P.A. The intercalation to DNA of bipyridyl complexes of platinum(II) with thioureas. J. Inorg. Biochem. 2005, 99, 560–565. [Google Scholar] [CrossRef] [PubMed]
- Tse, W.C.; Boger, D.L. Sequence-selective DNA recognition: Natural products and nature’s lessons. Chem. Biol. 2004, 11, 1607–1617. [Google Scholar] [CrossRef] [PubMed]
- Wheate, N.J.; Taleb, R.I.; Krause-Heuer, A.M.; Cook, R.L.; Wang, S.; Higgins, V.J.; Aldrich-Wright, J.R. Novel platinum(II)-based anticancer complexes and molecular hosts as their drug delivery vehicles. Dalton Trans. 2007, 43, 5055–5064. [Google Scholar] [CrossRef] [PubMed]
- Garbutcheon-Singh, K.B.; Leverett, P.; Myers, S.; Aldrich-Wright, J.R. Cytotoxic platinum(II) intercalators that incorporate 1R,2R-diaminocyclopentane. Dalton Trans. 2013, 42, 918–926. [Google Scholar] [CrossRef] [PubMed]
- Fisher, D.M.; Bednarski, P.J.; Grünert, R.; Turner, P.; Fenton, R.R.; Aldrich-Wright, J.R. Chiral platinum(II) metallointercalators with potent in vitro cytotoxic activity. ChemMedChem 2007, 2, 488–495. [Google Scholar] [CrossRef] [PubMed]
- Davis, K.J.; Carrall, J.A.; Lai, B.; Aldrich-Wright, J.R.; Ralph, S.F.; Dillon, C.T. Does cytotoxicity of metallointercalators correlate with cellular uptake or DNA affinity? Dalton Trans. 2012, 41, 9417–9426. [Google Scholar] [CrossRef] [PubMed]
- Wang, S.; Higgins, V.; Aldrich-Wright, J.; Wu, M. Identification of the molecular mechanisms underlying the cytotoxic action of a potent platinum metallointercalator. J. Chem. Biol. 2012, 5, 51–61. [Google Scholar] [CrossRef] [PubMed]
- Lin, X.; Okuda, T.; Holzer, A.; Howell, S.B. The copper transporter CTR1 regulates cisplatin uptake in Saccharomyces cerevisiae. Mol. Pharmacol. 2002, 62, 1154–1159. [Google Scholar] [CrossRef] [PubMed]
- Ishida, S.; Lee, J.; Thiele, D.J.; Herskowitz, I. Uptake of the anticancer drug cisplatin mediated by the copper transporter Ctr1 in yeast and mammals. Proc. Natl. Acad. Sci. USA 2002, 99, 14298–14302. [Google Scholar] [CrossRef] [PubMed]
- Sadler, W.R.; Trudinger, P.A. The inhibition of microorganisms by heavy metals. Mineral. Deposita 1967, 2, 158–168. [Google Scholar] [CrossRef]
- Bleackley, M.; MacGillivray, R.A. Transition metal homeostasis: From yeast to human disease. Biometals 2011, 24, 785–809. [Google Scholar] [CrossRef] [PubMed]
- Delneri, D. The use of yeast mutant collections in genome profiling and large-scale functional analysis. Curr. Genomics 2004, 5, 59–65. [Google Scholar] [CrossRef]
- Parsons, A.B.; Geyer, R.; Hughes, T.R.; Boone, C. Yeast genomics and proteomics in drug discovery and target validation. Prog. Cell Cycle Res. 2003, 5, 159–166. [Google Scholar] [PubMed]
- Kurtz, J.E.; Dufour, P.; Bergerat, J.P.; Exinger, F. Saccharomyces cerevisiae as a genetic model in anticancer therapy. Curr. Pharmocogenetics 2005, 3, 1–7. [Google Scholar] [CrossRef]
- European Saccharomyces cerevisiae Archive for Functional Analysis. Available online: http://www.uni-frankfurt.de/fb15/mikro/euroscarf/index.html (accessed on 20 December 2008).
- Wu, H.I.; Brown, J.A.; Dorie, M.J.; Lazzeroni, L.; Brown, J.M. Genome-wide identification of genes conferring resistance to the anticancer agents cisplatin, oxaliplatin, and mitomycin C. Cancer Res. 2004, 64, 3940–3948. [Google Scholar] [CrossRef] [PubMed]
- Higgins, V.J.; Alic, N.; Thorpe, G.W.; Breitenbach, M.; Larsson, V.; Dawes, I.W. Phenotypic analysis of gene deletant strains for sensitivity to oxidative stress. Yeast 2002, 19, 203–214. [Google Scholar] [CrossRef] [PubMed]
- Winzeler, E.A.; Shoemaker, D.D.; Astromoff, A.; Liang, H.; Anderson, K.; Andre, B.; Bangham, R.; Benito, R.; Boeke, J.D.; Bussey, H.; et al. Functional characterization of the S.cerevisiae genome by gene deletion and parallel analysis. Science 1999, 285, 901–906. [Google Scholar]
- Burke, D.; Dawson, D.; Stearns, T. Methods in Yeast Genetics, 2000 ed.; Cold Spring Harbor Laboratory Press: Long Island, NY, USA, 2000; pp. 109–114. [Google Scholar]
- Shoemaker, D.D.; Lashkari, D.A.; Morris, D.; Mittmann, M.; Davis, R.W. Quantitative phenotypic analysis of yeast deletion mutants using a highly parallel molecular bar-coding strategy. Nature Genet. 1996, 14, 450–456. [Google Scholar] [CrossRef] [PubMed]
- Butt, R.H.; Coorssen, J.R. Pre-extraction sample handling by automated frozen disruption significantly improves subsequent proteomic analyses. J. Proteome Res. 2006, 5, 437–448. [Google Scholar] [CrossRef] [PubMed]
- Butt, R.H.; Pfeifer, T.A.; Delaney, A.; Grigliatti, T.A.; Tetzlaff, W.G.; Coorssen, J.R. Enabling coupled quantitative genomics and proteomics analyses from rat spinal cord samples. Mol. Cell. Proteomics 2007, 6, 1574–1588. [Google Scholar] [CrossRef] [PubMed]
- Churchward, M.; Butt, R.H.; Lang, J.; Hsu, K.; Coorssen, J. Enhanced detergent extraction for analysis of membrane proteomes by two-dimensional gel electrophoresis. Proteome Sci. 2005, 3, e5. [Google Scholar] [CrossRef] [PubMed] [Green Version]
- Laemmli, U.K. Cleavage of structural proteins during the assembly of the head of bacteriophage T4. Nature 1970, 227, 680–685. [Google Scholar] [CrossRef] [PubMed]
- Cannon-Carlson, S.; Tang, J. Modification of the laemmli sodium dodecyl sulfate-polyacrylamide gel electrophoresis procedure to eliminate artifacts on reducing and nonreducing gels. Anal. Biochem. 1997, 246, 146–148. [Google Scholar] [CrossRef] [PubMed]
- Coorssen, J.R.; Blank, P.S.; Albertorio, F.; Bezrukov, L.; Kolosova, I.; Backlund, P.S.; Zimmerberg, J. Quantitative femto- to attomole immunodetection of regulated secretory vesicle proteins critical to exocytosis. Anal. Biochem. 2002, 307, 54–62. [Google Scholar] [CrossRef] [PubMed]
- Gauci, V.J.; Padula, M.P.; Coorssen, J.R. Coomassie Blue staining for high sensitivity gel-based proteomics. J. Proteomics 2013, 90, 96–106. [Google Scholar] [CrossRef] [PubMed]
- Judd, R. SDS-Polyacrylamide Gel Electrophoresis of Peptides. In The Protein Protocols Handbook, 2nd ed.; Walker, J.M., Ed.; Humana Press: Totowa, NJ, USA, 2002; Volume 2, pp. 73–79. [Google Scholar]
- Schägger, H.; von Jagow, G. Tricine-sodium dodecyl sulfate-polyacrylamide gel electrophoresis for the separation of proteins in the range from 1 to 100 kDa. Anal. Biochem. 1987, 166, 368–379. [Google Scholar] [CrossRef] [PubMed]
- Butt, R.H.; Coorssen, J.R. Coomassie Blue as a near-IR fluorescent stain: A systematic comparison with Sypro Ruby for in-gel protein detection. Mol. Cell. Proteomics 2013, 12, 3834–3850. [Google Scholar] [CrossRef] [PubMed]
- Wright, E.P.; Partridge, M.A.; Padula, M.P.; Gauci, V.J.; Malladi, C.S.; Coorssen, J.R. Top-down proteomics: Enhancing 2D gel-electrophoresis from tissue processing to high sensitivity protein detection. Proteomics 2014, 14, 872–889. [Google Scholar] [CrossRef] [PubMed]
- Butt, R.H.; Coorssen, J.R. Postfractionation for enhanced proteomic analyses: Routine electrophoretic methods increase the resolution of standard 2D-PAGE. J. Proteome Res. 2005, 4, 982–991. [Google Scholar] [CrossRef] [PubMed]
- Butt, R.H.; Lee, M.W.Y.; Pirshahid, S.A.; Backlund, P.S.; Wood, S.; Coorssen, J.R. An initial proteomic analysis of human preterm labor: Placental membranes. J. Proteome Res. 2006, 5, 3161–3172. [Google Scholar] [CrossRef] [PubMed]
- Harris, L.R.; Churchward, M.A.; Butt, R.H.; Coorssen, J.R. Assessing detection methods for gel-based proteomic analyses. J. Proteome Res. 2007, 6, 1418–1425. [Google Scholar] [CrossRef] [PubMed]
- Wright, E.P.; Prasad, K.A.G.; Padula, M.P.; Coorssen, J.R. Deep imaging: How much of the proteome does current top-down technology already resolve? PLoS One 2014, 9, e86058. [Google Scholar] [CrossRef]
- Perkins, D.N.; Pappin, D.J.C.; Creasy, D.M.; Cottrell, J.S. Probability-based protein identification by searching sequence databases using mass spectrometry data. Electrophoresis 1999, 20, 3551–3567. [Google Scholar] [CrossRef] [PubMed]
- Hodges, P.E.; McKee, A.H.Z.; Davis, B.P.; Payne, W.E.; Garrels, J.I. The Yeast Proteome Database (YPD): A model for the organization and presentation of genome-wide functional data. Nucleic Acids Res. 1999, 27, 69–73. [Google Scholar] [CrossRef] [PubMed]
- Cherry, J.M.; Hong, E.L.; Amundsen, C.; Balakrishnan, R.; Binkley, G.; Chan, E.T.; Christie, K.R.; Costanzo, M.C.; Dwight, S.S.; Engel, S.R.; et al. Saccharomyces Genome Database: The genomics resource of budding yeast. Nucleic Acids Res. 2012, 40, D700–D705. [Google Scholar] [CrossRef]
- Menacho-Márquez, M.; Murguía, J. Yeast on drugs: Saccharomyces cerevisiae as a tool for anticancer drug research. Clin. Transl. Oncol. 2007, 9, 221–228. [Google Scholar] [CrossRef] [PubMed]
- Foury, F. Human genetic diseases: A cross-talk between man and yeast. Gene 1997, 195, 1–10. [Google Scholar] [CrossRef] [PubMed]
- Carmichael, J. Current issues in cancer: Cancer chemotherapy: Identifying novel anticancer drugs. Br. Med. J. 1994, 308, 1288–1290. [Google Scholar] [CrossRef]
- Goffeau, A.; Barrell, B.G.; Bussey, H.; Davis, R.W.; Dujon, B.; Feldmann, H.; Galibert, F.; Hoheisel, J.D.; Jacq, C.; Johnston, M.; et al. Life with 6000 genes. Science 1996, 274, 546–567. [Google Scholar] [CrossRef] [PubMed]
- Pierce, S.E.; Fung, E.L.; Jaramillo, D.F.; Chu, A.M.; Davis, R.W.; Nislow, C.; Giaever, G. A unique and universal molecular barcode array. Nat. Meth. 2006, 3, 601–603. [Google Scholar] [CrossRef]
- Masson, J.; Ramotar, D. The Saccharomyces cerevisiae IMP2 gene encodes a transcriptional activator that mediates protection against DNA damage caused by bleomycin and other oxidants. Mol. Cell. Biol. 1996, 16, 2091–2100. [Google Scholar] [PubMed]
- Mulet, J.M.; Leube, M.P.; Kron, S.J.; Rios, G.; Fink, G.R.; Serrano, R. A novel mechanism of ion homeostasis and salt tolerance in yeast: The Hal4 and Hal5 protein kinases modulate the Trk1-Trk2 potassium transporter. Mol. Cell. Biol. 1999, 19, 3328–3337. [Google Scholar] [PubMed]
- Wendland, B.; Emr, S.D.; Riezman, H. Protein traffic in the yeast endocytic and vacuolar protein sorting pathways. Curr. Opin. Cell Biol. 1998, 10, 513–522. [Google Scholar] [CrossRef] [PubMed]
- Thorpe, G.W.; Fong, C.S.; Alic, N.; Higgins, V.J.; Dawes, I.W. Cells have distinct mechanisms to maintain protection against different reactive oxygen species: Oxidative-stress-response genes. Proc. Natl. Acad. Sci. USA 2004, 101, 6564–6569. [Google Scholar] [CrossRef] [PubMed]
- Ungermann, C.; Wickner, W. Vam7p, a vacuolar SNAP-25 homolog, is required for SNARE complex integrity and vacuole docking and fusion. EMBO J. 1998, 17, 3269–3276. [Google Scholar] [CrossRef] [PubMed]
- Nakamura, N.; Hirata, A.; Ohsumi, Y.; Wada, Y. Vam2/Vps41p and Vam6/Vps39p are components of a protein complex on the vacuolar membranes and involved in the vacuolar assembly in the yeast Saccharomyces cerevisiae. J. Biol. Chem. 1997, 272, 11344–11349. [Google Scholar] [CrossRef] [PubMed]
- Uttenweiler, A.; Schwarz, H.; Neumann, H.; Mayer, A. The Vacuolar Transporter Chaperone (VTC) complex is required for microautophagy. Mol. Biol. Cell 2007, 18, 166–175. [Google Scholar] [CrossRef] [PubMed]
- Seaman, M.N.J.; Marcusson, E.G.; Cereghino, J.L.; Emr, S.D. Endosome to golgi retrieval of the vacuolar protein sorting receptor, Vps10p, requires the function of the VPS29, VPS30, and VPS35 gene products. J. Cell Biol. 1997, 137, 79–92. [Google Scholar] [CrossRef] [PubMed]
- Kruse, K.B.; Brodsky, J.L.; McCracken, A.A. Characterization of an ERAD Gene as VPS30/ATG6 reveals two alternative and functionally distinct protein quality control pathways: One for soluble Z variant of human a-1 proteinase inhibitor (A1PiZ) and another for aggregates of A1PiZ. Mol. Biol. Cell 2006, 17, 203–212. [Google Scholar] [CrossRef] [PubMed]
- Teter, S.A.; Eggerton, K.P.; Scott, S.V.; Kim, J.; Fischer, A.M.; Klionsky, D.J. Degradation of lipid vesicles in the yeast vacuole requires function of Cvt17, a putative lipase. J. Biol. Chem. 2001, 276, 2083–2087. [Google Scholar] [CrossRef] [PubMed]
- Bugnicourt, A.; Froissard, M.; Sereti, K.; Ulrich, H.D.; Haguenauer-Tsapis, R.; Galan, J.-M. Antagonistic roles of ESCRT and Vps Class C/HOPS complexes in the recycling of yeast membrane proteins. Mol. Biol. Cell 2004, 15, 4203–4214. [Google Scholar] [CrossRef] [PubMed]
- Bilodeau, P.S.; Winistorfer, S.C.; Kearney, W.R.; Robertson, A.D.; Piper, R.C. Vps27-Hse1 and ESCRT-I complexes cooperate to increase efficiency of sorting ubiquitinated proteins at the endosome. J. Cell Biol. 2003, 163, 237–243. [Google Scholar] [CrossRef] [PubMed]
- Huang, R.; Eddy, M.; Vujcic, M.; Kowalski, D. Genome-wide screen identifies genes whose inactivation confer resistance to cisplatin in Saccharomyces cerevisiae. Cancer Res. 2005, 65, 5890–5897. [Google Scholar] [CrossRef] [PubMed]
- Brana, M.F.; Cacho, M.; Gradillas, A.; de Pascual-Teresa, B.; Ramos, A. Intercalators as anticancer drugs. Curr. Pharm. Drugs 2001, 7, 1745–1780. [Google Scholar] [CrossRef]
- Gasch, A.P. The environmental stress response: A common yeast response to diverse environmental stresses. In Yeast Stress Responses; Hohmann, S., Mager, W., Eds.; Springer: Berlin Heidelberg, Germany, 2003; Volume 1, pp. 11–70. [Google Scholar]
- Pelicano, H.; Martin, D.S.; Xu, R.H.; Huang, P. Glycolysis inhibition for anticancer treatment. Oncogene 2006, 25, 4633–4646. [Google Scholar] [CrossRef] [PubMed]
- Shaw, R.J. Glucose metabolism and cancer. Curr. Opin. Cell Biol. 2006, 18, 598–608. [Google Scholar] [CrossRef] [PubMed]
- Möller, A.; Soldan, M.; Völker, U.; Maser, E. Two-dimensional gel electrophoresis: A powerful method to elucidate cellular responses to toxic compounds. Toxicology 2001, 160, 129–138. [Google Scholar] [CrossRef] [PubMed]
- Brown, S.J.; Kellett, P.J.; Lippard, S.J. Ixr1, a yeast protein that binds to platinated DNA and confers sensitivity to cisplatin. Science 1993, 261, 603–605. [Google Scholar] [CrossRef] [PubMed]
- McA'Nulty, M.M.; Whitehead, J.P.; Lippard, S.J. Binding of Ixr1, a yeast HMG-domain protein, to cisplatin-DNA adducts in vitro and in vivo. Biochemistry 1996, 35, 6089–6099. [Google Scholar] [CrossRef] [PubMed]
- Furuchi, T.; Ishikawa, H.; Miura, N.; Ishizuka, M.; Kajiya, K.; Kuge, S.; Naganuma, A. Two nuclear proteins, Cin5 and Ydr259c, confer resistance to cisplatin in Saccharomyces cerevisiae. Mol. Pharmacol. 2001, 59, 470–474. [Google Scholar] [PubMed]
- Hastie, C.J.; Vazquez-Martin, C.; Philp, A.; Stark, M.J.R.; Cohen, P.T.W. The Saccharomyces cerevisiae orthologue of the human protein phosphatase 4 core regulatory subunit R2 confers resistance to the anticancer drug cisplatin. FEBS J. 2006, 273, 3322–3334. [Google Scholar] [CrossRef] [PubMed]
- Kartalou, M.; Essigmann, J.M. Mechanisms of resistance to cisplatin. Mutat. Res.-Fund. Mol. Mech. Mutagen. 2001, 478, 23–43. [Google Scholar] [CrossRef]
- McA'Nulty, M.M.; Lippard, S.J. The HMG-domain protein Ixr1 blocks excision repair of cisplatin-DNA adducts in yeast. Mutat. Res.-DNA Repair 1996, 362, 75–86. [Google Scholar] [CrossRef] [PubMed]
- Cunha, D.; Cunha, R.; Côrte-Real, M.; Chaves, S.R. Cisplatin-induced cell death in Saccharomyces cerevisiae is programmed and rescued by proteasome inhibition. DNA Repair 2013, 12, 444–449. [Google Scholar] [CrossRef] [PubMed]
- Gatti, L.; Hoe, K.L.; Hayles, J.; Righetti, S.C.; Carenini, N.; Dal Bo, L.; Kim, D.U.; Park, H.O.; Perego, P. Ubiquitin-proteasome genes as targets for modulation of cisplatin sensitivity in fission yeast. BMC Genomics 2011, 12, e44. [Google Scholar] [CrossRef] [PubMed]
- Straetling, W.H.; Seidel, I. Relaxation of chromatin structure by ethidium bromide binding: Determined by viscometry and histone dissociation studies. Biochemistry 1976, 15, 4803–4809. [Google Scholar] [CrossRef] [PubMed]
- Zwelling, L.A.; Michaels, S.; Erickson, L.C.; Ungerleider, R.S.; Nichols, M.; Kohn, K.W. Protein-associated deoxyribonucleic acid strand breaks in L1210 cells treated with the deoxyribonucleic acid intercalating agents 4'-(9-acridinylamino)methanesulfon-m-anisidide and adriamycin. Biochemistry 1981, 20, 6553–6563. [Google Scholar] [CrossRef] [PubMed]
- Gaines, G.; Attardi, G. Intercalating drugs and low temperatures inhibit synthesis and processing of ribosomal RNA in isolated human mitochondria. J. Mol. Biol. 1984, 172, 451–466. [Google Scholar] [CrossRef] [PubMed]
- Tyleckova, J.; Hrabakova, R.; Mairychova, K.; Halada, P.; Radova, L.; Dzubak, P.; Hajduch, M.; Gadher, S.; Kovarova, H. Cancer cell response to anthracyclines effects: Mysteries of the hidden proteins associated with these drugs. Int. J. Mol. Sci. 2012, 13, 15536–15564. [Google Scholar] [CrossRef] [PubMed]
- Brown, K.J.; Fenselau, C. Investigation of doxorubicin resistance in MCF-7 breast cancer cells using shot-gun comparative proteomics with Proteolytic 18O labeling. J. Proteome Res. 2004, 3, 455–462. [Google Scholar] [CrossRef] [PubMed]
- Neto, B.; Lapis, A. Recent developments in the chemistry of deoxyribonucleic acid (DNA) intercalators: Principles, design, synthesis, applications and trends. Molecules 2009, 14, 1725–1746. [Google Scholar] [CrossRef] [PubMed]
- Ferguson, L.R.; Denny, W.A. Genotoxicity of non-covalent interactions: DNA intercalators. Mutat. Res.-Fund. Mol. Mech. Mutagen. 2007, 623, 14–23. [Google Scholar] [CrossRef]
- Takenaka, S.; Nishira, S.; Tahara, K.; Kondo, H.; Takagi, M. Synthesis and characterization of novel tris-intercalators having potentially two different DNA binding modes. Supramol. Chem. 1993, 2, 41–46. [Google Scholar] [CrossRef]
- Guelev, V.M.; Harting, M.T.; Lokey, R.S.; Iverson, B.L. Altered sequence specificity identified from a library of DNA-binding small molecules. Chem. Biol. 2000, 7, 1–8. [Google Scholar] [CrossRef] [PubMed]
- Wu, W.; Vanderwall, D.E.; Turner, C.J.; Hoehn, S.; Chen, J.; Kozarich, J.W.; Stubbe, J. Solution structure of the hydroperoxide of Co(III) phleomycin complexed with d(CCAGGCCTGG)2: Evidence for binding by partial intercalation. Nucleic Acids Res. 2002, 30, 4881–4891. [Google Scholar] [CrossRef] [PubMed]
© 2014 by the authors; licensee MDPI, Basel, Switzerland. This article is an open access article distributed under the terms and conditions of the Creative Commons Attribution license (http://creativecommons.org/licenses/by/4.0/).
Share and Cite
Wright, E.P.; Padula, M.P.; Higgins, V.J.; Aldrich-Wright, J.R.; Coorssen, J.R. A Systems Biology Approach to Understanding the Mechanisms of Action of an Alternative Anticancer Compound in Comparison to Cisplatin. Proteomes 2014, 2, 501-526. https://doi.org/10.3390/proteomes2040501
Wright EP, Padula MP, Higgins VJ, Aldrich-Wright JR, Coorssen JR. A Systems Biology Approach to Understanding the Mechanisms of Action of an Alternative Anticancer Compound in Comparison to Cisplatin. Proteomes. 2014; 2(4):501-526. https://doi.org/10.3390/proteomes2040501
Chicago/Turabian StyleWright, Elise P., Matthew P. Padula, Vincent J. Higgins, Janice R. Aldrich-Wright, and Jens R. Coorssen. 2014. "A Systems Biology Approach to Understanding the Mechanisms of Action of an Alternative Anticancer Compound in Comparison to Cisplatin" Proteomes 2, no. 4: 501-526. https://doi.org/10.3390/proteomes2040501