
Performance Comparison of Numerical Methods in a Predictive Controller for an AC–DC Power Converter

 ,
,  , , , and
Abstract
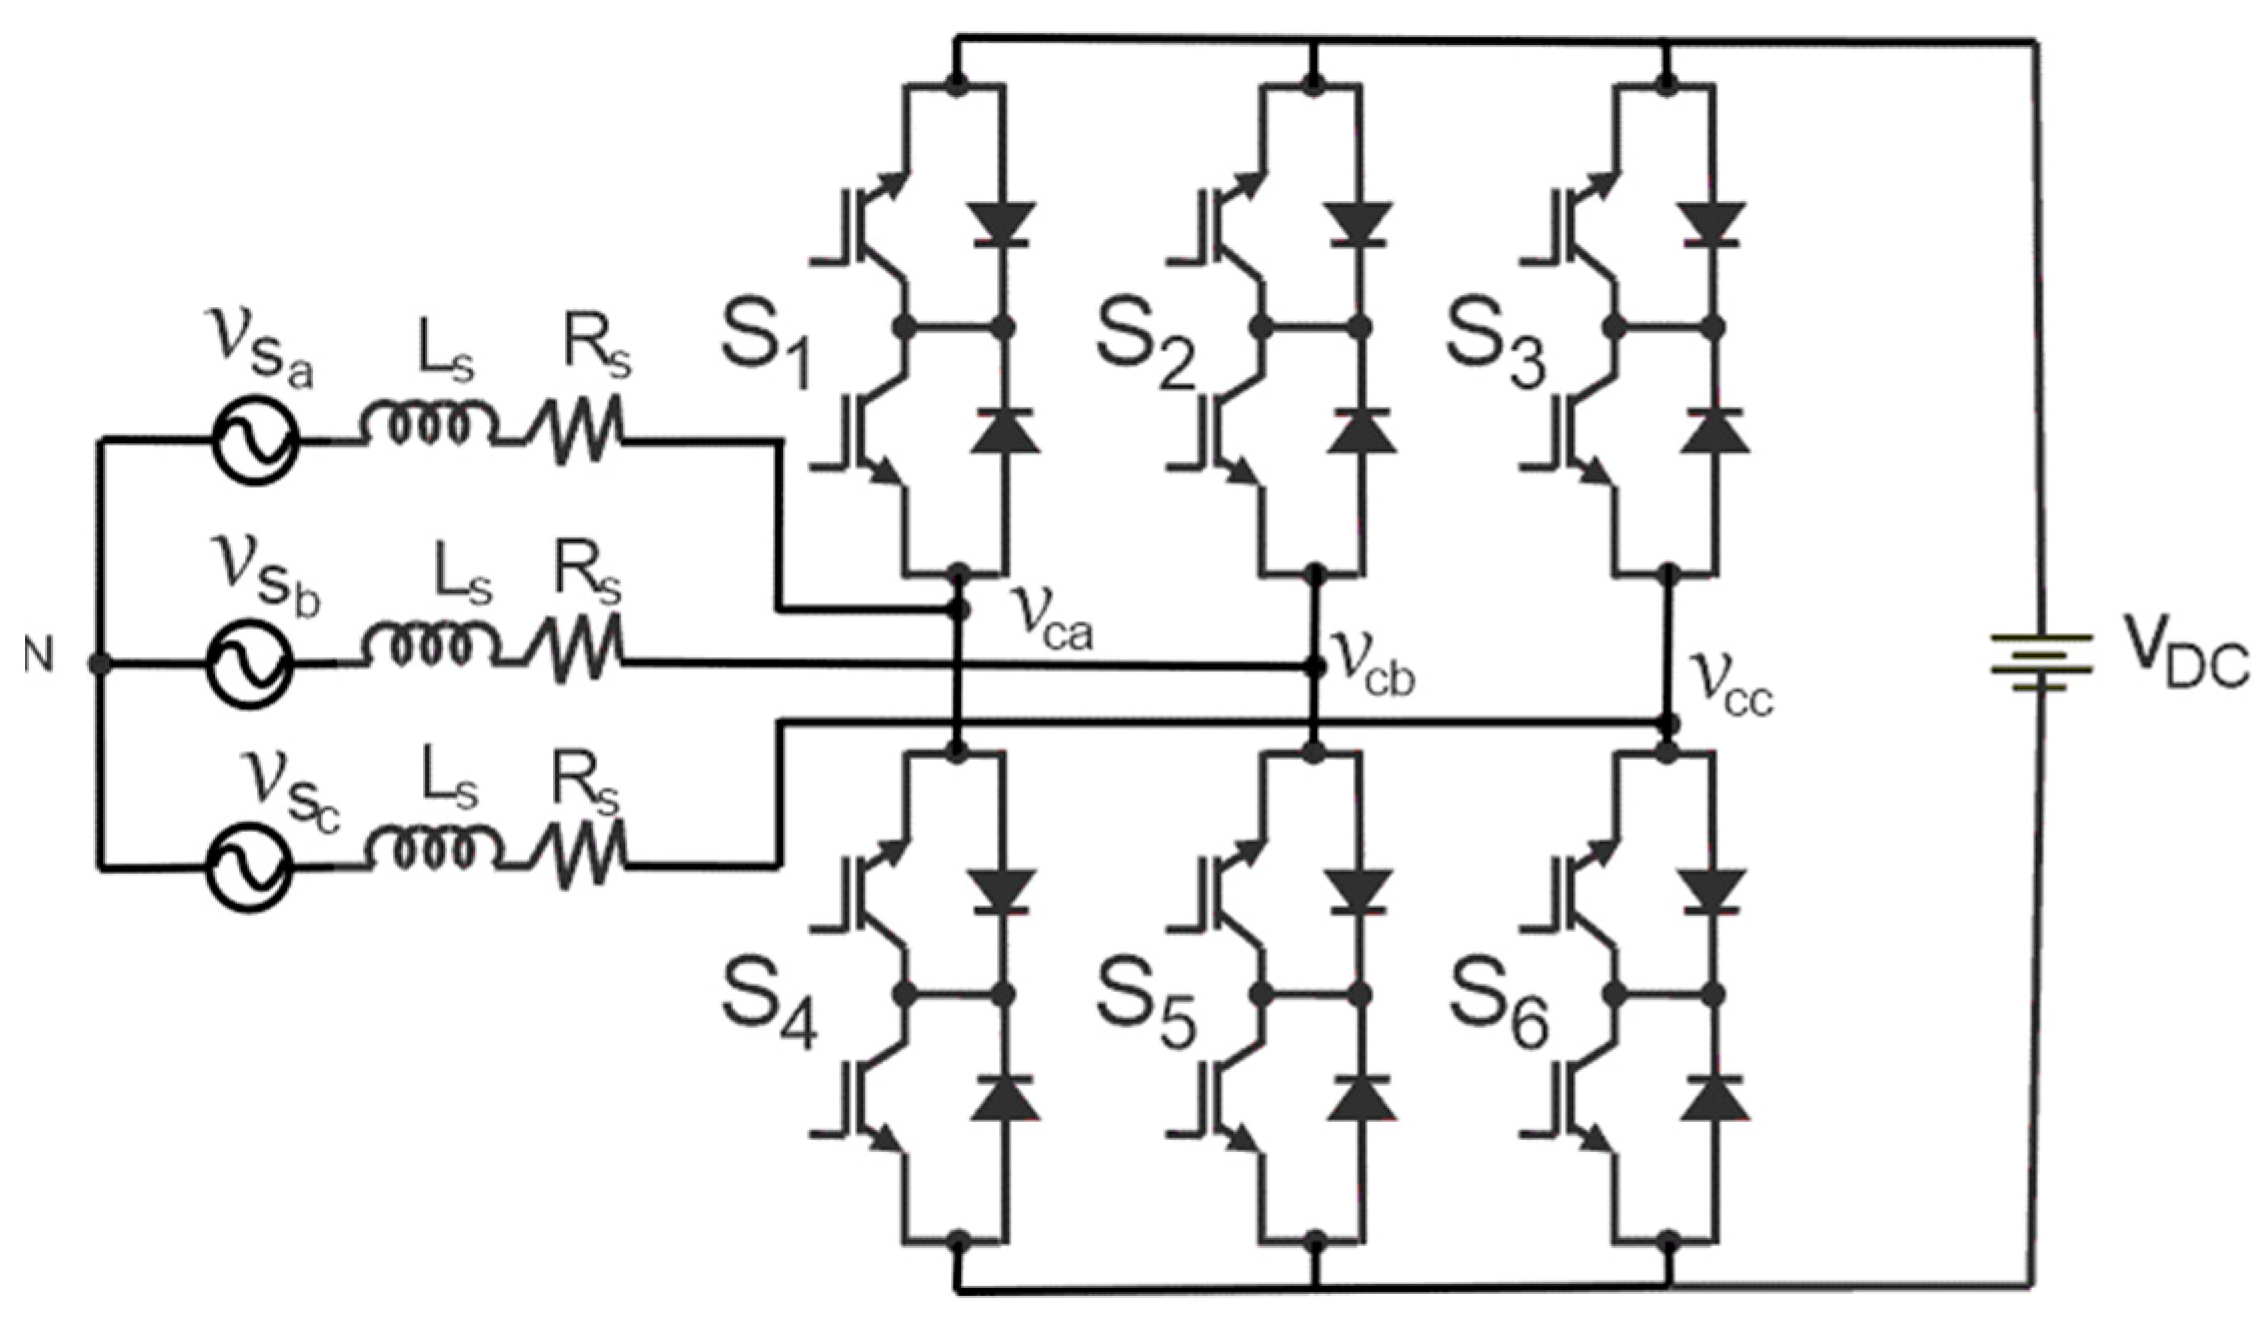
:1. Introduction
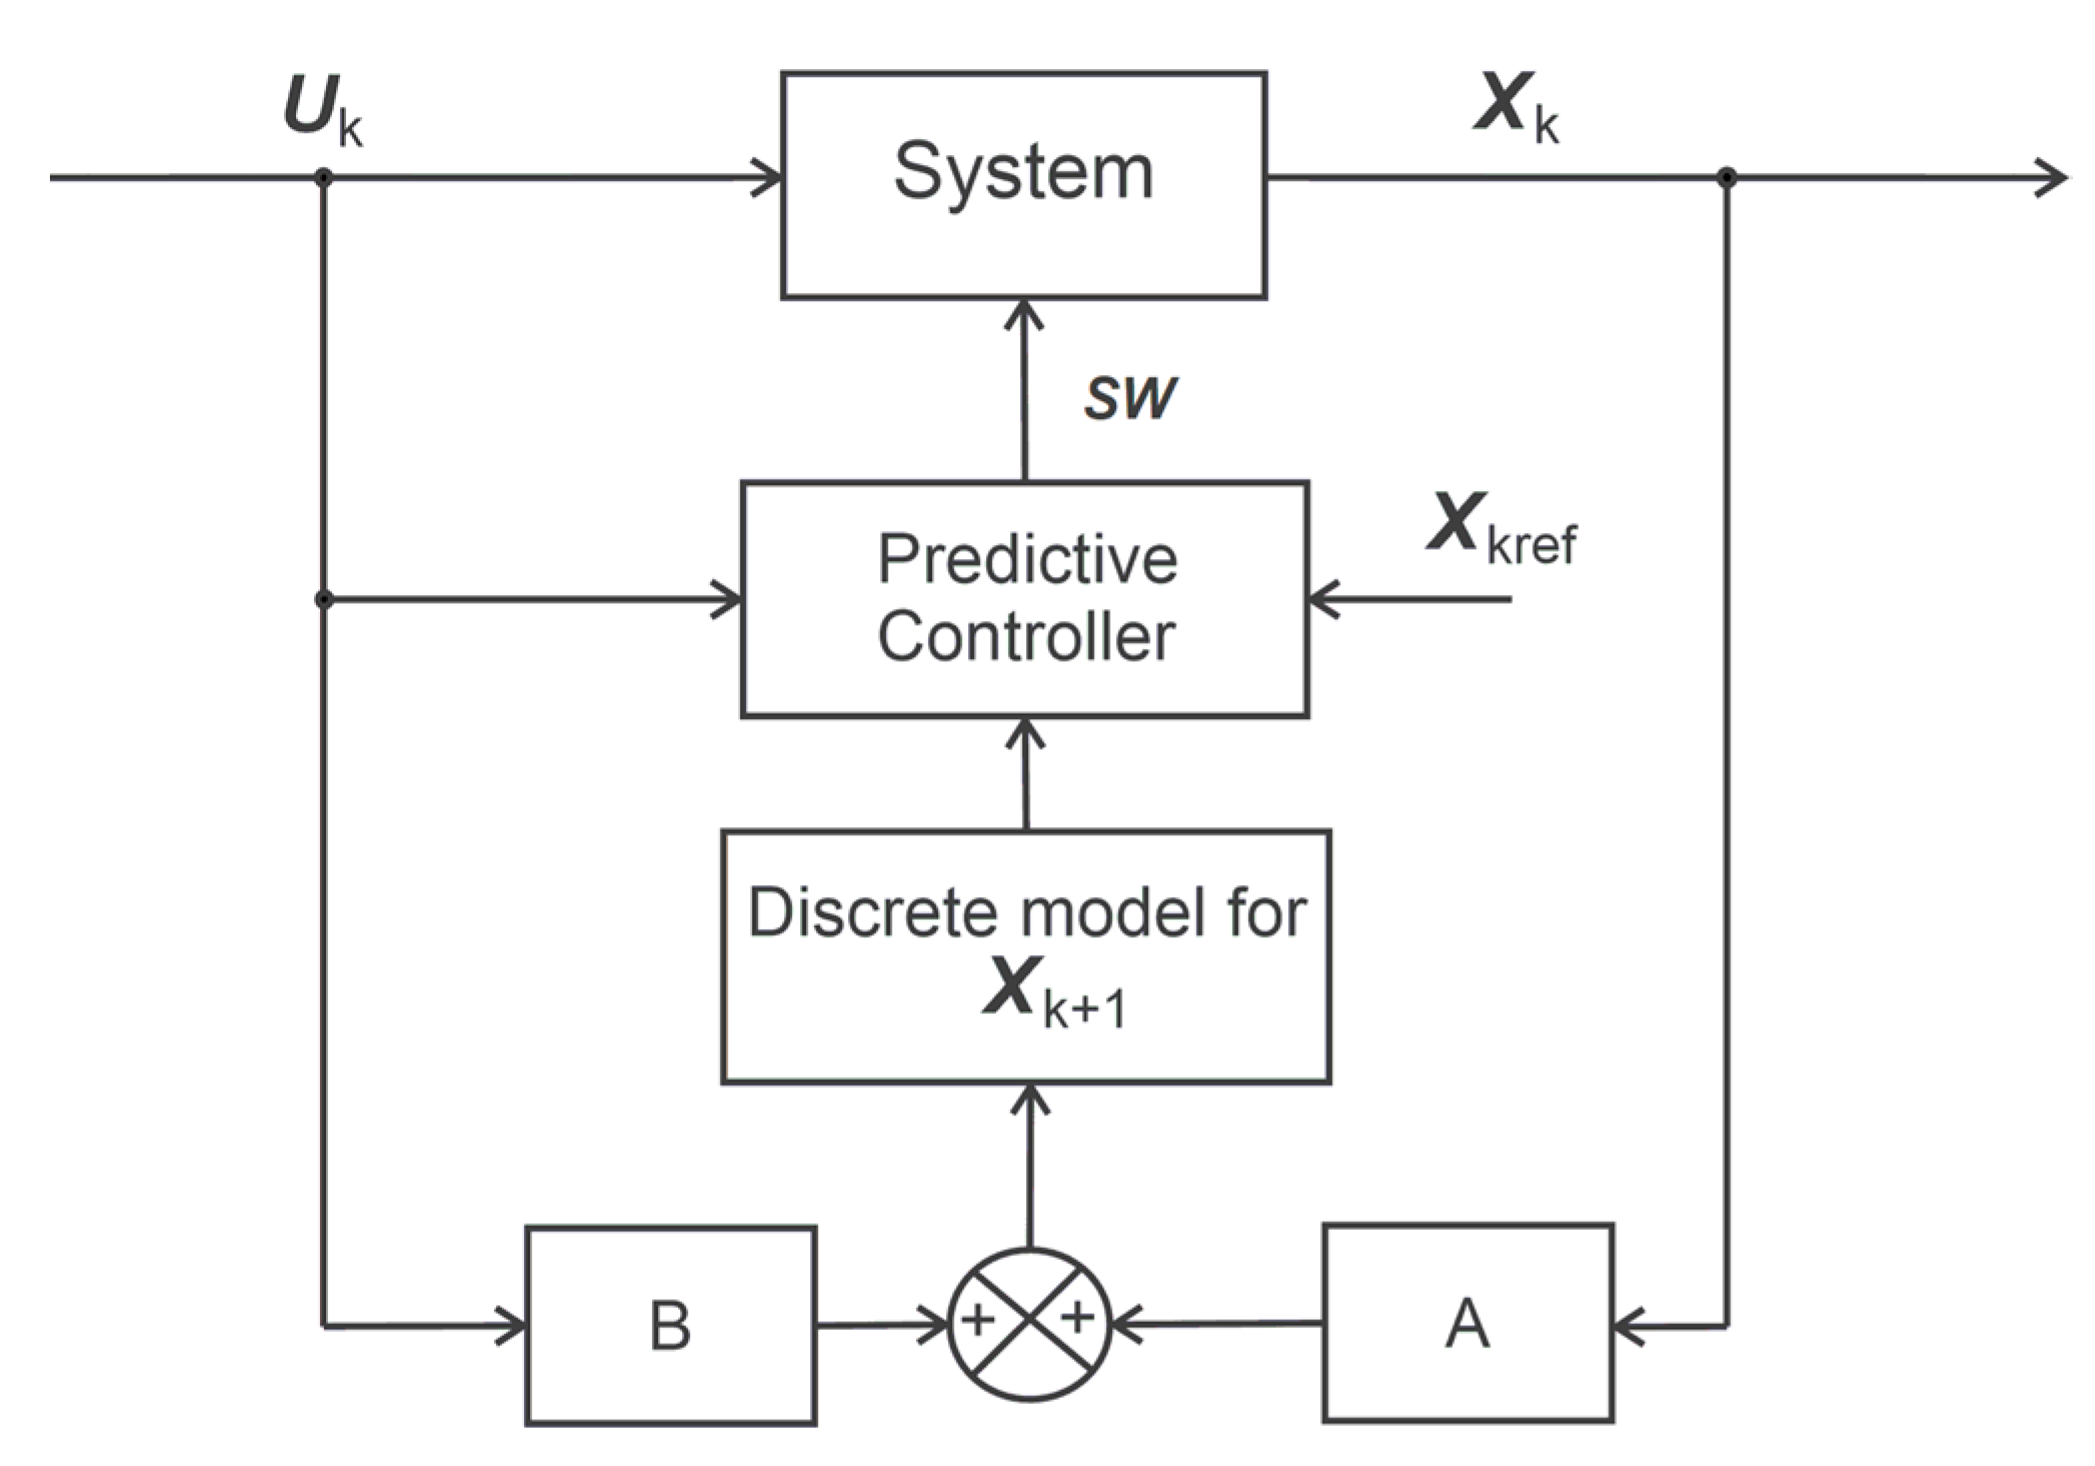
2. The Predictive Control Technique
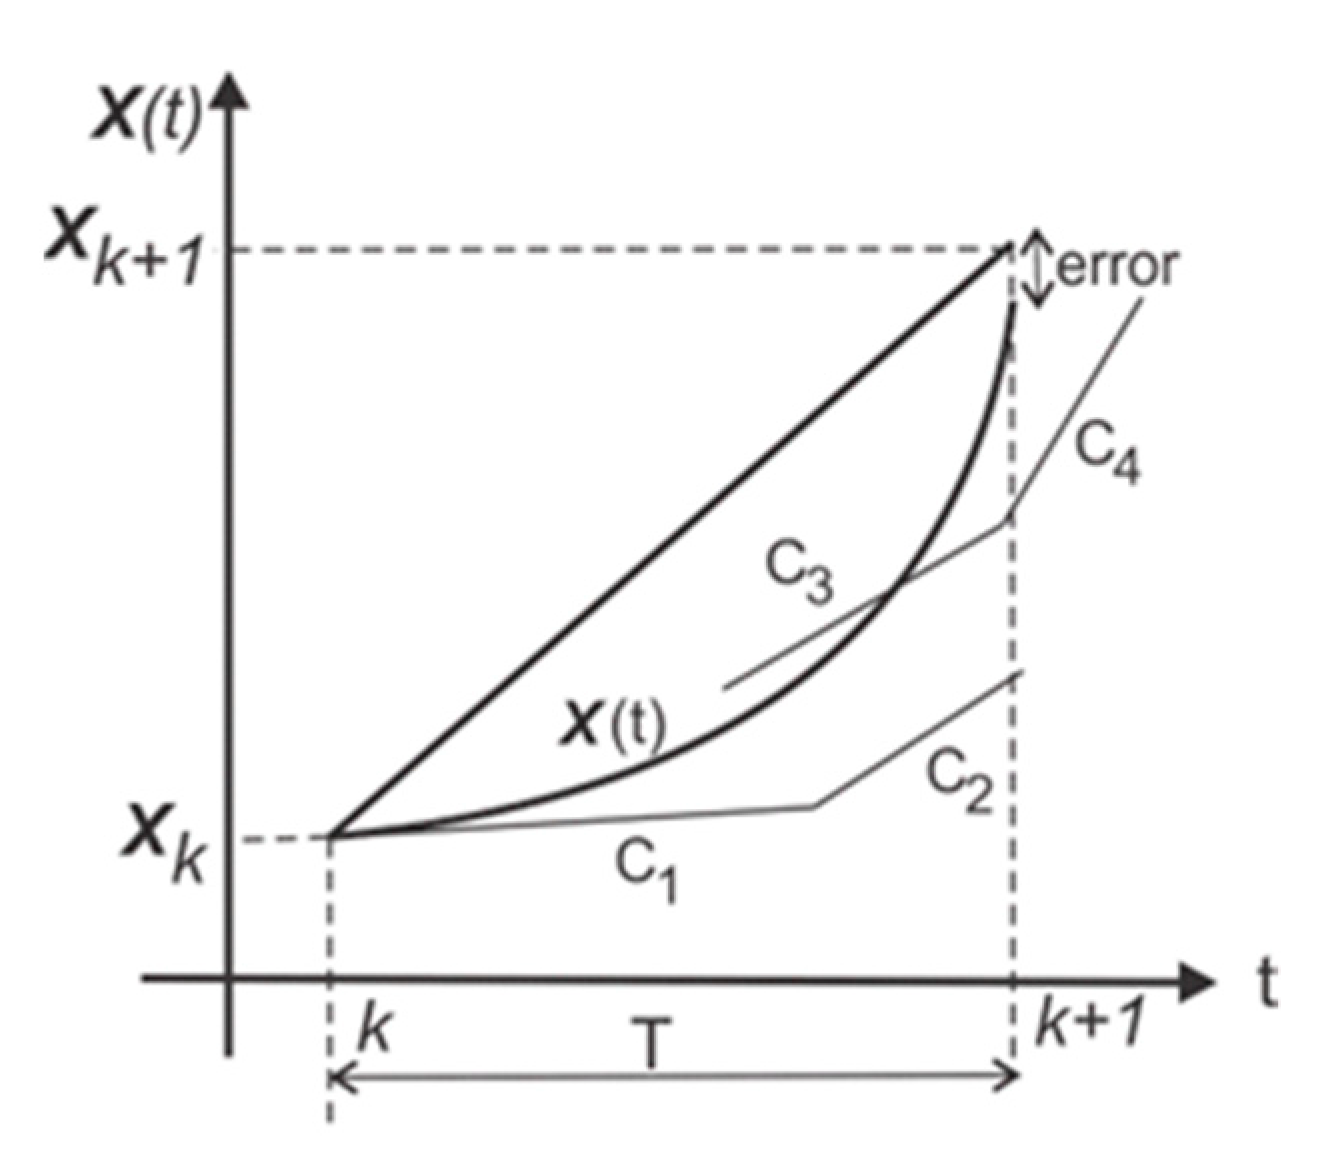
3. Numerical Solutions to Obtain Discrete Model
3.1. Forward Euler Method
3.2. Backward Euler Method
3.3. Runge–Kutta Method
3.4. Trapezoidal Method
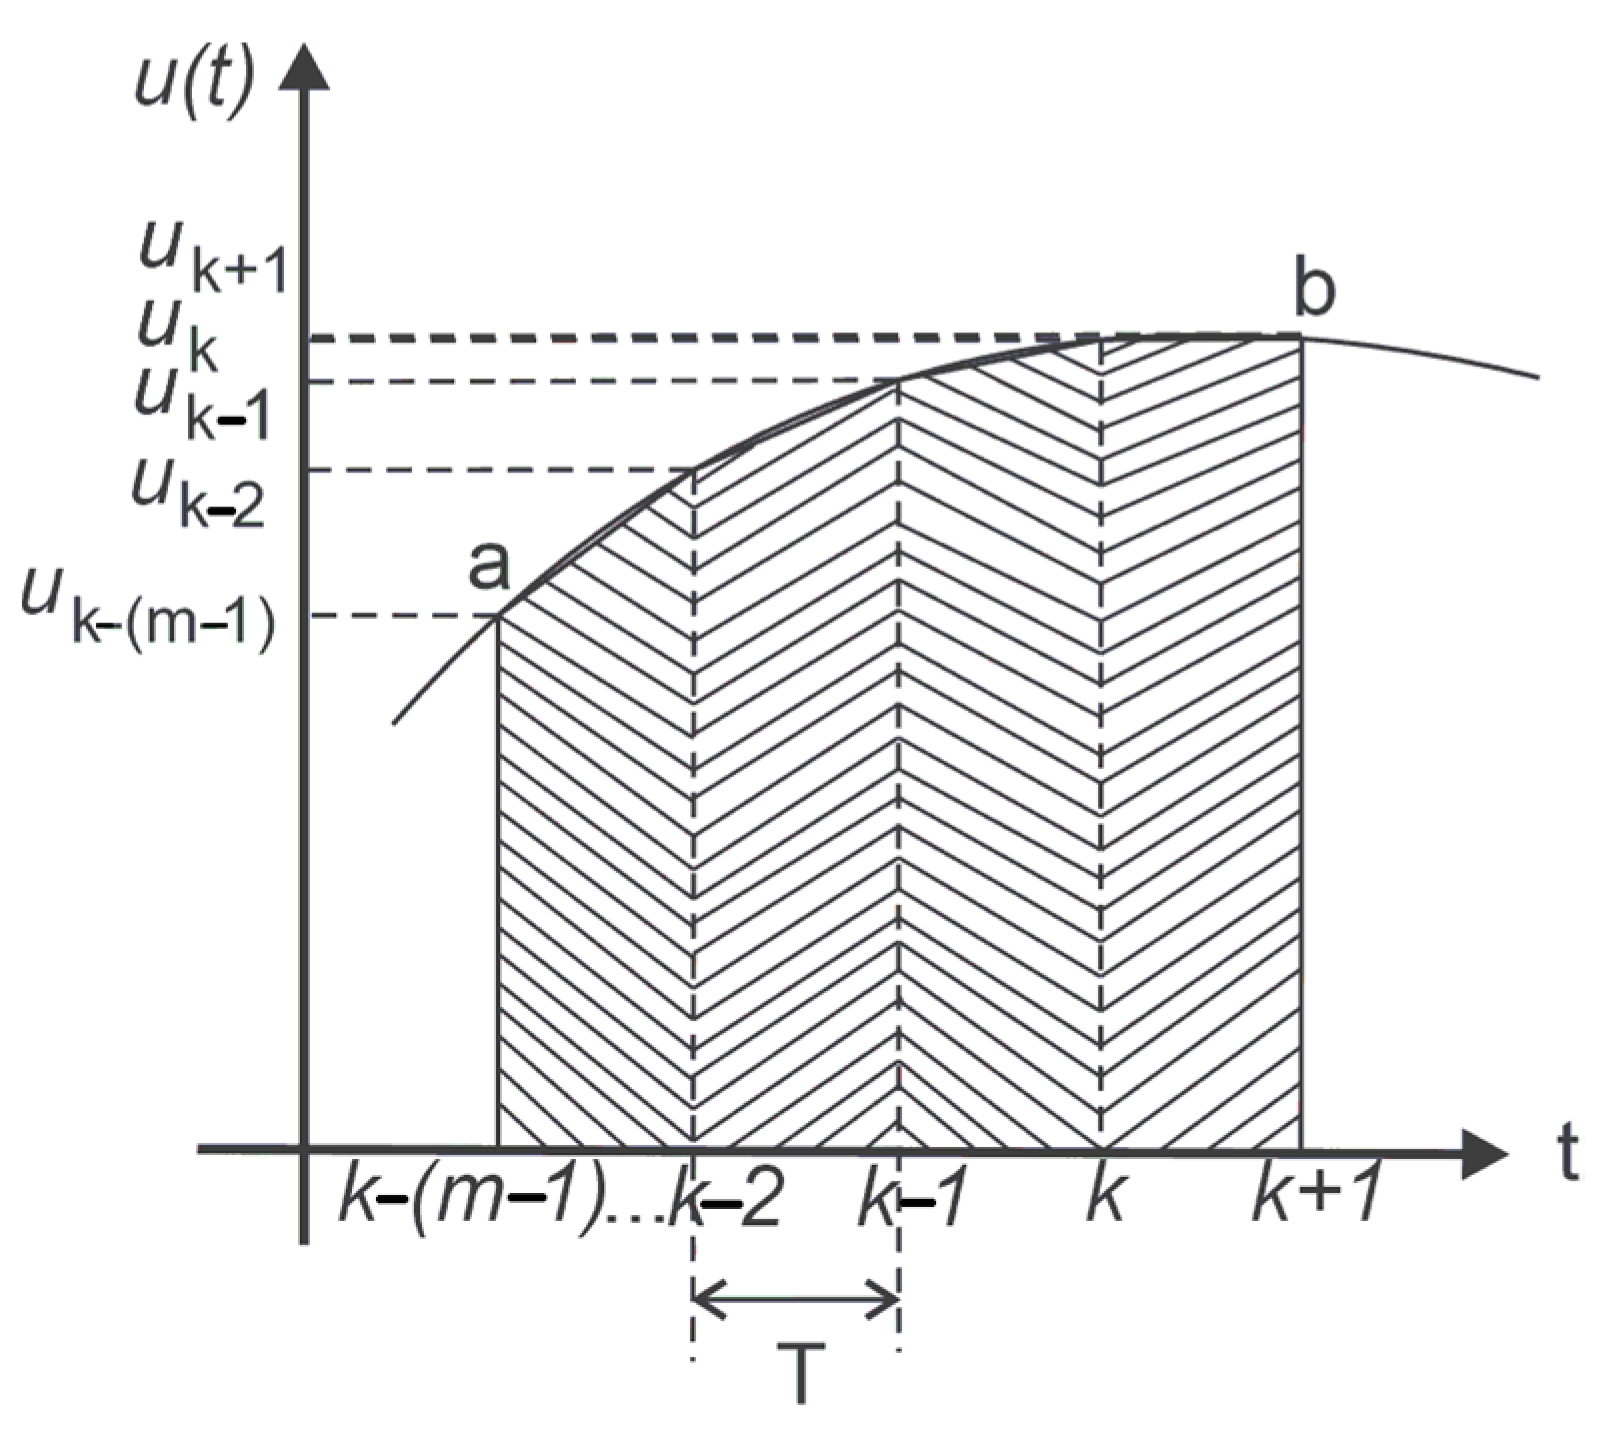
3.5. Compound Trapezoidal Method
4. Cost Function
5. Comparison of Discrete Models to Obtain One-Step-Ahead Input Current Vector
5.1. Prediction of the One-Step-Ahead Current Using Different Numerical Methods
- Forward Euler
- 2.
- Backward Euler
- 3.
- Runge–Kutta
- 4.
- Trapezoidal first order
- 5.
- Trapezoidal second order
- 6.
- Trapezoidal third order
5.2. Cost Function Evaluation
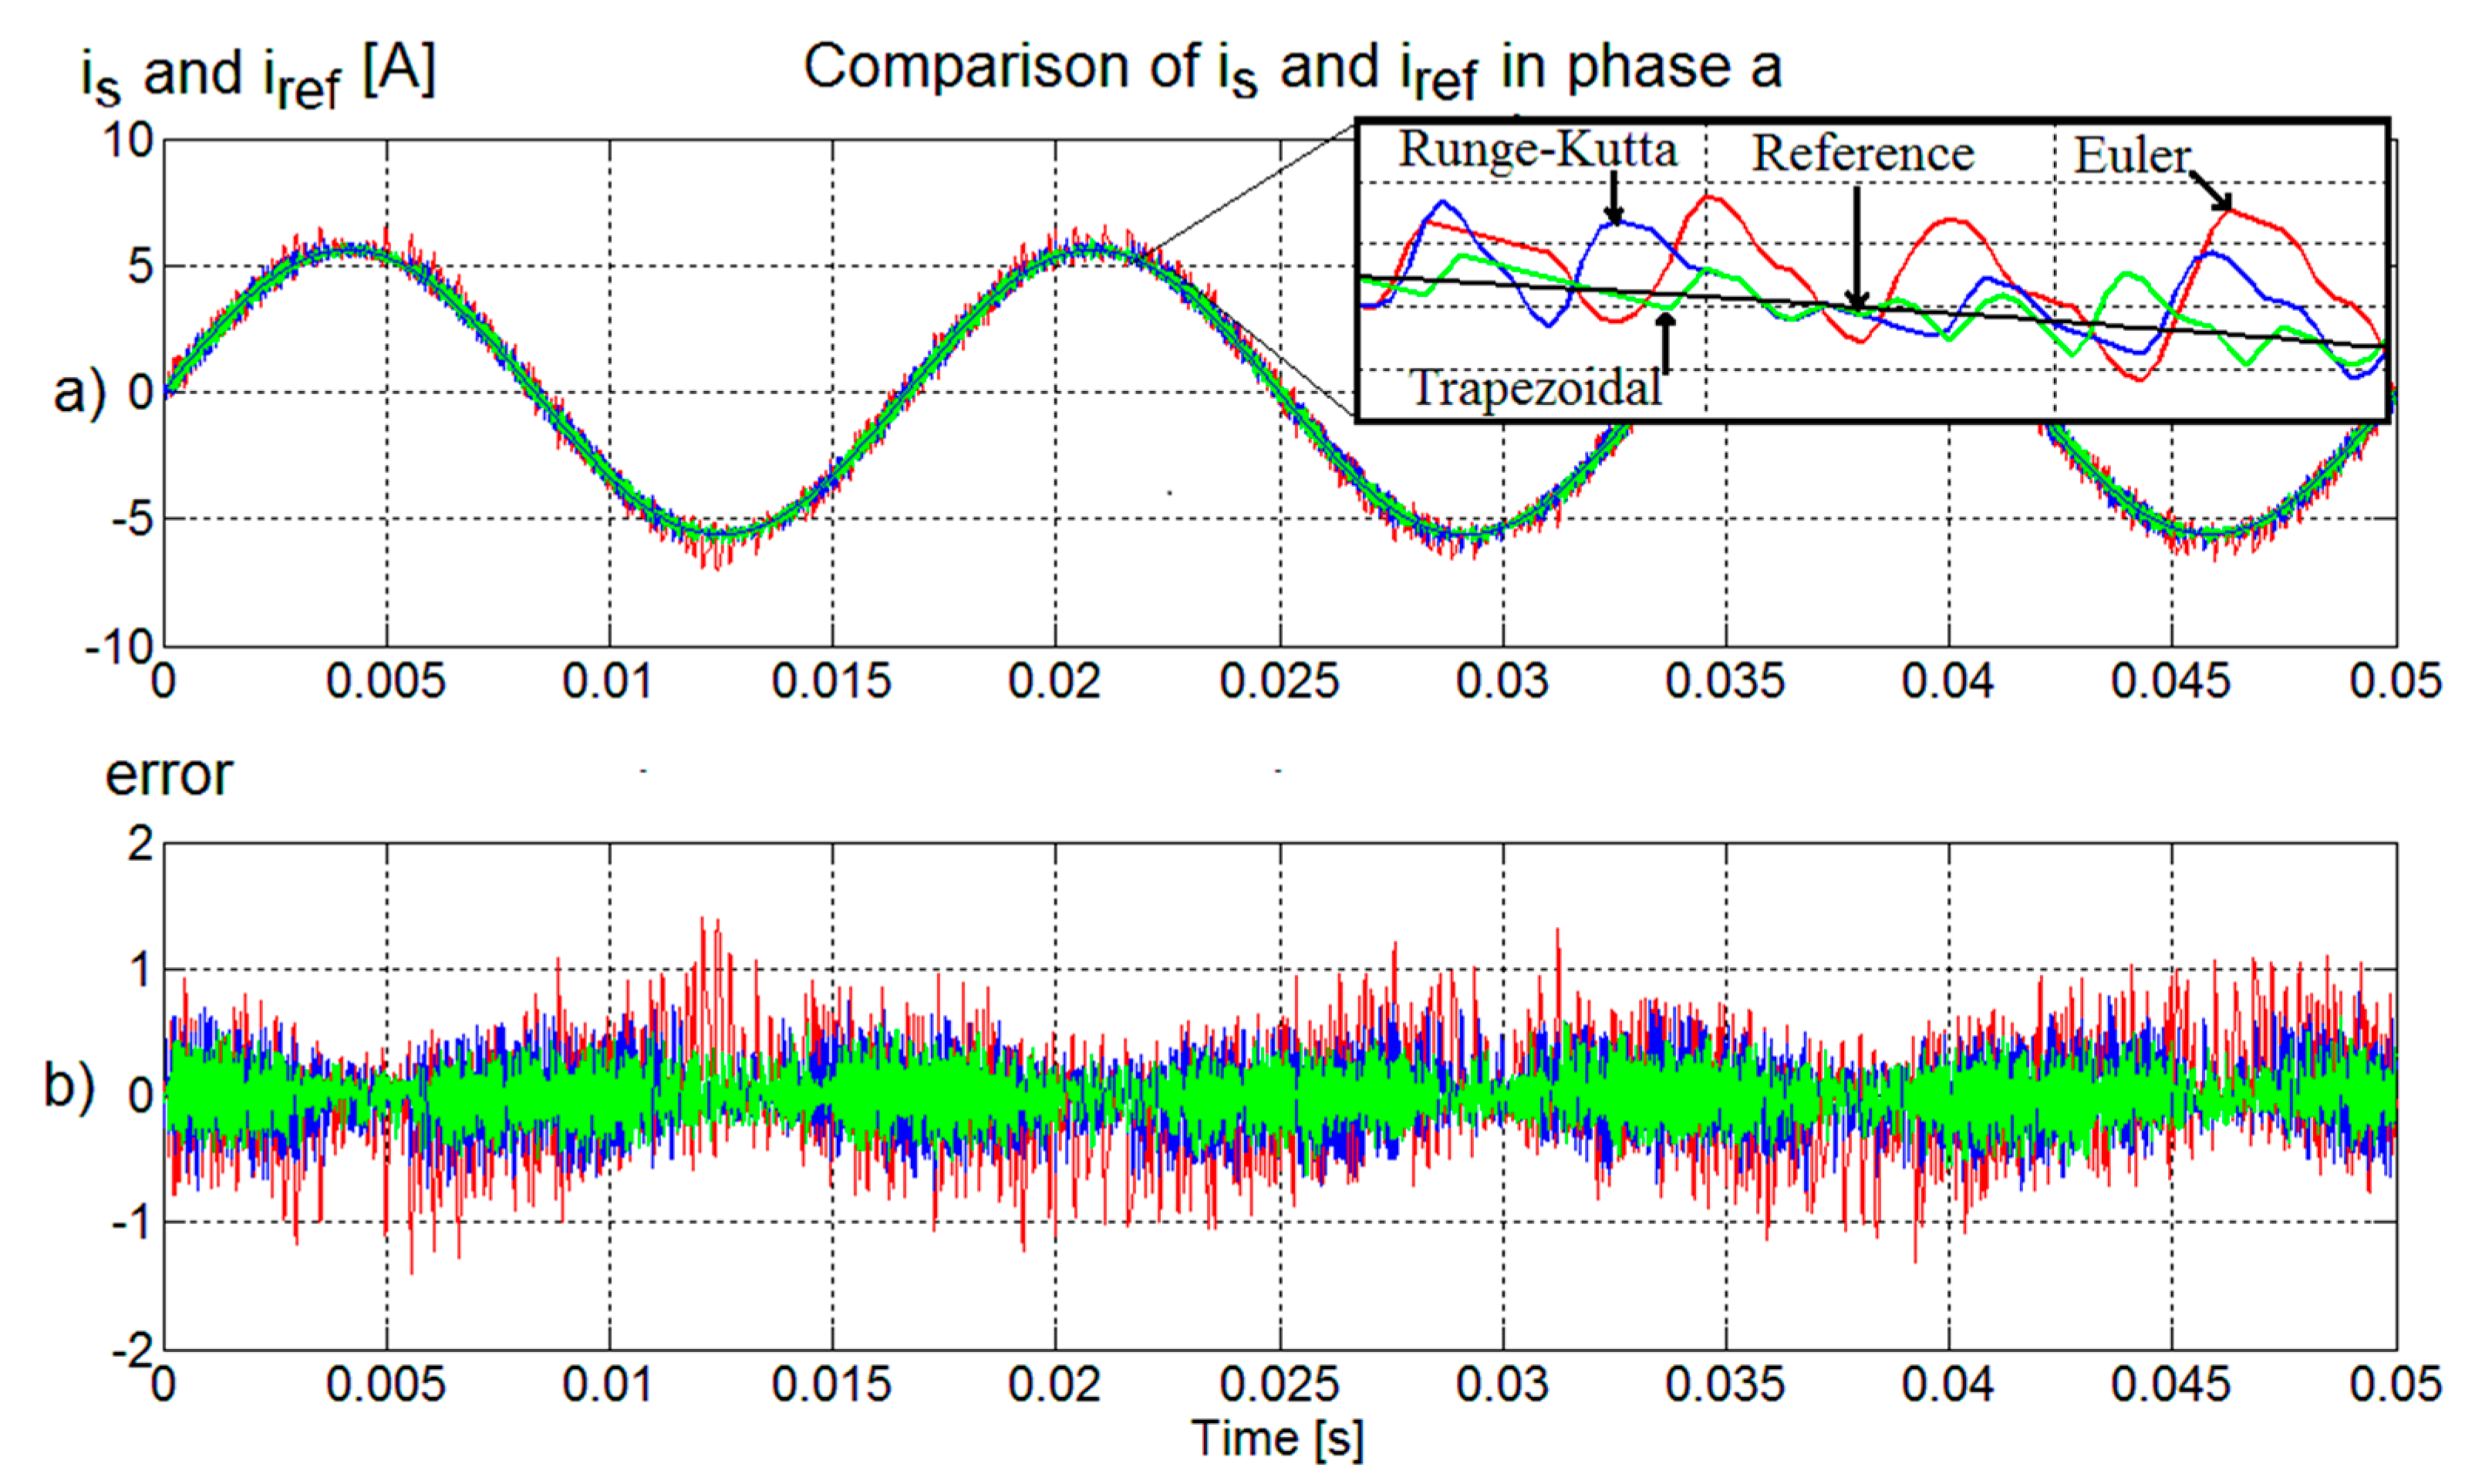
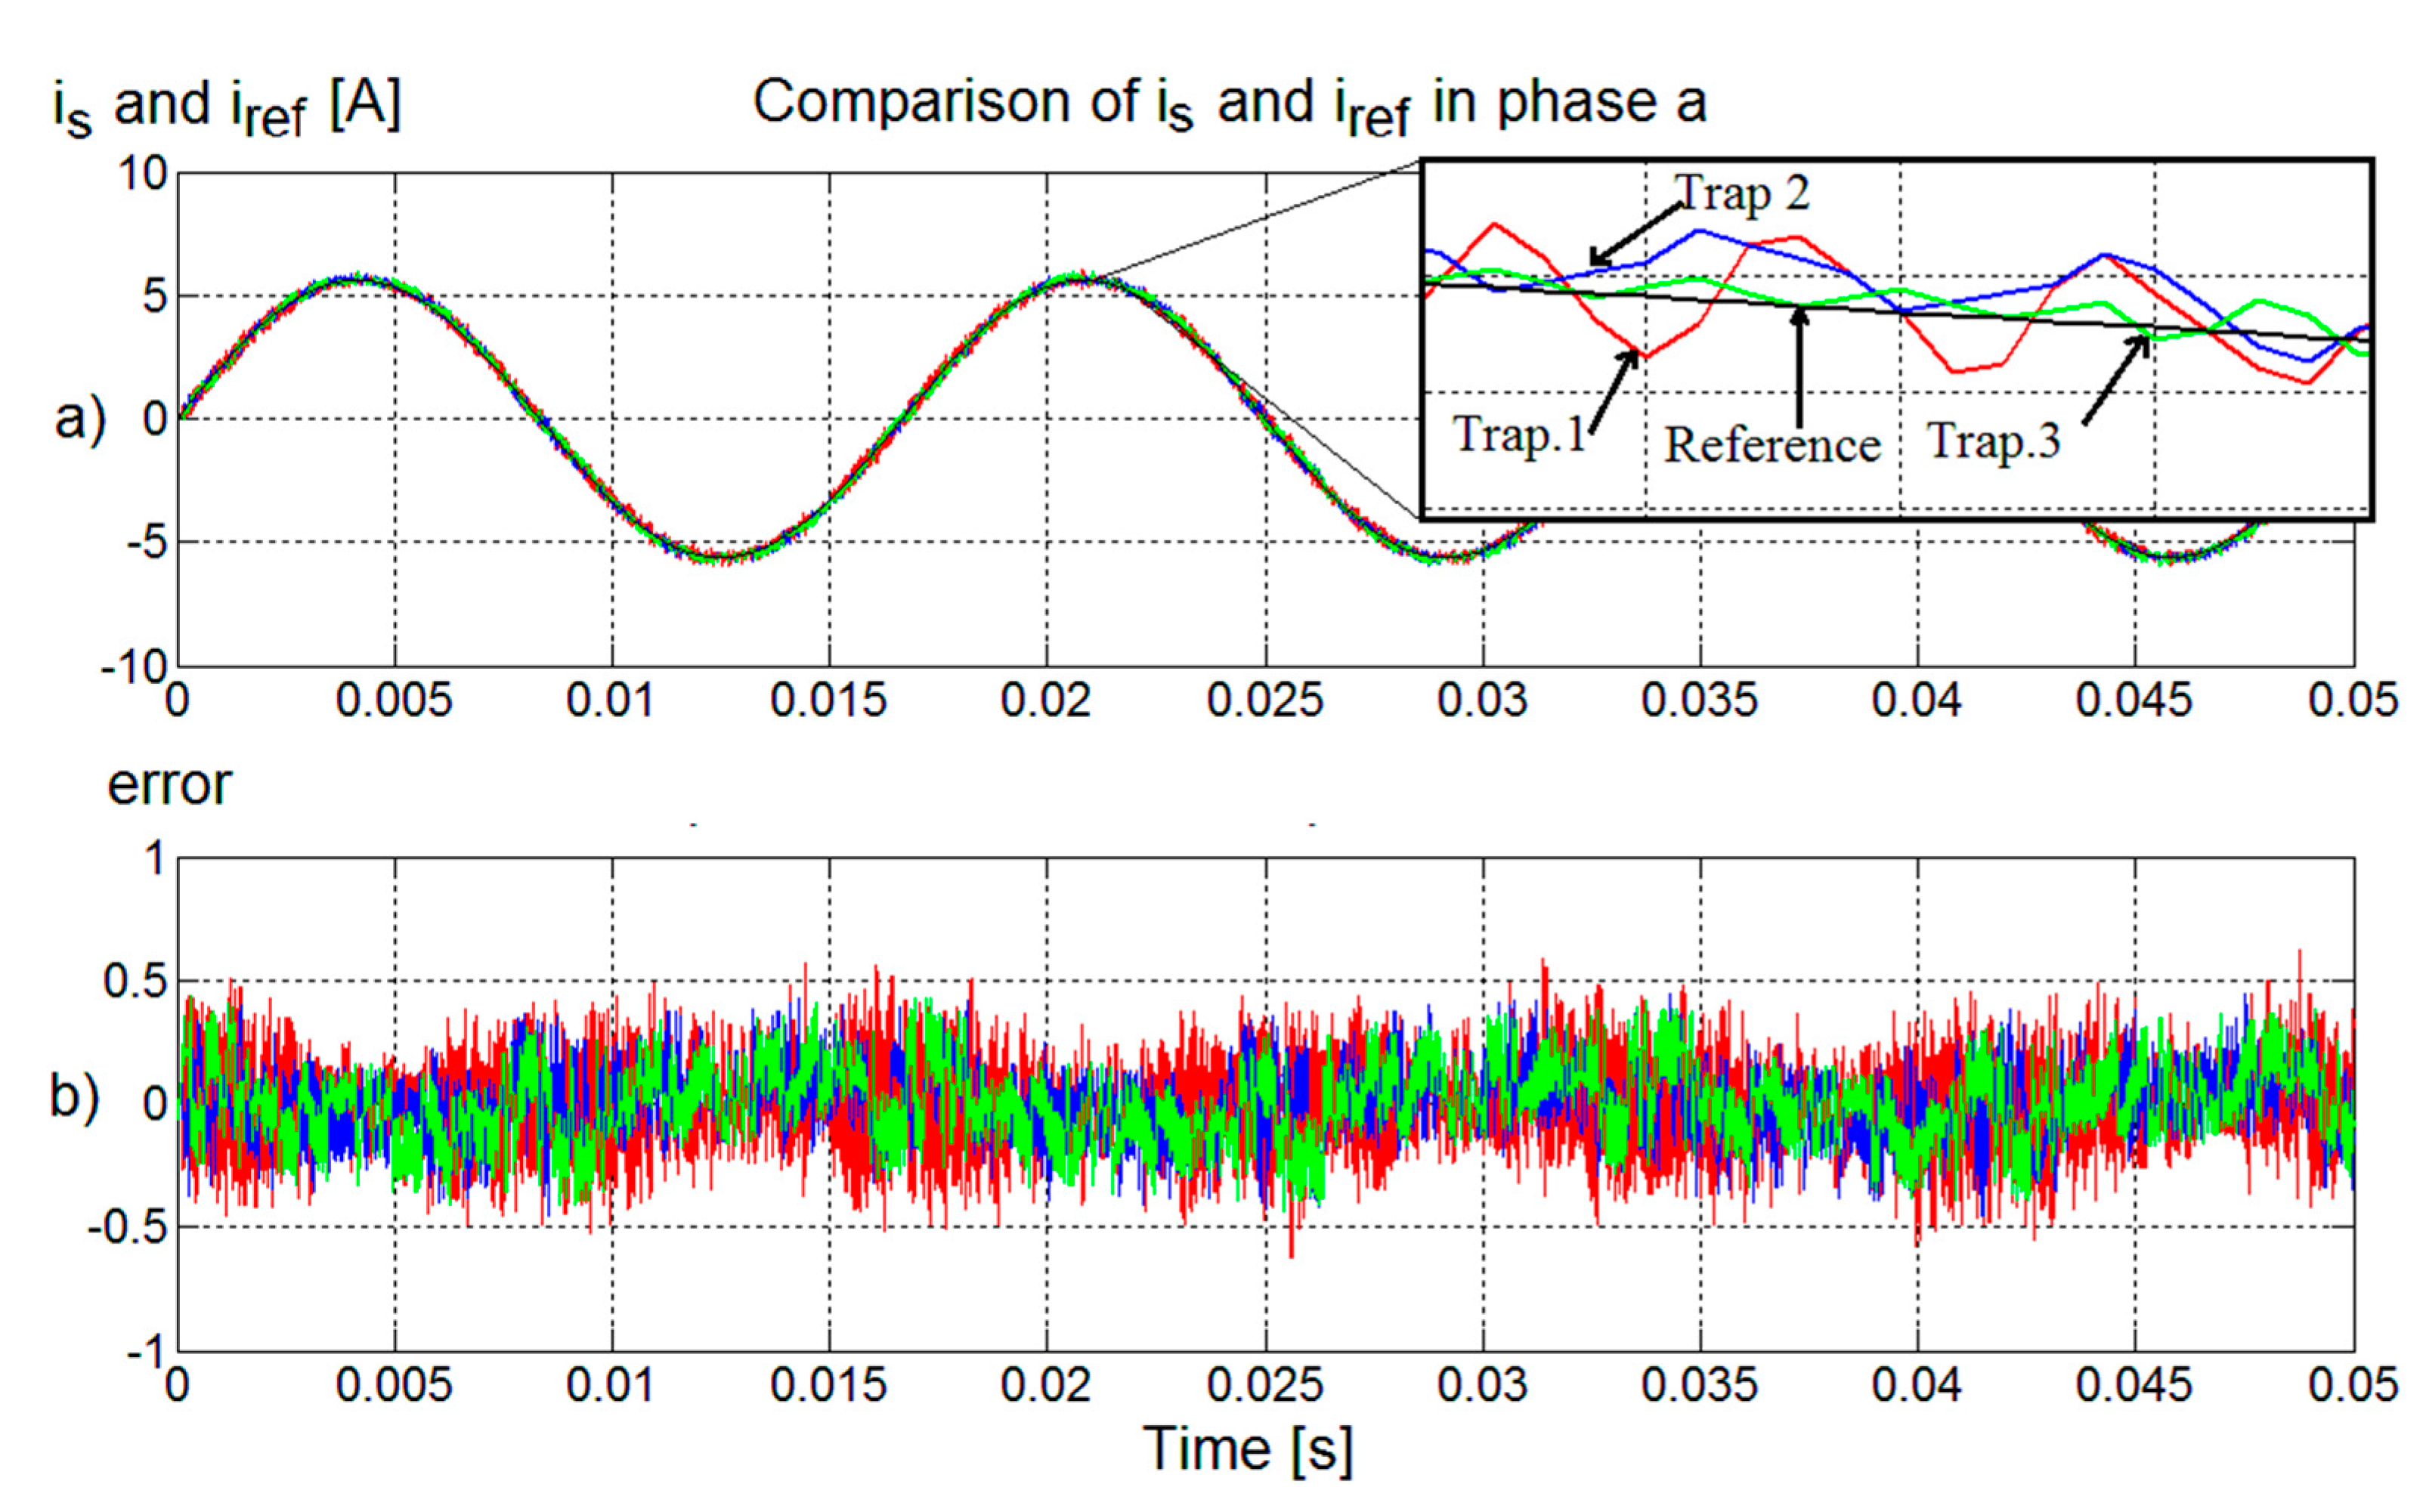
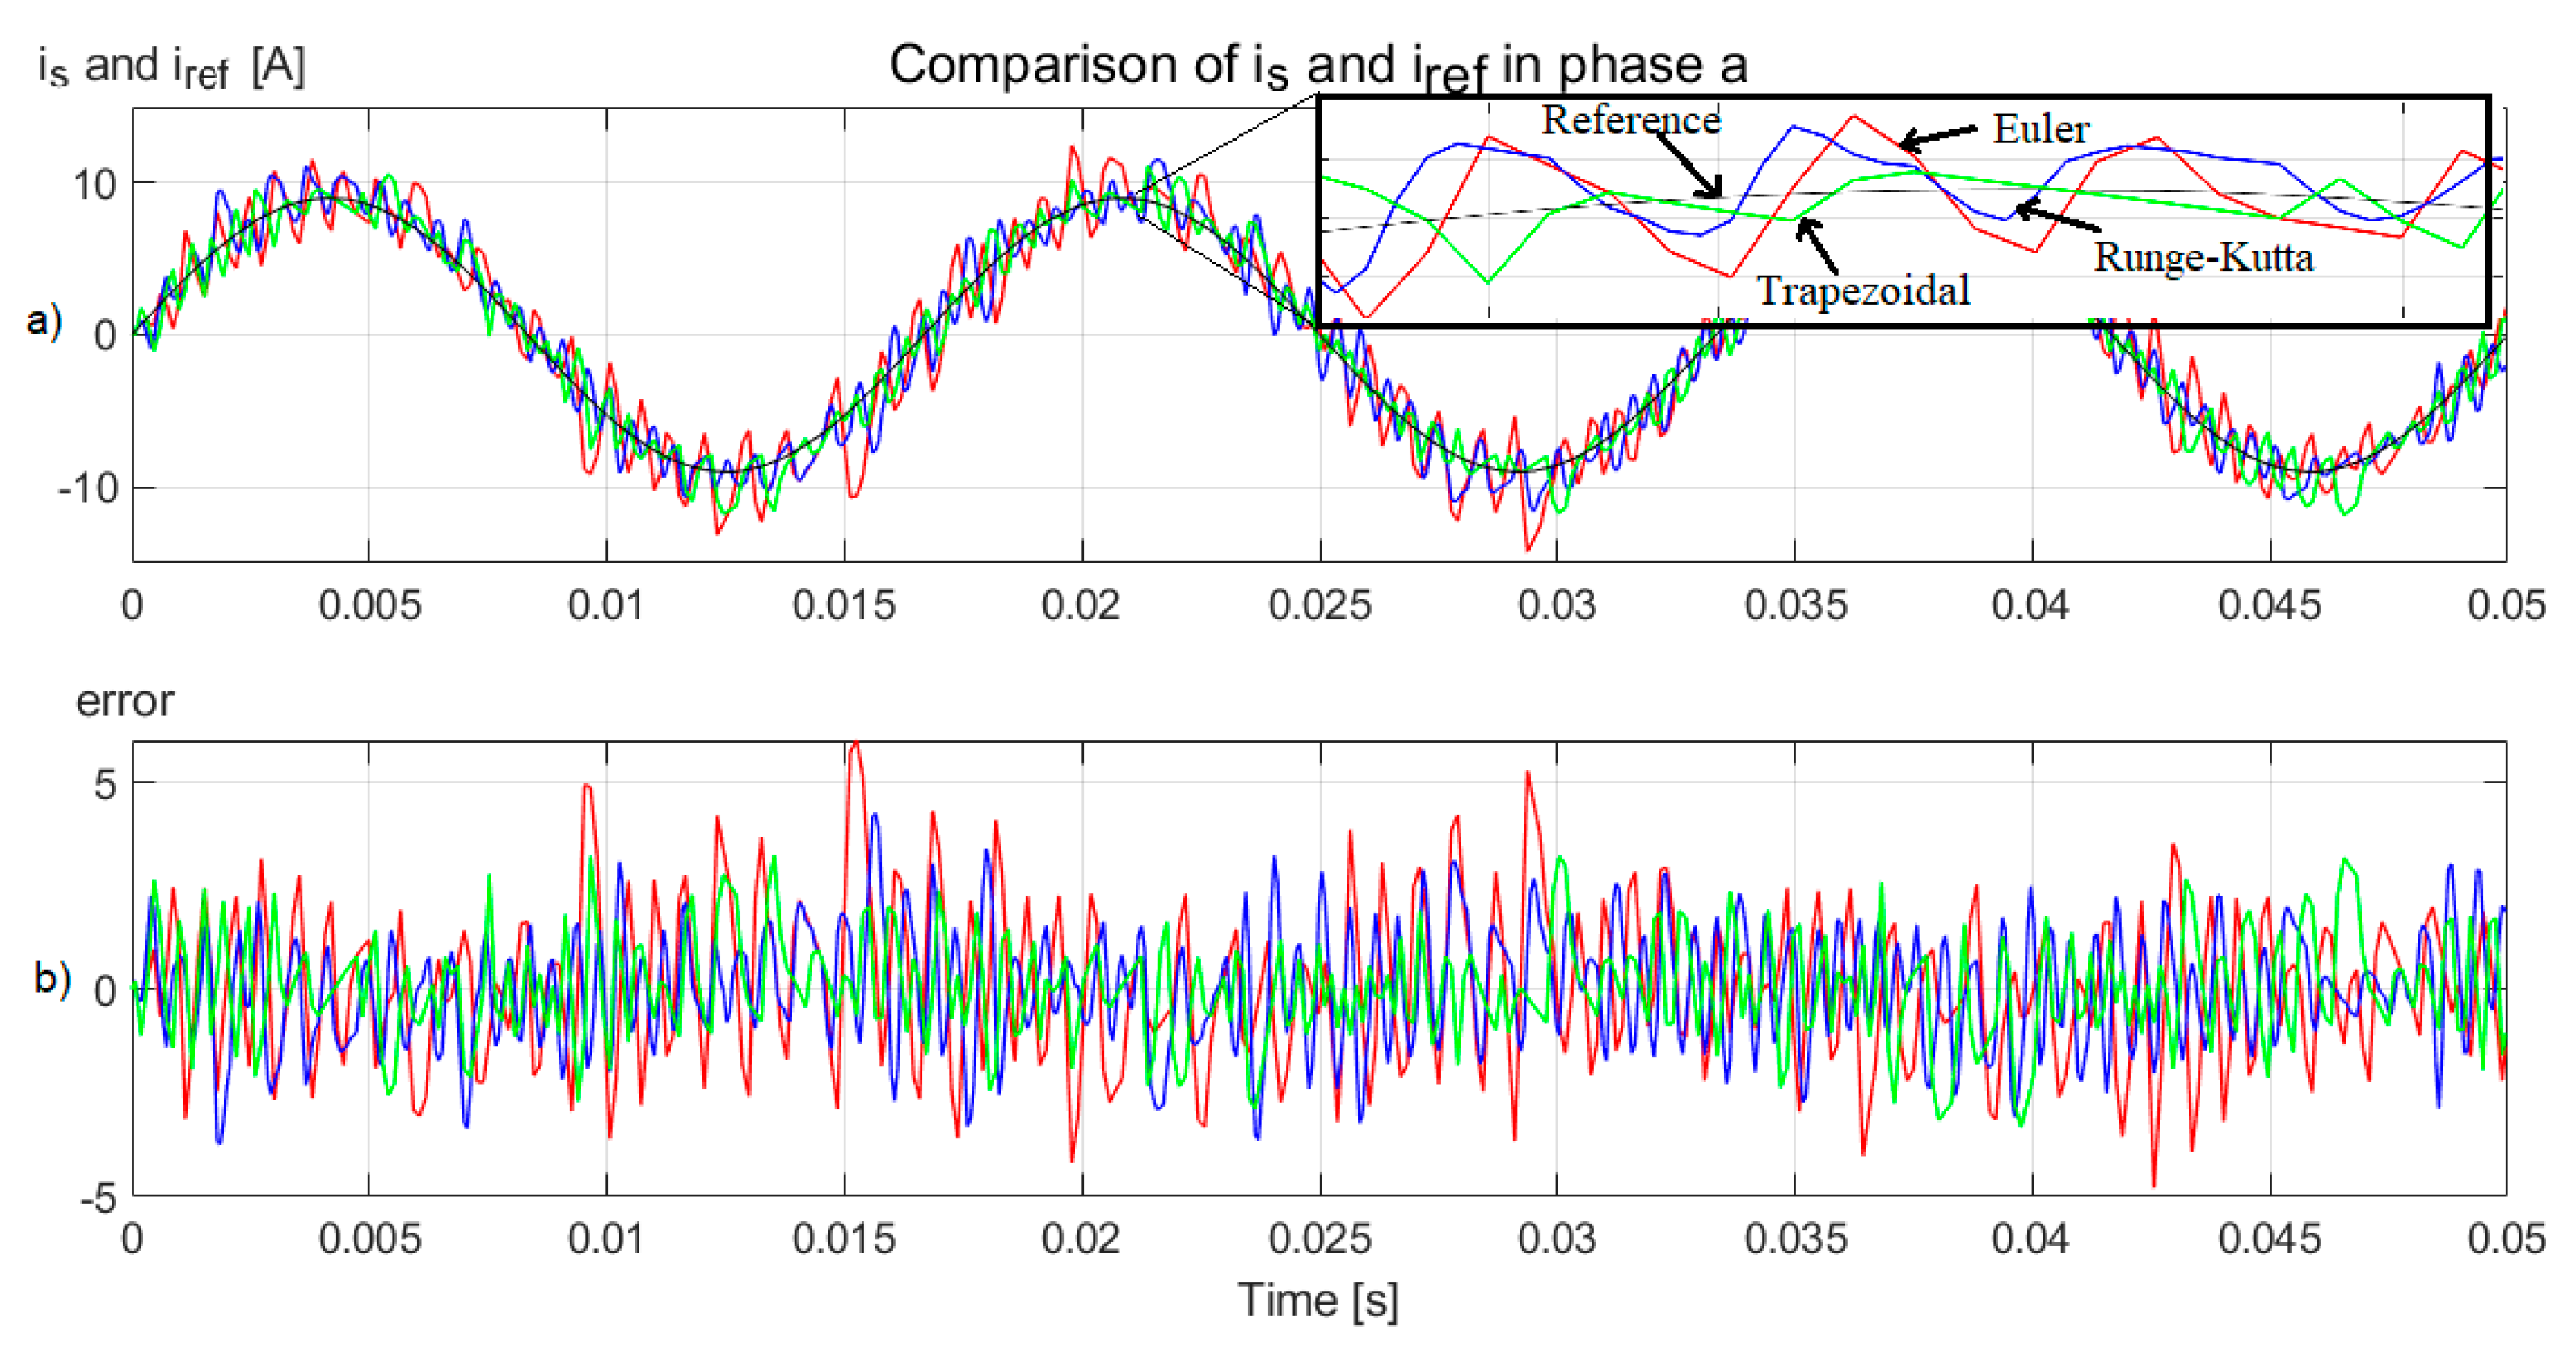
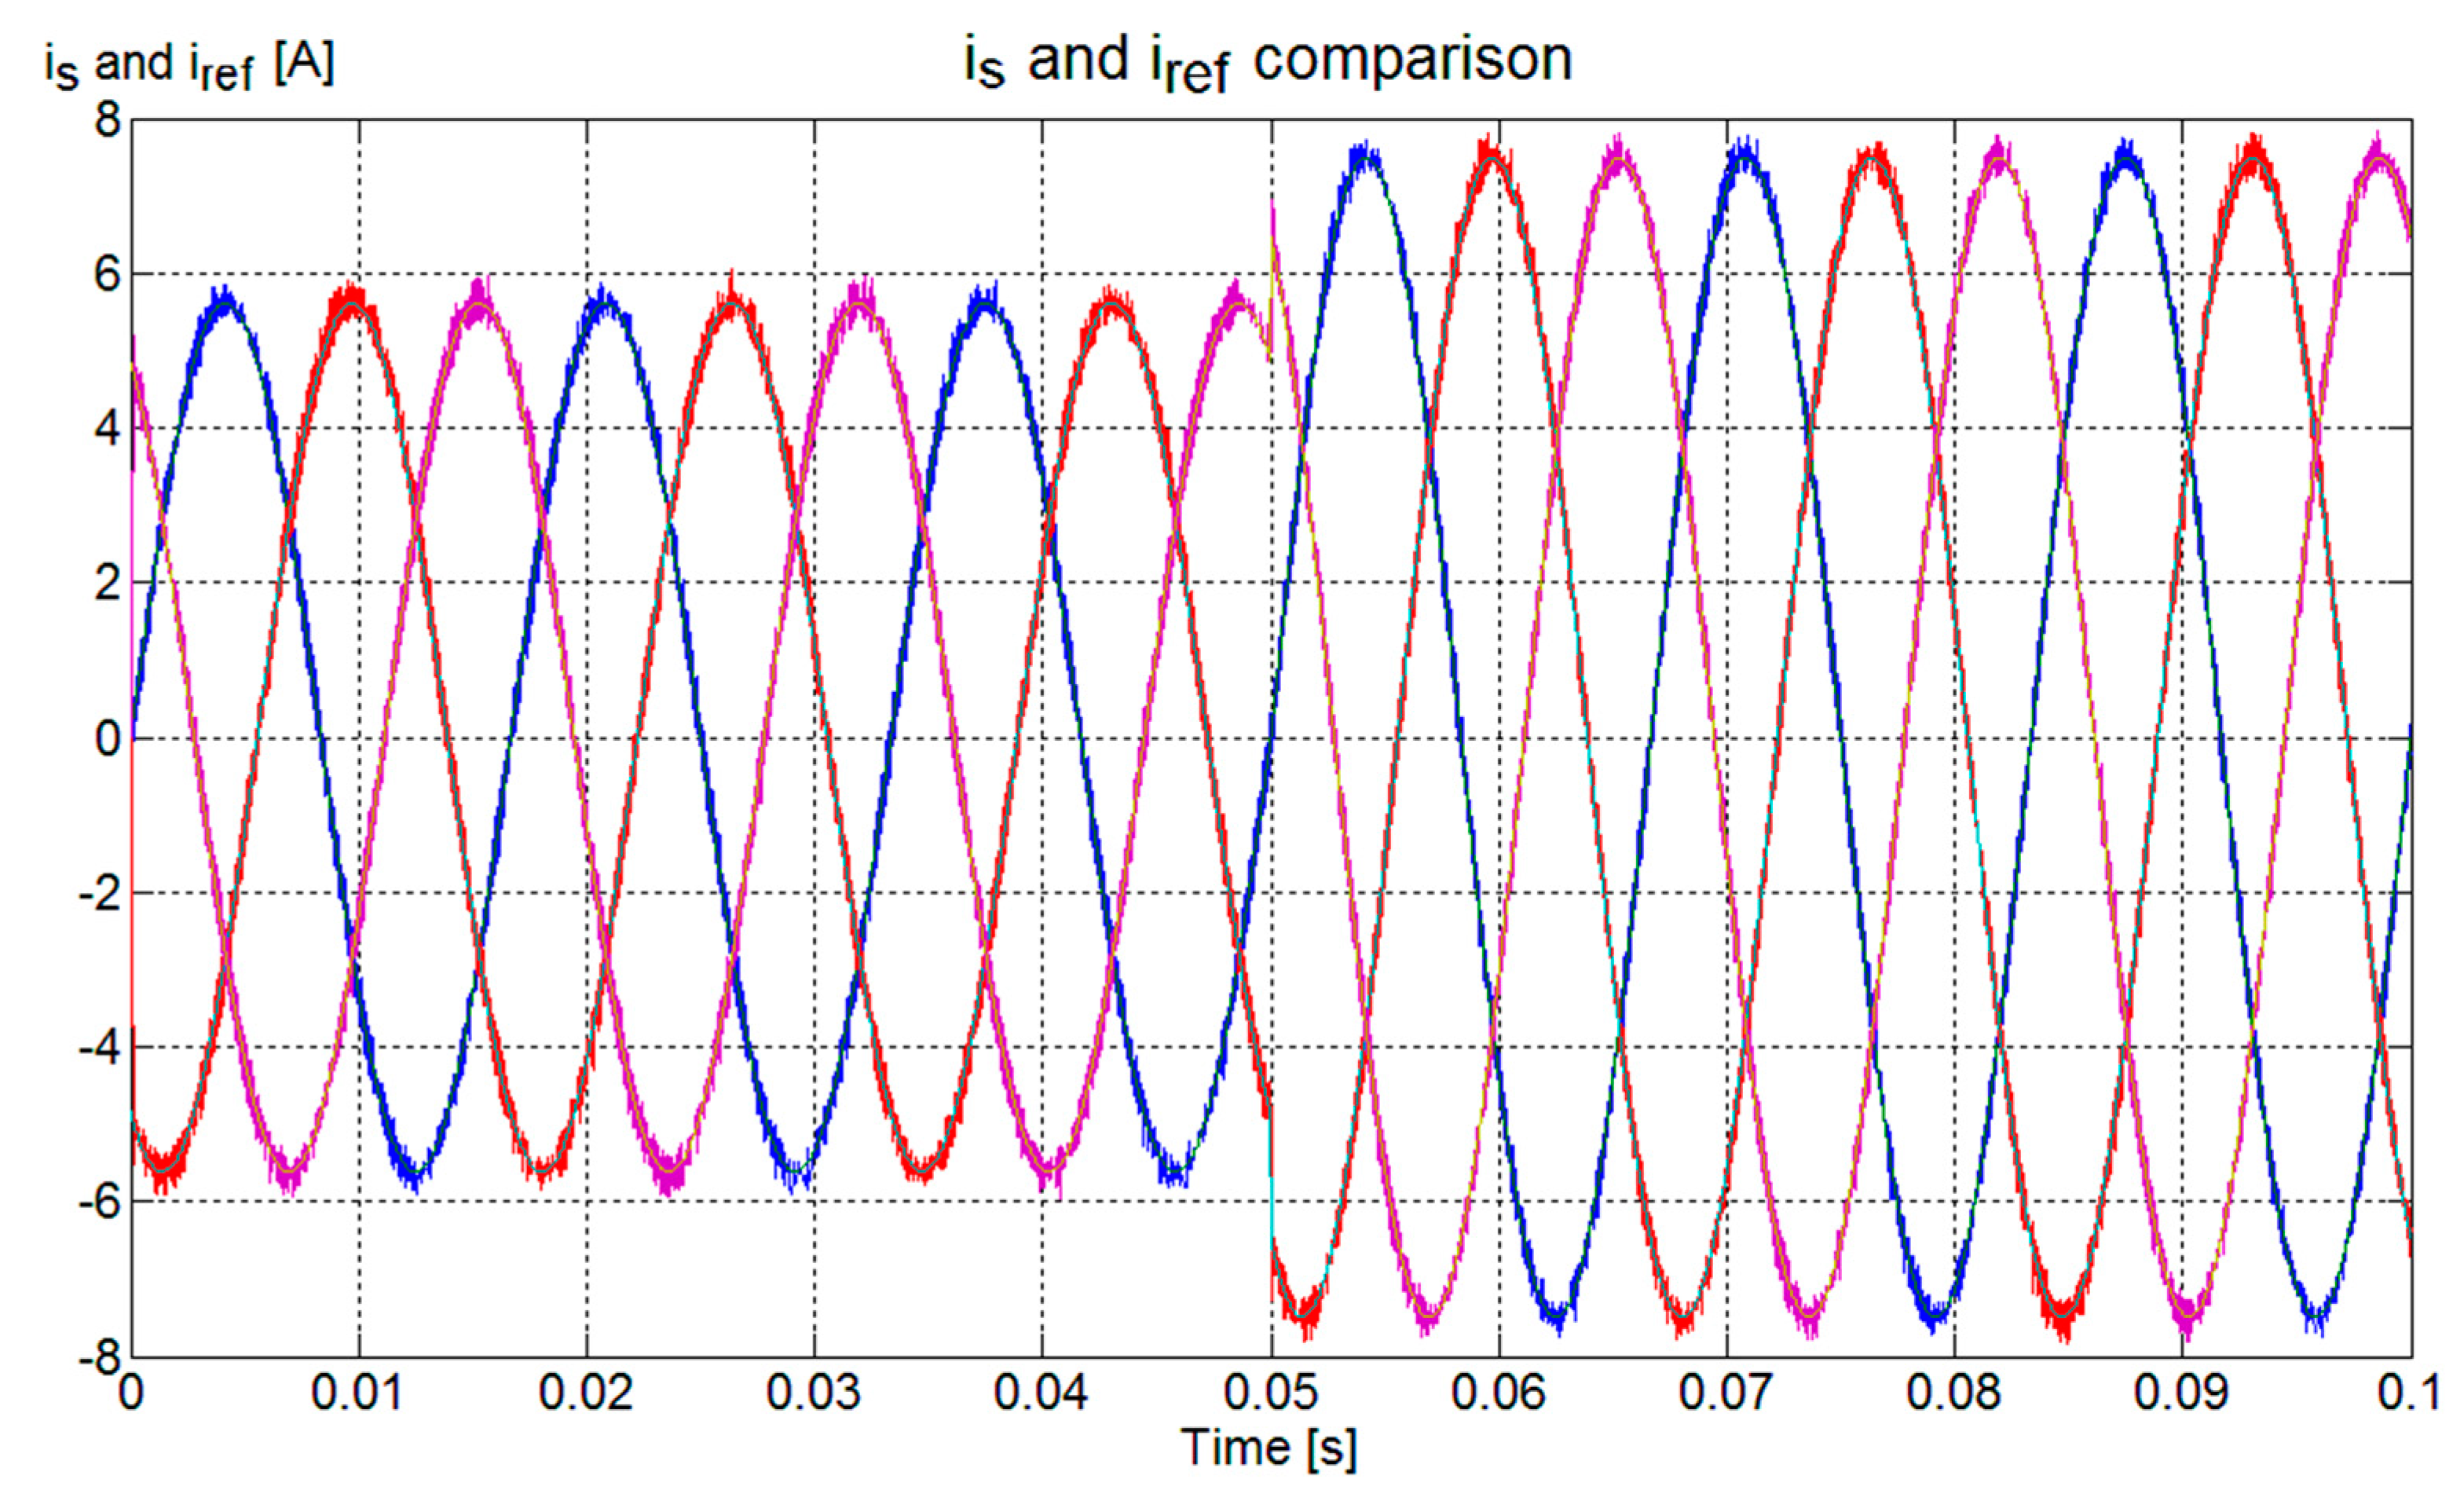
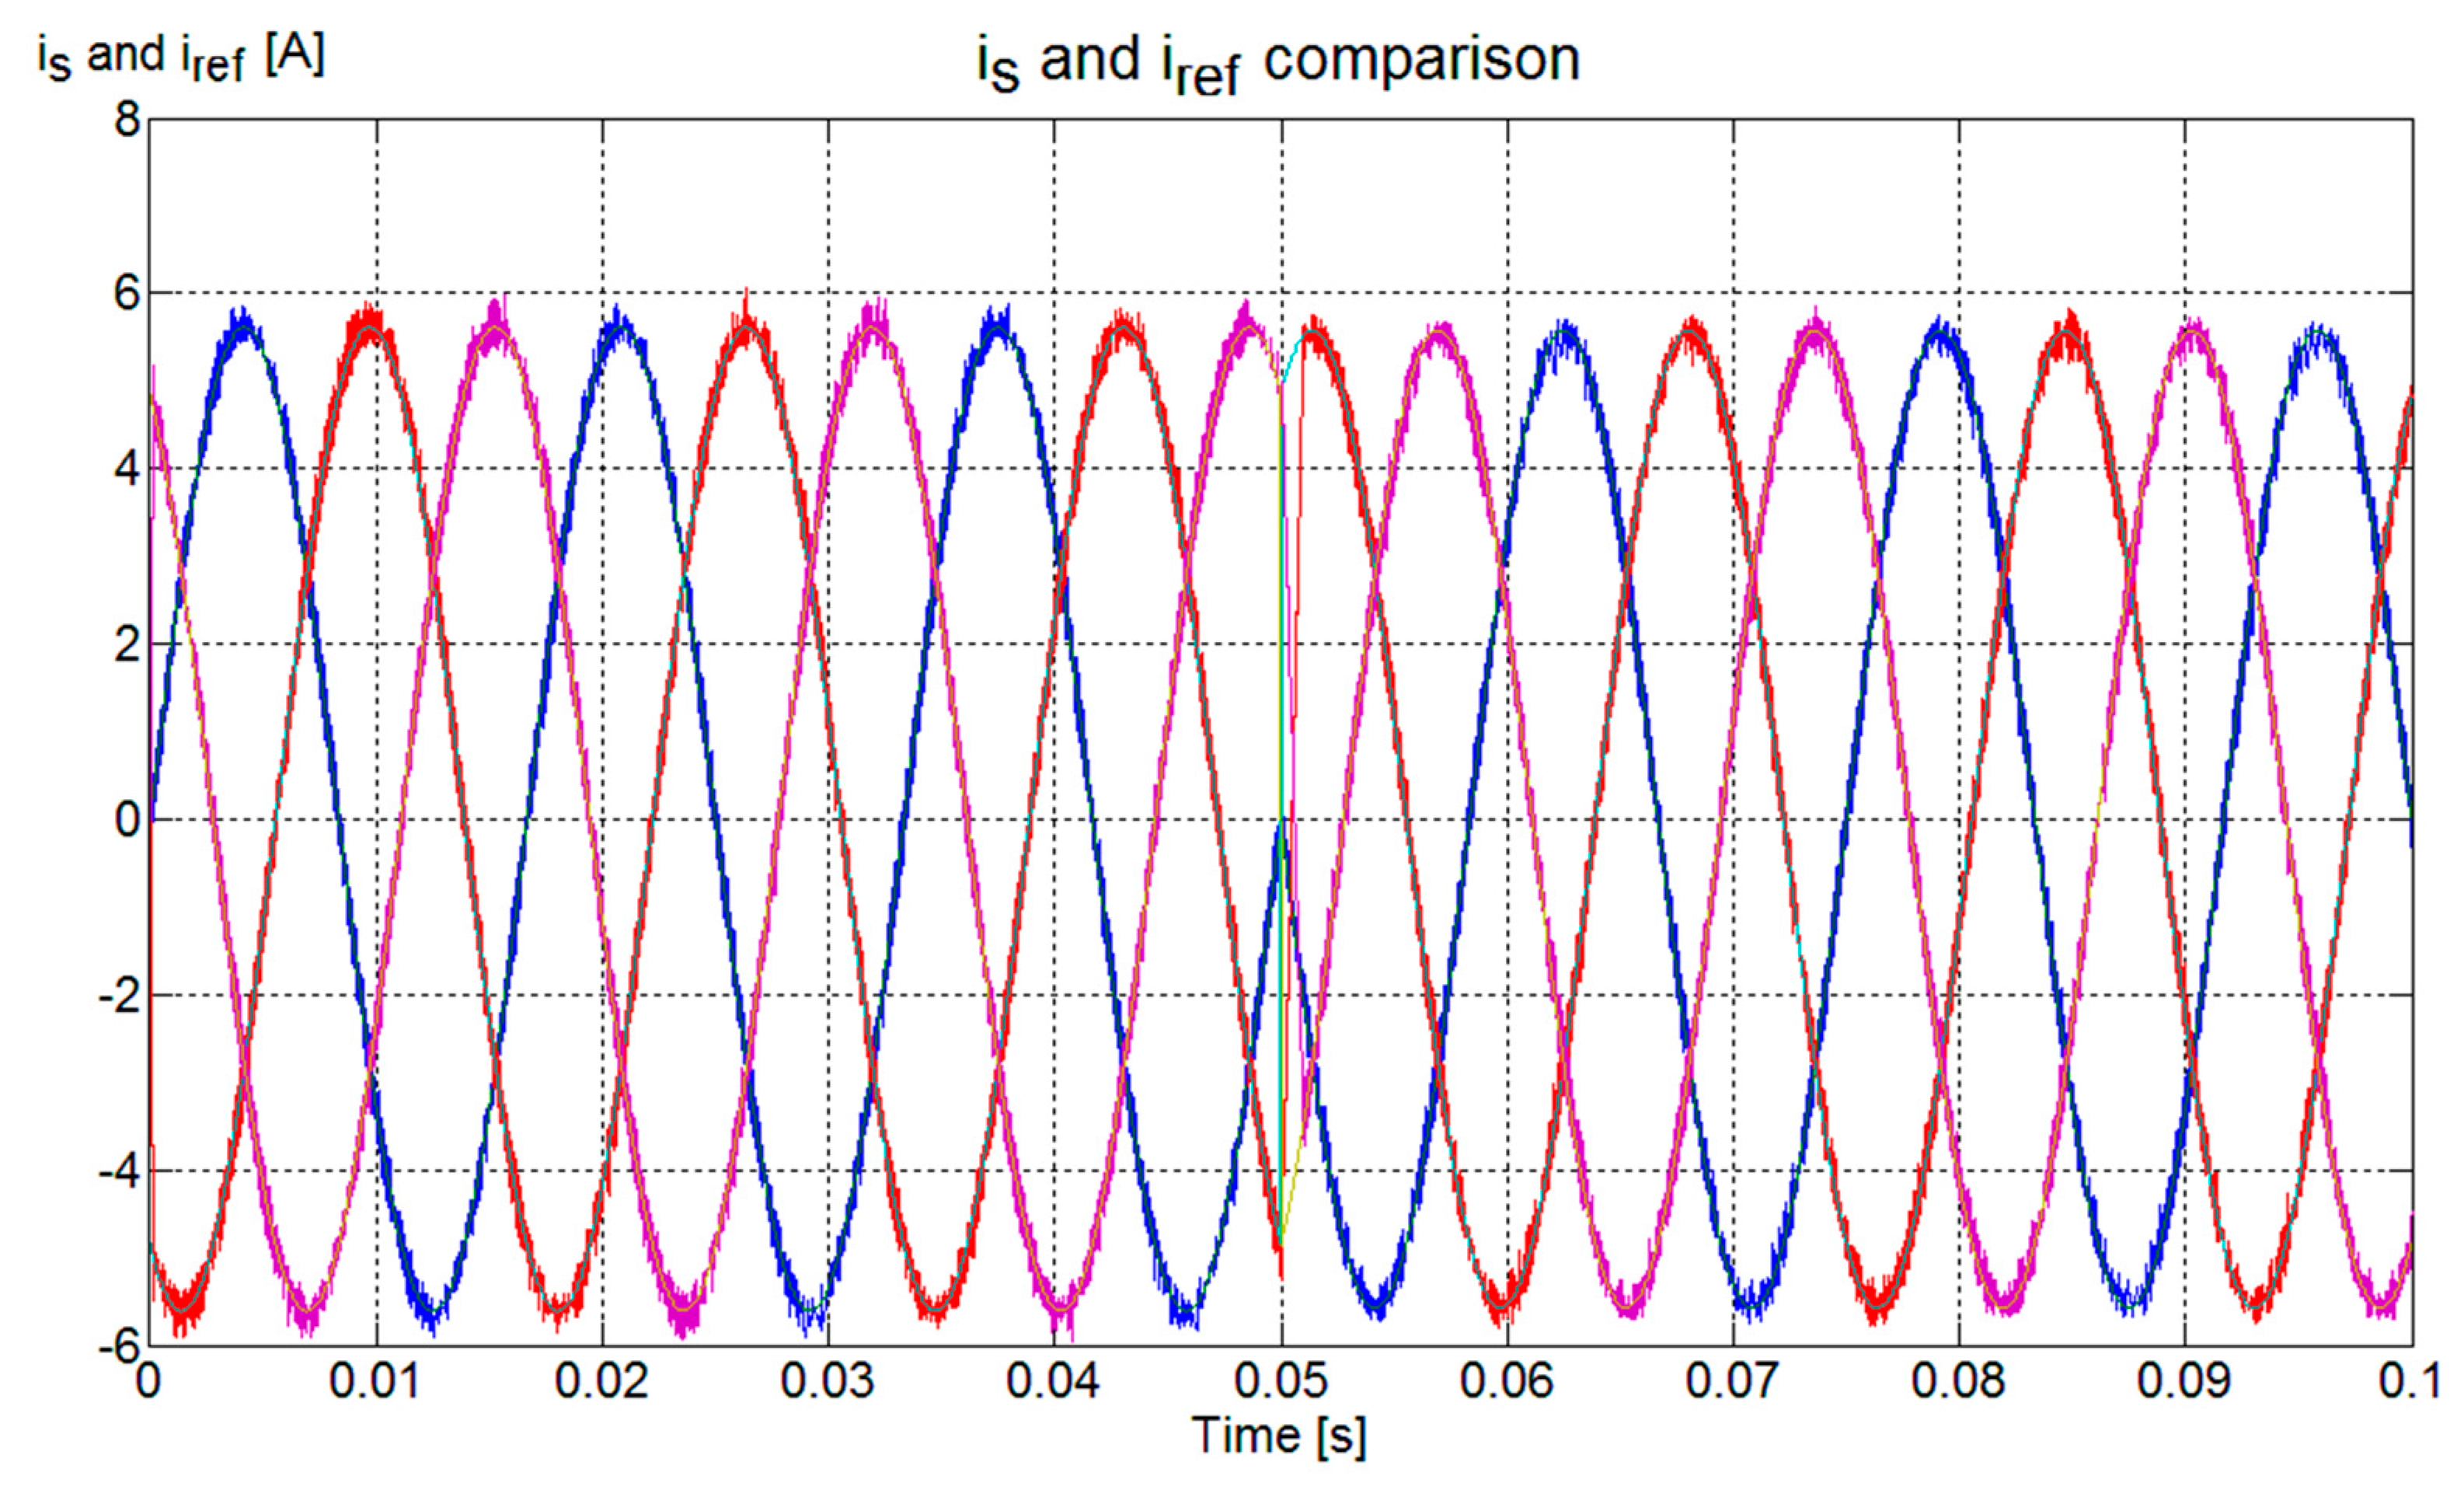
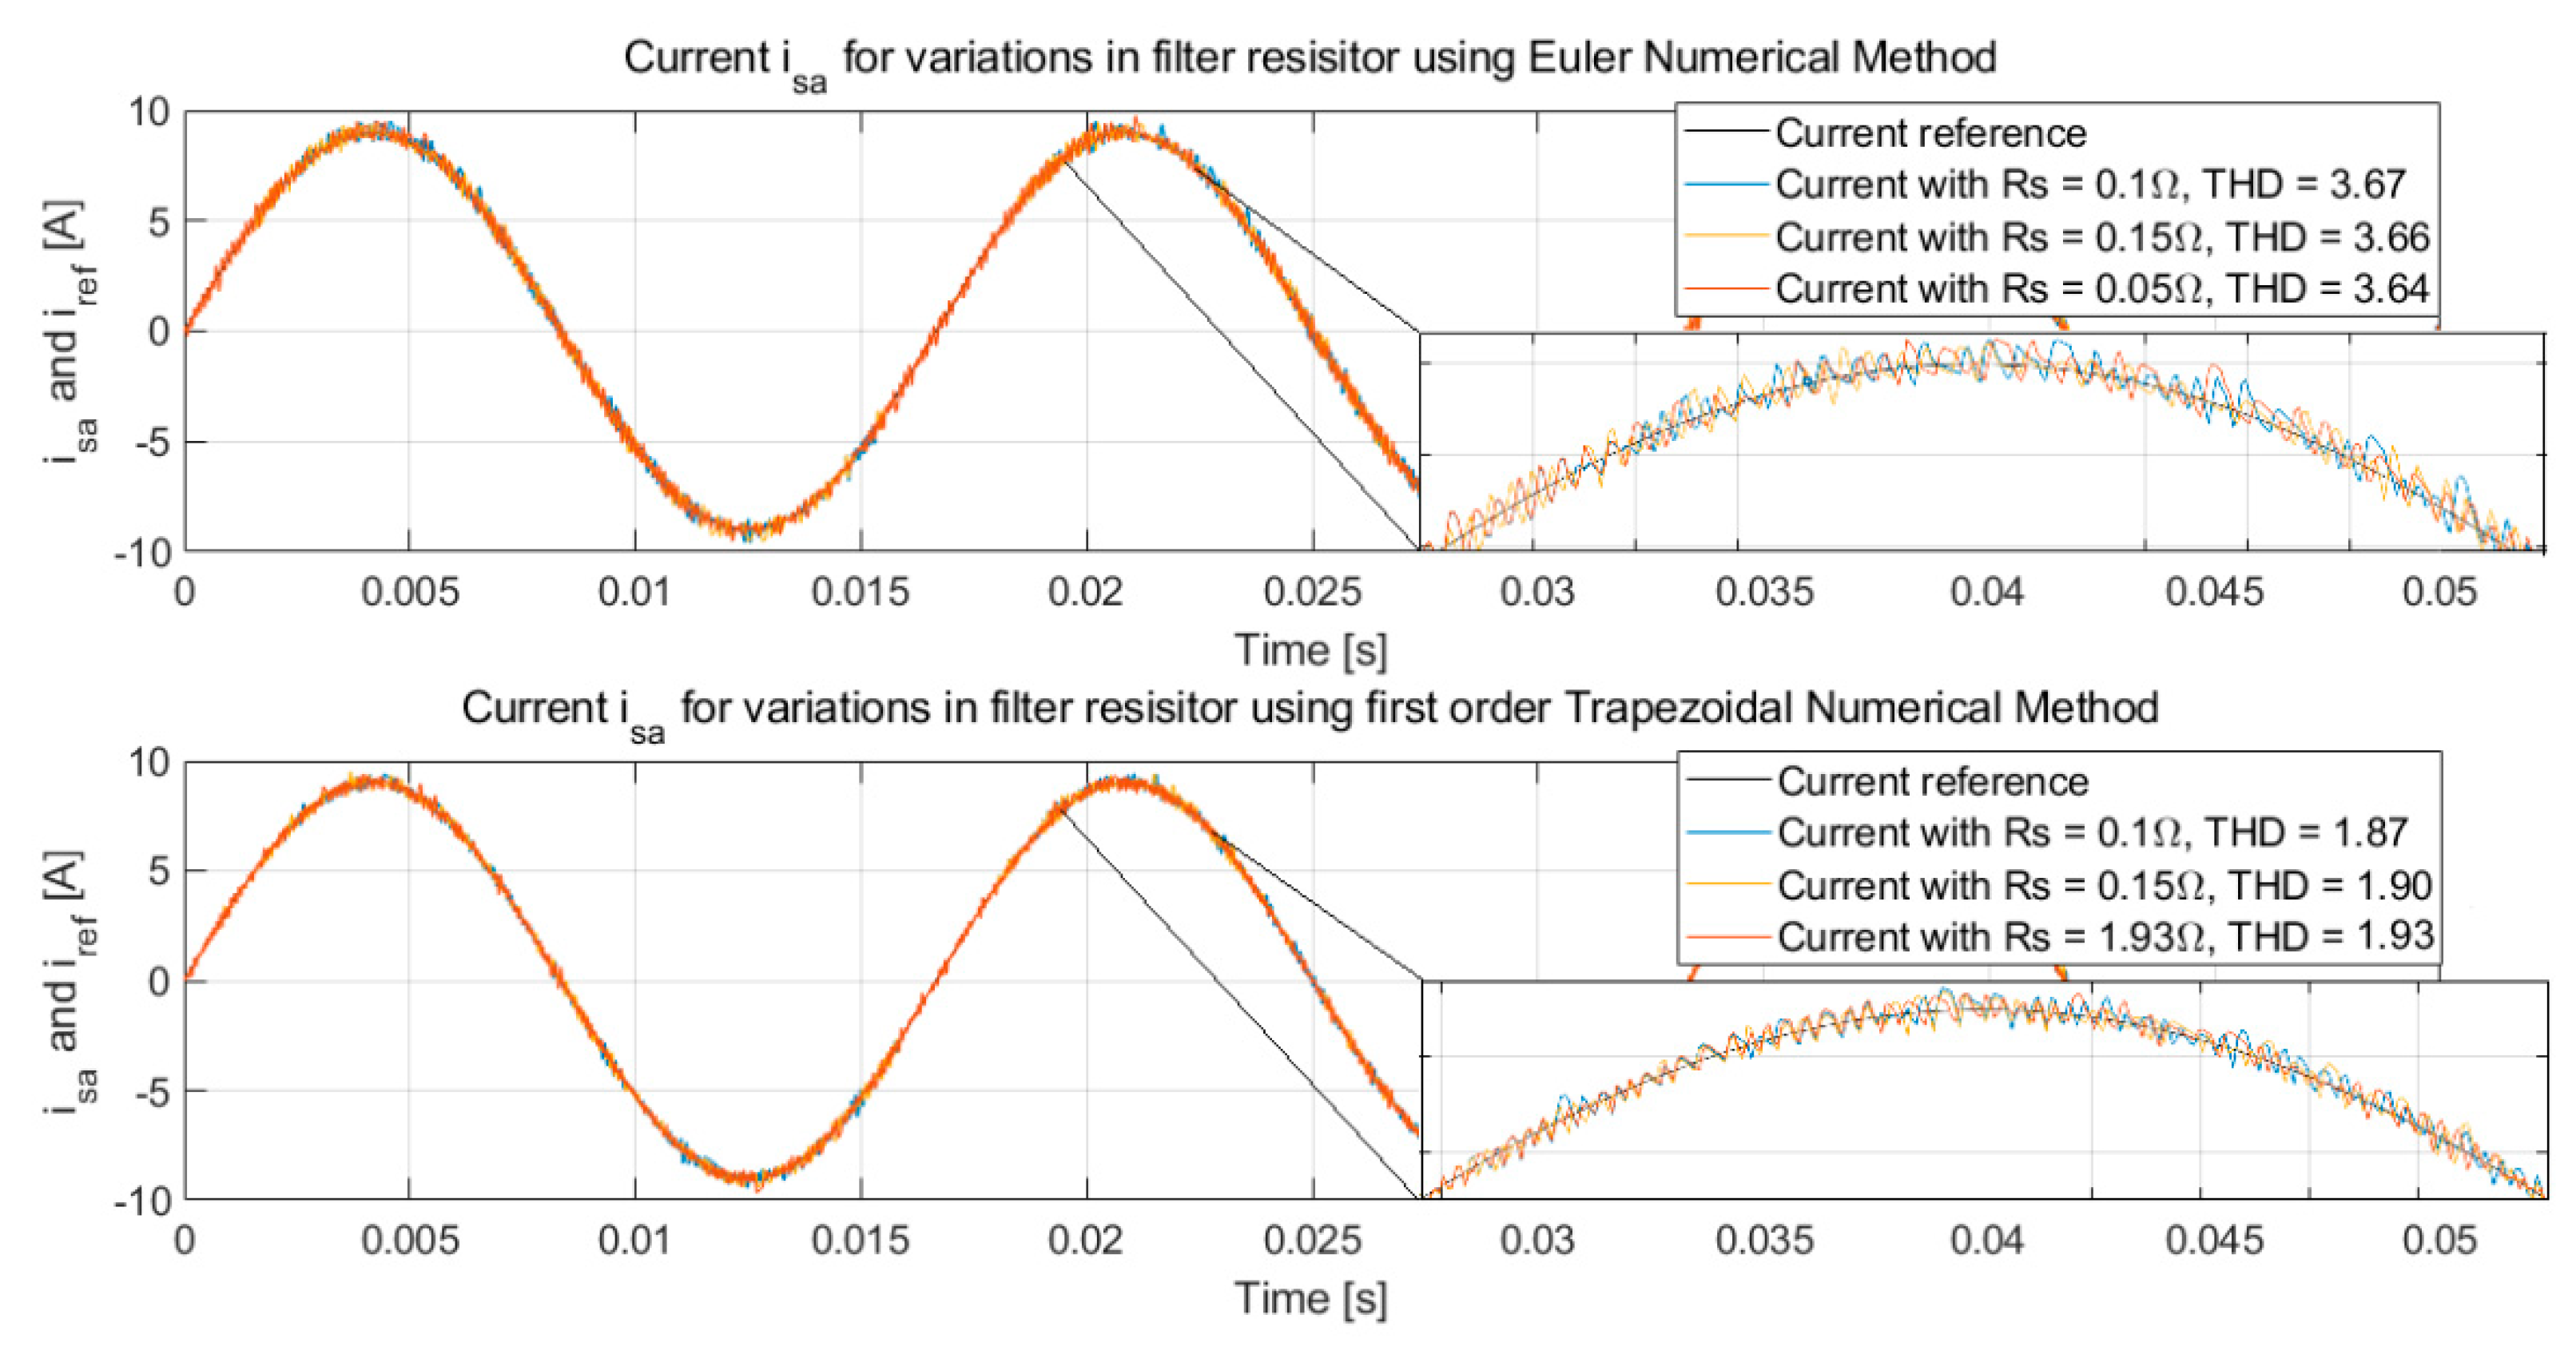
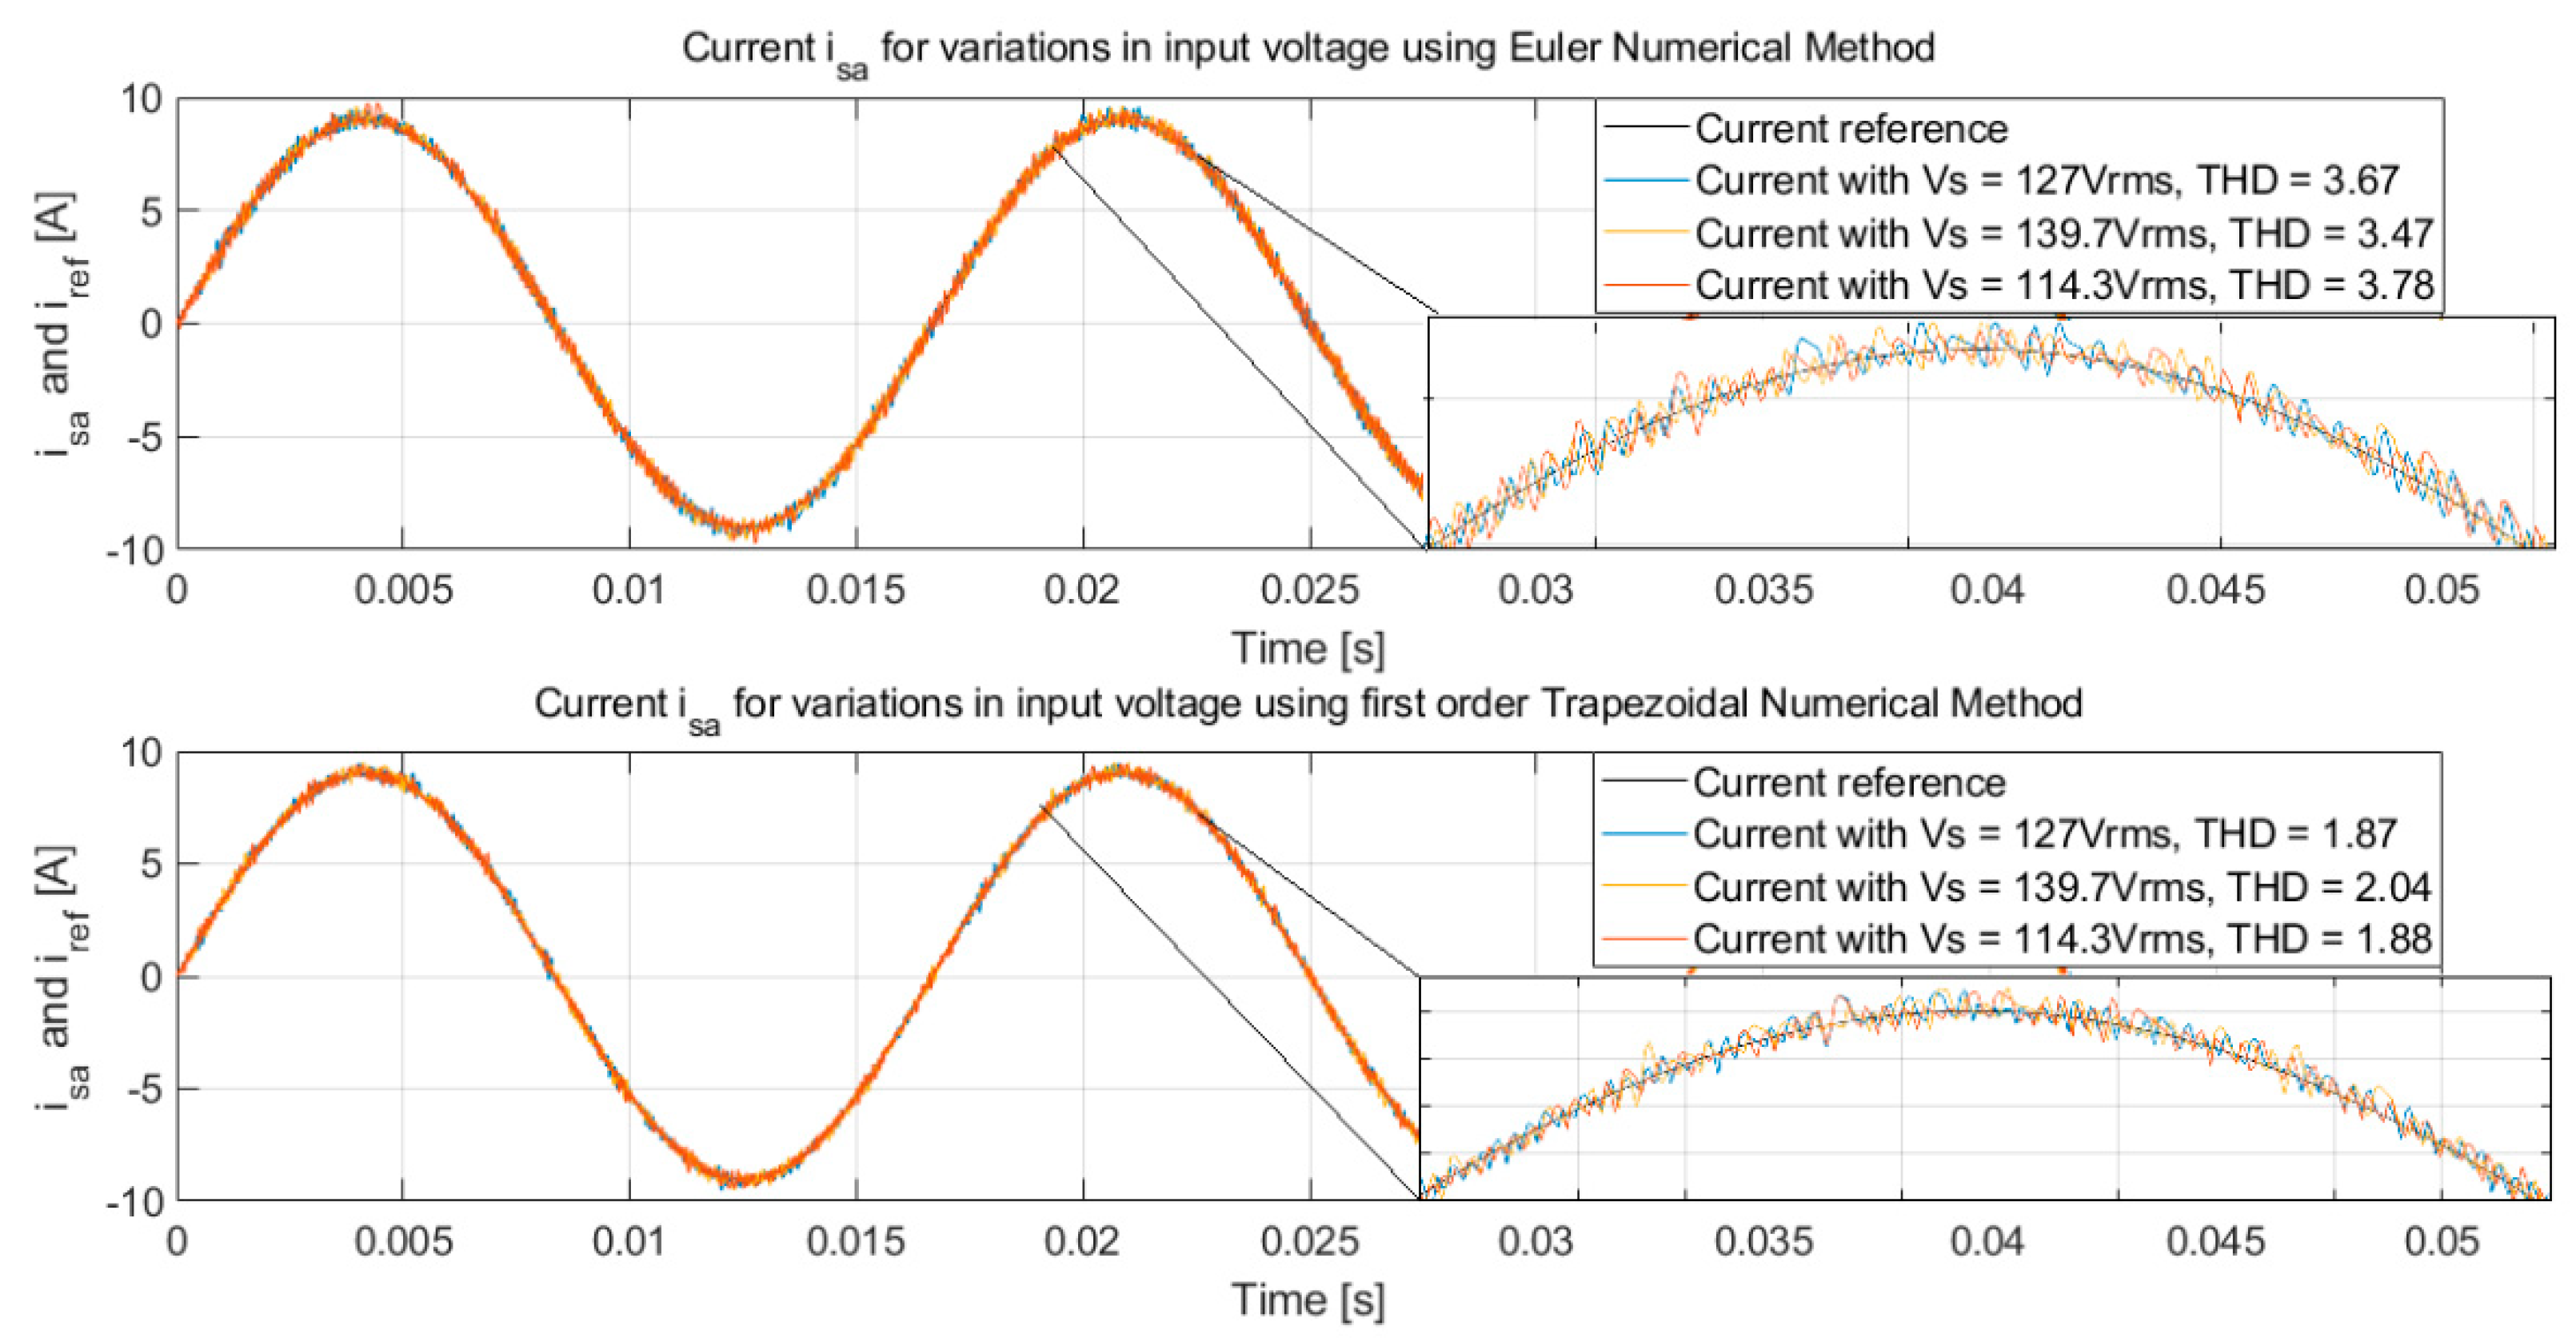
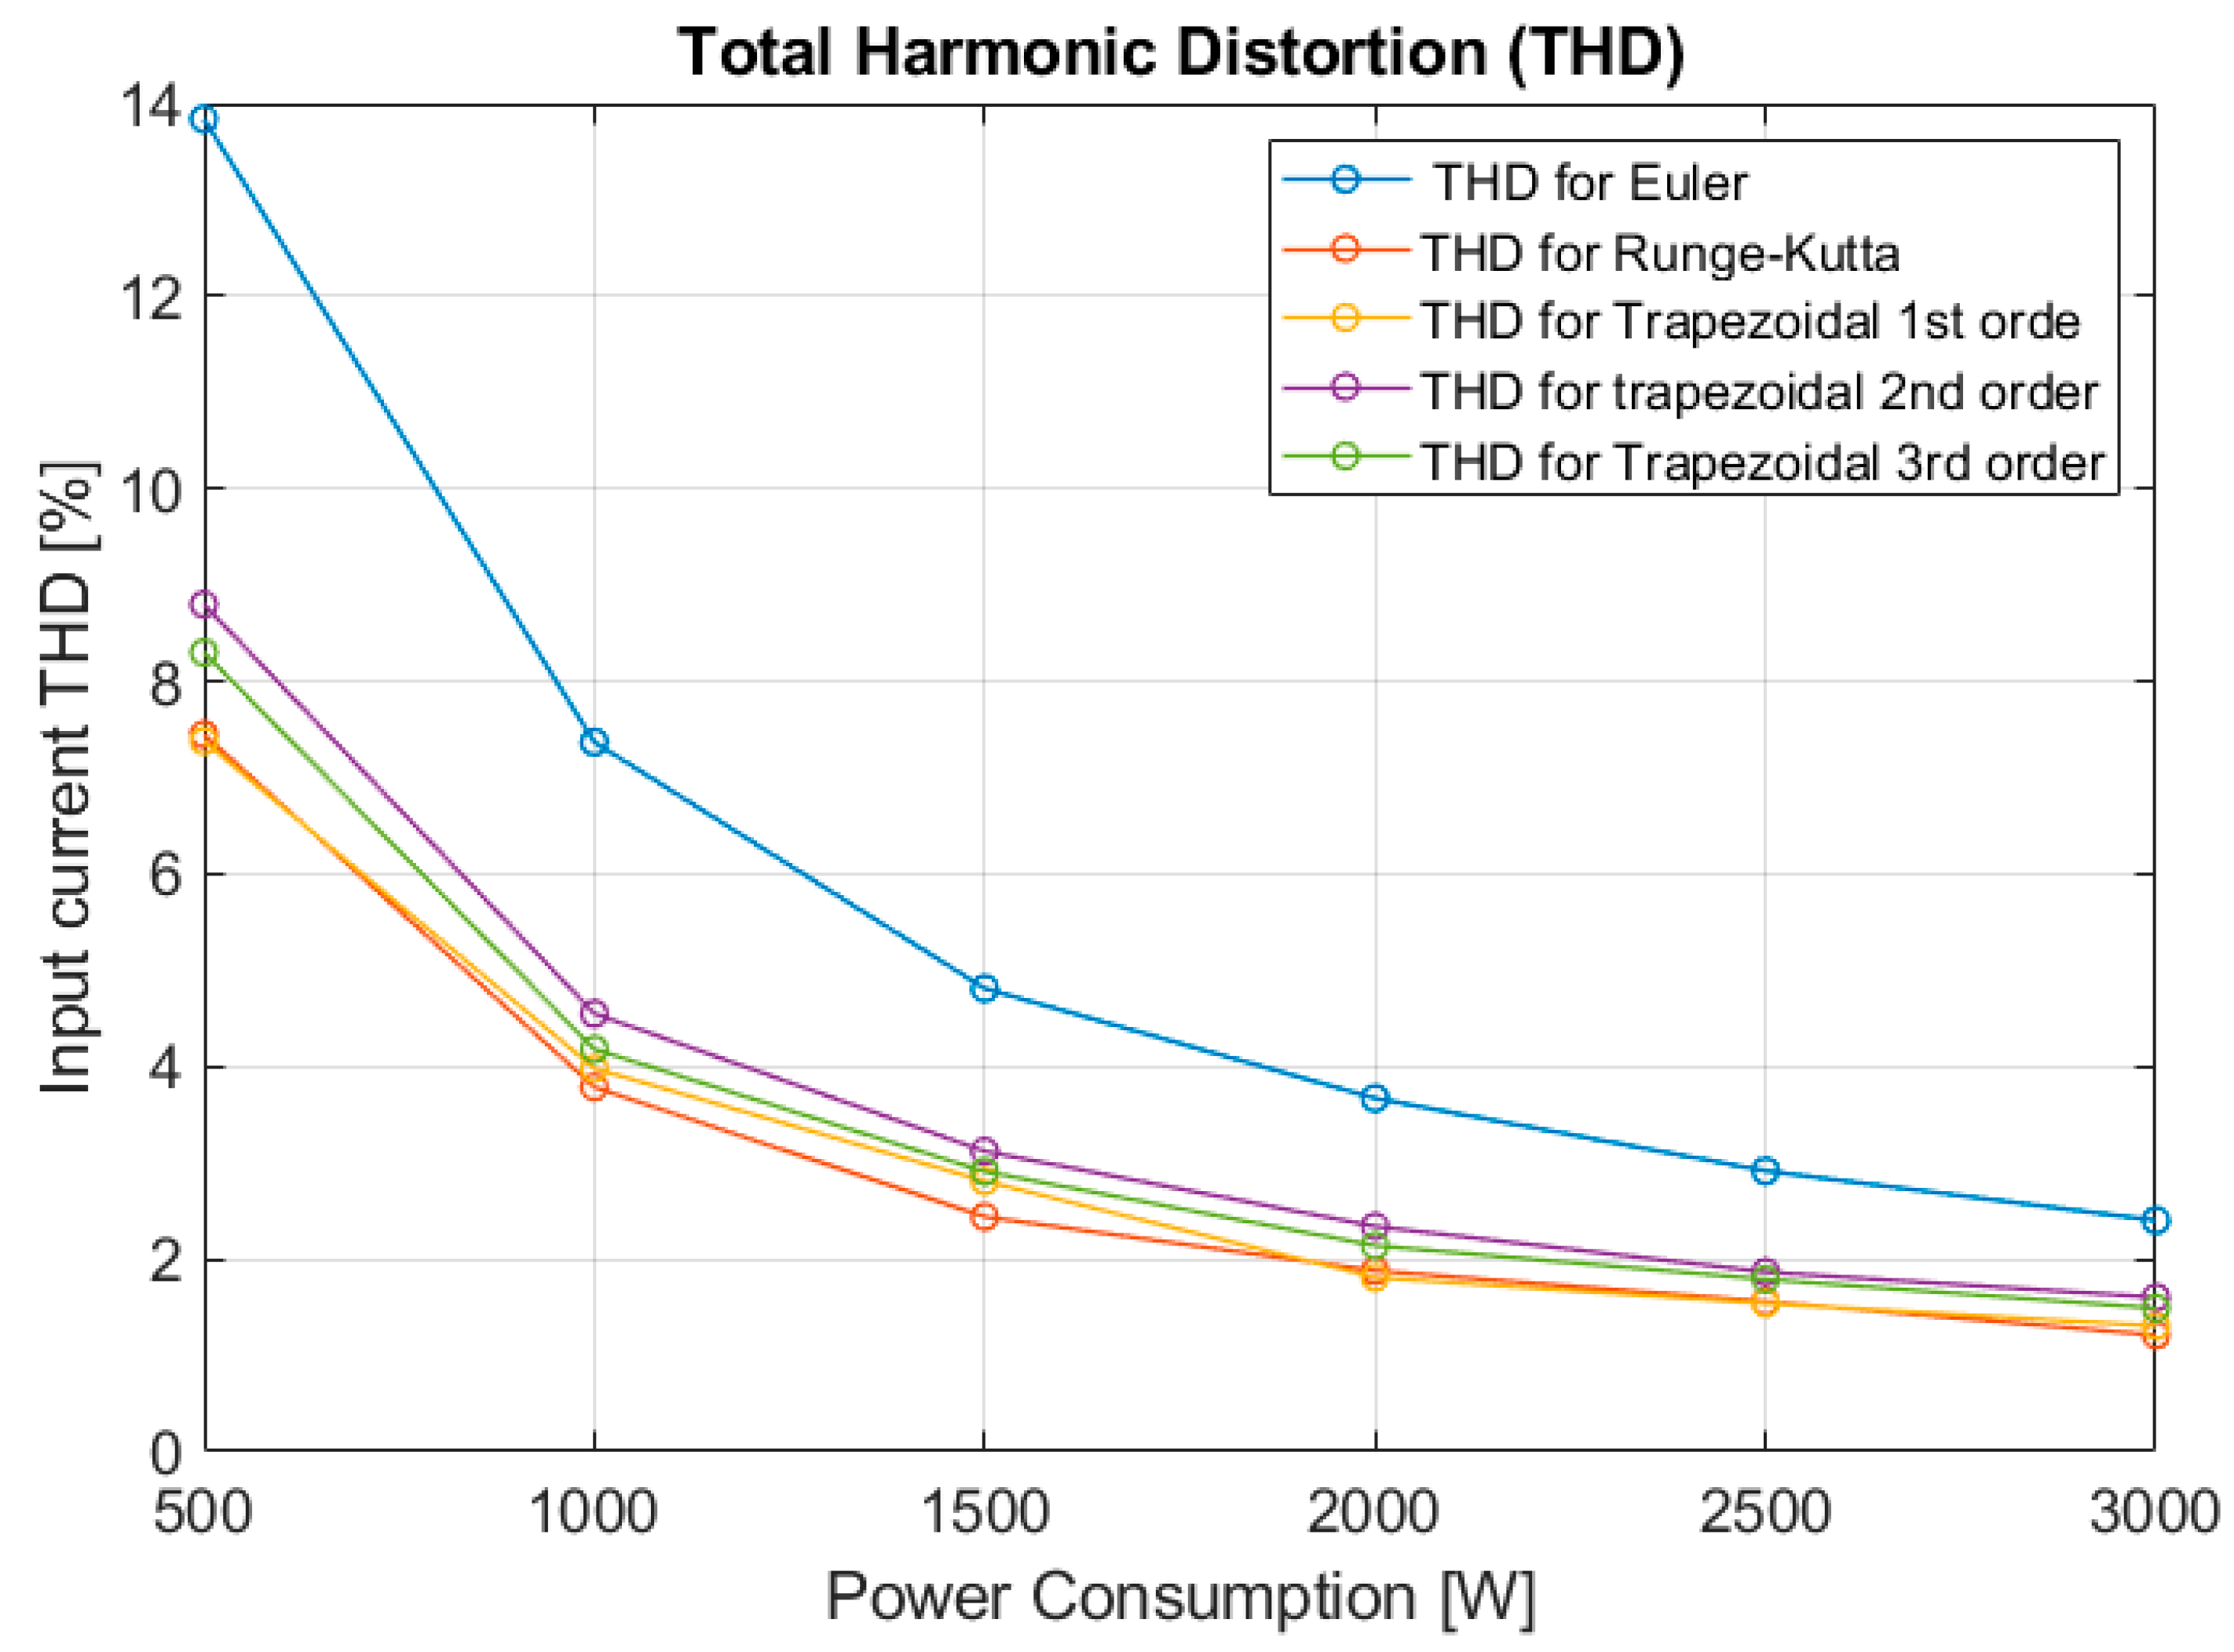
6. Simulation Results
7. Discussion
8. Conclusions
Author Contributions
Funding
Institutional Review Board Statement
Informed Consent Statement
Acknowledgments
Conflicts of Interest
References
- Khazraei, M.; Sepahvand, H.; Ferdowsi, M.; Corzine, K.A. Hysteresis-Based Control of a Single-Phase Multilevel Flying Capacitor Active Rectifier. IEEE J. Emerg. Sel. Top. Power Electron. 2013, 28, 154–164. [Google Scholar] [CrossRef]
- Kobaku, T.; Jeyasenthil, R.; Sahoo, S.; Dragicevic, T. Experimental Verification of Robust PID Controller Under Feedforward Framework for a Nonminimum Phase DC–DC Boost Converter. IEEE J. Emerg. Sel. Top. Power Electron. 2021, 9, 3373–3383. [Google Scholar] [CrossRef]
- Mehreganfar, M.; Hosein-Saeedinia, M.; Davari, S.A.; Garcia, C.; Rodriguez, J. Sensorless Predictive Control of AFE Rectifier With Robust Adaptive Inductance Estimation. IEEE Trans. Ind. Inf. 2019, 15, 3420–3431. [Google Scholar] [CrossRef]
- Satorres-Martínez, S.; De la Casa-Cárdenas, J.; Gámez-García, J.; Gómez-Ortega, J. Position predictive control of an anthropomorphic robotic arm using a time-of-flight camera. IEEE Sens. 2014, 2014, 1718–1721. [Google Scholar] [CrossRef]
- Carron, A.; Seccamonte, F.; Ruch, C.; Frazzoli, E.; Zeilinger, M.N. Scalable Model Predictive Control for Autonomous Mobility-on-Demand Systems. IEEE Trans. Control Syst. Technol. 2021, 29, 635–644. [Google Scholar] [CrossRef]
- Kumar, C.H.; Mishra, M.K. Predictive Voltage Control of Transformerless Dynamic Voltage Restorer. IEEE Trans. Ind. Electron. 2015, 62, 2693–2697. [Google Scholar] [CrossRef]
- Bahrami, A.; Narimani, M.; Norambuena, M.; Rodriguez, J. Current Control of a Seven-Level Voltage Source Inverter. IEEE Trans. Power Electron. 2020, 35, 2308–2316. [Google Scholar] [CrossRef]
- López, M.; Rodriguez, J.; Silva, C.; Rivera, M. Predictive Torque Control of a Multidrive System Fed by a Dual Indirect Matrix Converter. IEEE Trans. Ind. Electron. 2015, 62, 2731–2741. [Google Scholar] [CrossRef]
- Cortés, P.; Wilson, A.; Kouro, S.; Rodriguez, J.; Abu-Rub, H. Model Predictive Control of Multilevel Cascaded H-Bridge Inverters. IEEE Tran. Ind. Electron. 2010, 57, 2691–2699. [Google Scholar] [CrossRef]
- Ramirez-Hernandez, J.; Araujo-Vargas, I.; Rivera, M. An AC-DC converter with trapezoidal predictive controller for wireless electric vehicle applications. In Proceedings of the IEEE International Conference on Industrial Technology (ICIT), Seville, Spain, 17–19 March 2015; pp. 2236–2240. [Google Scholar] [CrossRef]
- Li, X.; Wang, Y.; Guo, X.; Cui, X.; Zhang, S.; Li, Y. An Improved Model-Free Current Predictive Control Method for SPMSM Drives. IEEE Access 2021, 9, 134672–134681. [Google Scholar]
- Cortes, P.; Rodriguez, J.; Quevedo, D.E.; Silva, C. Predictive Current Control Strategy With Imposed Load Current Spectrum. IEEE Trans. Power Electron. 2008, 23, 612–618. [Google Scholar] [CrossRef]
- Huu-Cong, V.; Hong-Hee, L. Model-Predictive Current Control Scheme for Seven-Phase Voltage-Source Inverter With Reduced Common-Mode Voltage and Current Harmonics. IEEE Trans. Emerg. Sel. Top. Power Electron. 2021, 9, 3610–3621. [Google Scholar]
- Shahrouz, E.; Qihong, C.; Liyan, Z. Model Predictive Current Control with Duty Cycle Optimization for Two-Level Three-Phase Grid-Tied Inverter with Output LCL Filter Based on Forward Euler Approximation. In Proceedings of the 2017 International Conference on Industrial Informatics—Computing Technology, Intelligent Technology, Industrial Information Integration (ICIICII), Wuhan, China, 2–3 December 2017; pp. 155–158. [Google Scholar] [CrossRef]
- Viatkin, A.; Hammami, M.; Ricco, M.; Grandi, G. Analysis of a three-phase four-leg front-end converter for EV chargers with Balanced and unbalanced grid currents. In Proceedings of the 45th Annual Conference of the IEEE Industrial Electronics Society (IECON 2019), Lisbon, Portugal, 14–17 October 2019; pp. 3442–3449. [Google Scholar] [CrossRef]
- Dini, P.; Saponara, S. Electro-Thermal Model-Based Design of Bidirectional On-Board Chargers in Hybrid and Full Electric Vehicles. Electronics 2022, 11, 112. [Google Scholar] [CrossRef]
- Ramos, L.A.; Van Kan, R.F.; Mezaroba, M.; Batschauer, A.L. A Control Strategy to Smooth Power Ripple of a Single-Stage Bidirectional and Isolated AC-DC Converter for Electric Vehicles Chargers. Electronics 2022, 11, 650. [Google Scholar] [CrossRef]
- Hongfei, W.; Meng, H.; Kai, S. Dual-Voltage-Rectifier-Based Single-Phase AC–DC Converters With Dual DC Bus and Voltage-Sigma Architecture for Variable DC Output Applications. IEEE Trans. Power Electron. 2019, 34, 4208–4222. [Google Scholar] [CrossRef]
- Jiangfeng, W.; Hongfei, W.; Tianyu, Y.; Li, Z.; Yan, X. Bidirectional Three-Phase DC–AC Converter With Embedded DC–DC Converter and Carrier-Based PWM Strategy for Wide Voltage Range Applications. IEEE Trans. Ind. Electron. 2019, 66, 4144–4155. [Google Scholar] [CrossRef]
- Eun-Su, J.; Sangshin, K.; Taehyung, K. Performance Comparison of Model Predictive Control Methods for Active Front End Rectifiers. IEEE Access 2018, 6, 77272–77288. [Google Scholar] [CrossRef]
- Quevedo, D.E.; Aguilera, R.P.; Perez, M.A.; Cortes, P.; Lizana, R. Model Predictive Control of an AFE Rectifier With Dynamic References. IEEE Trans. Power Electron. 2012, 27, 3128–3136. [Google Scholar] [CrossRef]
- Khalilzadeh, M.; Vaez-Zadeh, S.; Rodriguez, J.; Heydari, R. Model-Free Predictive Control of Motor Drives and Power Converters: A Review. IEEE Access 2021, 9, 105733–105747. [Google Scholar] [CrossRef]
- Huang, Z.; Li, H.; Li, W.; Liu, J.; Huang, C.; Yang, Z.; Fang, W. A New Trajectory Tracking Algorithm for Autonomous Vehicles Based on Model Predictive Control. Sensors 2021, 21, 7165. [Google Scholar] [CrossRef]
- Gutierrez Robles, J.A.; Olmos Gomez, M.A.; Casillas Gonzalez, J.M. Análisis Numérico, 1st ed.; Roig Vazque, P.E., Delgado, R.A.L., Eds.; McGrawHill: Mexico City, México, 2010; Volume 1, pp. 207–217, 247–260. [Google Scholar]
- Thielemans, S.; Vyncke, T.J.; Melkebeek, J. Weight factor selection for model-based predictive control of a four-level flying-capacitor inverter. IET Power Electron. 2012, 5, 323–333. [Google Scholar] [CrossRef]
- Czarnecki, L.S. Instantaneous reactive power p-q theory and power properties of three-phase systems. IEEE Trans. Power Del. 2006, 21, 362–367. [Google Scholar] [CrossRef]
- Rodriguez, J.; Cortes, P. Control of an Active Front-End Rectifier. In Predictive Control of Power Converters and Electrical Drives, 1st ed.; Wiley: Chichester, UK, 2012; Volume 1, pp. 81–98. [Google Scholar]
- Sai, Y.; Jinxia, R.; Zhongxia, L. Learning of Neural Networks Based on Weighted Mean Squares Error Function. In Proceedings of the Second IEEE International Symposium on Computational Intelligence and Design, Changsha, China, 12–14 December 2009; pp. 241–244. [Google Scholar] [CrossRef]


| Switching State | S1 | S2 | S3 | S4 | S5 | S6 |
|---|---|---|---|---|---|---|
| SW1 | 0 | 0 | 0 | 1 | 1 | 1 |
| SW2 | 1 | 0 | 0 | 0 | 1 | 1 |
| SW3 | 1 | 1 | 0 | 0 | 0 | 1 |
| SW4 | 0 | 1 | 0 | 1 | 0 | 1 |
| SW5 | 0 | 1 | 1 | 1 | 0 | 0 |
| SW6 | 0 | 0 | 1 | 1 | 1 | 0 |
| SW7 | 1 | 0 | 1 | 0 | 1 | 0 |
| SW8 | 1 | 1 | 1 | 0 | 0 | 0 |
| Parameter | Value |
|---|---|
| Sampling period Ts | 10 µs |
| Voltage source | 127 Vrms |
| Filer resistor Rs | 0.1 Ω |
| Input filter inductance Ls | 10 mH |
| Source frequency | 60 Hz |
| DC output voltage VDC | 300 V |
| Euler | Runge–Kutta | Trapezoidal 1st-Order | Trapezoidal 2nd-Order | Trapezoidal 3rd-Order | |
|---|---|---|---|---|---|
| MSE for Ts = 10 µs | 0.129520 | 0.232941 | 0.038633 | 0.051673 | 0.051729 |
| MSE for Ts = 100 µs | 3.152851 | 1.894599 | 1.366505 | 3.246525 | 2.574761 |
| Numerical Method | Addition | Multiplication | Division | Cycles Required | Time for the Eight Switching States Evaluation (µs) |
|---|---|---|---|---|---|
| Euler | 3 | 1 | 1 | 328 | 32.8 |
| Runge–Kutta | 9 | 5 | 3 | 986 | 98.6 |
| Trapezoidal 1st-order | 4 | 2 | 1 | 330 | 33 |
| Trapezoidal 2nd-order | 6 | 3 | 1 | 333 | 33.3 |
| Trapezoidal 3rd-order | 8 | 4 | 1 | 336 | 33.6 |
| Euler | Runge–Kutta | Trapezoidal 1st-Order | Trapezoidal 2nd-Order | Trapezoidal 3rd-Order | |
|---|---|---|---|---|---|
| Exactitude | ✔ | ✔ | ✔ | ✔ | |
| Simplicity | ✔ | ✔ | |||
| Fast processing time | ✔ | ✔ | ✔ | ✔ | |
| Low THD | ✔ | ✔ |
Publisher’s Note: MDPI stays neutral with regard to jurisdictional claims in published maps and institutional affiliations. |
© 2022 by the authors. Licensee MDPI, Basel, Switzerland. This article is an open access article distributed under the terms and conditions of the Creative Commons Attribution (CC BY) license (https://creativecommons.org/licenses/by/4.0/).
Share and Cite
Ramirez-Hernandez, J.; Juarez-Sandoval, O.U.; Hernandez-Gonzalez, L.; Cortes, D.; Sanchez-Garcia, J.C.; Guevara-Lopez, P. Performance Comparison of Numerical Methods in a Predictive Controller for an AC–DC Power Converter. Mathematics 2022, 10, 2818. https://doi.org/10.3390/math10152818
Ramirez-Hernandez J, Juarez-Sandoval OU, Hernandez-Gonzalez L, Cortes D, Sanchez-Garcia JC, Guevara-Lopez P. Performance Comparison of Numerical Methods in a Predictive Controller for an AC–DC Power Converter. Mathematics. 2022; 10(15):2818. https://doi.org/10.3390/math10152818
Chicago/Turabian StyleRamirez-Hernandez, Jazmin, Oswaldo Ulises Juarez-Sandoval, Leobardo Hernandez-Gonzalez, Domingo Cortes, Juan C. Sanchez-Garcia, and Pedro Guevara-Lopez. 2022. "Performance Comparison of Numerical Methods in a Predictive Controller for an AC–DC Power Converter" Mathematics 10, no. 15: 2818. https://doi.org/10.3390/math10152818