

Design of Space Efficient Electric Vehicle Charging Infrastructure Integration Impact on Power Grid Network


1
Department of Electronics and Communication Engineering, Indian Institute of Information Technology Kottayam, Kerala 686635, India
2
Big Data and Machine Learning Lab, South Ural State University, 454080 Chelyabinsk, Russia
3
Energy Engineering Department, Technical College of Engineering, Duhok Polytechnic University, Duhok 42001, Iraq
4
College of Technical Engineering, The Islamic University, Najaf 54001, Iraq
*
Authors to whom correspondence should be addressed.
Mathematics 2022, 10(19), 3450; https://doi.org/10.3390/math10193450
Submission received: 26 July 2022
/
Revised: 5 September 2022
/
Accepted: 12 September 2022
/
Published: 22 September 2022
(This article belongs to the Special Issue Optimization and Control in Energy Management: Mathematical Modeling and Simulation)
Abstract
:With an ever-increasing number of electric vehicles (EVs) on the roads, there is a high demand for EV charging infrastructure. The present charging infrastructure in the market requires a lot of space and sometimes leads to traffic congestion, increasing the risk of accidents and obstruction of emergency vehicles. As the current infrastructure requires ample space, the cost of setting up this charging infrastructure becomes very high in metropolitan cities. In addition, there are a lot of adverse effects on the power grid due to the integration of EVs. This paper discusses a space-efficient charging infrastructure and multi-agent system-based power grid balance to overcome these issues. The proposed multi-level EV charging station can save a lot of space and reduce traffic congestion as more vehicles can be accommodated in the space. Depending on the size, capacity, and type of multi-level vehicle charging system, it can serve as a reliable charging solution at sites with medium and high daily footfall. We integrated the EV charging station with IEEE 33 bus test system and analyzed the grid and charging stations. The proposed scheme is exhaustively tested by simulation in a discrete-time event simulator in MATLAB and analyzed with varying EV arrival rates, time periods, etc.
MSC:
93C951. Introduction
Energy management is one of the major challenging tasks in this fast-changing world. The concept of the smart grid has brought a new change in the utilization of technology. However, on the other hand, the massive increase in the demand for production and managing the optimized energy within the grid structure is one of the significant issues with which the R&Ds are currently engaged. Not only within the intelligent grid network but also with the other minor ancillaries attached to the grid structure that accurately measure the energy utilization within the grid. Thus, the increase in Demand for Energy is one of the significant issues that is needed to be addressed [1]. In addition, EV charging stations help the industry optimize its grids’ load management. It can also be used to aid the utilities in managing peak demand.
On the other hand, the smart grid (SG) also handles the demand response of the industrial and residential load. Thus, the management facility deployed in the SG Network should be strong enough to provide constant optimized power output. It should also be capable of monitoring and rectifying itself in case of any malfunction.
Recently, integrating electric vehicles with the smart grid network has been one of the standard techniques used to conserve energy. The SG network [1,2] is a combination of various distributed systems and functions such as Advanced Metering Infrastructure (AMI), Distribution Automation (DA), and Distributed Management System (DMS), which all integrate to produce the most optimized power flow. Load flow management is also another vital management technique. Especially when the EVs are integrated with the grid structure, the demand for electricity reaches its peak demand. Thus, monitoring the load at various times during the day is necessary, ensuring the overload condition is not reached. Similar load management techniques should be well implemented at various stages of the grid for constant load monitoring. The conventional load management techniques in the SG network are not well suited. Advanced load management techniques such as distributive load response (DLR) and advanced metering infrastructure (AMI) are integrated for the more intelligent operation of the network [3,4]. Thus, the SG greatly depends on the design, development, and integration of advanced devices and techniques for its efficient performance. Integrating the charging stations with the smart grid contributes to load management techniques and provides ample opportunity for research in this domain.
One of the biggest issues in crowded metropolitan areas is the space due to the increased population. There is no extra space for creating the charging infrastructure, and it may become complicated to create one in the future. Therefore, this paper proposes on-demand space-efficient multi-level EV charging station infrastructure for metropolitan cities. We have integrated the novel structure of the infrastructure with the 33-bus power grid for power transaction, load management, and power grid network balance. A novel methodology, that is, a multi-agent system, is deployed on each bus and charging station to collect, share and analyze various power system parameters. The analyzed parameters are used to control and maintain the stability of the power grid. The multi-level charging infrastructure’s stress and displacement analysis has been done, and the cost analysis of the proposed infrastructure has been discussed. Developed the analytical model of the proposed method, optimization problem is formulated and is solved using the Genetic algorithm, and simulation has been conducted with varying parameters such as arrival rates, service rates, and the number of charging points available at the charging station.
The rest of the paper is organized as follows: Section 2 presents the literature review in which a discussion on existing studies is given. Section 3 provides an overview of the charging stations. Section 4 provides the detail of the proposed approach. Section 5 provides a discussion on the cost analysis of multi-level charging stations. Section 6 provides a brief discussion on the stress analysis of the designed structure. Section 7 provides a discussion on the mathematical modeling of the proposed multi-level EV 344 charging station infrastructure. Section 8 details the simulation study and result analysis. Section 9 concludes the article.
2. Related Works
This section presents the smart grid network and EV charging station as follows:
2.1. Smart Grid Network
A traditional grid generally works as a medium and distribution hub for electricity transmission from the distribution station to the end-users. The grid model is based on the principle of electromagnetism, with few sensors and a manual degree of control. The efficiency of the system thus becomes low during the high demand. Moreover, the system’s reliability and security are very low compared to that of the other system [5]. The major drawback of the system is the manual distributing mechanism. The flexibility and the extension of the system thus become much more difficult.
However, the Smart Grid solves all the drawbacks mentioned above. It is an intelligent distributed electrical network that operates in an automated mode. The reliability, flexibility, security, sustainability, and efficiency are much more as compared to the conventional grid [6]. Moreover, the Smart Grid provides two-way communication, numerous sensors, self-diagnostics capabilities, and remote monitoring facilities.
The application of power electronics in the intelligent grid is off to a vast extent. Hence, the issue of the EMI in the current flow increases rapidly. The EMI issues in the smart grid have been reported to depend upon the magnitude of fault currents, their flowing paths, and harmonic contents. This interference may degrade the devices’ efficiency and the system [7]. Moreover, the EMI sources coupling into a nearby device may also cause EMI radiations and lead to cascading effects. Thus, minimizing the EMI effect is one of the most critical issues to be handled in the SG network. When the circuit space becomes preferable, the size of the EMI filters can be reduced in proportional order and can be conducted simply by increasing the switching frequency of the filters. The smart meter is an important content of the Smart Grid Network. It works on the principle of the communication infrastructure to monitor real-time energy consumption and either distribute or optimize the energy per consumption. It consists of the micro-controller unit, metering chips, voltage converter, current converter, and peripheral circuit. The intelligent meters generally operate at the end-user level, primarily via LAN. Thus, a significant source of EMI issues is reported via the transmission line that causes transmission error, loss of message, and delay in the communication channel. The power Line Communication (PLC) system is the unique technology that makes the smart grid better than the others. It offers a modeling solution by importing bit error rates into the system via various architectures. The high-speed transmission with real-time bill generation, data processing, fault diagnostics, and reporting makes the PLC in the Smart grid a most crucial component. The PLC operates at a very high frequency, which might lead to EMI issues. As a result, the signal propagating generates multiple impulsive and stationary noises [5,8]. The recent Ultra-wideband (UWB) pulse transmission technique shows lower power spectral density lowers the EMI in the channel approximately by 10 dB as compared to other modulation schemes. Another important electromagnetic issue concerns the intelligent grid’s AC transmission system. The current switching is one of the major sources of the generation of interferences and noises in the channel. The AC transmission consists of components such as a DC-AC inverter, setup transformer, harmonic blocking transformer, and associated hardware control. Operating at a high frequency with constantly switching with the demand response gives rise to high electromagnetic disturbances. Thus, some techniques such as a thyristor-switched capacitor, static synchronous compensators along with the use of passive filters, and active filters can be used to reduce the EMI issues. The intelligent grid network plays a significant role in the electric vehicle market. EVs and PHEVs have entered the market and are gaining significant importance. The charging infrastructure of the battery of the electric vehicles and meeting the energy demand is an essential aspect of the smart grid. The intelligent meter fixed at various levels determined the grid’s capacity. Integrating the smart grid with the battery charging system without any compatibility issues is one of the significant challenges. The public charging station must be deployed in optimum numbers and be integrated with the grid network. The cost of the operation should also be optimized to meet the daily needs of the standard public [9,10]. The cost of operation is the last factor that should be considered. The policy formation and the implementation should be conducted in a secure manner that provides the optimum operating cost [11,12]. The detailed related works reflect the major issues of the intelligent grid network, which are to be addressed. This work implements and analyses the power flow results through the smart grid. The various algorithms, network structure, and operating technology are being modeled, and the results are discussed and analyzed.
2.2. EV Charging Stations
The paper [8] talks about the various charging connector types and presents the comparison between the American and European standards. In addition, the paper discusses the various energy storage systems and how to incorporate them with charging stations. A useful ESS for linking fast EV charging stations might be considered a system that includes batteries and ultra-capacitors: the first for their high energy densities and the second for their high power density. The paper [9] presents a novel design strategy for rapid EV charging stations on a round motorway that takes into account spatial and temporal mobility habits. The planning approach is divided into three parts: an EV charging point spatial-temporal model, a placement determination model, and a capacity determination model. The established planning approach not only precisely determines the most ideal sites for EV charging stations while taking into account the travel convenience of EV users, but also minimizes the total cost. The paper [10] presents a data-driven robust EV charging infrastructure design strategy for residential car parks that takes into account the uncertainty of future EV charging behavior. For more realistic modeling of individual billing behavior, the suggested data-driven system makes use of real-world identity unit data and a queuing mechanism. The non-parametric estimation of charging power probability density may be derived by aggregating EV individuals. Following that, a distributionally robust optimization strategy for planning EV infrastructure under stochastic charging demand and maximum queue time is devised. The paper [11] proposes a business case for a battery switching station as well as an optimization model. Customers’ complaints about long charging periods and range anxiety can be alleviated with the BSS. The BSS not only benefits users financially, but it also benefits the electrical system by participating in electricity markets and avoiding or postponing costly infrastructure changes. To be profitable, the BSS must ensure that the fees it collects, the risk it takes of failing to satisfy its clients, and the discounts it offers are all correctly constructed. The author of the paper [12] implements a periodic fluid model to represent charging operations at a BSS with time-varying demand for battery swap and time-varying prices for charging empty batteries, with the goal of determining the best battery purchasing and charging policy that best trades off battery investment cost and operating cost, including charging cost and customer waiting for cost. The authors of the [13] focus on a design concept and methodology for promoting EV adoption by automated battery pack switching at battery sharing stations as part of a battery sharing network, which would become an integral element of the smart grid. In addition, the advantages and disadvantages of traditional battery swapping were also discussed. The authors in [14] focus to address the issue of optimally locating charging stations in metropolitan environments. There are two optimization criteria used: maximization of reachable households and minimization of overall e-transportation energy cost. Mixed integer programming with linear and nonlinear energy-aware constraints is utilized to make decisions in both scenarios. A multi-objective optimization model is also offered, which addresses both criteria (number of reachable homes and transportation energy) at the same time. The author of the paper [15] describes the development of a universal inductive charger (UIC) for electric vehicles. The suggested UIC can provide a constant or regulated charging voltage to various EVs thanks to a wide range of magnetic coupling between the transmitting and receiving coils. Zero-voltage switching of the primary dc-ac inverter is universally realized in every charging cycle with a series-connected LC circuit. To automatically pick the best frequency in varied coupling situations and modify the frequency during the charging process, a simple and very effective control mechanism based on a variety of frequencies is used. The proposed system has advantages: Universal application, adaptive frequency, effective V and I sensing, and high efficiency. The authors in the paper [16] presented a cost-effective vehicle charging technique particularly designed for smart homes/buildings with a PV(solar panels) system is presented and developed. They suggested a smart algorithm for electric vehicle charging which can be used for smart homes/buildings and is divided into two stages: the photovoltaic output and power consumption prediction, and scheduling of EV charging. The prototype application for the home/building that has been created can give EV charging schedules based on customer preferences. This paper [17] discusses the challenges of electric vehicle charging infrastructure and also discusses the Indian Government policies. The paper also discusses the basic guidelines and standards to install public charging stations as described by the Ministry of Power and the Ministry of housing and urban affairs. Table 1 provides a brief comparison of relevant existing works with the current work.
3. Overview of Charging Stations
EVs have battery capacity with them, which, depending on the size and capacity of the battery pack, require charging from time to time. The charging need is determined by the type of vehicle (two-wheeler, three-wheeler, four-wheeler, and bus), as well as the utilitarian purpose (passenger or commercial). By 2030, the Indian Government wants to electrify 30 percent of private automobiles. This goal necessitates the simultaneous deployment of charging stations across India. Table 2 provides a comparison of charging stations.
Electric vehicles in India are currently separated into two-wheelers, passenger cars, and commercial vehicles (Buses and three-wheelers). Two-wheelers have compact batteries that can be removed and carried to homes, businesses, or stores to be charged using standard wall sockets; alternatively, they may be linked to any public charging station. Three-wheelers are excellent candidates for battery replacement. In this concept, batteries are charged in a big industrial-scale facility and trucked to three-wheeler concentration sites, where a 3-wheeler driver can exchange the used battery with a fully charged one. Swap stations can also be installed at a PCS by technology owners. Three-wheelers may be taxed at any PCS. Buses with batteries larger than 100 kWh would be sold with the battery manufacturer’s approved proprietary charging standards. These batteries will set you back many million rupees, and charging them from any PCS is not recommended. The charging devices supplied (or recommended) by the bus manufacturer will be installed at bus depots and bus depots as needed by bus operators. Currently available electric car batteries range in size from 11 kWh to 40 kWh.Fast charging is required for these EVs. The issue of EVSE interoperability between different EV types is basically limited to automobiles. In this paper, we are mainly focusing on the charging infrastructure for electric cars.
3.1. Electric Vehicle Charging Infrastructure in India
Currently, in India, the electric vehicle charging infrastructure is mainly divided into Battery Swapping and Charging the Battery which is further divided into AC (slow) Charging and DC (fast) Charging. In the case of alternating current charging, alternating current is provided to the electric car’s onboard charger, which converts AC to DC and is then used to charge the vehicle battery. DC charging, on the other hand, converts AC to DC at the charge point and feeds DC straight to the car battery. Based on the
- Home Charging: Home chargers commonly use a 230 V/15 A single-phase socket with a maximum output capacity of 2.5 kW. Home charging is clearly an AC (Alternating Current) charging method. The amount of electricity used is factored into the home-metering system. The time it takes to charge an electric vehicle is determined by the charging rate and the quantity of charge necessary (which is determined by the battery’s usable capacity). Electric scooters can be charged in 2–3 h and electric cars in 6–7 h using home charging.
- Public Charging: Public charging means charging the electric vehicle outside the home. For example charging the vehicle either in the supermarket, cinema hall, retail parks, etc.
- Battery Swapping: The electric vehicles swap their drained batteries with fully recharged batteries. The Battery Swapping concept decouples battery charging from vehicle use, which benefits both the swapping station operator and the power system. No rapid charging is necessary, and electrical grid management is straightforward [11].
3.2. Types of Chargers
- Type 1 AC Charger: This is the most basic EV charger, which is used by some entry-level electric vehicles. It may charge a vehicle slowly using an AC outlet or a home charging system. It has a charging power of up to 220 volts and a maximum current of 16 amps. It can handle up to 3 kW of single-phase input electricity. When using these types of chargers, the vehicle must convert AC electricity to DC, which is a time-consuming procedure.
- Type 2 Charger: The Type 2 Charger can charge at a quicker rate and works with both AC and DC charging methods. These chargers are designed to work with three-phase power systems. In European charging stations, it’s fairly frequent. With a 400 volt AC supply, it can handle input power ranging from 7.4 kW to 43 kW. These chargers are also commonly installed in EV owners’ houses for faster charging periods because they are compatible with vehicles that use CCS connections.
- CCS or Combined Charging System: With new-generation electric vehicles, a combination charging system plug, often known as a CCS type plug (or CCS Type 2), is becoming more widespread. These charging systems are capable of offering DC fast-charging for cars from commercial charging stations as well as standard charging from home charging stations. For DC rapid charging, the plug contains two additional contact points. Input power for most DC fast chargers is 50 kW, however, this type of socket can handle charge power of up to 350 kW.
- CHAdeMo Charger: It was developed by Nissan, Tokyo Electric Power Company (TEPCO), Mitsubishi, Subaru, and Toyota and was first deployed in Japan [34]. This was one of the first fast-charging systems to be created, and it is now used in over 70 nations across the world. It can handle up to 50 kW of DC fast charging [35]. Newer automobiles, on the other hand, are converting to the CCS system since it is more versatile.
- GB/T Charger Under the Bharat DC 001 standard, the Indian Government suggested the GB/T type charger for EVs. These chargers, which were erected by the government’s Energy Efficiency Services Limited (EESL), are capable of DC fast-charging with a 10–15 kW output for low-power EVs. On the other hand, this sort of connector can handle capacities of up to 230 kW.
4. Proposed Space Efficient Multi-Level Charging Station Infrastructure Method
In the past decade, there has been a significant upward trend in the use of electric vehicles or EVs mainly because of the idea, that as this number goes higher we need infrastructure in place that can deliver the necessary power and electricity and also at the same time decreasing the operating costs of the said infrastructure. In metropolitan areas, creating extra infrastructure there is a necessity of space and it has become one of the biggest issues. Therefore, to provide a temporary charging station, especially at the shopping mall, big shops, etc. Hence, this can be achieved with a multi-agent system (MAS) and multi-level charging system, especially in metropolitan cities all over the world.
We developed MAS-based multi-level charging system architecture as shown in Figure 1.
Multi-level charging will help in charging more vehicles in the smaller area. This system involves stacking vehicles layer by layer thus requiring less space and greatly helping in reducing traffic congestion. Making the system automated would require less manual intervention, thus reducing damage and cost. Figure 2 shows that the EV or battery is connected as a load to each of the busses in the 33-bus power grid network. Each bus is also connected with a Multi-Agent System (MAS) and this MAS with the help of IoT Technology transmits the data from the bus and over to the cloud and it is further routed to the main/central MAS moves the data to the edge computing technology involved. When the data are transmitted to the central MAS it is processed through edge computing, this way we can save on computation costs and also use minimal hardware, this can make the whole system much cheaper. In this case, there are a few conditions that must be met to declare the bus stable or unstable, that decision is taken here.
Figure 3 shows the different components used while designing the architecture of the proposed system, such as socket, charging kiosk with cable and connector gun, and charging kiosk connected with the socket.
Implementation of an EV Charging Station with 33-Bus Distribution Network
Figure 2 is designed and implemented in Matlab/Simulink environment by adhering to the following parameters:
- Each bus is connected to the agent, and this agent, in turn, connects to the charging station. Therefore, the agent analysis its respective bus and shares the information with the charging station.
- Every EV/EV battery connected to the station has 40% of the initial state of charge (SoC).
- Every EV has the same battery parameters.
- Each charging station is equipped with similar chargers in order to linearize the distributed observations.
- The simulation assumes a charging station to be operating at 100% capacity in order to make distinct observations.
- Residential/Industrial loads are always connected and running at full power.
- A single three-phase power source powers the entirety of the grid.
Observations and Inferences from IEEE 33-Bus Distribution Network
The following observations made for the above system simulation and their results obtained are presented are as follows:
- Utility grid simulation is conducted with only residential/industrial loads and the charging station kept off. For this scenario, we have observed a stable 3-phase voltage of 9.7 kV as shown in Figure 4a in the grid.Figure 4b shows the reactive power of 11 MW in the system. It is absorbed by harmonic filters and some residential/industrial loads.
- When all CSs are operated at total capacity and no DC Fast Chargers are operated, there is a voltage drop to 8.88 kV as shown in Figure 4c along with the injection of reactive power as shown in Figure 4d in the system which scaled up to −8.5 MW.Total Harmonic Distortion (THD) has been observed that is 1.8% as shown in Figure 5a using the Powergui FFT analysis tool.
- When the simulated charging station’s power draw crossed the 50% capacity threshold, the charger switched to energy stored in battery banks by enabling DCFCs at half time of simulation, and there is a significant drop of reactive power to −9.6 MW has been observed as shown in Figure 5b and a considerable increase in voltage of 9.25 kV has been observed as shown in Figure 5c. This increased the grid’s power quality significantly. A substantial decline in THD that is, 1.17%. This decline is due to the disconnection of chargers at the instance of time as shown in Figure 5d.
- To reduce harmonics, we developed two advanced doubly-tuned passive harmonics filters in the grid. These filters consist of a circuit formed by inductance, capacitance, and resistances. The intended design was shown to observe an optimal amount of reactive power from the grid which decreases the harmonics distortion. By using this, we observed a drop to 0.07% in THD as shown in Figure 6 as compared to 1.8% THD without a filter. This falls within the range of acceptable limits of both THD and reactive power as shown in Figure 5a.
Figure 7a shows the simulation results when there is no multiagent system (MAS) in the power distribution or grid network which is resulted in the instability at bus 20.
Figure 7b shows a stable bus that is due to the deployment of MAS at bus 20. Figure 7c shows when we consider all 33-bus in the simulation, one of the bus instability results in the whole power distribution network instability. Figure 7d shows the simulation results when we deploy the MAS to all 33-bus in the distribution network resulting in the stability of the system.
5. Cost Analysis of Multi-Level Charging Station Infrastructure
The cost estimation of the system depends on various factors for example the set-up city location, government norms in that area, the sizing of the system, etc. In the below table we have taken the location as Jaipur city and we have taken our base case as the minimum infrastructure (charger connectors) suggested by the government of India (Table 3).
From Table 3 and Table 4, the total cost of setting up the charging station can be divided into two parts. The first is the capital cost (CAPEX) as shown in Table 3 which is the one-time fixed cost and the second one is the operational cost (OPEX) as shown in Table 4. The CAPEX comes out to be around Rs. 2,955,000 and the OPEX comes out to be around Rs. 972,000.
6. Stress Analysis of the Designed Structure of Multi-Level Charging Station Infrastructre
The structure is made up of mild steel of which Young’s modulus is 220,000 MPa, Yield Strength is 207 MPa and Ultimate Tensile Strength is 345 MPaThe bottom-most surface (1st level) of the system is assumed to be a constraint to the ground and the sidewalls are also assumed to be fixed. The kerb weights of the available electric vehicles range from 1235 N (Tata Tigore EV) to 2595 N (Audi e-tron). So for the stress analysis, we have taken the weight of the car (or load) to be 3000 N.
7. Multi-Level EV Charging Station Infrastructure Model
In this section, we discuss the mathematical modeling of the proposed multi-level EV charging station infrastructure, the optimization model, and to solve the optimization problem GA algorithm is developed.
7.1. Analytical Model
The conceptual framework of EVs queuing model at multi-level EV charging station infrastructure is shown in Figure 9. The state transition diagram of EVs at the charging station is shown in Figure 10. The stochastic model is based on the “” queuing model, where the first M indicates the Poisson distribution for EV arrivals, the second M indicates the Exponential distribution for service time at the charging station, S represents a maximum number of charging sockets at charging stations, and K represents the length of the queue at charging station. In this queuing model, all EVs charging stations have plug-in sockets with identical characteristics, queue access or charging socket service is based on first come first service (FCFS), and the EVs service time depends upon the number of EVs waiting and the amount of time the station takes to charge the vehicle.
In the transition diagram as shown in Figure 10, there are two major functions that will be carried out
- Arrival rate (): .
- Service rate ():
The steady-state probabilities of EVs at multi-level charging stations are denoted as and are given as follows:
where is the utilization of charging points at the charging station. The basic condition in the Little’s theorem and Markov chain is the sum of all the probabilities in the system is equal to one, that is, . Using the above condition we can get as follows:
The average number of EVs in the system is given as
The probability of the charging station is full, that is, the probability of blocking the EVs to get charged at the charging station which is an equal probability that the charging station is in the state K, and is given as
The above Equation is called as Erlang-B formula used for blocking the EVs from charging at the multi-level charging station.
7.2. Optimization Model
The multilevel EV charging station infrastructure planning optimization model depends upon the factors, such as initial construction cost, vehicle retention, EV charging cost, characteristics of the battery, etc.
is the objective function that minimizes the total cost of multi-level charging station infrastructure, that is initial infrastructure cost and EV users’ charging cost.
where K is the set of demands of charging points, refers to a charging point, I is the candidate charging point set, refers to a candidate charging point, is the demand quantity at charging point k, is the EV charging station initial construction cost of level j, is the EV charging station’s unit cost of user, is the level serviceability of the charging station, is the distance between charging point demand k and candidate charging point i, Q is the number of charging station to be constructed, , it is 1 when the charging point i of charging station’s level j, otherwise it is 0, its value is 1 when the users at charging point k and receives service at candidate charging point i, otherwise 0. In the above optimization model, Equation (8) indicates the respective EV users arrive at their respective charging points in the charging station at a particular time. Equation (9) is used to make a candidate’s charging point into the function using prerequisite conditions. Equation (10) is the condition of the charging demands at one station should not exceed its maximum service rate. Equation (11) is developed for constructing only one of the EV charging station levels. Equation (12) is the constraint of the total amount of charging stations that need to be developed. Equations (13) and (14) are variables required for the possible zones.
7.3. GA for Multi-Level Charging Station Infrastructure
To solve the problems described in the previous subsection in Equations (7)–(14), a genetic algorithm (GA) is proposed. The solution of the GA includes the following steps:
- Initialization of population: We have randomly generated the initial population. Here, binary coding is employed, that is 1 means the point is selected to develop the charging station, otherwise 0.
- Estimation of each individual fitness metric. During each scheme performance evaluation, extra work needs to be taken in order to complete the solution, that is all the charging station’s charging demand points should be allocated to the potential station to end the evaluation process.
- Estimating the next generation. For generating qualified offspring, especially the designed crossover and mutation operators are employed.
- Convergence: There are two convergences, either the generated the best fitness out of 50 generations or the limit has reached, the developed algorithm will produce the best individual of that generation as the final output.
8. Simulation and Results Analysis
In this section, we present the simulation results of the proposed system’s M/M/S/K queuing model and objective function using a genetic algorithm.
We have developed and simulated the queuing model in MATLAB. In the simulation, the EVs arrival flow fluctuation is modeled using a Poisson distribution. We presume that all EVPSS have a level 3 plug-in, which is the fastest type of EV charger. We have assumed that the time it takes for the smart grid to respond to each EV is zero and all vehicles must be satisfied once the total charge time has expired. In addition, the charging station’s number of charging kiosks (servers) is expected to be 20.
The simulation demonstrates the performance of the queuing model with varying performance parameters. The blocking probability of the EVs with varying arrival rates, service rates, and the number of charging points available. The number of charging points = NC = {3, 4, 5} for DC fast charging infrastructure (DFCI), On-Road Charging Infrastructure (ORCI), and Multi-level Charging Infrastructure (MLCI) with arrival rates and service rates . As shown in Figure 11, increasing the arrival of DFCI leads to an increase in the probability of blocking and vice versa. We can also notice that the variations are more in the ORCI than in the MLCI. Figure 12 and Figure 13 shows the similar effects. We have solved the objective function using the Genetic Algorithm, the result is shown in Figure 14. The Figure 14 shows that convergence is quick and the solution is optimal.
Table 5 shows the comparisons between existing charging stations (such as on-board, off-board, battery swapping station) and multilevel charging station.
9. Conclusions
This paper developed the space-efficient multi-level charging station infrastructure method for metropolitan cities. A novel design of the multi-level charging station infrastructure has been discussed. The developed design is integrated with the smart grid. 33-bus simulation has been conducted, and a MAS is deployed for each bus to control the grid’s stability. Discussed the observations and inferences of 33-bus with MAS and proved that the system’s stability is maintained with MAS. The cost analysis has been conducted for the new design of the multi-level charging station infrastructure. In addition, the stress analysis of the designed structure is evaluated and verified the maximum stress in the structure is 68.53 MPa and the maximum displacement is 0.06716 mm. Moreover, developing the mathematical model of multi-level EV charging station infrastructure using the M/M/S/K queuing model and critical results analysis have also been carried out. The limitation of this study is that the proposed approach is designed for dense metropolitan areas with high populations, such as Indian metropolitan cities. In the future, the new approach can be designed for less densely populated areas.
Author Contributions
Conceptualization, S.C. and S.K.; methodology, S.C. and S.R.M.Z.; validation, S.C. and A.A.; writing—original draft preparation, S.C. and S.K.; writing—review and editing, S.C. and S.K.; supervision, S.K. All authors have read and agreed to the published version of the manuscript.
Funding
The authors received no external funding.
Institutional Review Board Statement
Not applicable.
Informed Consent Statement
Not applicable.
Data Availability Statement
Data can be made available of request.
Acknowledgments
This work was supported by the Ministry of Science and Higher Education of the Russian Federation (Government Order FENU-2020–0022).
Conflicts of Interest
The authors declare no conflict of interest.
Abbreviations
| EV | Electric Vehicle |
| SG | Smart Grid |
| AMI | Advanced Metering Infrastructure |
| DMS | Distributed Management System |
| PLC | Power Line Communication |
| UWB | Ultra-Wide Band |
| UIC | Universal Inductive Charger |
| MAS | Multi-Agent System |
References
- Colak, I.; Sagiroglu, S.; Fulli, G.; Yesilbudak, M.; Covrig, C.F. A survey on the critical issues in smart grid technologies. Renew. Sustain. Energy Rev. 2016, 54, 396–405. [Google Scholar] [CrossRef]
- Sagiroglu, S.; Terzi, R.; Canbay, Y.; Colak, I. Big data issues in smart grid systems. In Proceedings of the 2016 IEEE International Conference on Renewable Energy Research and Applications (ICRERA), Birmingham, UK, 20–23 November 2016; pp. 1007–1012. [Google Scholar]
- Shadare, A.E.; Sadiku, M.N.; Musa, S.M. BElectromagnetic compatibility issues in critical smart grid infrastructure. IEEE Electromagn. Compat. Mag. 2017, 6, 63–70. [Google Scholar] [CrossRef]
- Young, J.R. Smart Grid Technology in the Developing World, 2017, Honors Projects 68. Available online: https://digitalcommons.spu.edu/honorsprojects/68 (accessed on 25 July 2022).
- Ellis, M. Smart grid: The components and integrating communication. In Proceedings of the 2012 IEEE Green Technologies Conference, Tulsa, OK, USA, 19–20 April 2012; pp. 1–6. [Google Scholar]
- Hu, J.; Saleem, A.; You, S.; Nordström, L.; Lind, M.; Østergaard, J. A multi-agent system for distribution grid congestion management with electric vehicles. Eng. Appl. Artif. Intell. 2015, 38, 45–58. [Google Scholar] [CrossRef]
- Vallejo, D.; Albusac, J.; Glez-Morcillo, C.; Castro-Schez, J.J.; Jiménez, L. A multi-agent approach to intelligent monitoring in smart grids. Int. J. Syst. Sci. 2014, 45, 756–777. [Google Scholar] [CrossRef]
- Bonaiuto, V.; Sargeni, F. A Matlab Simulink model for the study of smart grid—Grid-integrated vehicles interactions. In Proceedings of the 2017 IEEE 3rd International Forum on Research and Technologies for Society and Industry (RTSI), Modena, Italy, 11–13 September 2017; pp. 1–6. [Google Scholar]
- Falvo, M.C.; Foiadelli, F.E.D.E.R.I.C.A. Preliminary analysis for the design of an energy-efficient and environmental sustainable integrated mobility system. In Proceedings of the IEEE PES General Meeting, Minneapolis, MN, USA, 25–29 July 2017; pp. 1–7. [Google Scholar]
- Roscia, M.; Longo, M.; Lazaroiu, G.C. Smart City by multi-agent systems. In Proceedings of the 2013 International Conference on Renewable Energy Research and Applications (ICRERA), Madrid, Spain, 20–23 October 2018; pp. 371–376. [Google Scholar]
- Marra, F.; Sacchetti, D.; Træholt, C.; Larsen, E. Electric vehicle requirements for operation in smart grids. In Proceedings of the 2nd IEEE PES International Conference and Exhibition on Innovative Smart Grid Technologies, Manchester, UK, 5–7 December 2011; pp. 1–7. [Google Scholar]
- Vermesan, O.; Blystad, L.C.; Hank, P.; Bahr, R.; John, R.; Moscatelli, A. Smart, connected and mobile: Architecting future electric mobility ecosystems. In Proceedings of the 2013 Design, Automation & Test in Europe Conference & Exhibition (DATE), Grenoble, France, 18–22 March 2018; pp. 1740–1744. [Google Scholar]
- Lin, S.Y.; Chen, J.F. Distributed optimal power flow for smart grid transmission system with renewable energy sources. Energy 2013, 56, 184–192. [Google Scholar] [CrossRef]
- Li, Z.; Wang, J.; Sun, H.; Guo, Q. Transmission contingency analysis based on integrated transmission and distribution power flow in smart grid. IEEE Trans. Power Syst. 2015, 30, 3356–3367. [Google Scholar] [CrossRef]
- Yang, Q.; Li, D.; Yu, W.; Liu, Y.; An, D.; Yang, X.; Lin, J. Toward data integrity attacks against optimal power flow in smart grid. IEEE Internet Things J. 2017, 4, 1726–1738. [Google Scholar] [CrossRef]
- Liu, G.; Liu, K.; Shi, D.; Zhu, W.; Wang, Z.; Chen, X. Graph computation and its applications in smart grid. In Proceedings of the 2017 IEEE International Congress on Big Data (BigData Congress), Honolulu, HI, USA, 25–30 June 2017; pp. 507–510. [Google Scholar]
- Owerko, D.; Gama, F.; Ribeiro, A. Optimal power flow using graph neural networks. In Proceedings of the ICASSP 2020–2020 IEEE International Conference on Acoustics, Speech and Signal Processing (ICASSP), Barcelona, Spain, 4–8 May 2020; pp. 5930–5934. [Google Scholar]
- Sureshkumar, K.; Ponnusamy, V. Hybrid renewable energy systems for power flow management in smart grid using an efficient hybrid technique. Trans. Inst. Meas. Control 2020, 42, 2068–2087. [Google Scholar] [CrossRef]
- Vogt, M.; Marten, F.; Braun, M. A survey and statistical analysis of smart grid co-simulations. Appl. Energy 2018, 222, 67–78. [Google Scholar] [CrossRef]
- Mohagheghi, E.; Alramlawi, M.; Gabash, A.; Li, P. A survey of real-time optimal power flow. Energies 2018, 11, 3142. [Google Scholar] [CrossRef] [Green Version]
- Sureshkumar, K.; Ponnusamy, V. Power flow management in micro grid through renewable energy sources using a hybrid modified dragonfly algorithm with bat search algorithm. Energy 2019, 181, 1166–1178. [Google Scholar] [CrossRef]
- Montoya, O.D.; Garrido, V.M.; Gil-González, W.; Grisales-Noreña, L.F. Power flow analysis in DC grids: Two alternative numerical methods. IEEE Trans. Circuits Syst. II Express Briefs 2019, 66, 1865–1869. [Google Scholar] [CrossRef]
- Ustun, T.S.; Aoto, Y. Analysis of smart inverter’s impact on the distribution network operation. IEEE Access 2019, 7, 9790–9804. [Google Scholar] [CrossRef]
- Ni, Z.; Paul, S. A multistage game in smart grid security: A reinforcement learning solution. IEEE Trans. Neural Netw. Learn. Syst. 2019, 30, 2684–2695. [Google Scholar] [CrossRef]
- Pohl, O.; Rewald, F.; Dalhues, S.; Jörke, P.; Rehtanz, C.; Wietfeld, C.; Kubis, A.; Tamgue, R.K.; Kirsten, D. Advancements in distributed power flow control. In Proceedings of the 2018 53rd International Universities Power Engineering Conference (UPEC), Glasgow, UK, 4–7 September 2018; pp. 1–6. [Google Scholar]
- Hossain, E.; Khan, I.; Un-Noor, F.; Sikander, S.S.; Sunny, M.S.H. Application of big data and machine learning in smart grid, and associated security concerns: A review. IEEE Access 2019, 7, 13960–13988. [Google Scholar] [CrossRef]
- Kongjeen, Y.; Bhumkittipich, K. Impact of plug-in electric vehicles integrated into power distribution system based on voltage-dependent power flow analysis. Energies 2018, 11, 1571. [Google Scholar] [CrossRef]
- Kappagantu, R.; Daniel, S.A. Challenges and issues of smart grid implementation: A case of Indian scenario. J. Electr. Syst. Inf. Technol. 2018, 5, 453–467. [Google Scholar] [CrossRef]
- Faheem, M.; Shah, S.B.H.; Butt, R.A.; Raza, B.; Anwar, M.; Ashraf, M.W.; Ngadi, M.A.; Gungor, V.C. Smart grid communication and information technologies in the perspective of Industry 4.0: Opportunities and challenges. Comput. Sci. Rev. 2018, 30, 1–30. [Google Scholar] [CrossRef]
- Abdel-Nasser, M.; Mahmoud, K.; Kashef, H. A novel smart grid state estimation method based on neural networks. IJIMAI 2018, 5, 92–100. [Google Scholar] [CrossRef]
- Gupta, S.; Kazi, F.; Wagh, S.; Singh, N. Analysis and prediction of vulnerability in smart power transmission system: A geometrical approach. Int. J. Electr. Power Energy Syst. 2018, 94, 77–87. [Google Scholar] [CrossRef]
- Artale, G.; Cataliotti, A.; Cosentino, V.; Di Cara, D.; Fiorelli, R.; Guaiana, S.; Panzavecchia, N.; Tinè, G. A new low cost power line communication solution for smart grid monitoring and management. IEEE Instrum. Meas. Mag. 2018, 21, 29–33. [Google Scholar] [CrossRef]
- Agundis-Tinajero, G.; Segundo-Ramírez, J.; Visairo-Cruz, N.; Savaghebi, M.; Guerrero, J.M.; Barocio, E. Power flow modeling of islanded AC microgrids with hierarchical control. Int. J. Electr. Power Energy Syst. 2019, 105, 28–36. [Google Scholar] [CrossRef]
- Lei, X.; Yang, Z.; Yu, J.; Zhao, J.; Gao, Q.; Yu, H. Data-driven optimal power flow: A physics-informed machine learning approach. IEEE Trans. Power Syst. 2020, 36, 346–354. [Google Scholar] [CrossRef]
- Muhammad, Y.; Khan, R.; Raja, M.A.Z.; Ullah, F.; Chaudhary, N.I.; He, Y. Design of fractional swarm intelligent computing with entropy evolution for optimal power flow problems. IEEE Access 2020, 8, 111401–111419. [Google Scholar] [CrossRef]
Figure 1.
Multi-Level EVs Charging Design CAD Model.

Figure 2.
EV Charging Stations with 33-bus Distribution Network.
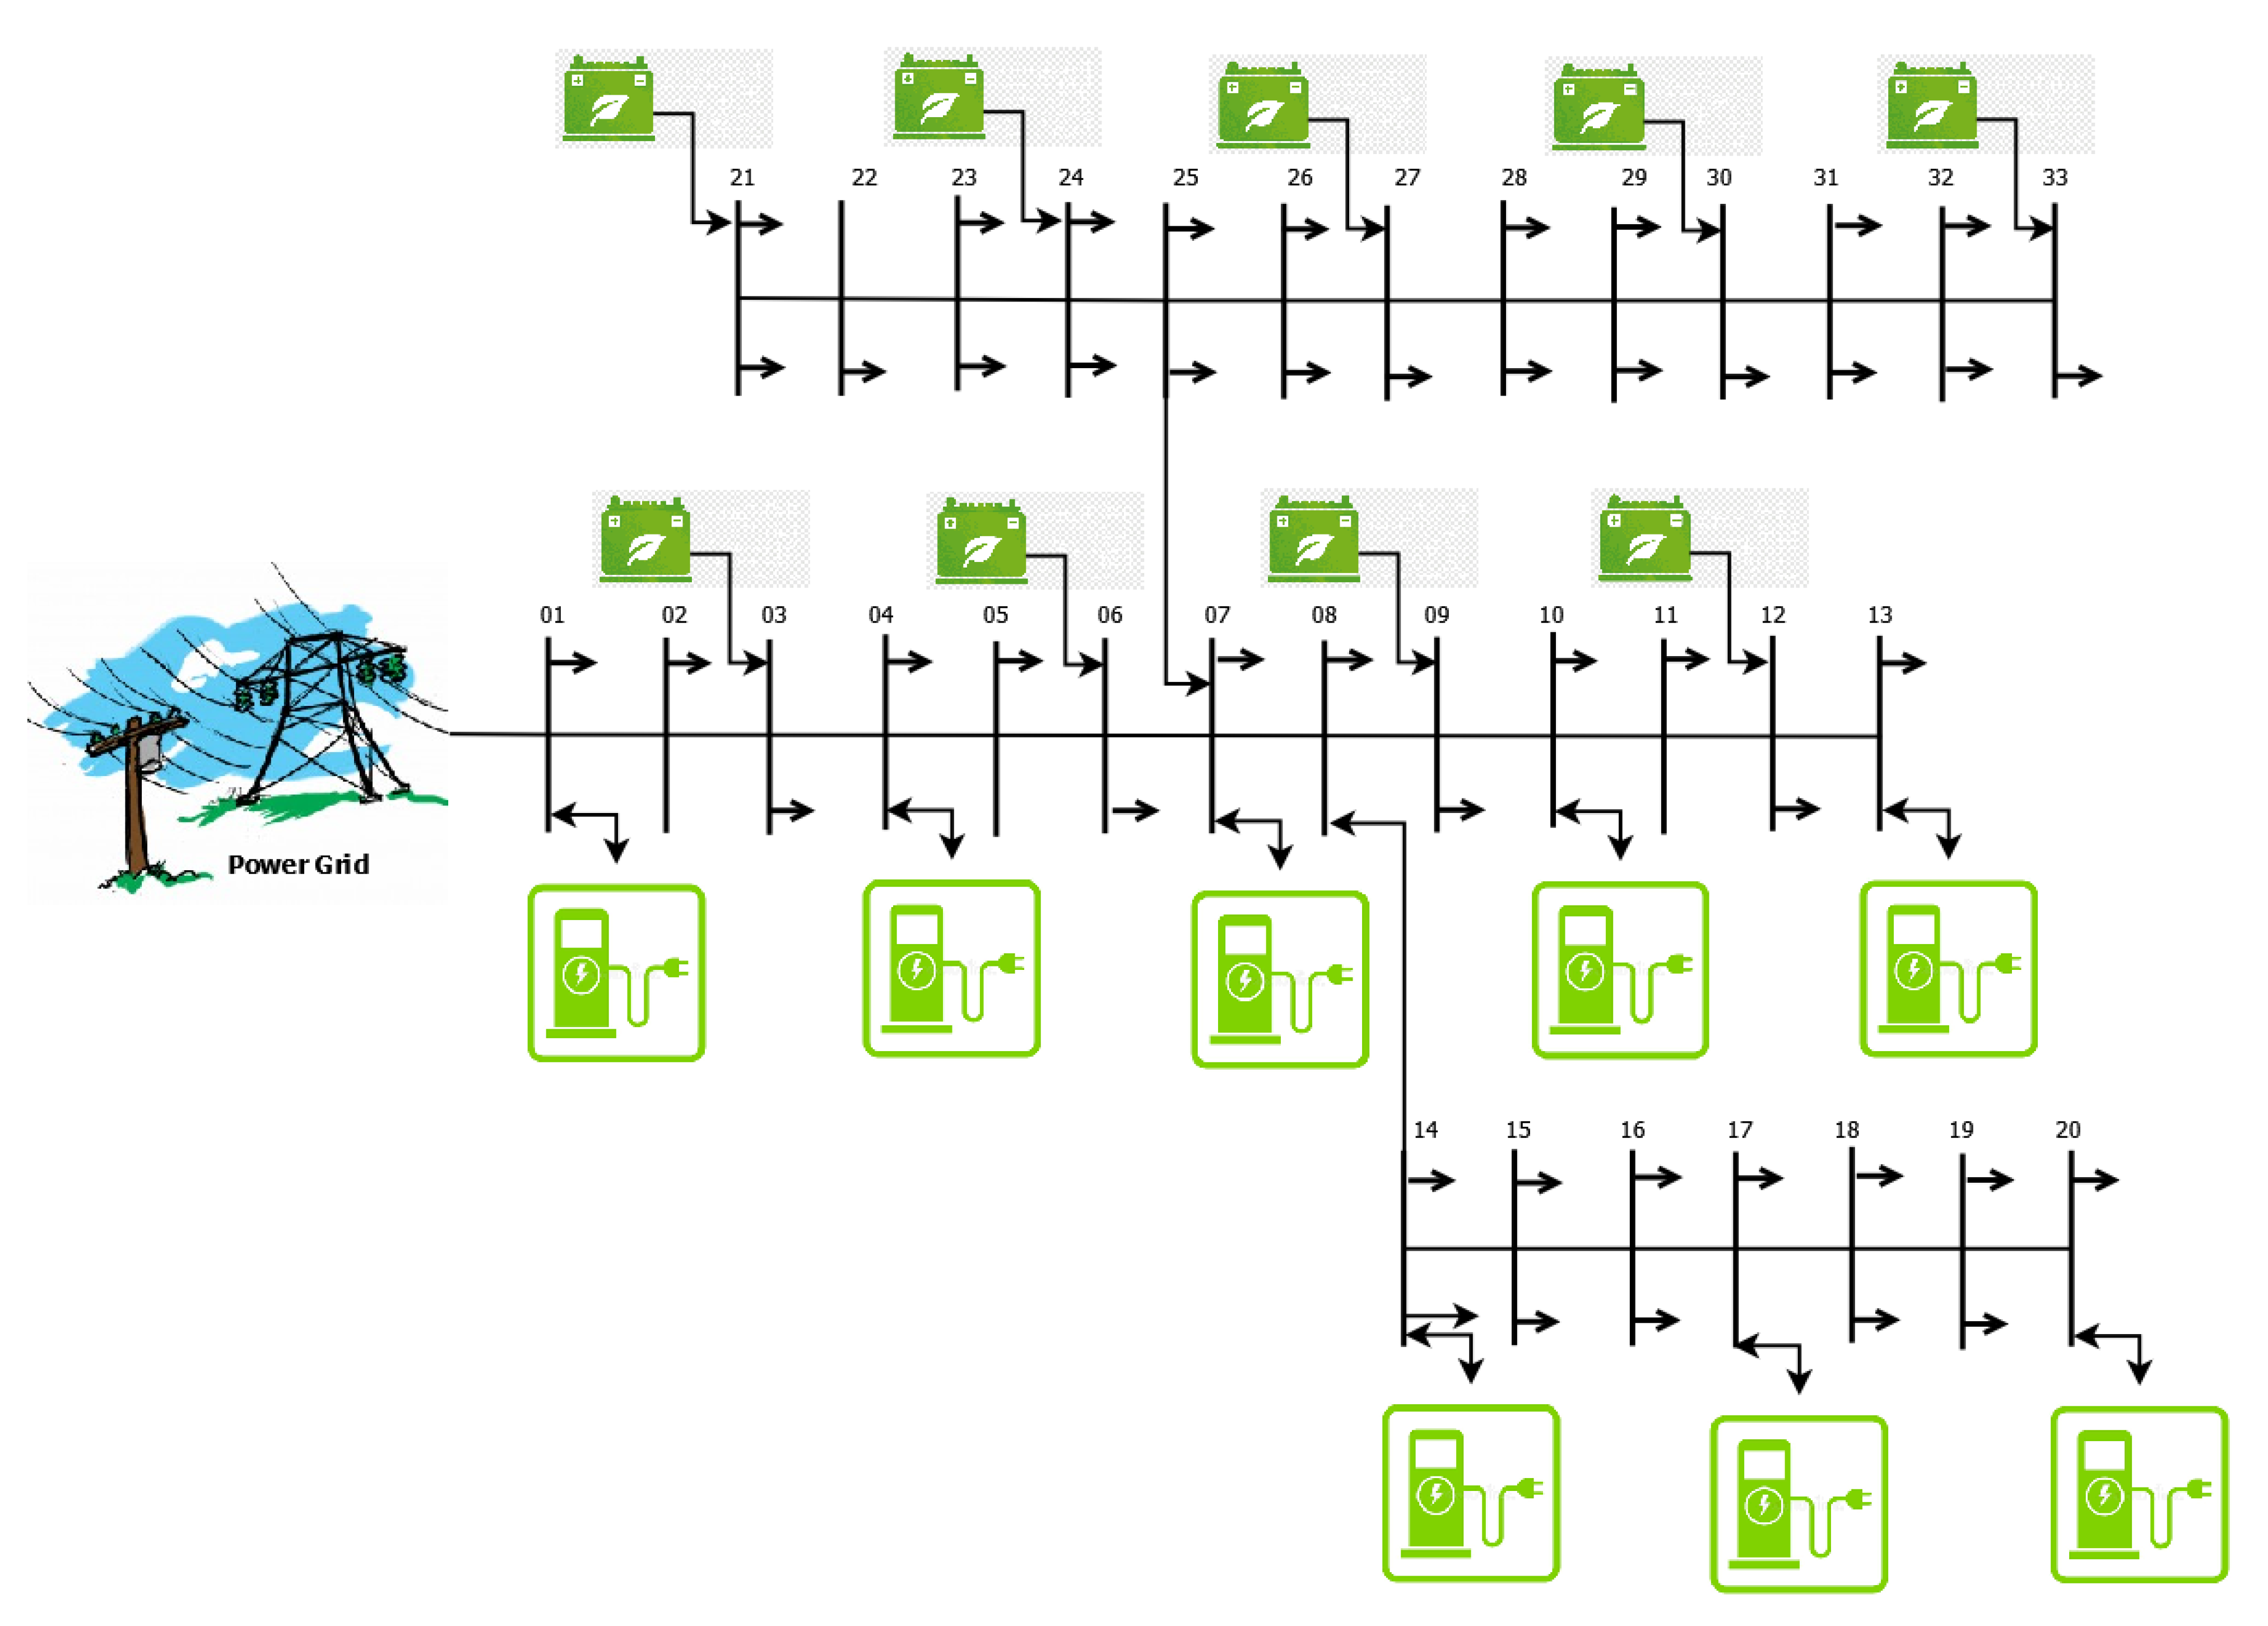
Figure 3.
Charging System Entities. (a) Socket. (b) Charging Kiosk with cable and connector gun. (c) Charging kiosk connected with socket.
Figure 3.
Charging System Entities. (a) Socket. (b) Charging Kiosk with cable and connector gun. (c) Charging kiosk connected with socket.
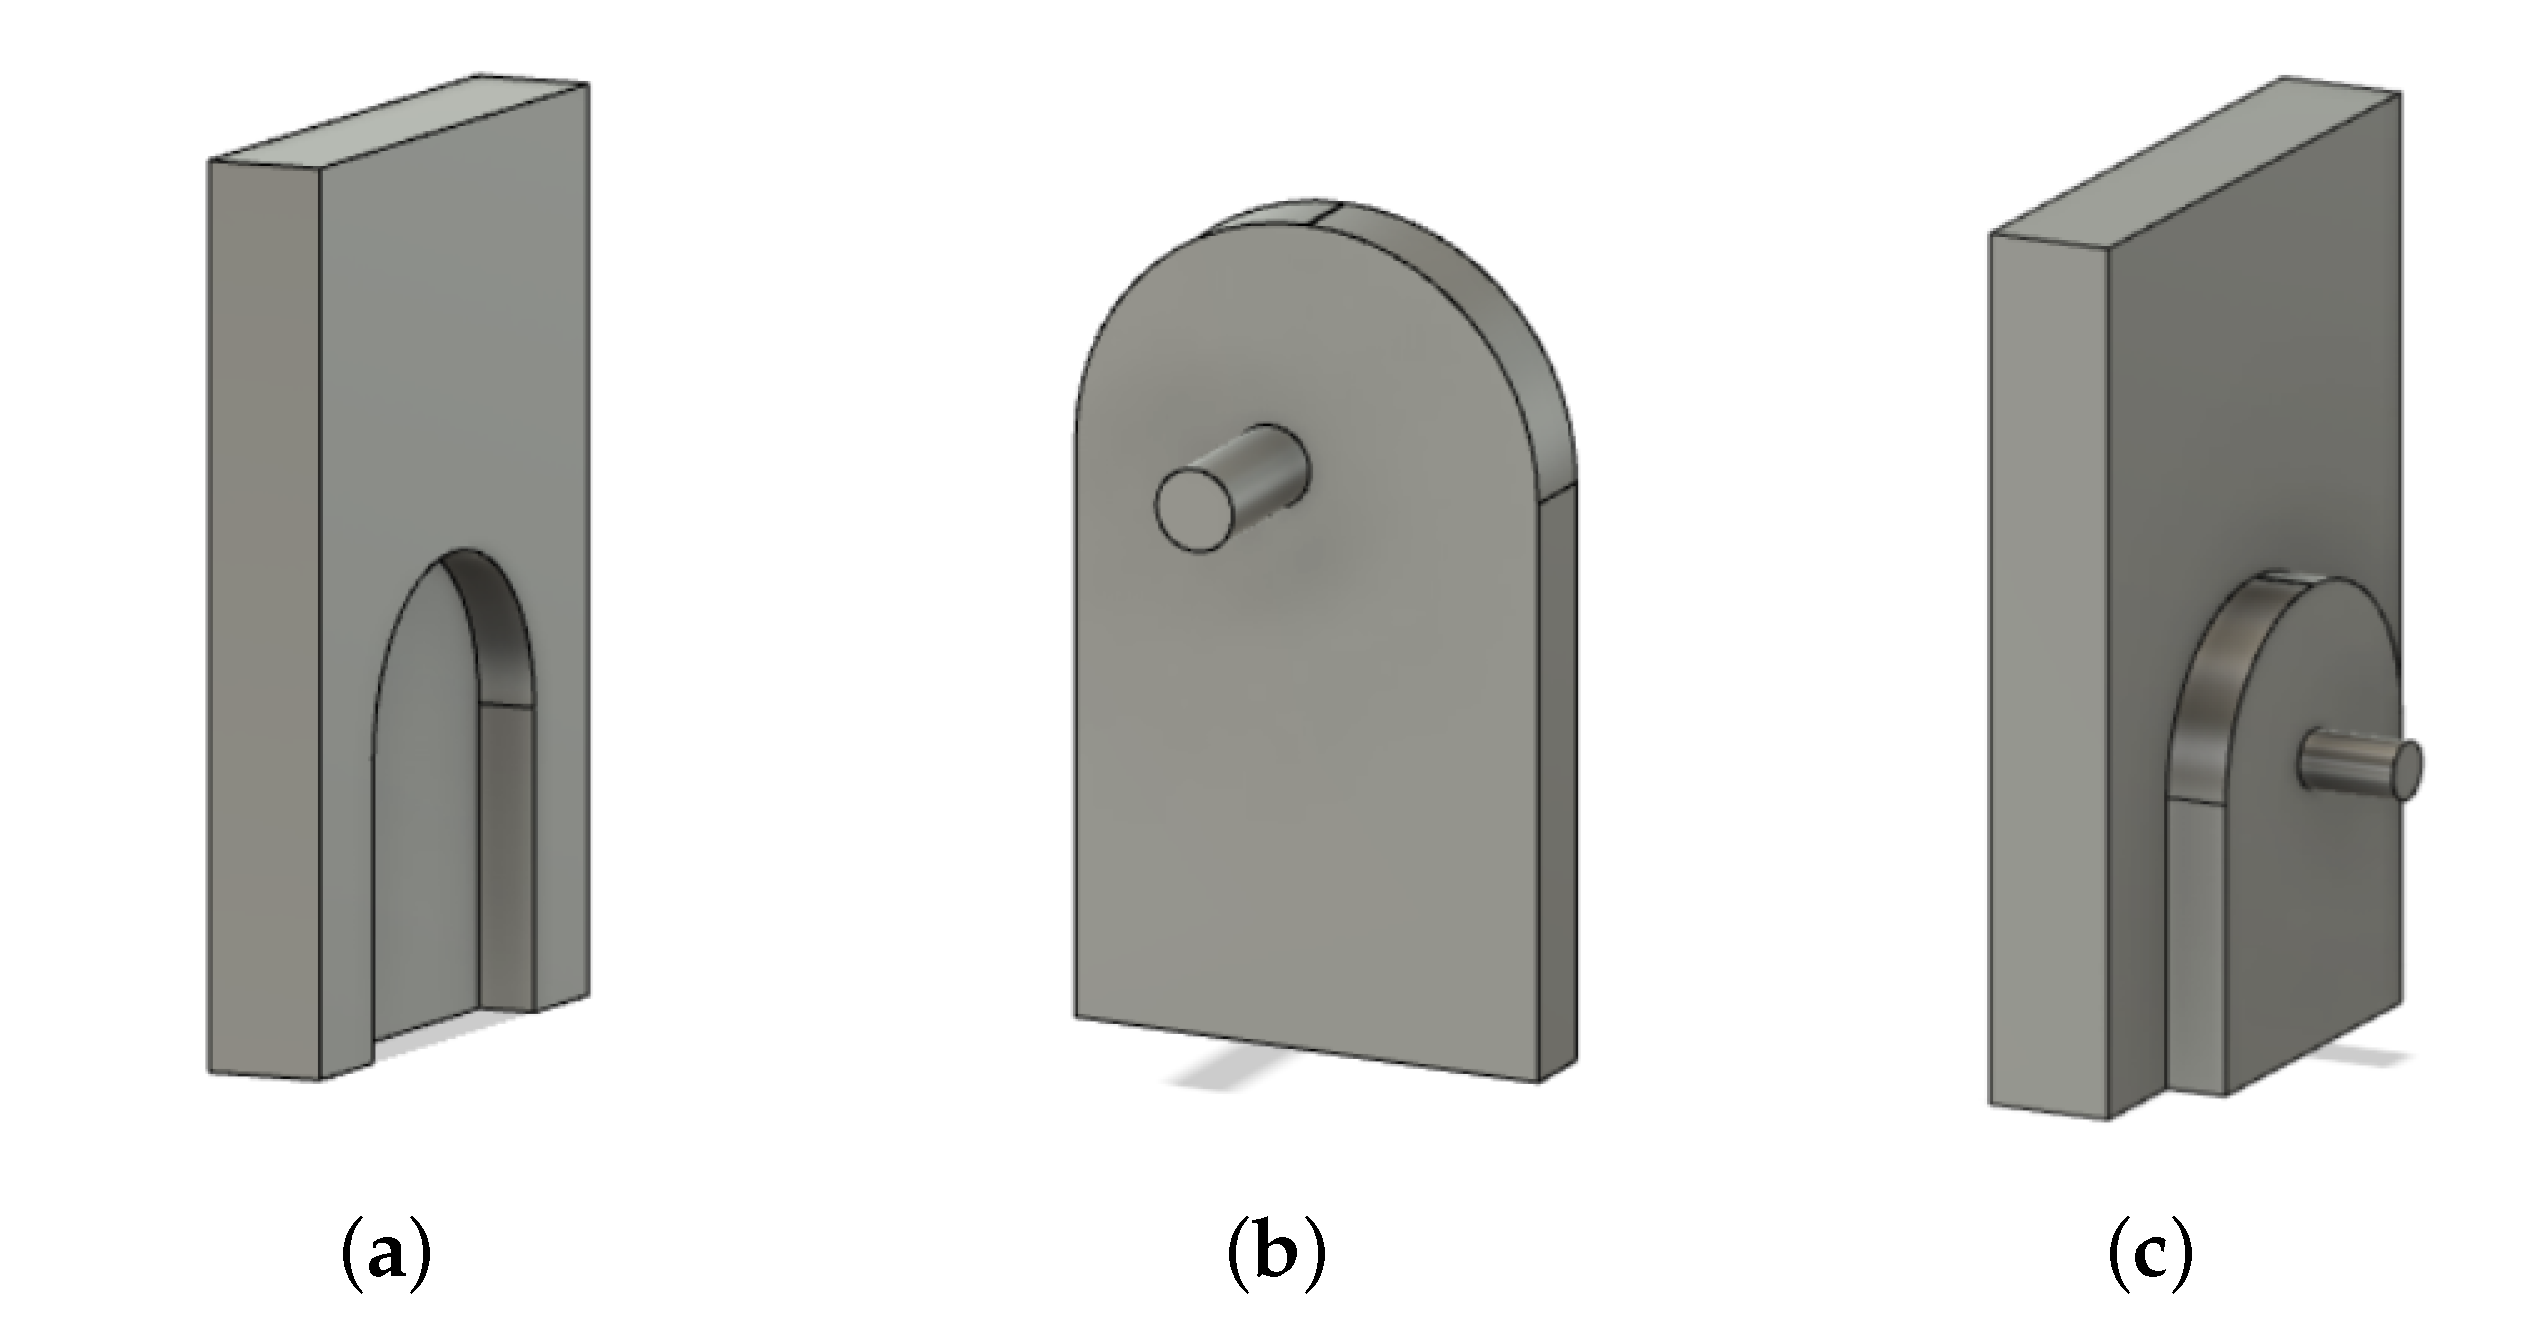
Figure 4.
Voltage and Reactive power in utility grid when operated with all chargers and without chargers. (a) Voltage in utility grid when operated without chargers. (b) Reactive power in utility grid when operated without chargers. (c) Voltage in utility grid when operated with all chargers. (d) Reactive power in utility grid when operated with all chargers.
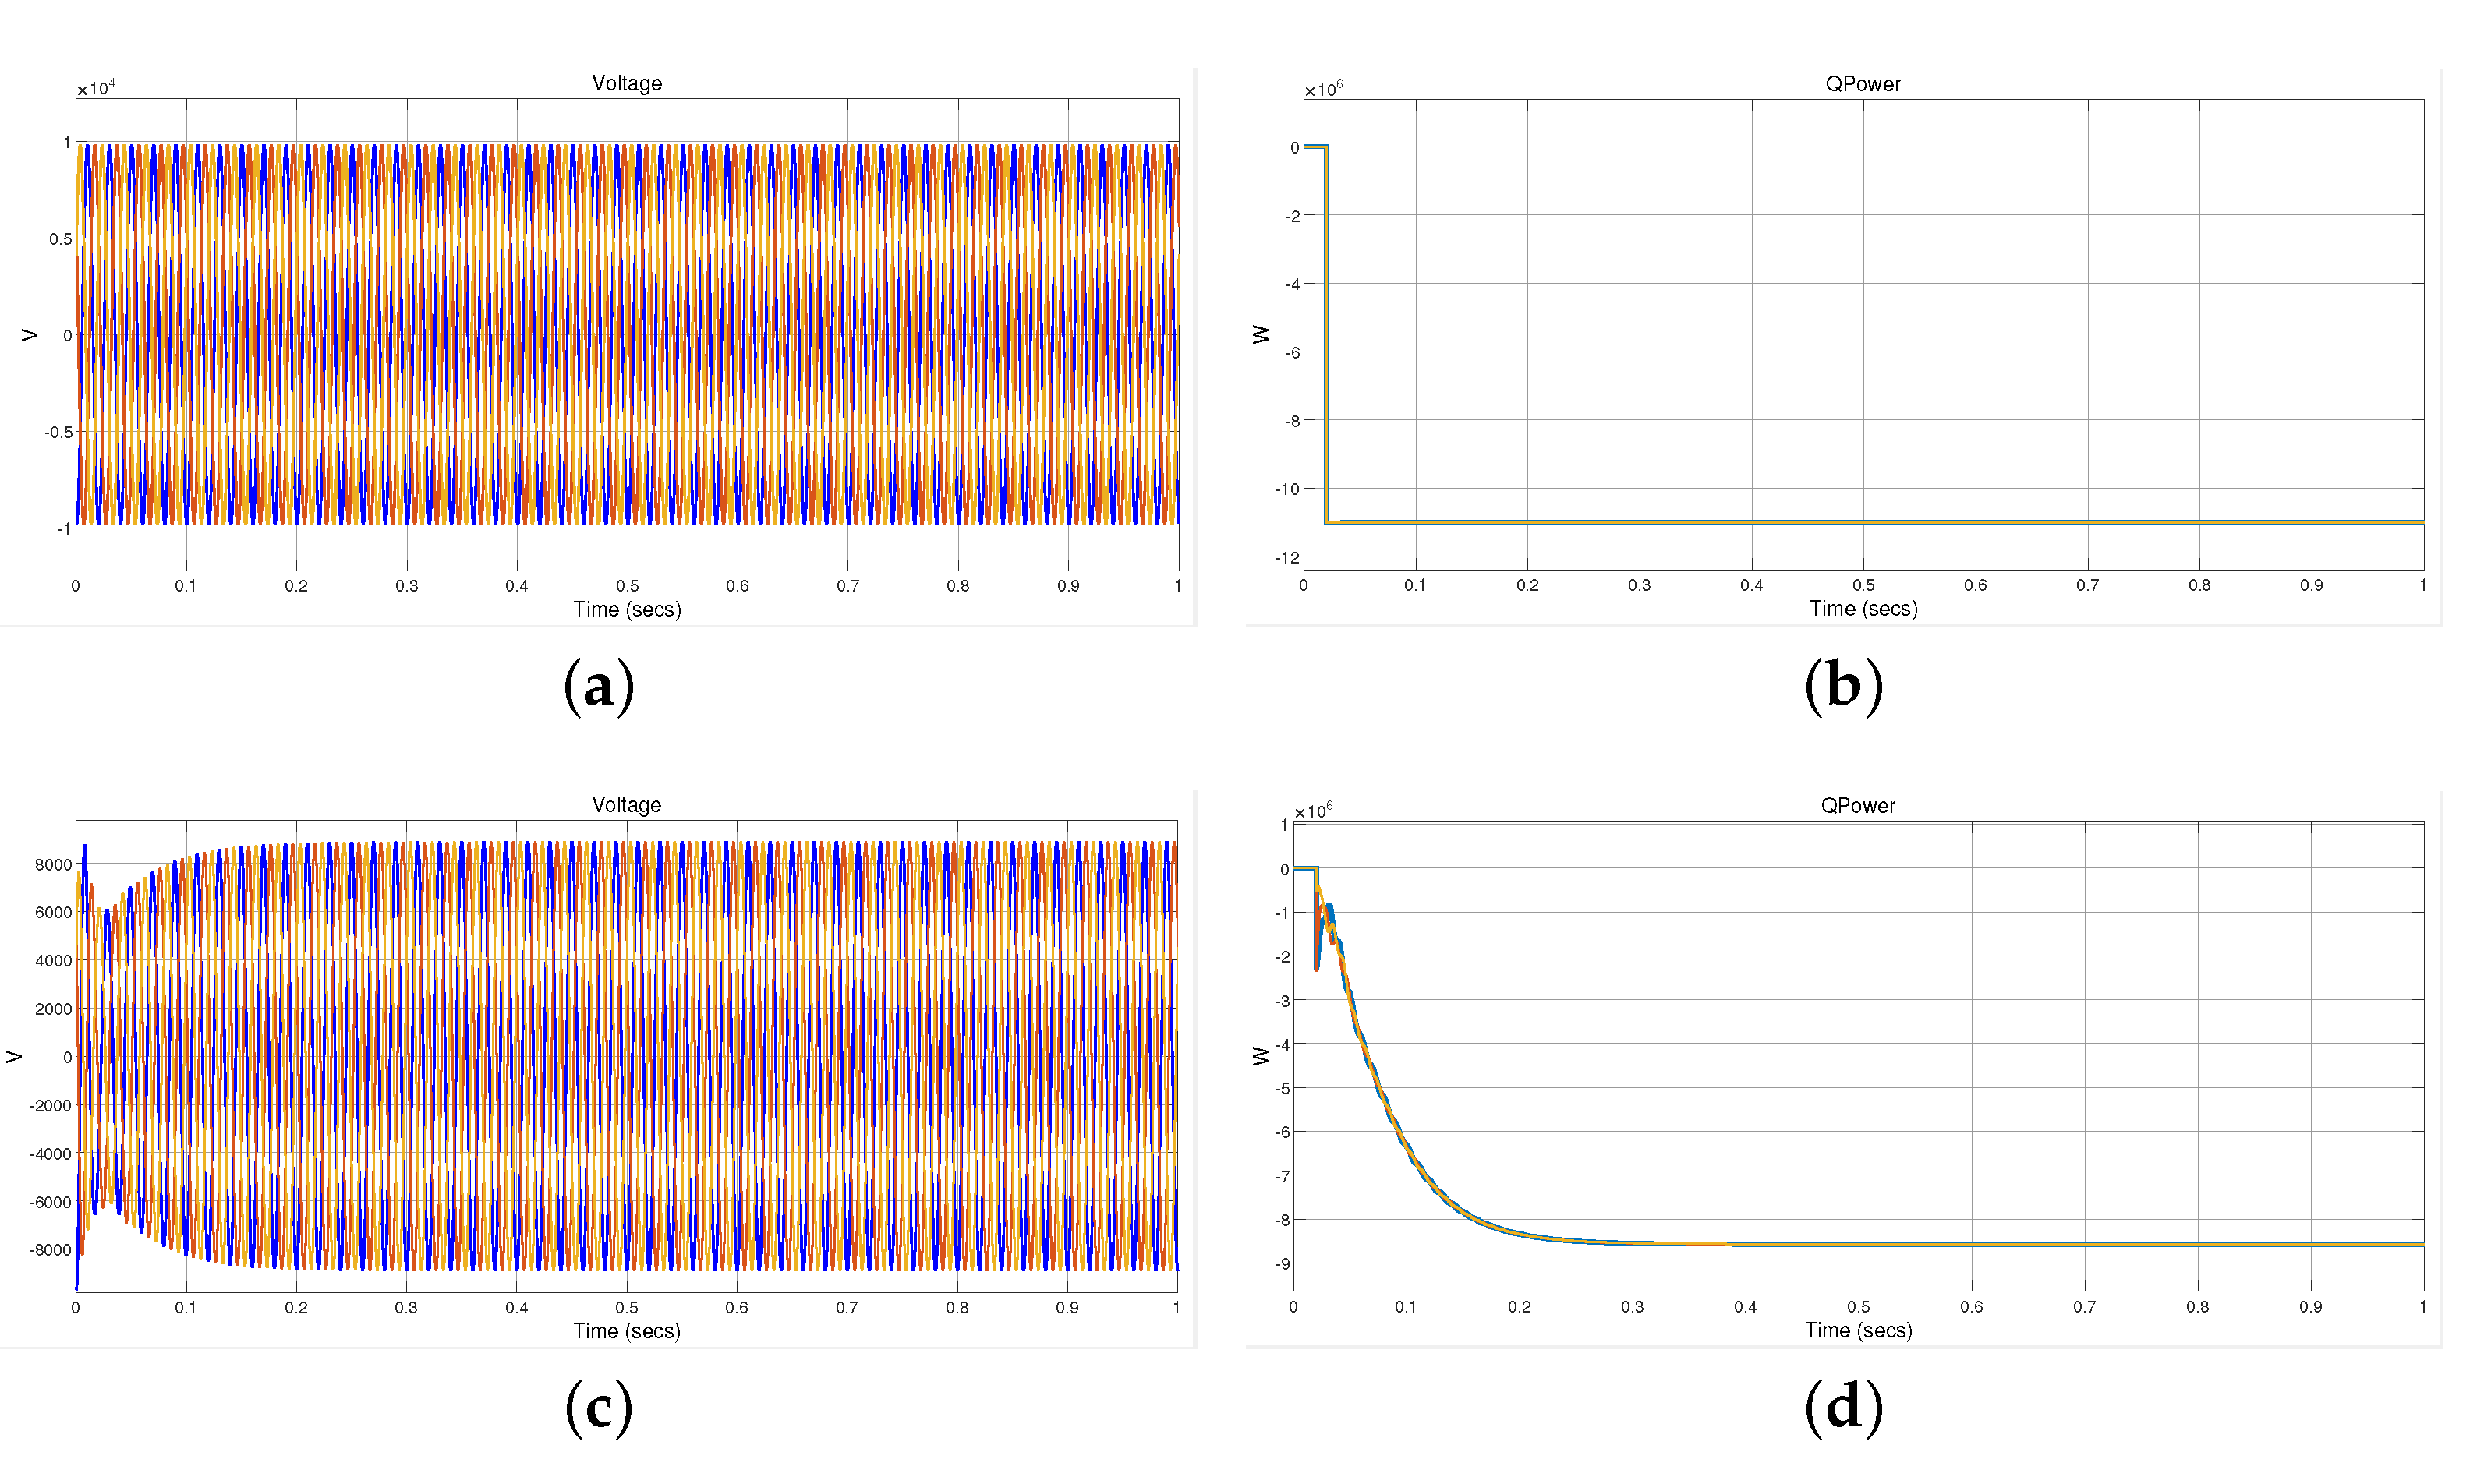
Figure 5.
Harmonics, Reactive power and voltage in utility grid. (a) Harmonics when all chargers are operated. (b) Reactive power in utility grid when CSs operated with DCFCs. (c) Voltage in utility grid when CSs operated with DCFCs. (d) Harmonics in utility grid when CSs operated with DCFCs.
Figure 5.
Harmonics, Reactive power and voltage in utility grid. (a) Harmonics when all chargers are operated. (b) Reactive power in utility grid when CSs operated with DCFCs. (c) Voltage in utility grid when CSs operated with DCFCs. (d) Harmonics in utility grid when CSs operated with DCFCs.
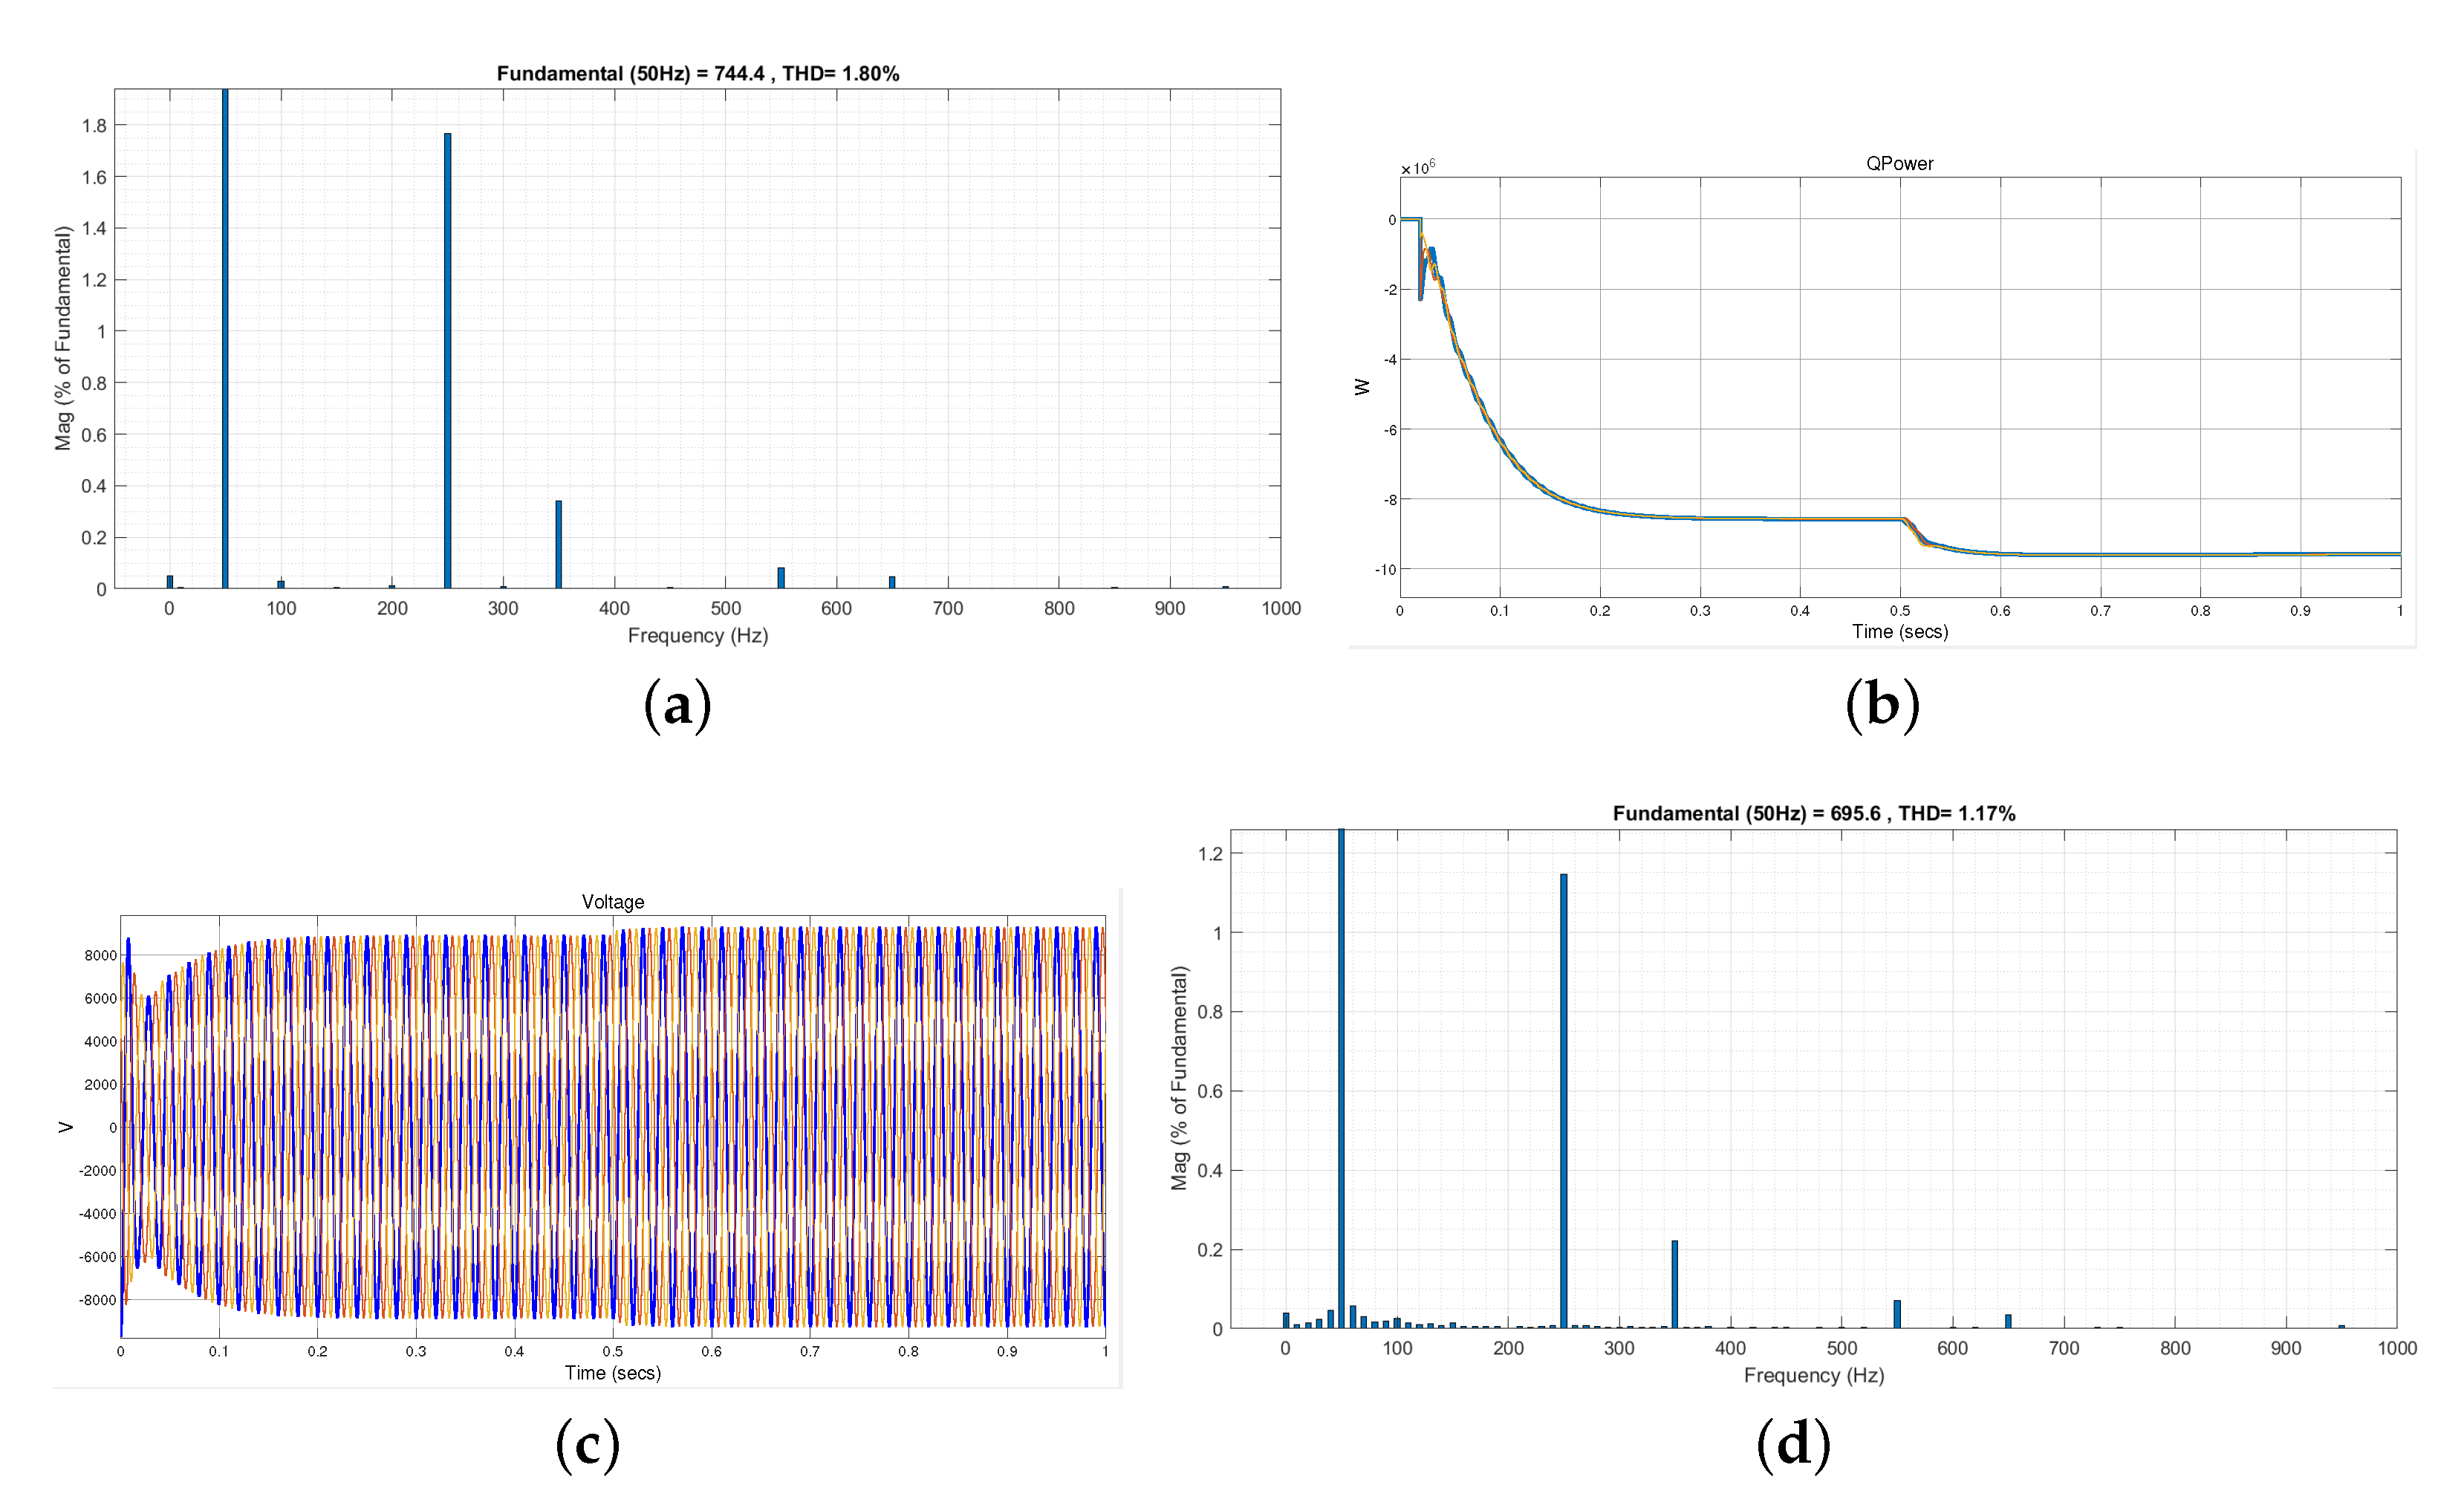
Figure 6.
Harmonics in utility grid when operated with all chargers and harmonic filters.
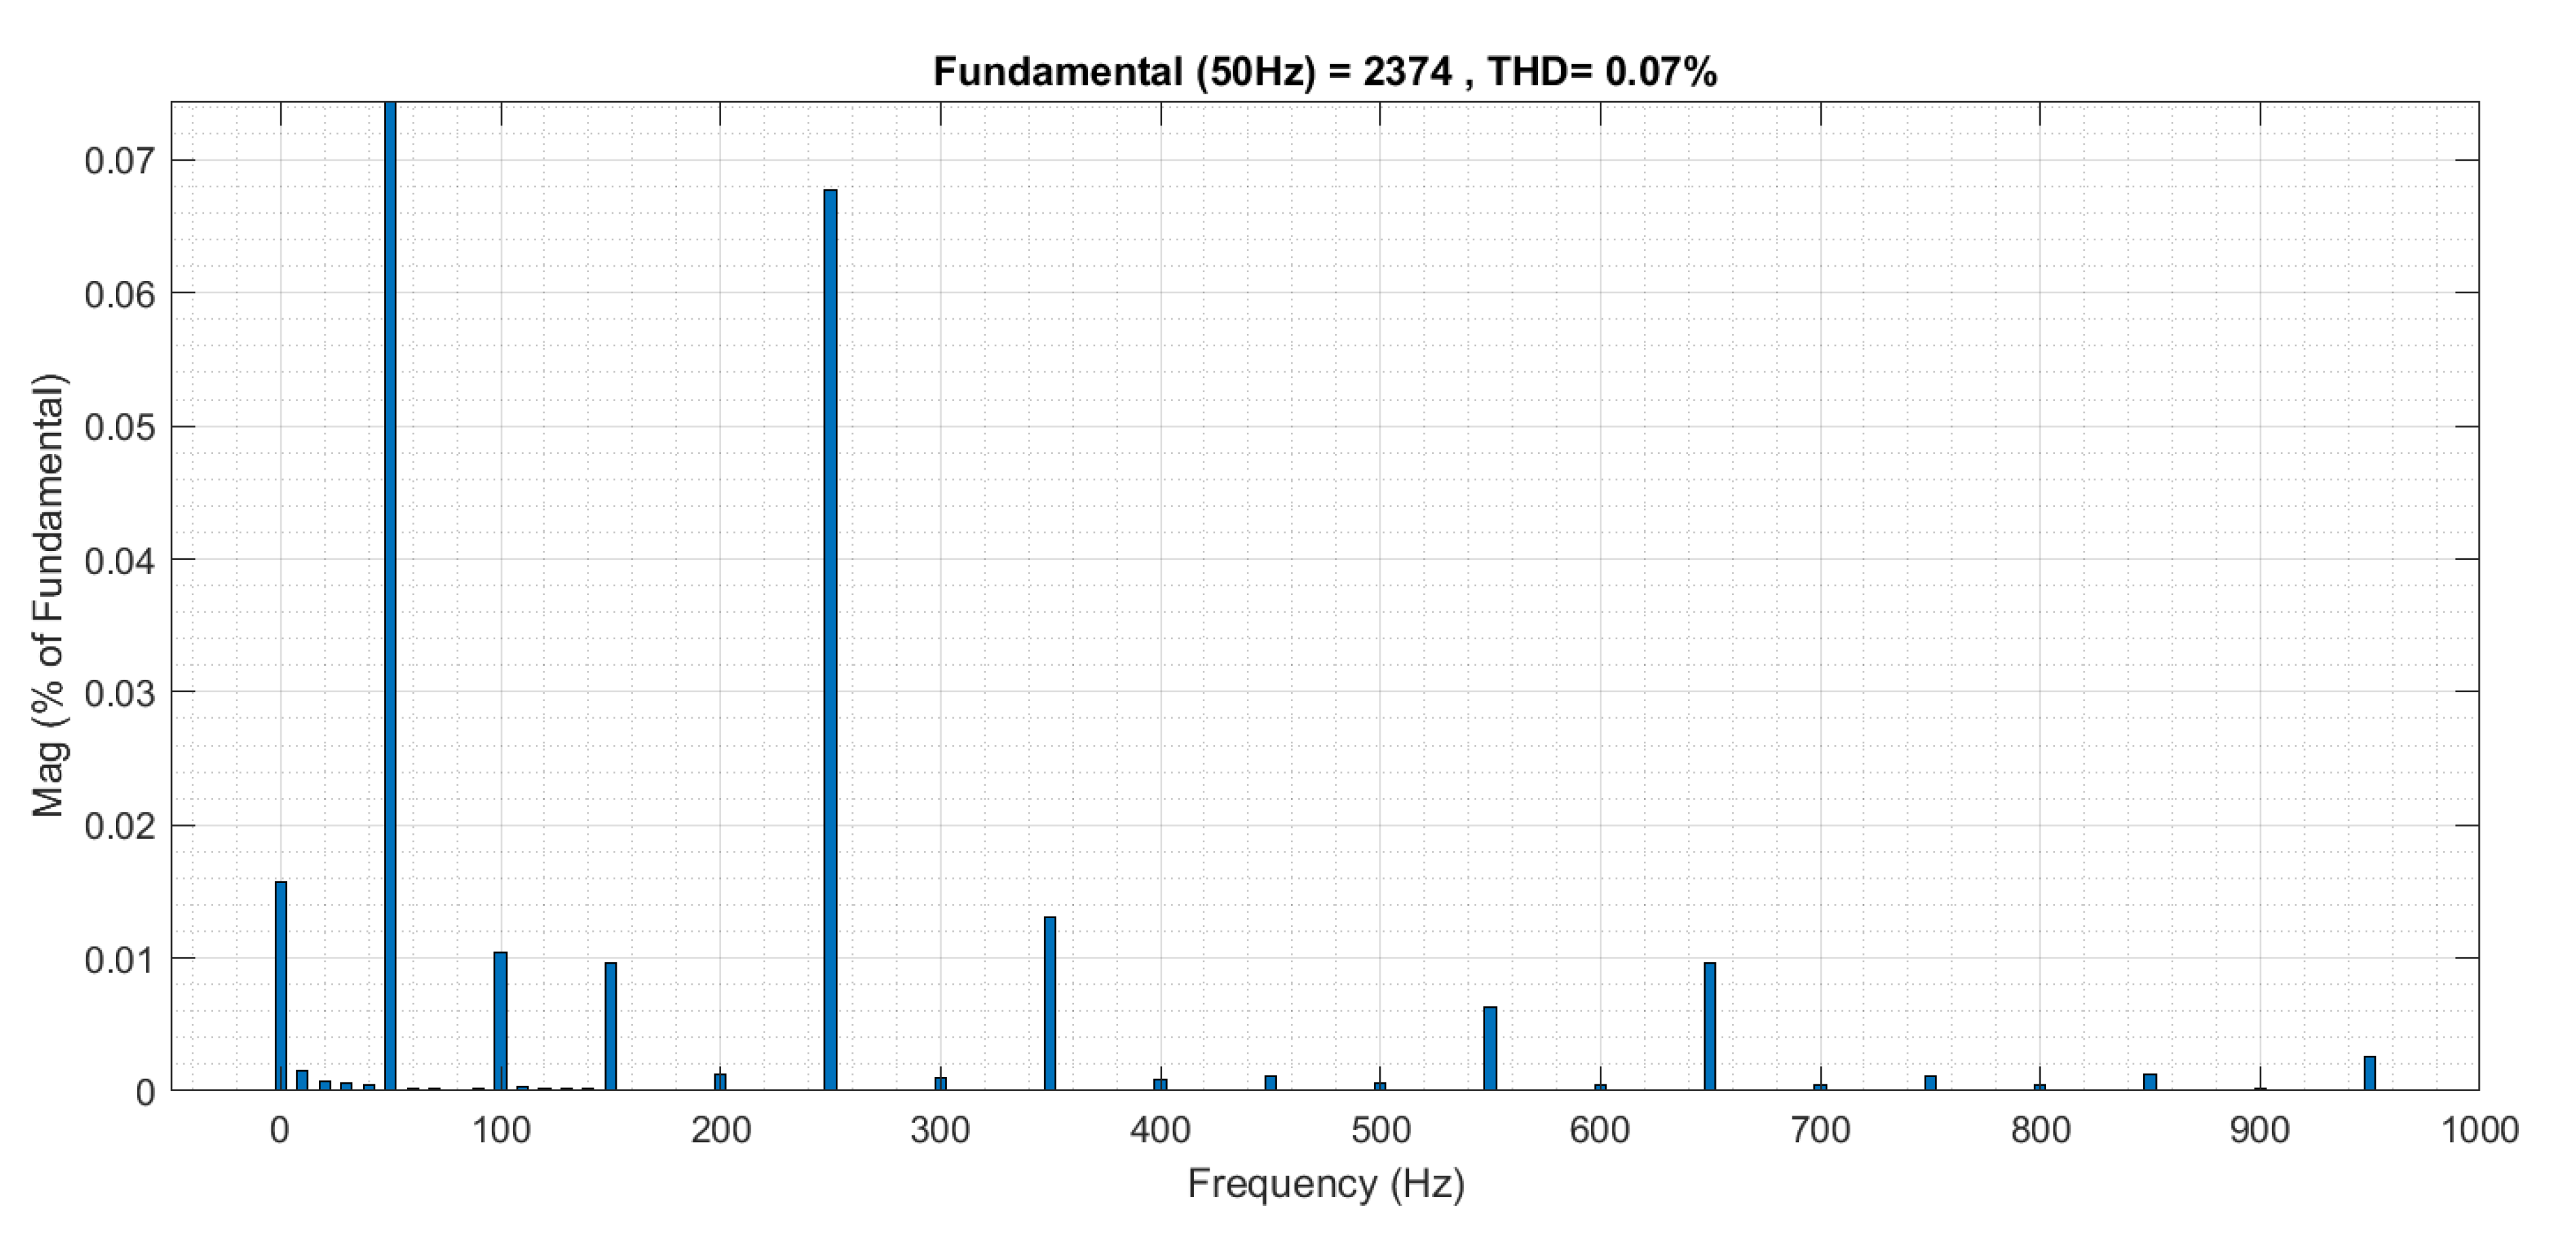
Figure 7.
Stability and instability of 33-busses with and without multiagent system. (a) Unstable bus 20: Without MAS deployment in it. (b) Stable bus 20 after MAS deployment in it. (c) When one of the buses is unstable: Without-MAS deployment in the system. (d) 33-busses are stable after deployment of MAS in the system.

Figure 8.
Stress Analysis of the multilevel charging station. (a) Von-Mises Stress Distribution of the designed structure. (b) Maximum Displacement of the designed structure.
Figure 8.
Stress Analysis of the multilevel charging station. (a) Von-Mises Stress Distribution of the designed structure. (b) Maximum Displacement of the designed structure.

Figure 9.
Conceptual Framework of EVs queuing model at Multi-level EV Charging Station Infrastructure.
Figure 9.
Conceptual Framework of EVs queuing model at Multi-level EV Charging Station Infrastructure.

Figure 10.
Stochastic EVs queuing model at Multi-level Charging Station Infrastructure: Discrete Time Markov Chain M/M/S/K Model.
Figure 10.
Stochastic EVs queuing model at Multi-level Charging Station Infrastructure: Discrete Time Markov Chain M/M/S/K Model.
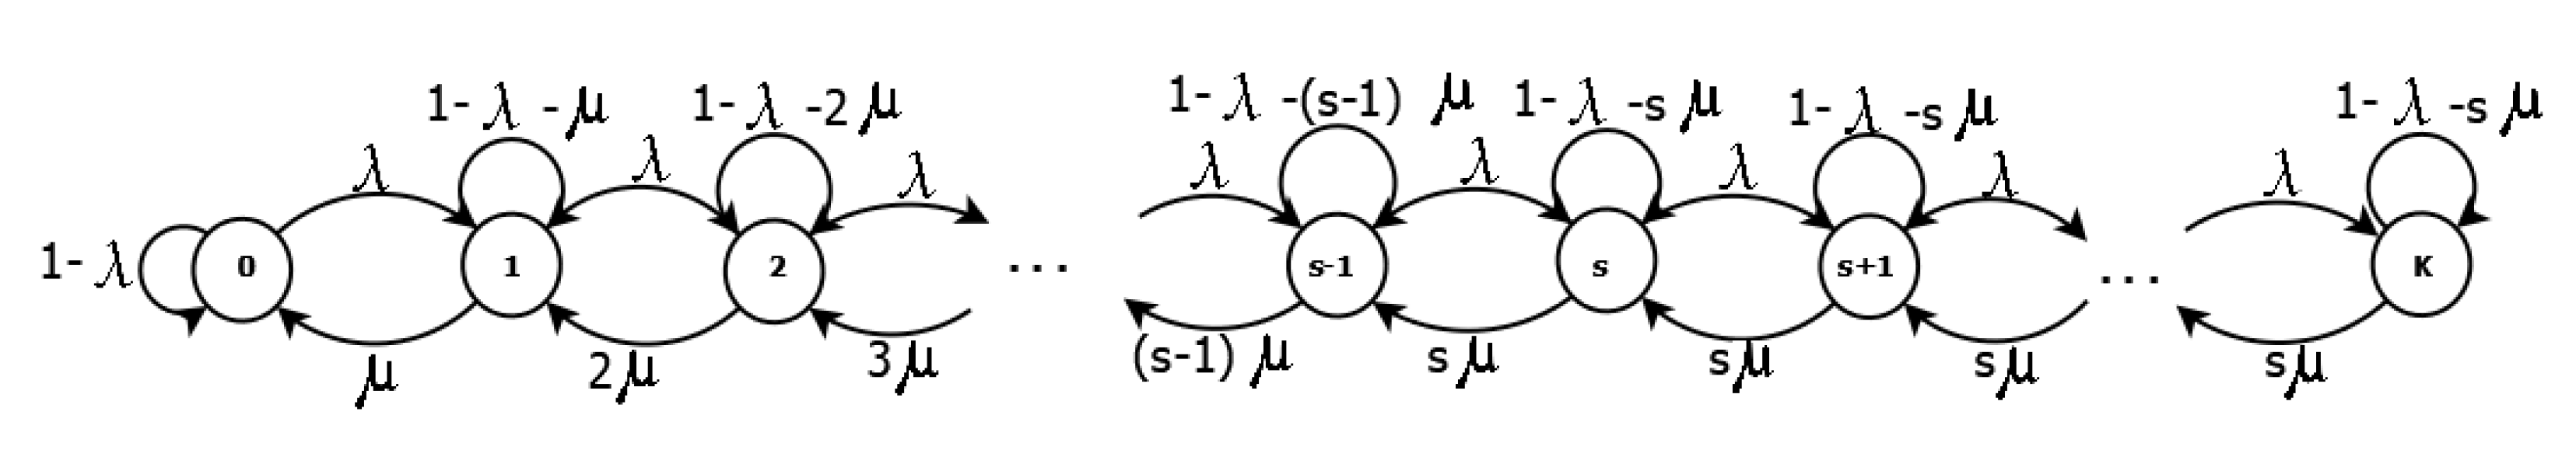
Figure 11.
EVs Blocking Probability at Charging Station with Varying Arrival Rates. (a) DC Fast Charing Infrastructure. (b) On Road Charging Infrastructure. (c) Multi-level Charging Infrastructure.
Figure 11.
EVs Blocking Probability at Charging Station with Varying Arrival Rates. (a) DC Fast Charing Infrastructure. (b) On Road Charging Infrastructure. (c) Multi-level Charging Infrastructure.

Figure 12.
EVs Blocking Probability at Charging Station with Varying Service Rates. (a) DC Fast Charing Infrastructure. (b) On Road Charging Infrastructure. (c) Multi-level Charging Infrastructure.
Figure 12.
EVs Blocking Probability at Charging Station with Varying Service Rates. (a) DC Fast Charing Infrastructure. (b) On Road Charging Infrastructure. (c) Multi-level Charging Infrastructure.
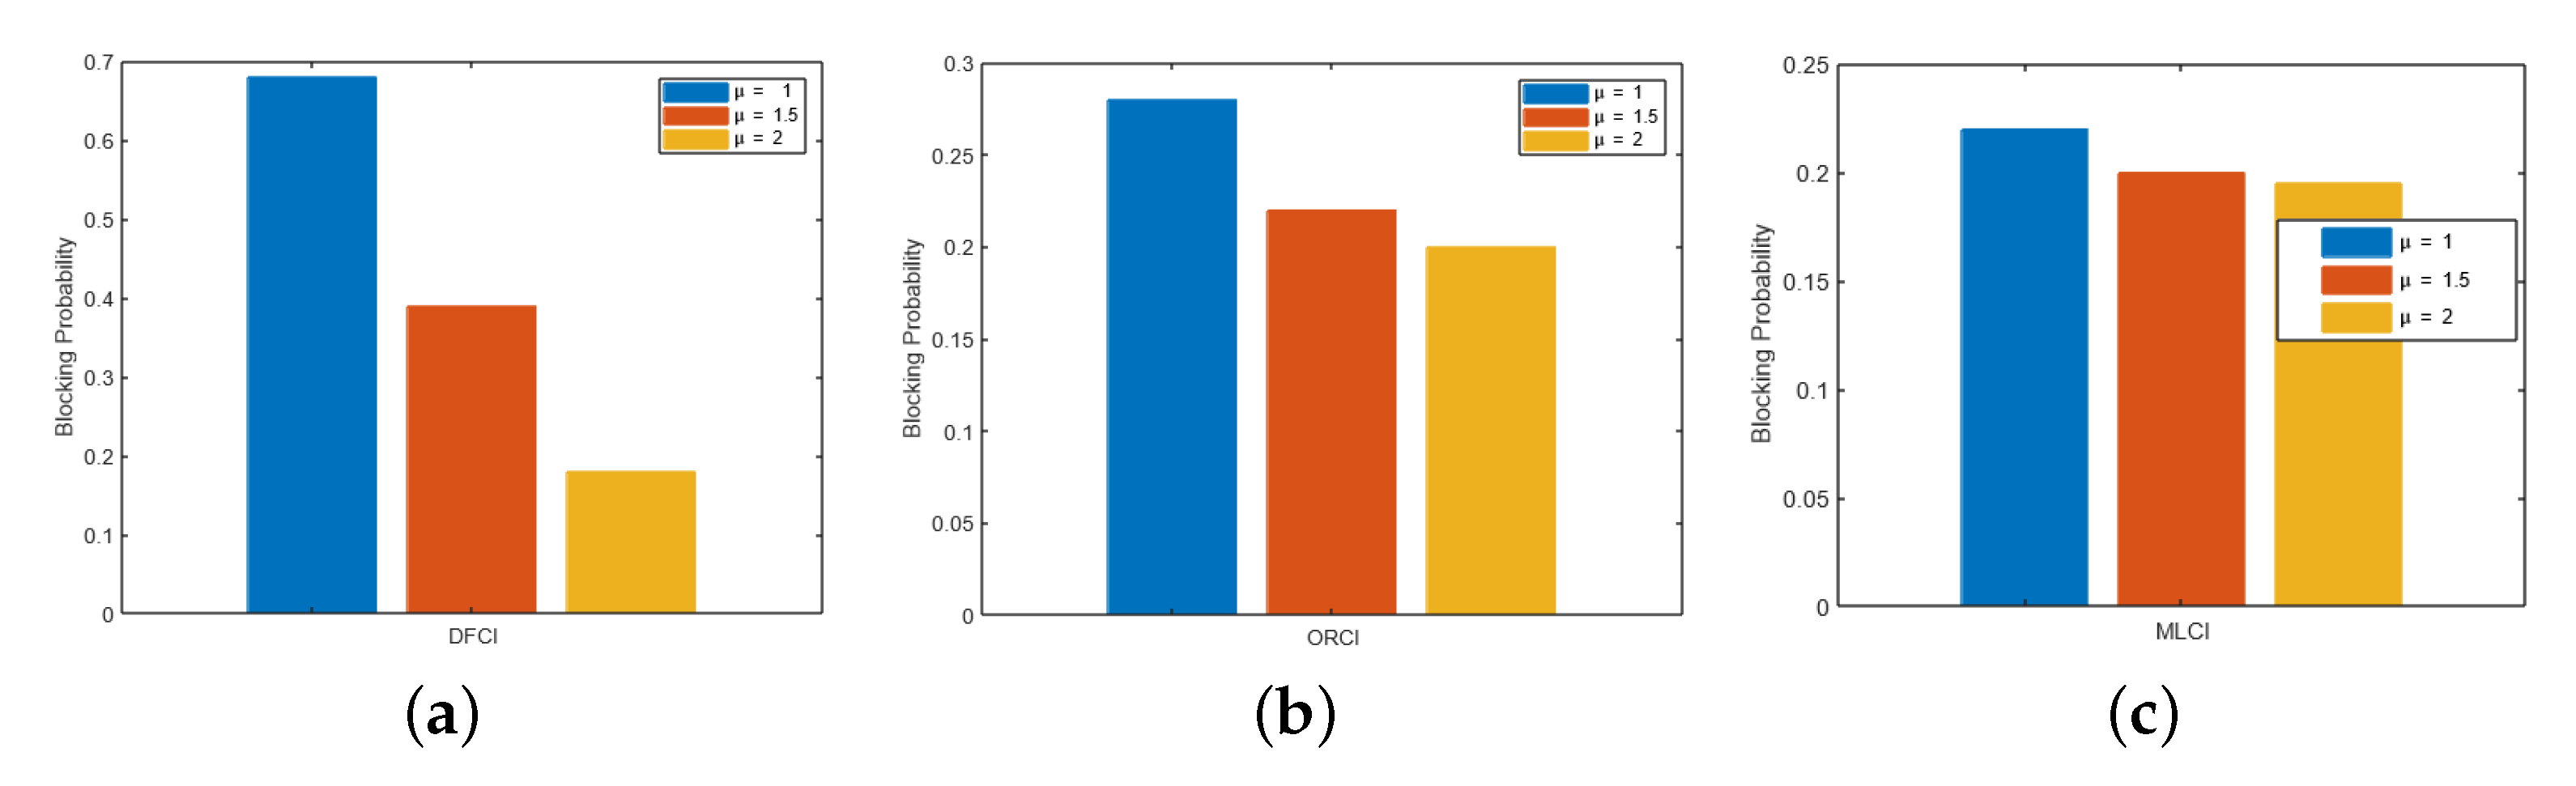
Figure 13.
EVs Blocking Probability at Charging Station with Varying Number of chargers. (a) DC Fast Charing Infrastructure. (b) On Road Charging Infrastructure. (c) Multi-level Charging Infrastructure.
Figure 13.
EVs Blocking Probability at Charging Station with Varying Number of chargers. (a) DC Fast Charing Infrastructure. (b) On Road Charging Infrastructure. (c) Multi-level Charging Infrastructure.
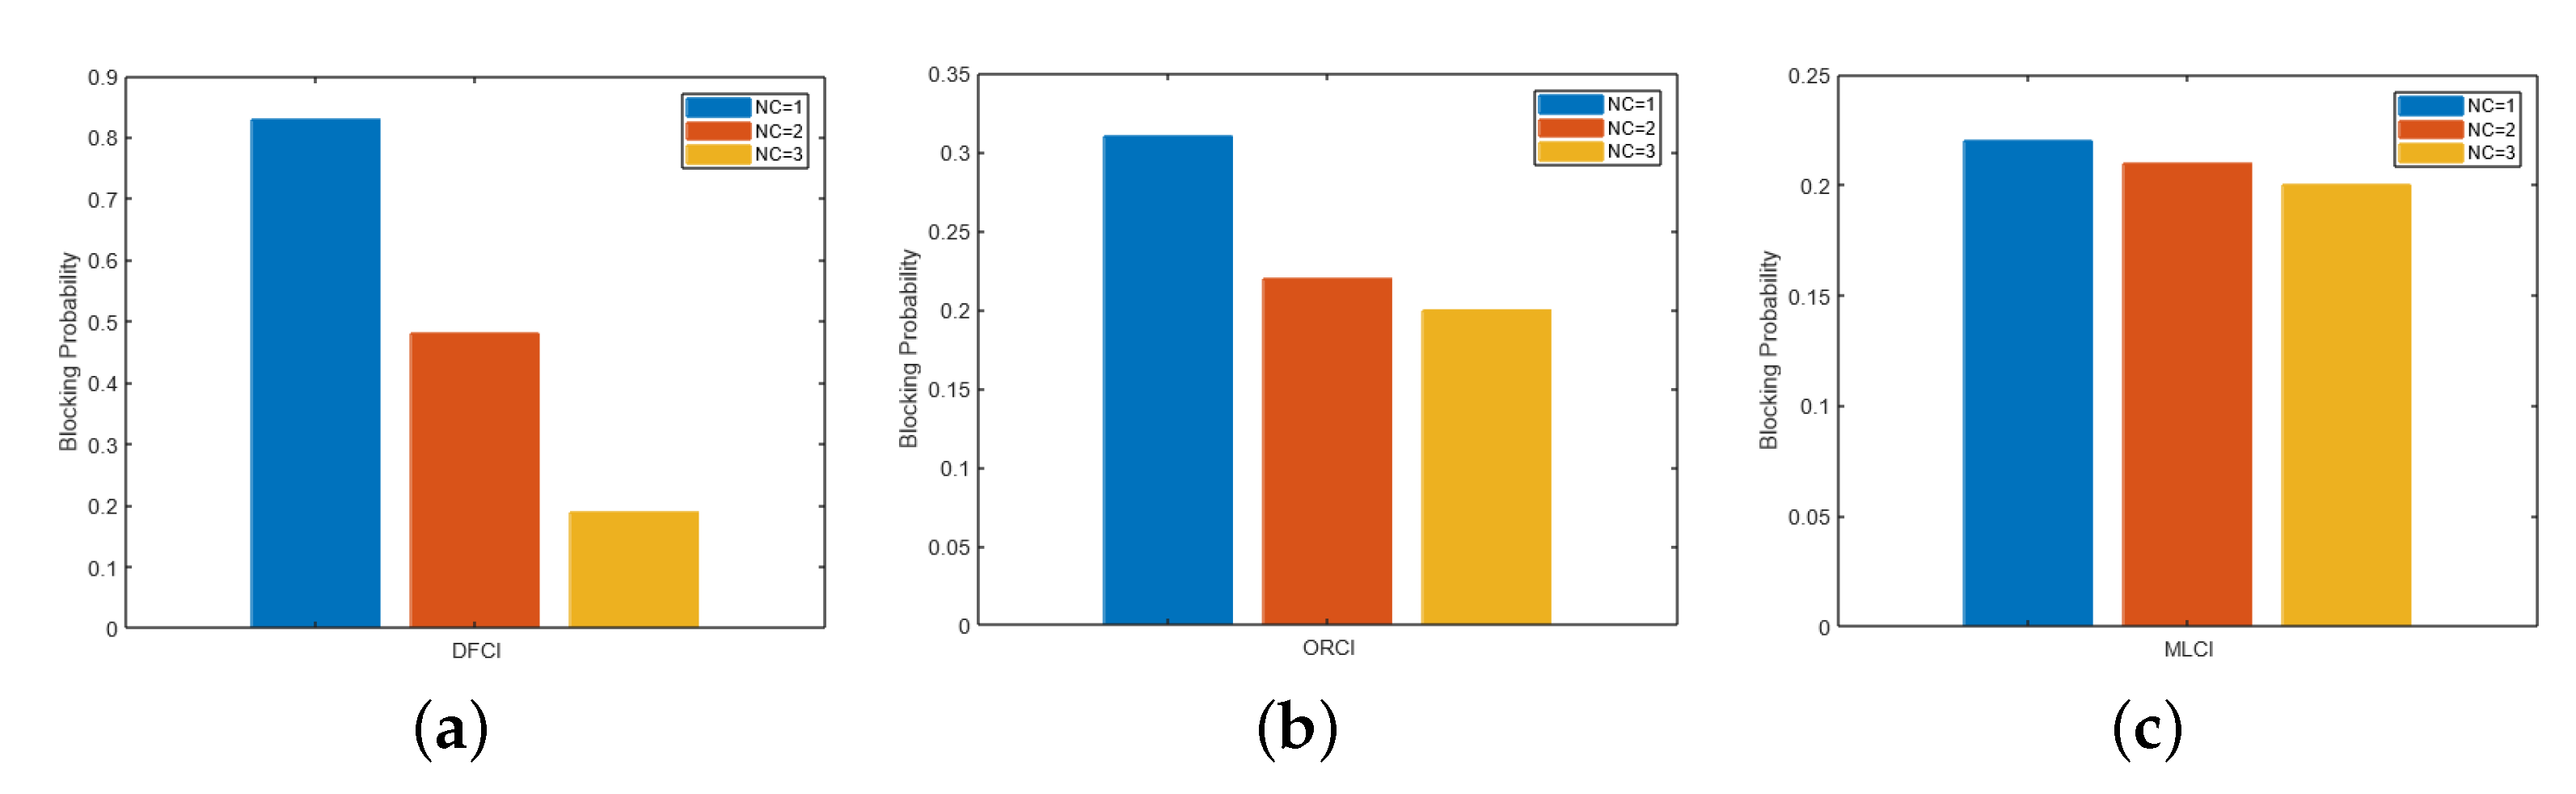
Figure 14.
GA-based optimal solution.


Table 1.
Comparisons of Related works and Proposed work.
| Paper ID | Approach | SG Ecosystem, Network Power Distribution | V2G, MAS | Power Flow Monitoring | Integration of Micro-Grids | Optimization Techniques |
|---|---|---|---|---|---|---|
| [11,18,19,20,21] | Distributed Power flow network model with energy management systems for EV Infrastructure | ✓ | ✓ | × | × | × |
| [5,8,16,22,23,24,25,26] | Power Flow in microgrids in SG Network | ✓ | ✓ | ✓ | × | × |
| [27,28,29,30] | Cyber Physical Protection in SG Network | ✓ | ✓ | ✓ | × | ✓ |
| [6,13,14,21,31,32,33] | Efficient Management Algorithms and optimised power flow mechanism | ✓ | × | ✓ | ✓ | × |
| Proposed Work | A comprehensive power flow analysis of the SG Network Infrastructure | ✓ | ✓ | ✓ | ✓ | × |
Table 2.
Comparison of Charging Station.
| Parameters | On-Board Charging Station | Off-Board Charging Station | Fast Charging Station | Wireless Charging Station | Smart Charging Station | Battery Swapping Station | Multi-Level Charging Station |
|---|---|---|---|---|---|---|---|
| Energy transfer (in kW) | Less | High | Different ports for multiple levels | Bi-directional | Depends upon the distance between coils | Bidirectional | Bidirectional, Safe and High |
| Level of battery heating issue | Low | Very high | Medium | Medium | Low | Low | Very low |
| Battery weight on EV | Added | Removed | Removed | Removed | Moderate | Constant | Removed |
| Battery charging time | More | Depends on the controller of EV | Depends on the controller of EV | Depends on user control | Depends on power transmission coils | More | No delay |
| Flexibility | Anywhere charge | No flexibility | Anywhere charge | Anywhere charge | More flexible | More flexible | No flexibility |
| Cost and complexity | Low cost and complexity | High cost and complexity | High cost and low complexity | High cost and complexity | High cost and medium complexity | Medicum cost and high complexity | Low cost and low complexity |
Table 3.
CAPEX: Cost estimation of the proposed multi-level charging infrastructure.
| Type of Charger | Number of Chargers in PCS | Power Output | Approx. Cost in Indian Rupees | Number of EVs That Can Be Charged Simulataneously | Maximum Power Sold to EVs per Day (24 h/day) kWh |
|---|---|---|---|---|---|
| CCS | 1 | 50 kW | 72,500 | 1 | 1200 |
| CHAdeMO | 1 | 50 kW | 72,500 | 1 | 1200 |
| Type 2 AC | 1 | 22 kW | 12,500 | 1 | 528 |
| Bharat DC-001 | 1 | 15 kW | 24,000 | 1 | 360 |
| Bharat AC-001 | 1 | 9.9 kW | 7000 | 3 | 237.6 |
| Swap station | - | - | - | - | 360 |
| New electricity connection (2SO KVA), Transformer, Cabling, Panels, Breakers, and Energy meter | - | - | 75,000 | - | - |
| Civil works (Flooring, painting, Boards, Branding, Shed/covers, etc. | - | - | 750,000 | - | - |
| EVSE Management Software-integration with chargers and payment gateway | - | - | 40,000 | - | - |
| CCTV Camera Setup | - | - | 30,000 | - | - |
| Total CAPEX | - | - | 2,955,000 | - | 3885.6 |
Table 4.
OPEX: Cost estimation of the proposed multi-level charging infrastructure.
| Type of Service | Cost in Indian Rupees |
|---|---|
| Technician’s charges | 150,000 for 6 months |
| Site maintenance staff | 180,000 per year |
| Land lease rental (50,000 per month) | 600,000 per year |
| Advertising (3000 per month) | 36,000 per year |
| Total cost | 972,000 + EVSE software fees for 1st year. 822,000 + EVSE software fees for 2nd year |
Table 5.
Comparisons between Existing charging stations and Multilevel charging station.
| Type of Charging Station | Safety | Traffic | Waiting Time | Cost | Complexity |
|---|---|---|---|---|---|
| On-board charging station | Less | High | More | Low | Low |
| Off-board charging station | Medium | High | More | High | High |
| Battery swapping station | Less | Low | Medium | Medium | High |
| Multi-level charging station | High | Low | Low | Low | Low |
Publisher’s Note: MDPI stays neutral with regard to jurisdictional claims in published maps and institutional affiliations. |
© 2022 by the authors. Licensee MDPI, Basel, Switzerland. This article is an open access article distributed under the terms and conditions of the Creative Commons Attribution (CC BY) license (https://creativecommons.org/licenses/by/4.0/).
Share and Cite
MDPI and ACS Style
Chavhan, S.; Zeebaree, S.R.M.; Alkhayyat, A.; Kumar, S. Design of Space Efficient Electric Vehicle Charging Infrastructure Integration Impact on Power Grid Network. Mathematics 2022, 10, 3450. https://doi.org/10.3390/math10193450
AMA Style
Chavhan S, Zeebaree SRM, Alkhayyat A, Kumar S. Design of Space Efficient Electric Vehicle Charging Infrastructure Integration Impact on Power Grid Network. Mathematics. 2022; 10(19):3450. https://doi.org/10.3390/math10193450
Chicago/Turabian StyleChavhan, Suresh, Subhi R. M. Zeebaree, Ahmed Alkhayyat, and Sachin Kumar. 2022. "Design of Space Efficient Electric Vehicle Charging Infrastructure Integration Impact on Power Grid Network" Mathematics 10, no. 19: 3450. https://doi.org/10.3390/math10193450
Note that from the first issue of 2016, this journal uses article numbers instead of page numbers. See further details here.