
Multiaxial Strength Criterion Model of Concrete Based on Random Forest
by
 , ,
, ,
Xingqiao Chen
1,2,3,
Dongjian Zheng
1,2,3,*,
Yongtao Liu
1,2,3,4,
Xin Wu
1,2,3,
Haifeng Jiang
1,2,3 and
Jianchun Qiu
5 1
State Key Laboratory of Hydrology-Water Resources and Hydraulic Engineering, Hohai University, Nanjing 210098, China
2
College of Water Conservancy and Hydropower Engineering, Hohai University, Nanjing 210098, China
3
National Engineering Research Center of Water Resources Efficient Utilization and Engineering Safety, Hohai University, Nanjing 210098, China
4
Department of Civil and Architectural Engineering, Aarhus University, 8000 Aarhus, Denmark
5
College of Hydraulic Science and Engineering, Yangzhou University, Yangzhou 225009, China
*
Author to whom correspondence should be addressed.
Mathematics 2023, 11(1), 244; https://doi.org/10.3390/math11010244
Submission received: 1 December 2022
/
Revised: 25 December 2022
/
Accepted: 27 December 2022
/
Published: 3 January 2023
(This article belongs to the Special Issue Mathematical Modeling and Numerical Analysis for Applied Sciences)
Abstract
:The concrete strength criterion is the basis of strength analysis and evaluation under a complex stress state. In this paper, a large number of multiaxial strength tests were carried out, and many mathematical expressions of strength criteria were proposed based on the geometric characteristics and the assumption of a convex function. However, the rationality of the assumption of a convex function limits the use of these strength criteria. In particular, misjudgment will occur near the failure curve surface. Therefore, this paper does not assume the shape function of the criterion in advance. By collecting experimental data and using a machine learning method, it proposes a method of hidden function of failure curve surface. Based on 777 groups of experimental data, the random forest (RF), the back propagation neural network (BP) and the radial basis neural network (RBF) models were used to analyze and verify the feasibility and effectiveness of the method. Subsequently, the results were compared with the Ottosen strength criterion, the Guo Wang strength criterion and the Drucker–Prager (DP) strength criterion. The results show that the consistency between the strength criterion model established by the machine learning algorithm (especially random forest) and the experimental data is higher than the convex function multiaxis strength criterion of the preset failure surface shape. Moreover, the physical significance is clearer, the deficiency of the convex function failure surface hypothesis is avoided and the established multiaxial strength criterion of concrete is more universal.
Keywords:
concrete; multiaxial strength criterion; machine learning method; shape function; random forestMSC:
82-10; 70-10; 65D17; 00A711. Introduction
The damage of concrete materials under multiaxial stress is a common concern in engineering which has attracted researchers to carry out many experiments and studies over a long time. The famous classical strength theory [1] has a clear theoretical point of view and corresponding experimental verification to explain the internal causes of material failure, but it cannot accurately describe the strength laws of concrete under complex stress states. To solve this problem, a series of concrete strength theories have been studied and developed based on concrete multiaxial strength tests. These criteria include the Bresler–Pister criterion [2], the Willam–Warnke criterion [3], the Ottosen criterion [4], the Hsich–Ting–Chen criterion [5], the Kotsovos criterion [6], the Podgorski criterion [7], the Guo Wang criterion [8], the Jiang Jianjing criterion [9], etc. [10,11,12,13,14]. However, these concrete strength criteria were based on the fitting of their own test data, so the scope of their use is limited. More importantly, the existing multiaxial failure criterion of concrete is a basic summary based on the geometric characteristics of the stress distribution, and the mathematical model is mainly established by the relation equation of the elementary function, which causes an inherent inaccuracy of the strength criterion. Wai-fah Chen 1 noted that “No one mathematical model can describe the strength of real concrete materials completely under all conditions. Even if such a failure criterion could be constructed, it would be far too complex to serve as the basis for the stress analysis of practical problems”. In fact, we can improve the accuracy of the multiaxial strength criterion of concrete by collecting a large number of historical experimental data to build models without determining the mathematical expression of the strength criterion in advance.
With the rapid development of artificial intelligence technology, various industries are self-empowering with new artificial intelligence technology. Engineering research based on machine learning is also in full swing. Jong-in Kim [15] applied system identification technology based on a BP neural network to predict the strength based on the concrete mix ratio for the first time and showed that neural network technology could better estimate the compressive strength of concrete. Then, Nan-Jingwu [16] established the RBF model to predict the strength of concrete and compared it with the BP neural network model. The verification results showed that the radial basis neural network model was superior to the BP neural network model. El Asri Yousef [17] also compared the accuracy of several machine learning technologies in predicting concrete compressive strength and concluded that random forest is the most effective machine learning model for predicting concrete compressive strength. Recently, machine language methods have been used to predict the tensile strength with high accuracy of FRC (fiber-reinforced concrete) for different cracking stages [18]. At present, few studies have applied machine learning methods to concrete failure criteria. Zhiye Zhao [19] used a neural network method to predict the third principal stress and octahedral shear stress of concrete in combination with 91 groups of test data but did not conduct in-depth research on concrete strength criteria, and the neural network method used has problems such as insufficient robustness and overlearning. Saeed K. Babanajad [20] predicted the first principal stress by connecting the concrete mix ratio parameters with the principal stress () but did not study the shape and accuracy of the strength criterion. Uwe Reuter [21] introduced a convex shape function and used a neural network method to fit the failure surface of concrete combined with experimental data. However, the three shape functions adopted cannot contain all possible concrete failure curve surface shapes, such as the hexagonal prism surface of the Tresca yield criterion and the hexagonal cone surface of the Mohr–Coulomb criterion [1]. At the same time, Liu [10] argues that most convex criteria are proposed based on empirical methods rather than failure theory of concrete. Subsequently, Liu proposed a concave failure criterion, and the results show that the predicted values are in good agreement with the experimental results.
Therefore, the failure surface of concrete may be either convex or concave, but it is difficult to convert between two shapes if the function form is preset in advance, and only a single convex or concave failure surface can be obtained. It is necessary to establish a strength criterion model which can realize the conversion between concave and convex surfaces. In view of the above problems, this paper directly establishes a concrete multiaxial strength criterion by using the machine learning methods based on the multiaxial failure test data of 777 groups [22,23,24,25,26,27,28,29,30,31,32,33,34,35,36,37,38,39,40,41,42,43,44,45] without a function form and realizes the conversion of concave surfaces and convex surfaces. The specific process is as follows. Firstly, three typical strength criterion models are briefly introduced. Secondly, three machine learning methods are introduced. Finally, the results of the RF failure criterion model, BP neural network failure criterion model, radial basis neural network failure criterion model, DP strength criterion, Ottosen strength criterion and Guo Wang strength criterion are compared, which can provide a reference for the objective evaluation of the multiaxial strength of concrete.
2. Strength Criterion of Concrete
2.1. Failure Curve Surface
Strength theory provides various yield and failure criteria for materials under complex stress states. All materials have a limit point of strength, and until they reach that point, they can be considered linearly elastic. The ultimate strength points of materials under various stress combinations can be determined by tests or different theories, and a failure curve surface can be formed by connecting these points. Figure 1 is a schematic diagram of the failure curve surface, and Figure 2 is a deviatoric plane.
In this paper, the above figure is rotated to obtain a failure curve surface with the hydrostatic pressure axis as the abscissa. It is expressed in cylindrical coordinates (ξ, r, θ). ξ is the hydrostatic pressure, and r is the deviatoric stress. θ is the Lode angle, . The meridian corresponding to θ = 0 is called the pull meridian, which is marked in blue. The meridian corresponding to θ = Π/3 is called the pressure meridian, which is marked in red. The distance of a point on the hydrostatic pressure axis to the origin of the coordinate axis is ξ. The deviatoric stress r is the distance from the hydrostatic pressure axis on the deviatoric plane. The conversion formula is as follows:
By reducing the above equation by , the coordinates of hydrostatic pressure and deviatoric stress can be replaced by octahedral normal stress () and octahedral shear stress () to obtain the corresponding tension and compression meridians and deviatoric planes. For isotropic materials, the attachment of lower labels 1, 2 and 3 to the coordinate axes is arbitrary, so the failure surface is sixfold symmetric. Currently, it is generally believed that the failure surface curve has the following characteristics 1:
- (1)
- The surface is continuous, smooth and convex;
- (2)
- For the same hydrostatic pressure, , where is located on the pull meridian and on the pressure meridian;
- (3)
- Threefold symmetry of the hydrostatic pressure axis;
- (4)
- The deviatoric plane shape is gradually convex and full from an approximate triangle to nearly round.
However, there are still different opinions on the outer convexity of the failure surface. Liu believes [41] that the outer convexity of the failure surface is not exact for unstable materials such as concrete or can produce a concave yield surface.
2.2. Typical Strength Criterion
The mathematical expressions of the multiaxial strength criterion are mainly polynomial and power functions. Among them, the Ottosen criterion in polynomial form and the Guo Wang criterion in power function form are more classical. Meanwhile, considering that the DP criterion is still commonly used in concrete structures, this paper will choose the above three strength criteria for comparative analysis. Among them, the failure surface of the Ottosen strength criterion is a triangle transitioned from a circular to convex curved edge, the failure surface of the Guo Wang strength criterion is a triangle with a smooth convex curved edge and the failure surface of the DP strength criterion is a cone.
The Ottosen criterion can be formulated by the equations:
where is the first invariant of the stress tensor, ; is the second invariant of the partial tensor of stress, ; is the lode angle; ,, and are four parameters obtained from the experiment. is the uniaxial compressive strength of concrete.
The Guo Wang criterion can be described by the equations:
where is the octahedral normal stress, ; is the octahedral shear stress, ; is the maximum principal stress; is the intermediate principal stress; is the minimum principal stress; and are five parameters.
The Drucker–Prager criterion can be described by the equations:
where and are two parameters.
The failure criteria of Equations (3), (5) and (7) can be converted into the following forms:
These three typical strength criteria all presuppose the failure surface form of a convex surface, which cannot adapt to the failure criterion of concave failure curve surface shape that still exists in concrete [10]. However, the failure surface can be flexibly adapted to concave and convex forms through machine learning methods without presetting the function form. Next, the paper will use the following three machine learning algorithms, the BP neural network, the radial basis neural network and the random forest method, to estimate the failure curve surface function of the strength criterion, and comparative analysis is conducted with the three typical strength criteria mentioned above.
3. Multiaxial Strength Criterion for Concrete Based on Machine Learning
3.1. Machine Learning Approach
In this study, three machine learning methods, including the BP neural network (BP), the radial basis function neural network (RBF) and the random forest (RF), were used to establish strength criterion models for comparison.
BP [15]: The BP neural network is a typical representative of the artificial neural network [46]. It consists of an input layer, hidden layer and output layer, and mainly consists of a forwards multilayer feed-forwards process and error backpropagation process. Its learning mechanism is a generalized delta rule, which performs gradient descent on the error space when modifying the connection weights to minimize the total error between the actual calculated value of the output layer and the expected value. In other words, the gradient descent method is used to find the connection weights that minimize the error function using the least mean method, and the training is completed iteratively. This paper uses a multilayer perceptron trained by back propagation, the single hidden layer is adopted and the neuron node is 4. The Levenberg–Marquardt algorithm and purelin activation function were adopted.
RBF [16]: RBF is similar to BP in architecture. The main idea is to use the radial basis function as the “basis” of the hidden element to form the hidden layer space so that the input vector can be directly mapped to the hidden space without weight connection. When the center point of the radial basis function is determined, the mapping relation is determined. The main difference is the activation function used in the hidden layer. The RBF uses a radial basis function as the activation function. In this article, 1000 is used as the speed parameter.
RF [47]: RF is a typical representative ensemble machine learning algorithm. In an ensemble method, the decision from some individual algorithms is combined to make a more reasonable prediction. Therefore, for the same data set, the double randomness of the random forest makes it have better generalization ability and anti-overfitting ability. There are some hyperparameters in the RF model. The number of trees was set to 100. In this study, the maximum number of features was set to none (it is directly equal to the total number of features). The minimum number of samples in the split was set to 2. The number of samples in the leaf after splitting the node was set to 4.
3.2. Comparative Analysis with Typical Multiaxial Strength Criterion
3.2.1. Accuracy Analysis of the Strength Criterion
From the 777 groups of experimental data collected, 697 groups of data were selected as training sets and validation sets (training sets: 70%, validation sets: 30%). The remaining 80 groups were used for testing. According to the form of Equation (8), the neural network models are employed as in Equation (9). In this case, and are input variables. is the output variable. The data distribution of the training sets and validation sets are shown in Figure 3, and the data distribution of the test sets is shown in Figure 4. The size of is indicated by color.
Figure 5, Figure 6 and Figure 7 analyze the errors in the validation set. The errors of are indicated by colors. Red means the value is higher, and blue means the value is lower. The error absolute value of is indicated by points. According to the size of the dot, the smaller the point is, the smaller the absolute value of the error.
Combined with Figure 3, it can be seen that most of the current studies focus on , and data of in 697 training and validation sets account for 563 groups. Figure 5, Figure 6 and Figure 7 show that the error of the DP criterion, Ottosen criterion and Guo Wang criterion are significantly greater than the other three machine learning criterion models in 80 test sets, and the fitting accuracy is poor. Among them, the errors of the DP criterion, Guo Wang criterion and Ottosen criterion are obviously larger in the range of . Moreover, the predicted values are basically close to dark blue, indicating that the predicted values are smaller, which is relatively dangerous in engineering. In contrast, the errors of the three machine learning criterion models are always closer to 0. Although it tends to be blue when the shear stress of the octahedron is large, the deviation is smaller than the DP criterion, Guo Wang criterion and Ottosen criterion. Therefore, compared with the traditional strength criterion, the accuracy of machine learning has been improved.
In addition to the above simple error analysis, this study will also use the correlation coefficient (R), root mean square error (RMSE) and mean absolute error (MAE) to evaluate the compliance degree of the failure curve surface of the strength criterion. The value of R is used to judge the correlation between the actual value and the predicted value within the range. The closer R is to 1, the better the performance of the model. Both RMSE and MAE are the average errors between the measured actual and predicted outputs. The smaller the values of these two indexes are, the closer the shape of the failure curve surface is to reality. The comparison results between the neural network strength criterion model of the verification set and the classical strength criterion are shown in Table 1. R, RMSE and MAE are determined by the following equation:
where is the predicted value of the model and is the ground truth.
The data in Table 1 show that the correlation coefficient R of the three strength criterion models established based on machine learning is obviously superior to the Guo Wang criterion, Ottosen criterion and DP criterion, and the correlation value is higher, which can better reflect the relationship with the ground truth. For the error measurement indexes RMSE and MAE, the concrete strength criterion model based on random forest has the smallest error, the value of which for MAE is 4.07 and for RMSE is 6.01, and the established failure surface shape is more in line with reality than other models. Therefore, the RF model was selected as a typical model among the three machine learning methods for comparative analysis of rationality. At the same time, the correlation coefficient of the DP criterion is only 0.87 and the error index for MAE is 11.18 and for RMSE is 16.66, obviously deviating from the experimental values, and rationality analysis was no longer carried out in the follow-up.
3.2.2. Rationality Analysis of the Failure Curve Surface
The RF strength criterion model, Ottosen criterion surface and Guo Wang criterion surface were used to solve the same test data (Fc = 19.29 MPa). The three criteria are represented on the failure plane (Figure 8), the deviatoric plane (Figure 9 and Figure 10) and the tension–compression meridian (Figure 11). Their similarity is that the deviatoric plane is gradually convex and full from an approximate triangle. The difference is that the deviatoric plane of the RF strength criterion model contains both a convex surface and nonconvex surface (, ), while the Ottosen criterion and Guo Wang criterion only contain a convex surface. Liu [41] believed that the convex surface was only proposed based on mathematical or empirical methods rather than the failure mechanism of concrete, and the failure surface of concrete would also have a concave form. The RF model has no preset function form in advance and can be trained directly according to the test data, which can be very flexible to adapt to the failure surface concave and convex form. Another difference is that the Ottosen criterion and Guo Wang criterion overestimate the partial deviatoric stress at low hydrostatic pressure and underestimate the partial deviatoric stress at high hydrostatic pressure. At this point, the RF strength criterion model is closer to the expected range, although it is still underestimated at high hydrostatic pressure. The accuracy of the learning model can be improved by further accumulating data for the failure situation under high hydrostatic pressure.
The error measurement index RMSE, MAE and correlation coefficient R were analyzed for the prediction of the above three strength criterion models under the strength concrete with Fc = 19.29 MPa, as shown in Table 2. The correlation coefficient R of the strength criterion model obtained by RF is 0.99, which is the best. MAE and RMSE were also better than other strength criterion models, with values of 4.88 and 6.81, respectively.
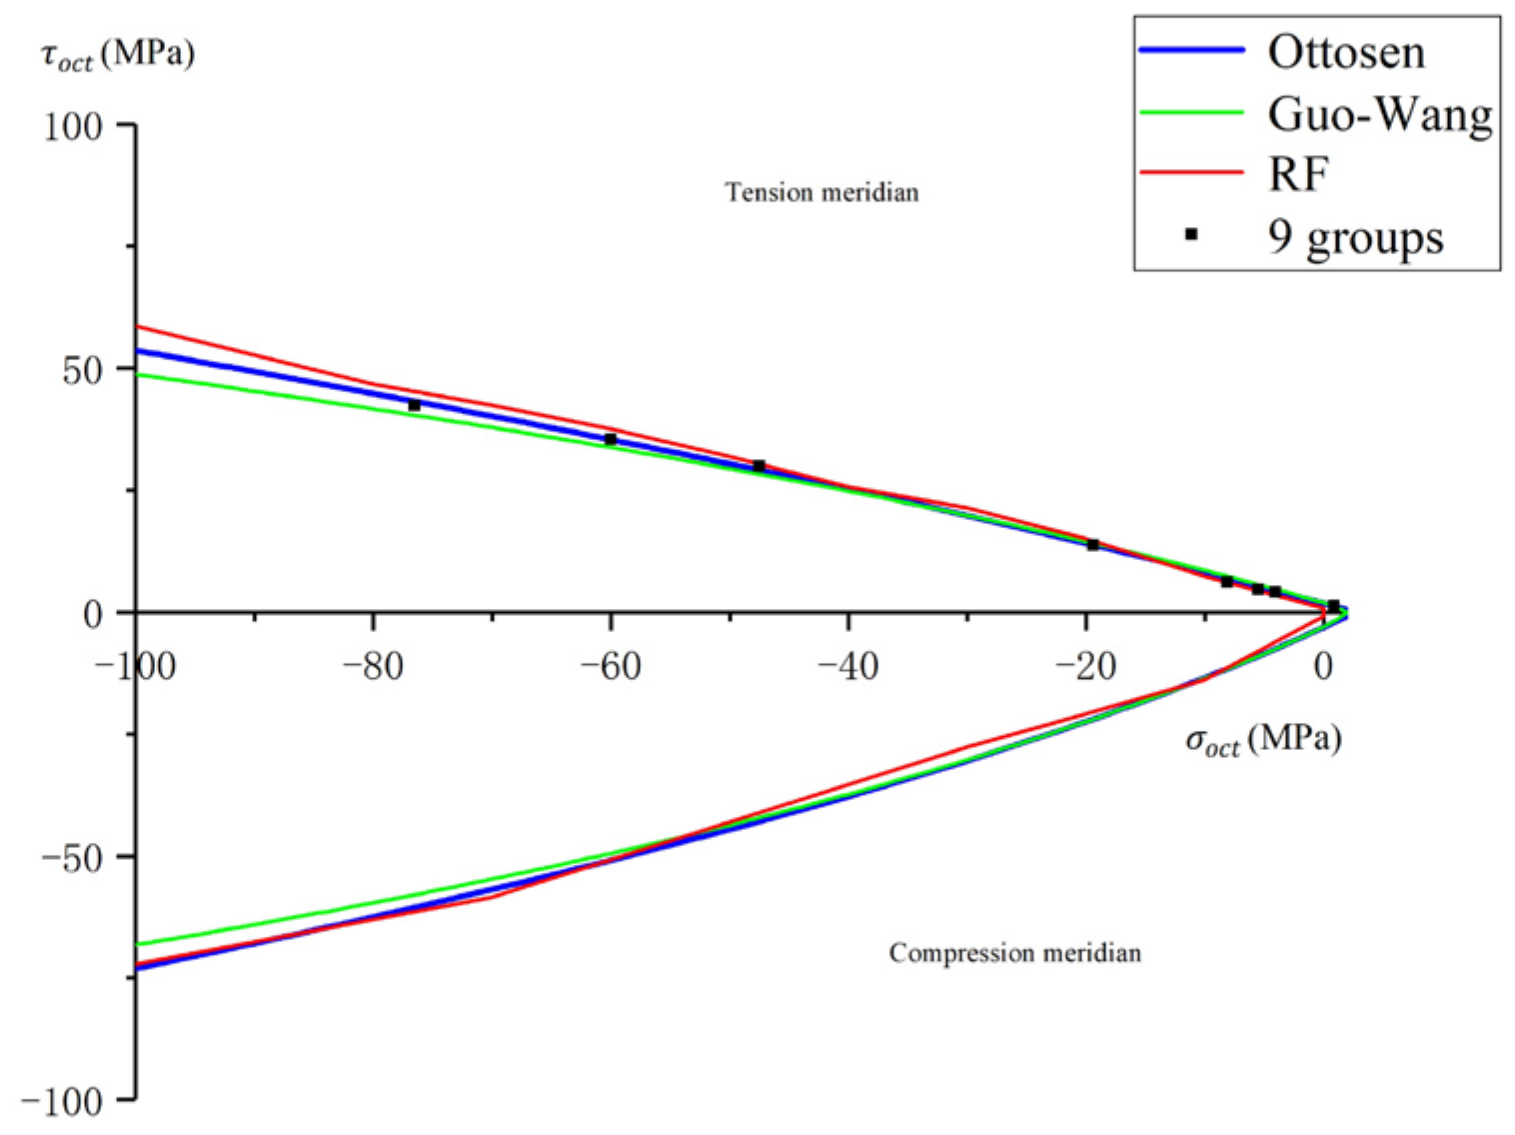
To compare the influence of concrete with different strengths on the strength criterion, this paper also studied the failure curve surface of concrete with Fc = 25.6 MPa, and the results were expressed on the failure surface (Figure 12), deviatoric plane (Figure 13 and Figure 14) and tension–compression meridian (Figure 15). The different rules reflected by several strength criteria are further compared with Figure 12, Figure 13, Figure 14 and Figure 15. The RF strength criterion model based on machine learning can well-reflect the change rule of the failure surface of concrete with different strengths and accords with the actual situation. Similar to the Guo Wang criterion and Ottosen criterion, the failure surface obtained by the RF machine learning model increases with increasing Fc, and the deviatoric plane changes to a gentle trend with increasing hydrostatic pressure. It can be seen that after training with enough data, the establishment of the concrete strength criterion by machine learning can provide reliable prediction for engineering applications and provide a new idea for the study of the concrete failure criterion and failure mechanism.
Similarly, the prediction error measurement index RMSE, MAE and correlation coefficient R were analyzed for concrete with Fc = 19.29 MPa, as shown in Table 3. The correlation coefficient R of the intensity criterion model obtained by RF is always 0.99, and the shape fitting is the best. Its error coefficients MAE and RMSE are slightly higher than the Ottosen strength criterion but lower than the Guo Wang strength criterion. It can be seen that different strength grades have a certain impact on the accuracy of the model, but the RF model always has a good fit, which can be used as a method to study the concrete strength criterion.
4. Conclusions
In this paper, 777 groups of experimental data are collected, and a multiaxial strength criterion model of concrete is established by using a machine learning method, which is compared with the classical strength criterion. The main conclusions can be summarized as follows:
(1) Based on the damage of concrete test data, using three kinds of machine learning algorithms to build strength criteria can allow them to adapt to the concrete strength failure surface shape of concave and convex function characteristics. Compared with the classical strength criterion model, the model accuracy of machine learning algorithms has been greatly improved. Among them, the strength criterion model established by the random forest method has the smallest error (MAE is 4.07, RMSE is 6.01), and the shape of the failure surface is closest to the experimental situation.
(2) In terms of rationality, the RF strength criterion model realizes the conversion of concave surfaces and convex surfaces. Moreover, the RF strength criterion model can respond to the shape of the strength criterion with different concrete strengths, which can be used as a method to study the concrete strength criterion.
(3) The DP criterion, Ottosen criterion and Guo Wang criterion have large errors in the region of high octahedral shear stress, but their mathematical models have been fixed, so it is difficult to carry out large shape adjustment.
(4) The training data are still insufficient, and more data can be collected for training in the future. At the same time, with increasing in-depth research on concrete strength criteria, the influence of environmental factors such as temperature and humidity on concrete strength has been gradually mentioned, and environmental factors can also be used as input variables for subsequent research, which is of great significance for ensuring the strength and safety of concrete projects in complex environments such as high temperature, high coldness and deep water.
Author Contributions
Conceptualization, X.C.; Methodology, X.C.; Validation, X.W.; Formal analysis, Y.L.; Investigation, H.J.; Data curation, J.Q.; Writing—original draft, X.C.; Supervision, D.Z.; Funding acquisition, D.Z. All authors have read and agreed to the published version of the manuscript.
Funding
National Natural Science Foundation of China (Grant No. 52179128).
Institutional Review Board Statement
Not applicable.
Informed Consent Statement
Not applicable.
Data Availability Statement
The data that support the findings of this study are available from the corresponding author, [Dongjian Zheng], upon reasonable request.
Conflicts of Interest
The authors declare no conflict of interest.
References
- Chen, W.F. Plasticity in Reinforced Concrete; McGraw-Hill: New York, NY, USA, 1982. [Google Scholar]
- Bresler, B.; Pister, K.S. Strength of concrete under combined stresses. J. Proc. 1958, 55, 321–345. [Google Scholar]
- William, K.J.; Warnke, E.P. Constitutive Models for the Triaxial Behavior of Concrete; ETH: Zurich, Switzerland, 1975; Volume 19, pp. 1–30. [Google Scholar]
- Ottosen, N.S. A failure criterion for concrete. J. Eng. Mech. 1977, 103, 527–535. [Google Scholar] [CrossRef]
- Hesieh, S.S.; Ting, E.C.; Chen, W.F. An elasticity-fracture model for concrete. In Proceeding of 3rd Engineering Mechanics Division, Special Conference ASCE, Austin, TX, USA, 17–19 September 1979; pp. 437–440. [Google Scholar]
- Kotsovos, M.D. A mathematical description of the strength properties of concrete under generalized stress. Mag. Concr. Res. 1979, 31, 151–158. [Google Scholar] [CrossRef]
- Podgorski, J. General failure criterion for isotropic media. J. Eng. Mech. 1984, 111, 188–201. [Google Scholar] [CrossRef]
- Guo, Z.; Wang, C. Research on Strength and Failure Criterion of Concrete under Multi-axial Stress. China Civ. Eng. J. 1991, 3, 1–14. (In Chinese) [Google Scholar]
- Jiang, J.-J. Nonliner Finite Element Analysis of Reinforced Concrete Structures; Shanxi Science and Technology Publishing House: Xi’an, China, 1994. (In Chinese) [Google Scholar]
- Liu, X.; Yang, Z. Failure mechanism criterion for multiaxial strength of concrete after exposure to normal and high temperatures. Constr. Build. Mater. 2016, 125, 105–118. [Google Scholar] [CrossRef]
- Liu, X.; Yang, Z. Evaluation of several multiaxial failure criteria for concrete after freeze-thaw (F-T) cycles. Constr. Build. Mater. 2017, 142, 233–247. [Google Scholar] [CrossRef]
- Zhou, J.; Pan, J.; Leung, C.K.Y.; Li, Z. Experimental study on mechanical behavior of high performance concrete under multi-axial compressive stress. Sci. China (Technol. Sci.) 2014, 57, 2514–2522. [Google Scholar] [CrossRef]
- Wang, Y.Z.; Wang, Y.B.; Zhao, Y.Z.; Li, G.Q.; Lyu, Y.F.; Li, H. Experimental study on ultra-high performance concrete under triaxial compression. Constr. Build. Mater. 2020, 263, 120225. [Google Scholar] [CrossRef]
- Yu, Z.; Huang, Q.; Xie, X.; Xiao, N. Experimental study and failure criterion analysis of plain concrete under combined compression-shear stress. Constr. Build. Mater. 2018, 179, 198–206. [Google Scholar] [CrossRef]
- Kim, J.I.; Kim, D.K.; Feng, M.Q.; Yazdani, F. Application of Neural Networks for Estimation of Concrete Strength. J. Mater. Civ. Eng. 2004, 16, 257–264. [Google Scholar] [CrossRef]
- Wu, N.J. Predicting the Compressive Strength of Concrete Using an RBF-ANN Model. Appl. Sci. 2021, 11, 6382. [Google Scholar] [CrossRef]
- El Asri, Y.; Aicha, M.B.; Zaher, M.; Alaoui, A.H. Prediction of compressive strength of self-compacting concrete using four machine learning technics. Mater. Today Proc. 2022, 57, 859–866. [Google Scholar] [CrossRef]
- Ikumi, T.; Galeote, E.; Pujadas, P.; de la Fuente, A.; López-Carreño, R.D. Neural network-aided prediction of post-cracking tensile strength of fibre-reinforced concrete. Comput. Struct. 2021, 256, 106640. [Google Scholar] [CrossRef]
- Zhao, Z. Failure Criterion of Concrete under Triaxial Stresses Using Neural Networks. Comput.-Aided Civ. Infrastruct. Eng. 2002, 17, 68–73. [Google Scholar] [CrossRef]
- Babanajad, S.K.; Gandomi, A.H.; Alavi, A.H. New prediction models for concrete ultimate strength under true-triaxial stress states: An evolutionary approach. Adv. Eng. Softw. 2017, 110, 55–68. [Google Scholar] [CrossRef]
- Reuter, U.; Sultan, A.; Reischl, D.S. A comparative study of machine learning approaches for modeling concrete failure surfaces. Adv. Eng. Softw. 2018, 116, 67–79. [Google Scholar] [CrossRef]
- Shang, H.-S.; Song, Y.-P. Triaxial compressive strength of air-entrained concrete after freeze–thaw cycles. Cold Reg. Sci. Technol. 2013, 90–91, 33–37. [Google Scholar] [CrossRef]
- Zhou, W.; Feng, P.; Lin, H. Constitutive relations of coral aggregate concrete under uniaxial and triaxial compression. Constr. Build. Mater. 2020, 251, 118957. [Google Scholar] [CrossRef]
- Shang, H.; Song, Y.; Ou, J. Behavior of air-entrained concrete after freeze-thaw cycles. Cold Reg. Sci. Technol. 2013, 89, 1–6. [Google Scholar] [CrossRef]
- Shi, L.; Wang, L.; Song, Y.; Shen, L. Dynamic multiaxial strength and failure criterion of dam concrete. Constr. Build. Mater. 2014, 66, 181–191. [Google Scholar] [CrossRef]
- IWHR. Chinese Translation and Collection of Strength and Failure of Concrete; China Hydraulic Press: Beijing, China, 1982. (In Chinese) [Google Scholar]
- Ma, G.; Zeng, W. Calculation of Three-Dimensional Stress Concrete with a New Three-Parameter Criterion; Proceedings of the Second Symposium on Basic Theory and Application of Concrete Structures: Beijing, China, 1990; p. 7. (In Chinese) [Google Scholar]
- Song, Y.; Zhao, G.; Peng, F. Strength of lightweight concrete under triaxial compression. J. Hydraul. Eng. 1993, 6, 10–16. (In Chinese) [Google Scholar]
- Mills, L.L.; Zimmerman, R.M. Compressive strength of plain concrete under multiaxial loading conditions. ACI J. Proc. 1970, 67, 802–807. [Google Scholar]
- Rukhaiyar, S.; Sajwan, G.; Samadhiya, N.K. Strength Behavior of Plain Cement Concrete Subjected to True Triaxial Compression; NRC Research Press: Ottawa, ON, Canada, 2017; p. 45. [Google Scholar]
- Wang, C.; Guo, Z.; Zhang, X. Strength test of concrete under biaxial and triaxial compression. China Civ. Eng. J. 1987, 1, 15–27. (In Chinese) [Google Scholar]
- Shang, H.-S.; Ji, G.-J. Mechanical behaviour of different types of concrete under multiaxial compression. Mag. Concr. Res. 2014, 66, 870–876. [Google Scholar] [CrossRef]
- Song, Y. The Multiaxial Strength of Large Aggregate Concrete after Freeze-Thaw Cycles and Failure Criteria in Octahedral Stress Space, Final Report to NNSFC. 2009. Available online: http://npd.nsfc.gov.cn/ (accessed on 10 December 2015). (In Chinese)
- Rong, C.; Shi, Q.; Zhang, T.; Zhao, H. New failure criterion models for concrete under multiaxial stress in compression. Constr. Build. Mater. 2018, 161, 432–441. [Google Scholar] [CrossRef]
- Lee, S.-K.; Song, Y.-C.; Han, S.-H. Biaxial behavior of plain concrete of nuclear containment building. Nucl. Eng. Des. 2003, 227, 143–153. [Google Scholar] [CrossRef]
- Yu, Z.; Sun, X.; Li, F. Experimental Analysis and Failure Criterion of Plain Concrete Subjected to Biaxial Loading under Fixed Lateral Loading. Adv. Civ. Eng. 2019, 2019, 7059475. [Google Scholar] [CrossRef]
- He, Z.-J.; Song, Y.-P. Multiaxial tensile-compressive strengths and failure criterion of plain high-performance concrete before and after high temperatures. Constr. Build. Mater. 2010, 24, 498–504. [Google Scholar] [CrossRef]
- He, Z.; Song, Y. Multiaxial tension and compression properties of high-strength and high-performance concrete. Eng. Mech. 2010, 27, 190–195. (In Chinese) [Google Scholar]
- Kalifa, P.; Menneteau, F.D.; Quenard, D. Spalling and pore pressure in HPC at high temperatures. Cem. Concr. Res. 2000, 30, 1915–1927. [Google Scholar] [CrossRef]
- Hampel, T.; Speck, K.; Scheerer, S.; Ritter, R.; Curbach, M. High-Performance Concrete under Biaxial and Triaxial Loads. J. Eng. Mech. 2009, 135, 1274–1280. [Google Scholar] [CrossRef]
- Zhou, J.; Pan, J.; Ma, H.; Zhao, J.; Li, Z. Behavior of high-performance concrete under multiaxial tensile-compressive loading. Constr. Build. Mater. 2020, 260, 119887. [Google Scholar] [CrossRef]
- Zhou, J.; Pan, J.; Yao, S.; Zhao, J.; Zhang, Z. Experimental study on triaxial tension and compression properties of high-strength and high-performance concrete. Eng. Mech. 2018, 35, 144–150. (In Chinese) [Google Scholar]
- Zhou, J.; Pan, J.; Zhang, L.; Zhao, J.; Li, Z. Experimental study on mechanical behavior of high-strength high-performance concrete under biaxial loading. Constr. Build. Mater. 2020, 258, 119681. [Google Scholar] [CrossRef]
- Wang, L.; Song, Y. A four-parameter multiaxial strength criterion for lightweight aggregate concrete. China Civ. Eng. J. 2005, 7, 27–33. (In Chinese) [Google Scholar]
- Chen, X.; Zheng, D.; Wu, X.; Li, C. A Review of Three Common Concrete Multiaxial Strength Criteria from 2010 to 2020. Arch. Comput. Methods Eng. 2022. [Google Scholar] [CrossRef]
- Yan, Z.H.; Zeng, L. The BP Neural Network with MATLAB. In Proceedings of the International Conference on Electrical, Control and Automation Engineering (ECAE), Hong Kong, China, 1–2 December 2013; pp. 565–569. [Google Scholar]
- Nasir, V.; Kooshkbaghi, M.; Cool, J.; Sassani, F. Cutting tool temperature monitoring in circular sawing: Measurement and multi-sensor feature fusion-based prediction. Int. J. Adv. Manuf. Technol. 2021, 112, 2413–2424. [Google Scholar] [CrossRef]
Figure 1.
Failure curve surface.
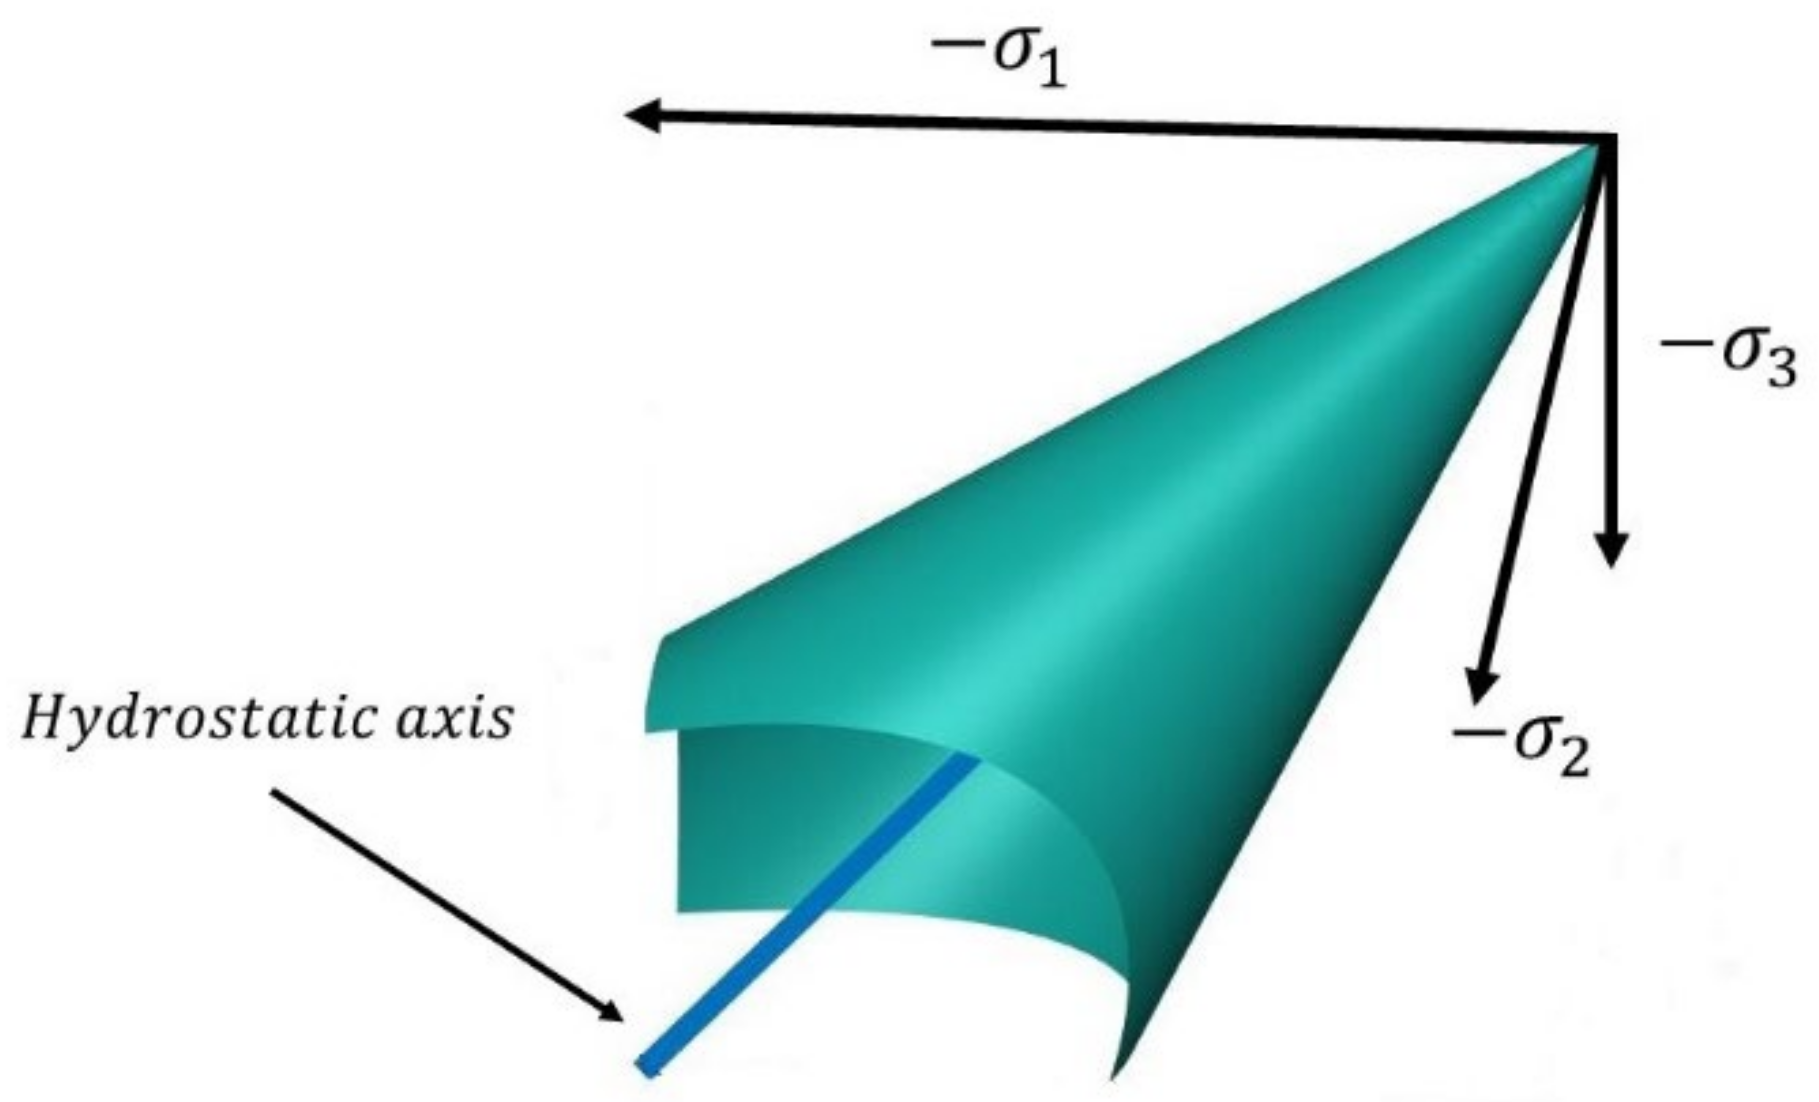
Figure 2.
Deviatoric plane.
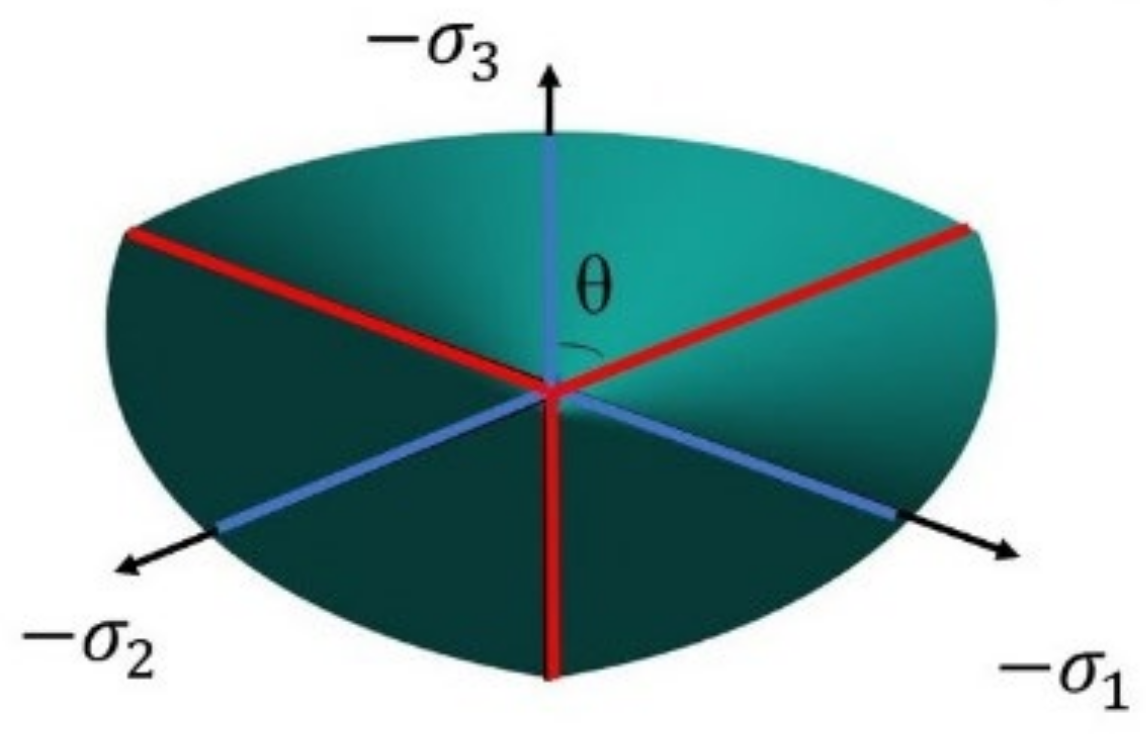
Figure 3.
Data distribution of the training and validation sets.
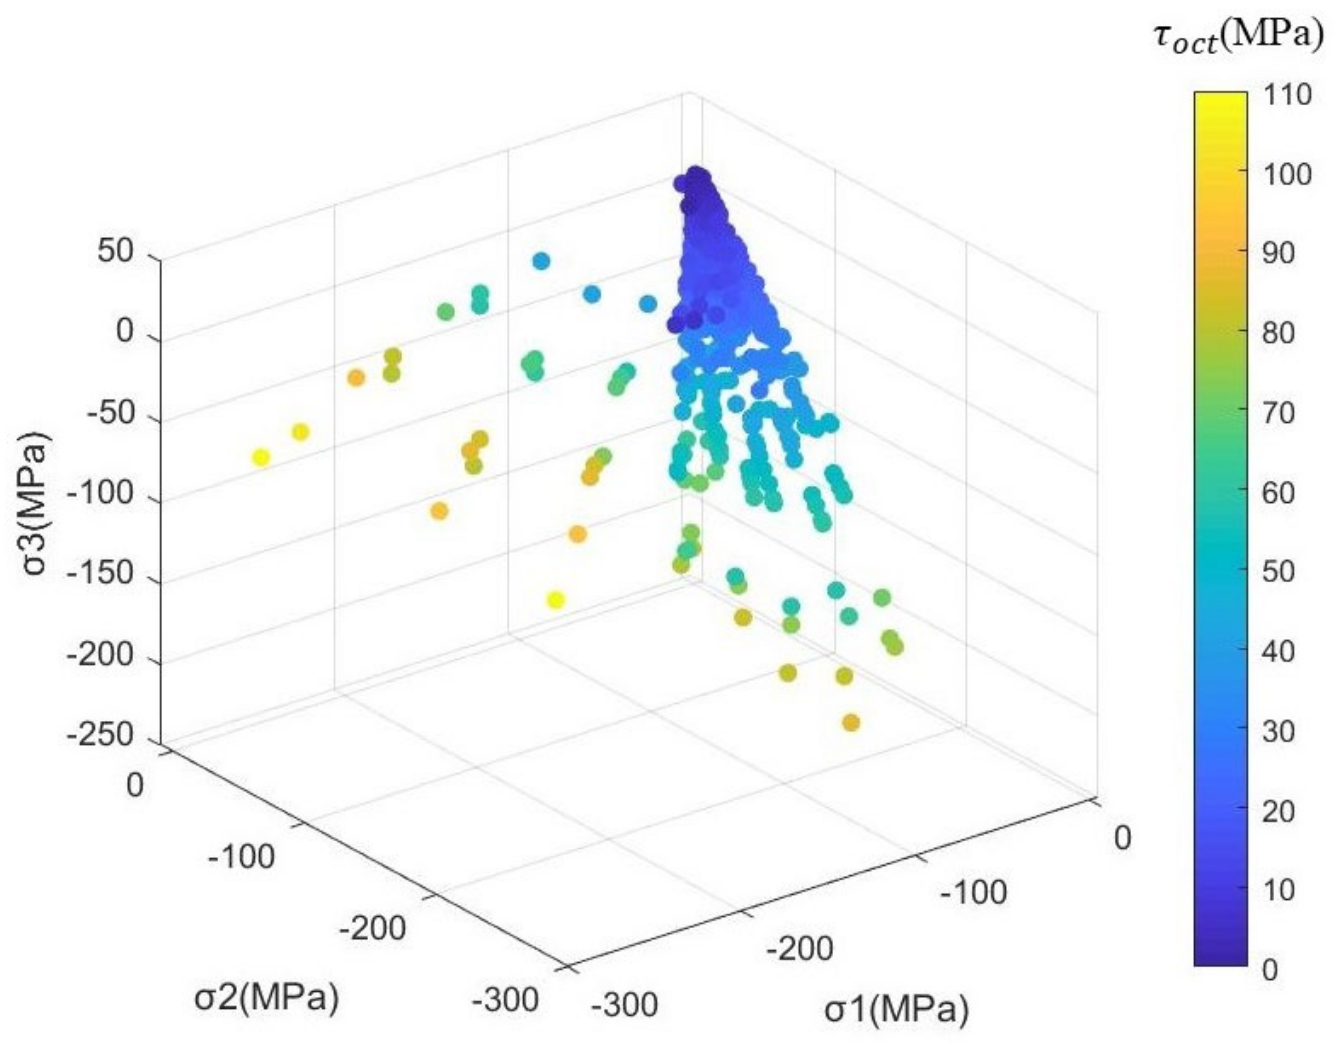
Figure 4.
Data distribution of the test set.
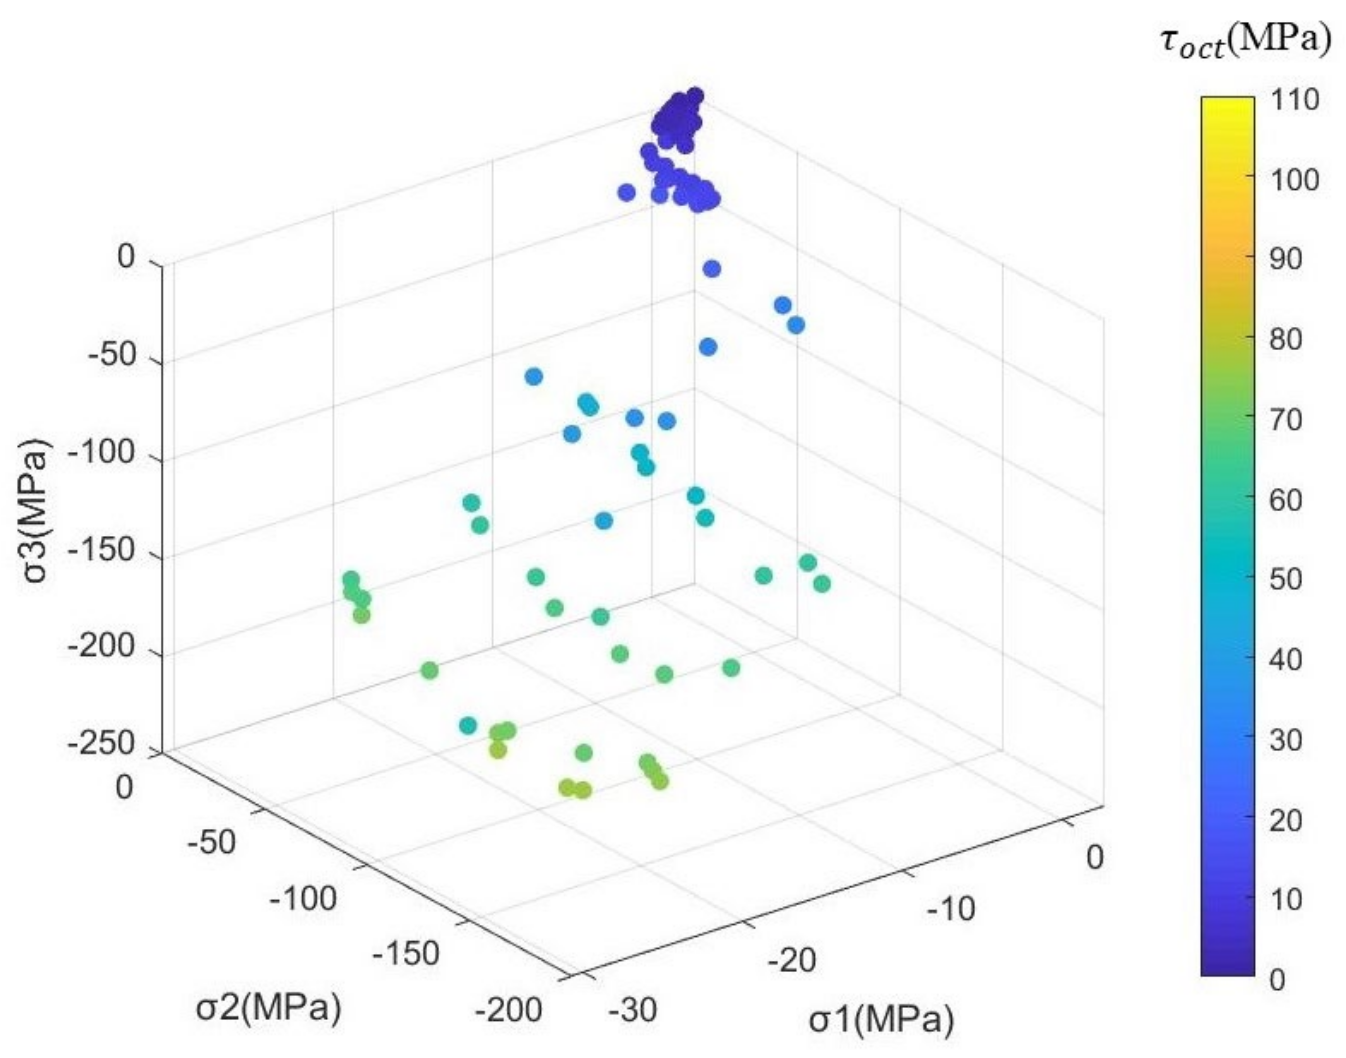
Figure 5.
The error of Ottosen (left) and Guo Wang (right) criterion.
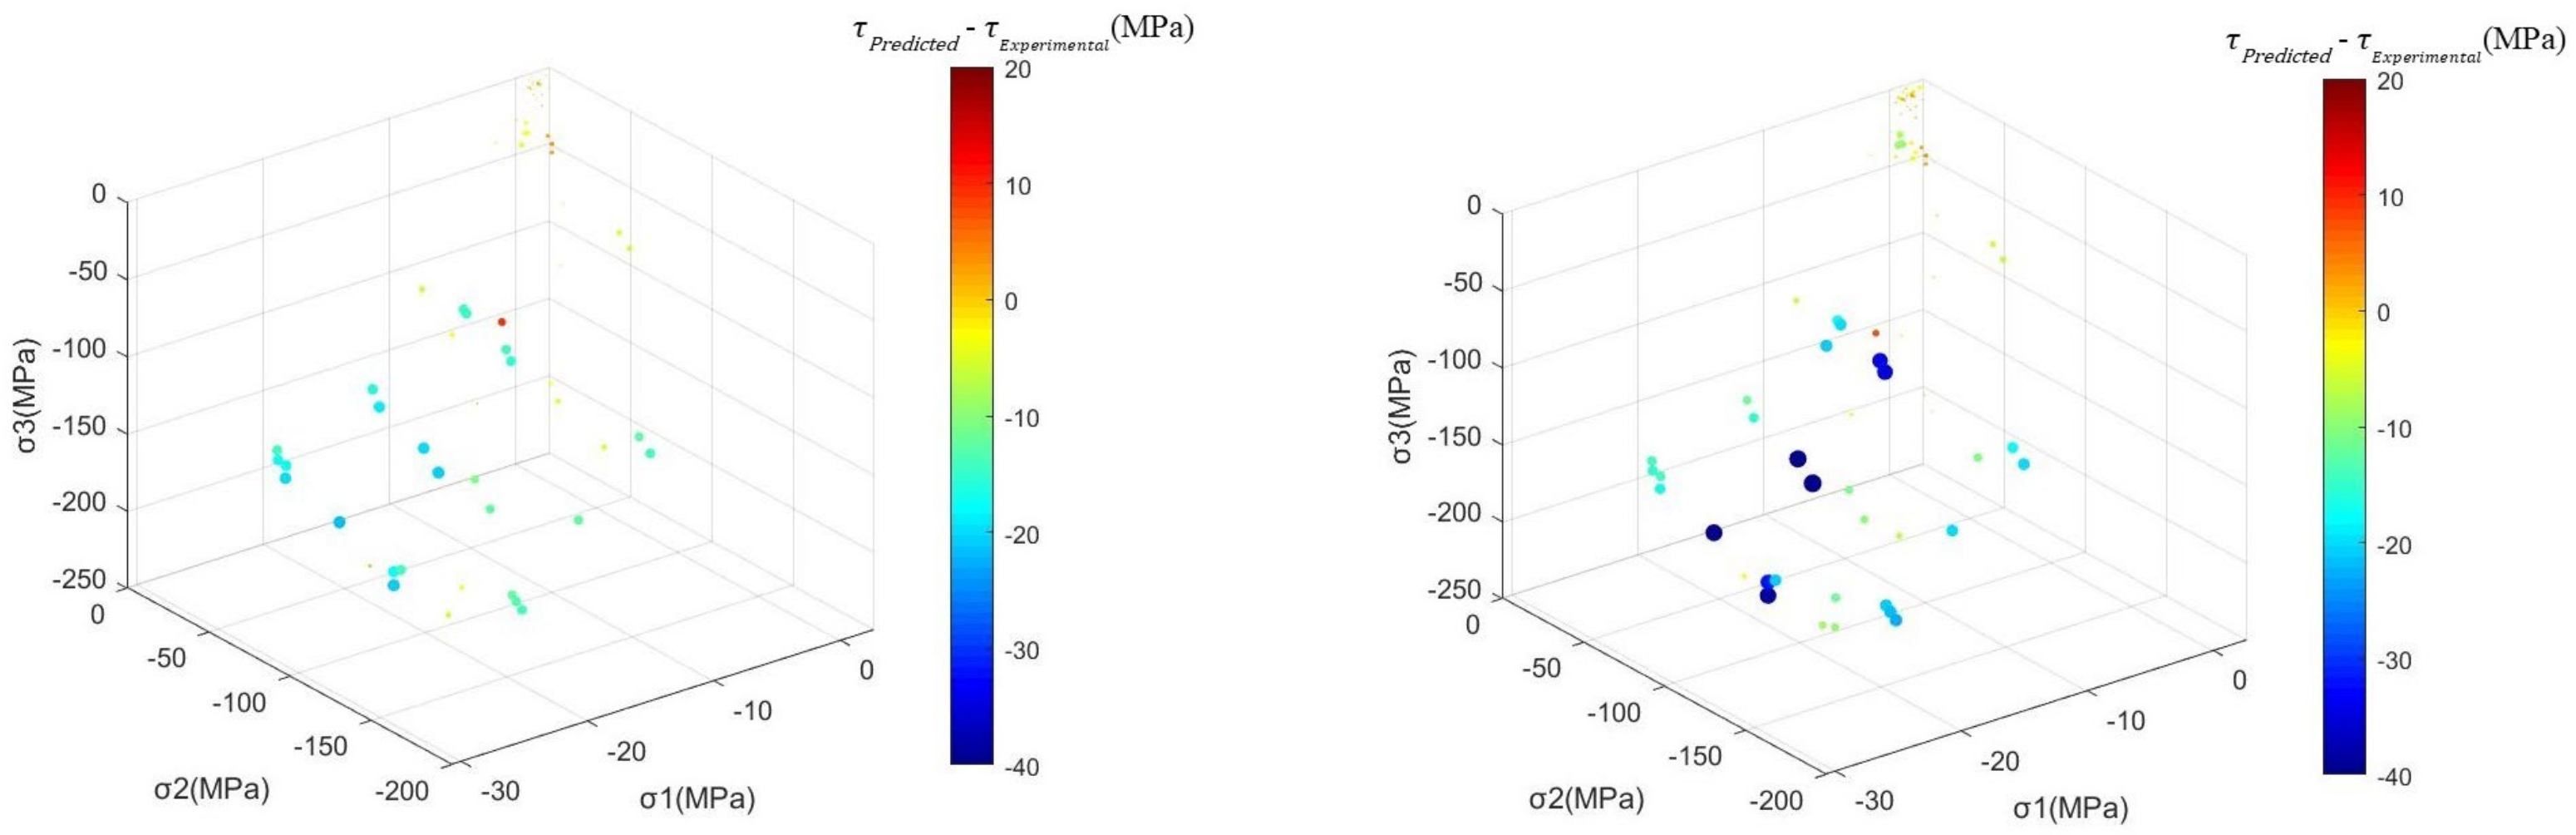
Figure 6.
The error of D-P (left) and B-P (right) criterion.
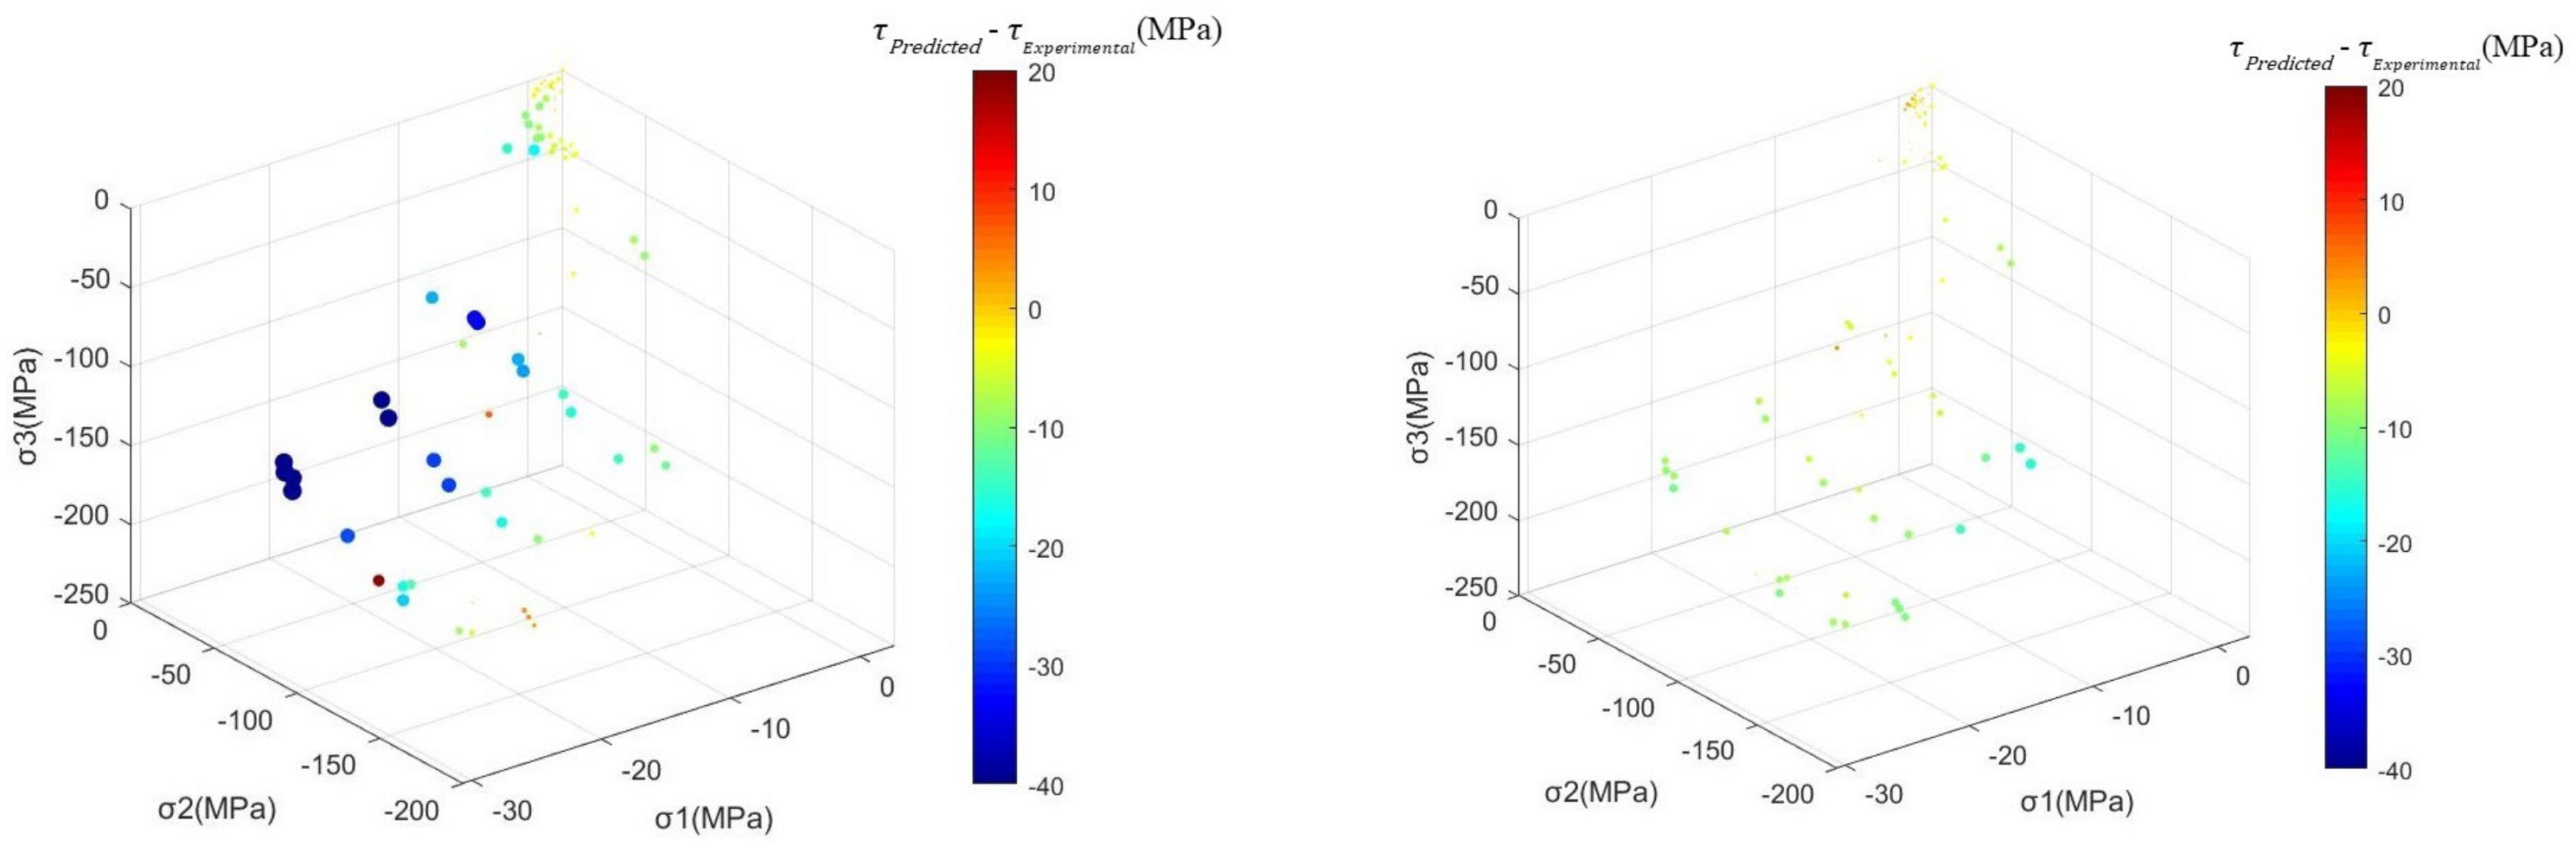
Figure 7.
The error of RBF (left) and RF (right) criterion.
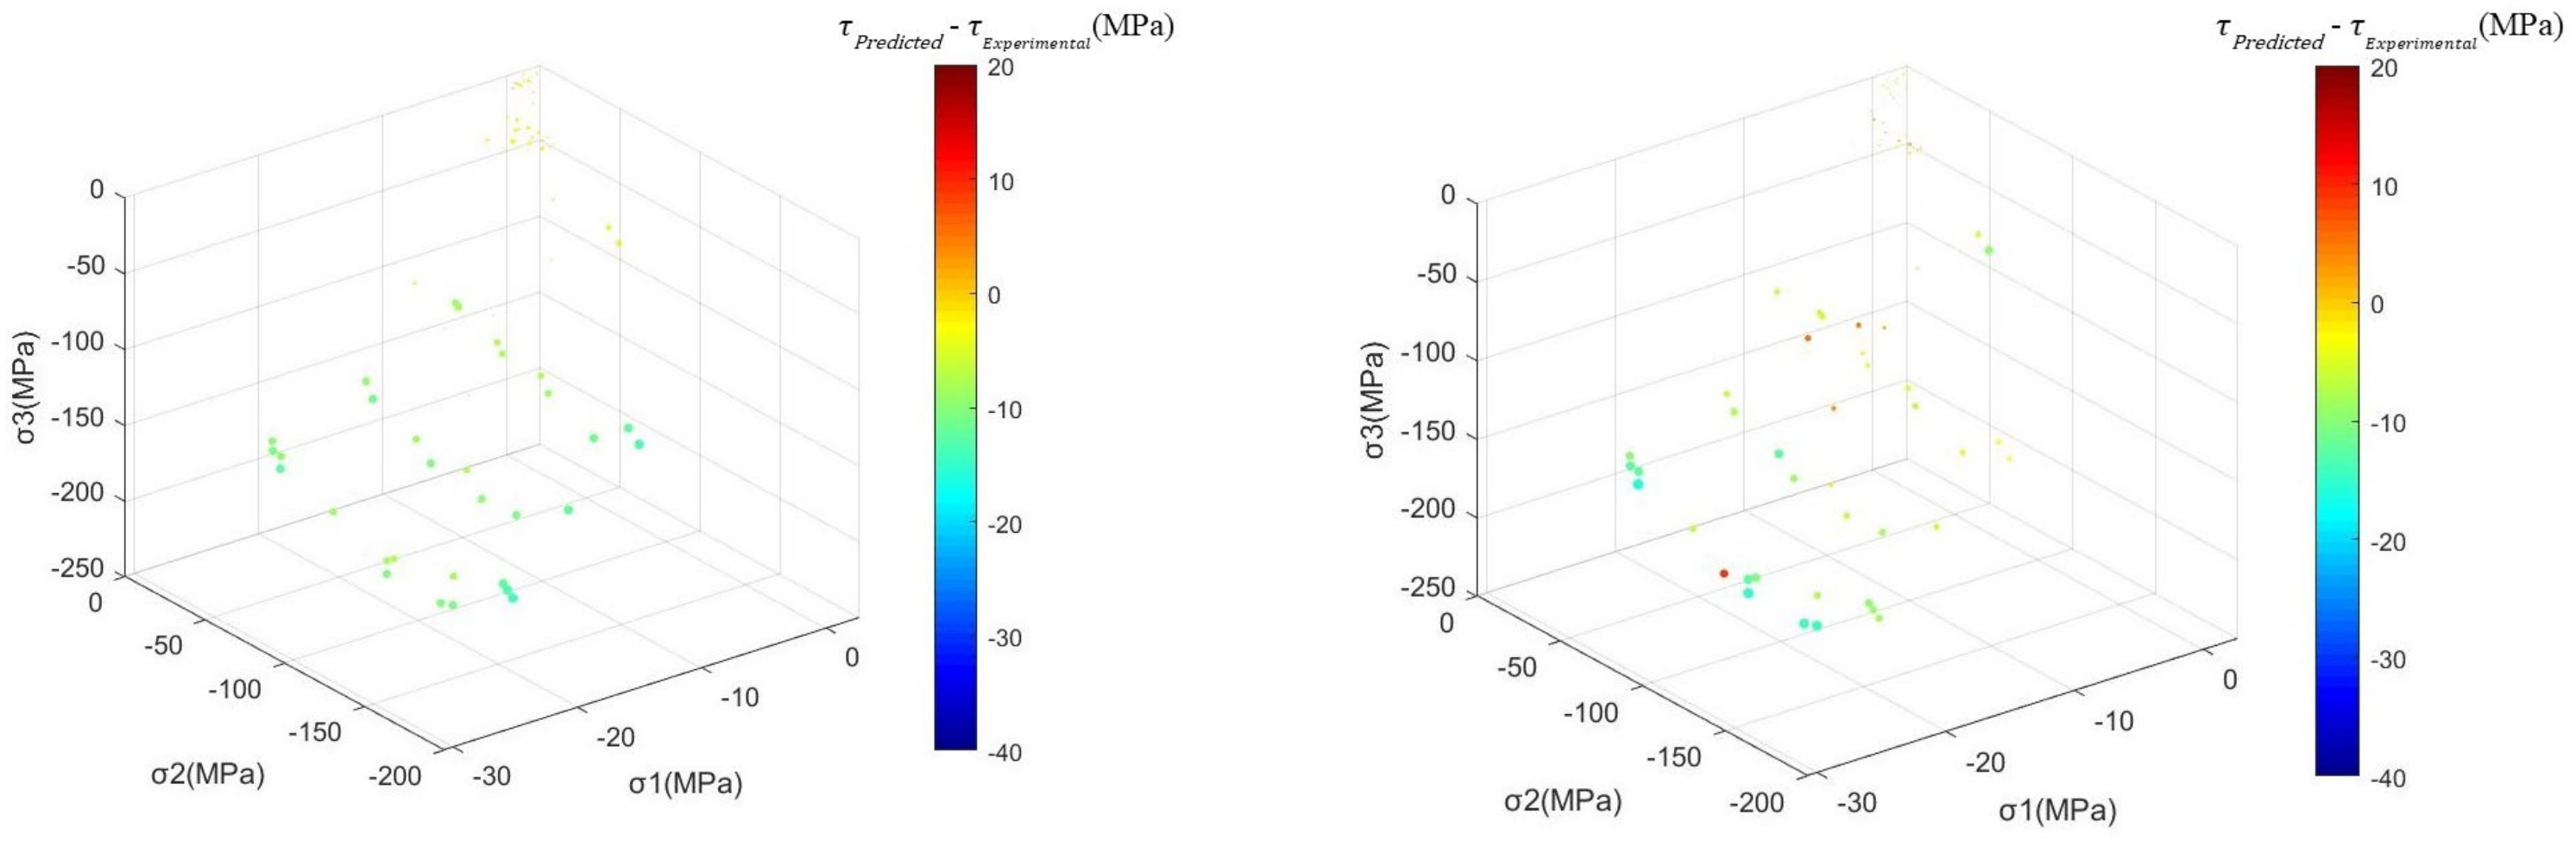
Figure 8.
A 3D view of the failure surface.

Figure 9.
Deviatoric plane of the RF model.

Figure 10.
Deviatoric plane of the Ottosen (left) and Guo Wang (right) criterion.
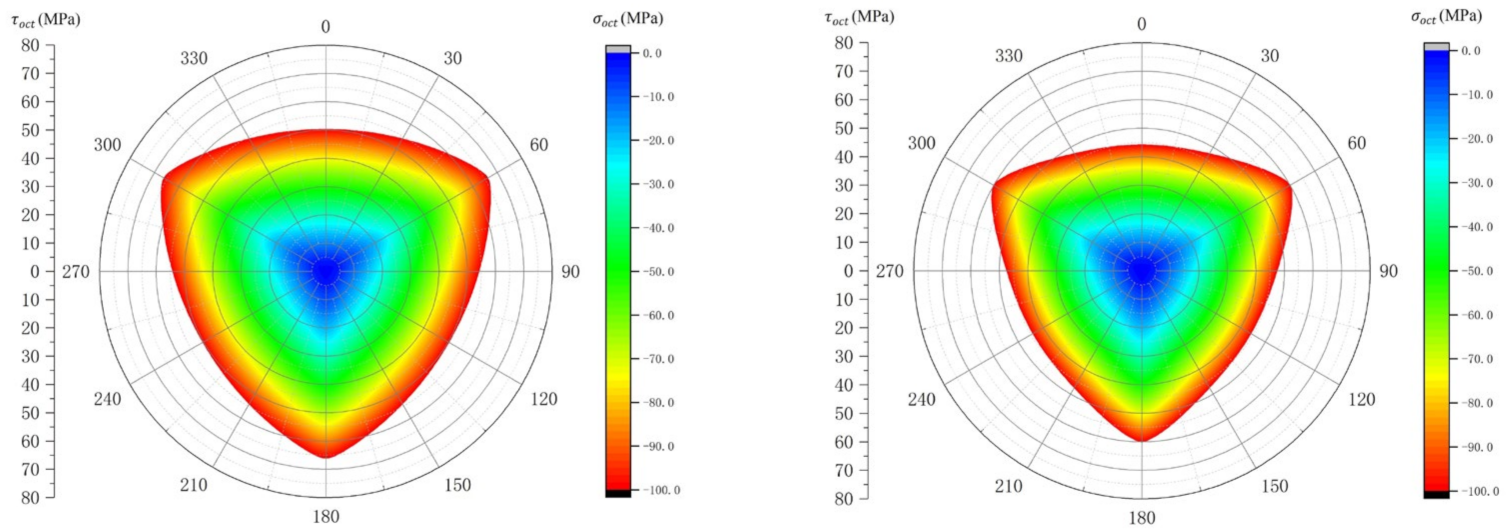
Figure 11.
Tension and compression meridian.
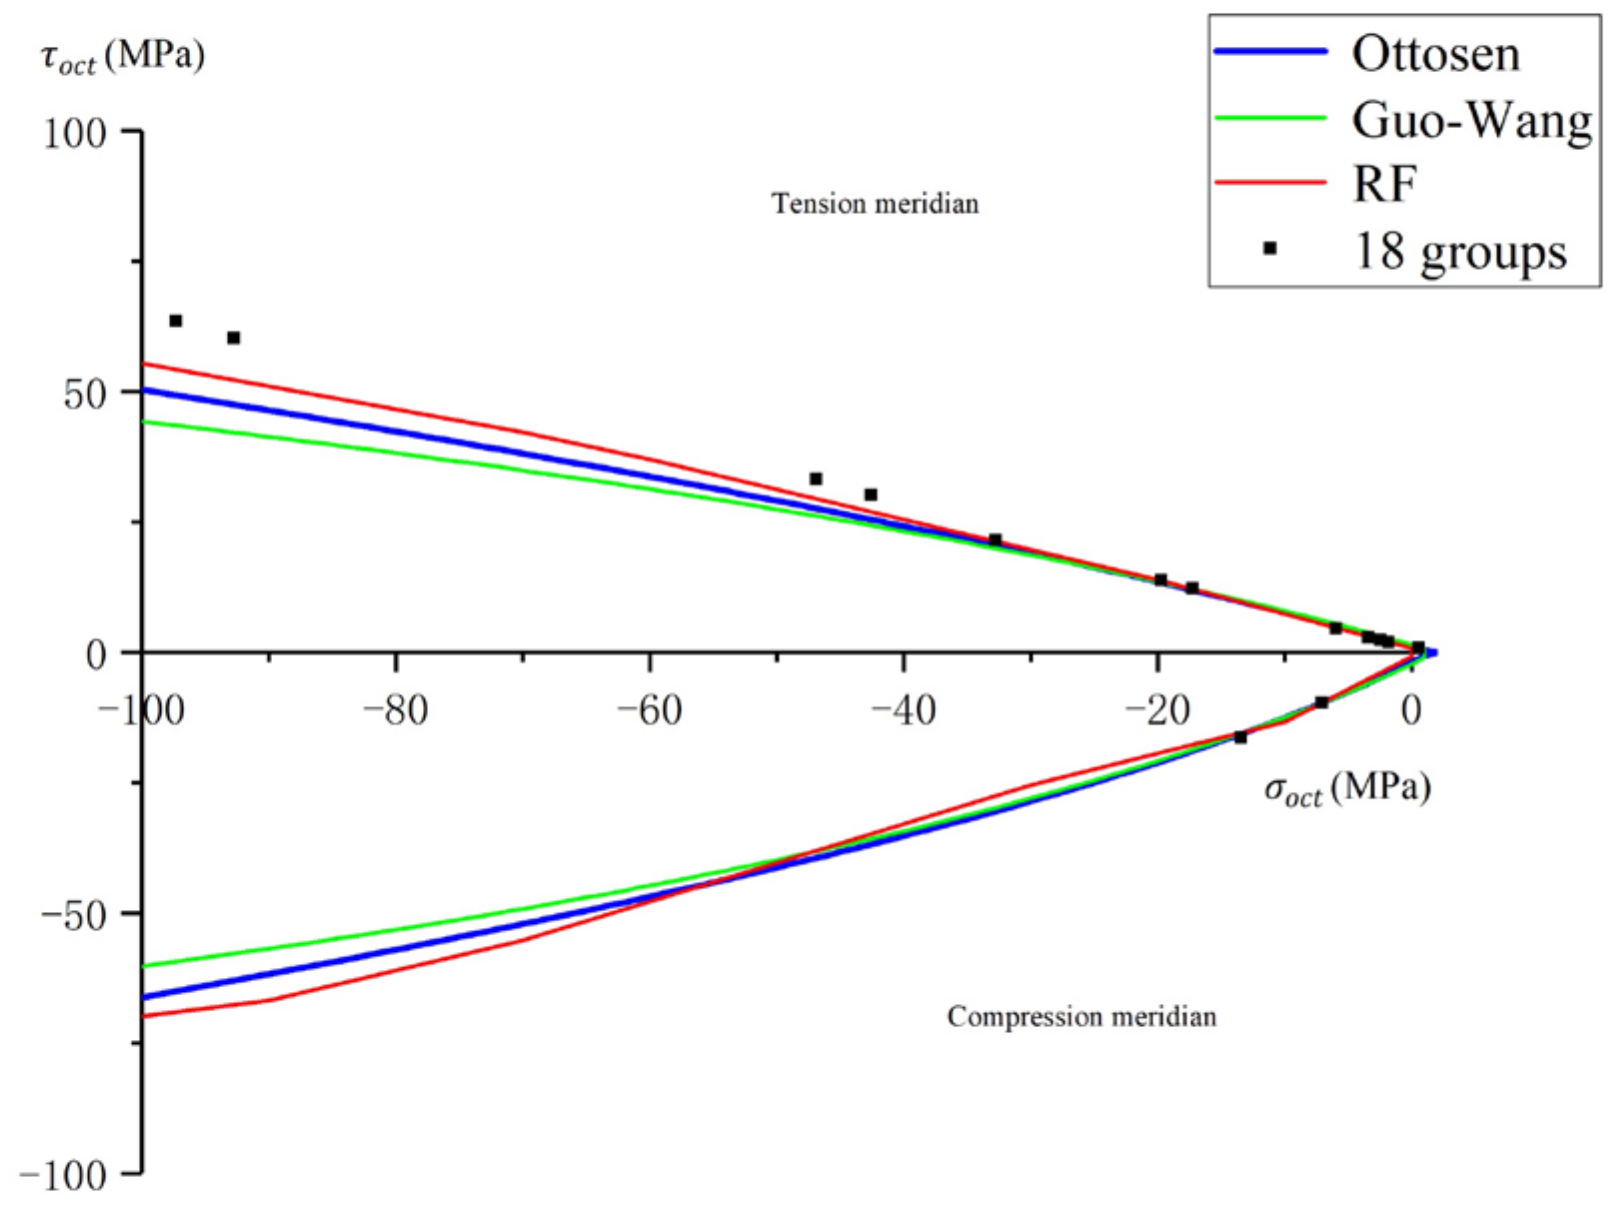
Figure 12.
A 3D view of the failure surface.
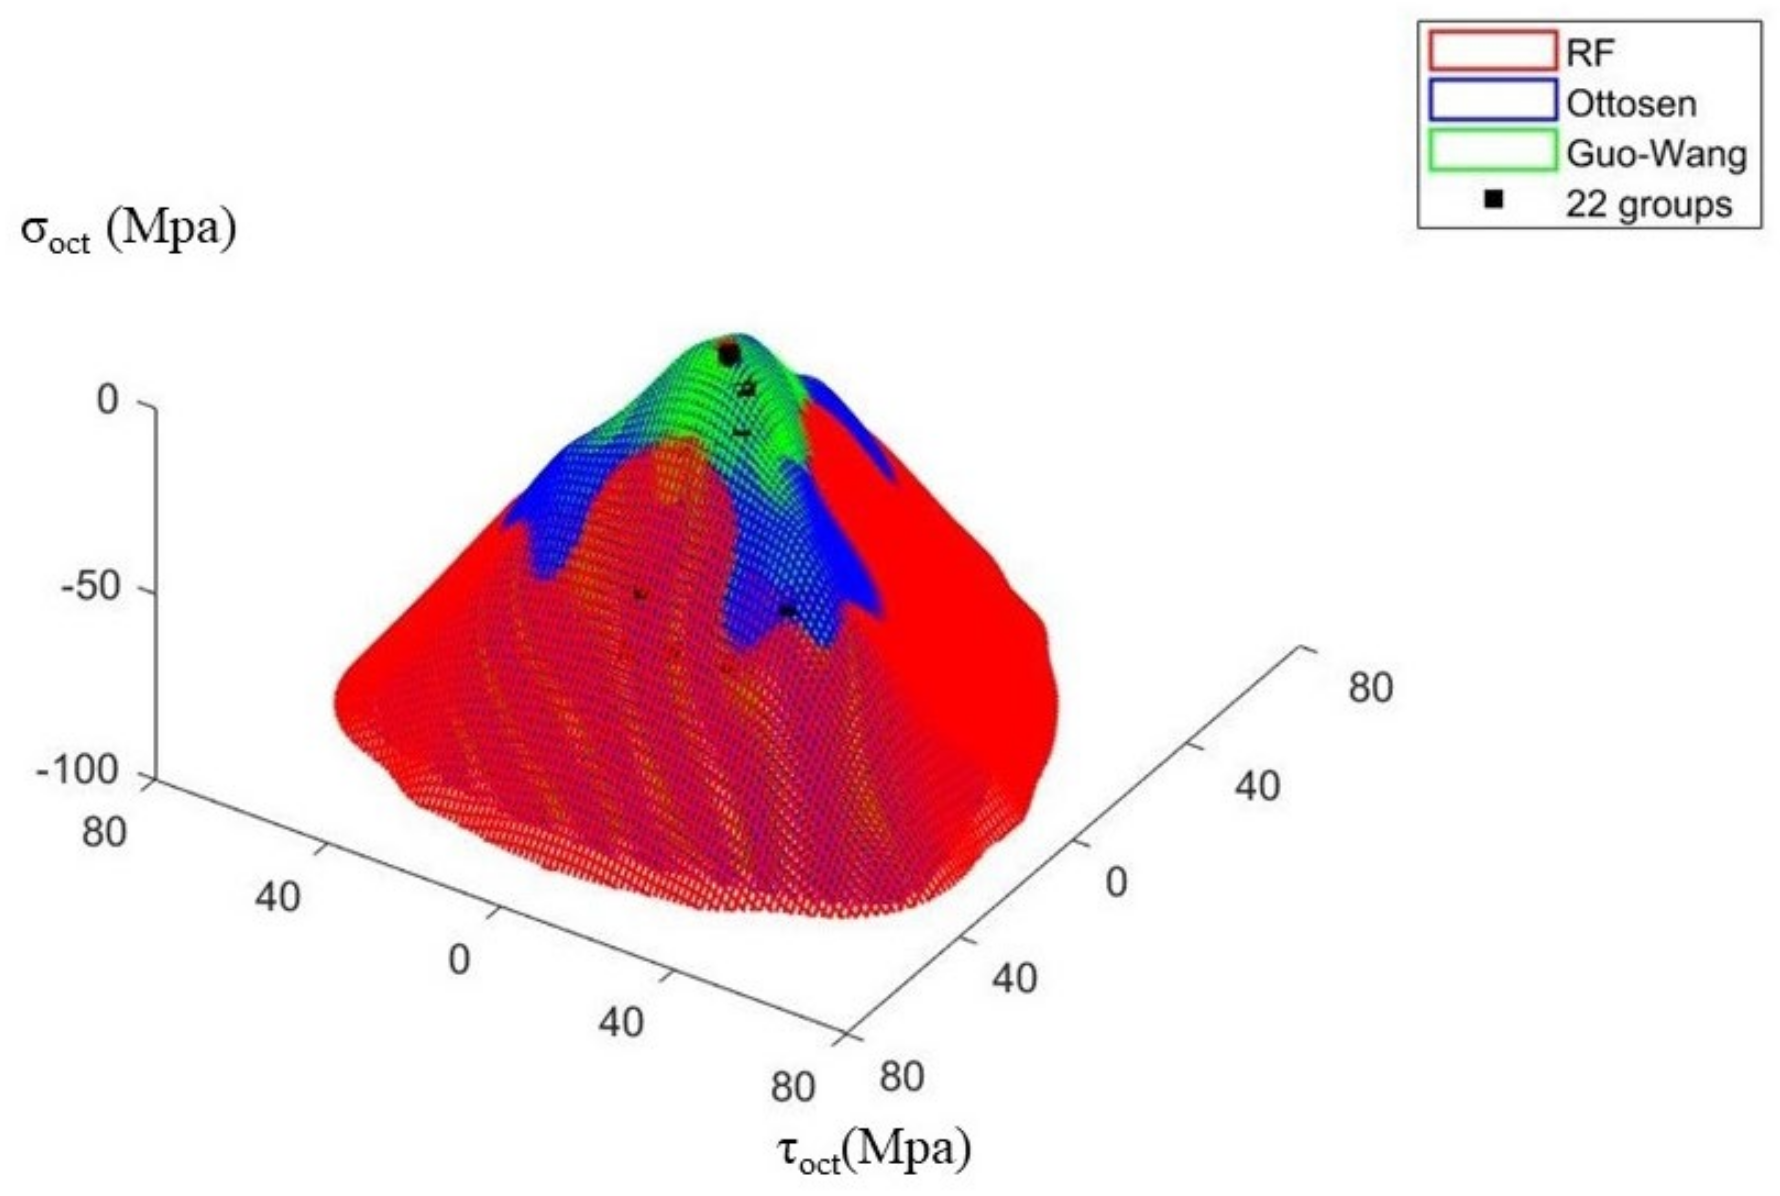
Figure 13.
Deviatoric plane of the RF model.
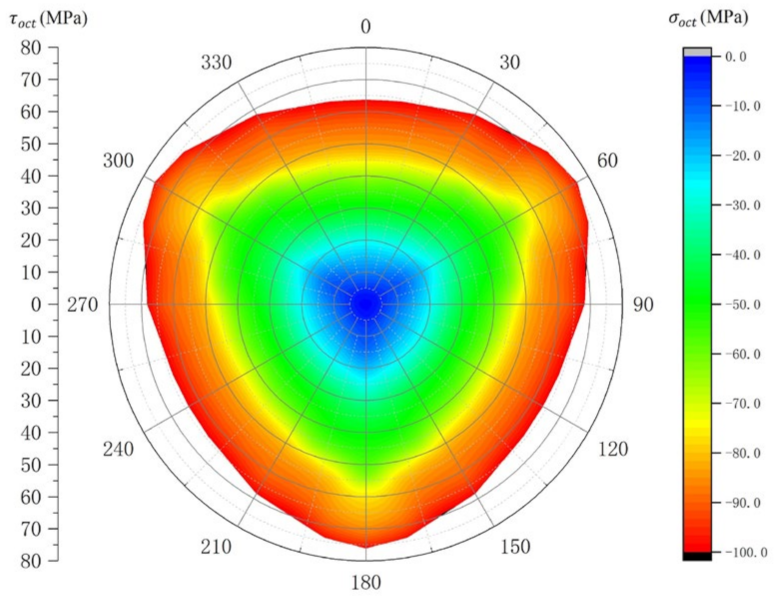
Figure 14.
Deviatoric plane of the Ottosen (left) and Guo Wang (right) criterion.

Figure 15.
Tension and compression meridian.

Table 1.
Comparison between the neural network strength criterion model and classical strength criterion.
Table 1.
Comparison between the neural network strength criterion model and classical strength criterion.
| Guo Wang | Ottosen | DP | RF | RBF | BP | |
|---|---|---|---|---|---|---|
| MAE | 9.25 | 5.9 | 11.18 | 4.07 | 4.62 | 4.59 |
| RMSE | 14.52 | 9.07 | 16.66 | 6.01 | 6.51 | 6.09 |
| R | 0.92 | 0.97 | 0.87 | 0.99 | 0.99 | 0.99 |
Table 2.
Comparison between the neural network strength criterion model and classical strength criterion.
Table 2.
Comparison between the neural network strength criterion model and classical strength criterion.
| Guo Wang | Ottosen | RF | |
|---|---|---|---|
| MAE | 11.46 | 7.50 | 4.88 |
| RMSE | 16.70 | 10.52 | 6.81 |
| R | 0.91 | 0.98 | 0.99 |
Table 3.
Comparison between the neural network strength criterion model and classical strength criterion.
Table 3.
Comparison between the neural network strength criterion model and classical strength criterion.
| Guo Wang | Ottosen | RF | |
|---|---|---|---|
| MAE | 3.44 | 1.66 | 1.93 |
| RMSE | 5.66 | 2.77 | 3.04 |
| R | 0.94 | 0.98 | 0.99 |
Disclaimer/Publisher’s Note: The statements, opinions and data contained in all publications are solely those of the individual author(s) and contributor(s) and not of MDPI and/or the editor(s). MDPI and/or the editor(s) disclaim responsibility for any injury to people or property resulting from any ideas, methods, instructions or products referred to in the content. |
© 2023 by the authors. Licensee MDPI, Basel, Switzerland. This article is an open access article distributed under the terms and conditions of the Creative Commons Attribution (CC BY) license (https://creativecommons.org/licenses/by/4.0/).
Share and Cite
MDPI and ACS Style
Chen, X.; Zheng, D.; Liu, Y.; Wu, X.; Jiang, H.; Qiu, J. Multiaxial Strength Criterion Model of Concrete Based on Random Forest. Mathematics 2023, 11, 244. https://doi.org/10.3390/math11010244
AMA Style
Chen X, Zheng D, Liu Y, Wu X, Jiang H, Qiu J. Multiaxial Strength Criterion Model of Concrete Based on Random Forest. Mathematics. 2023; 11(1):244. https://doi.org/10.3390/math11010244
Chicago/Turabian StyleChen, Xingqiao, Dongjian Zheng, Yongtao Liu, Xin Wu, Haifeng Jiang, and Jianchun Qiu. 2023. "Multiaxial Strength Criterion Model of Concrete Based on Random Forest" Mathematics 11, no. 1: 244. https://doi.org/10.3390/math11010244
Note that from the first issue of 2016, this journal uses article numbers instead of page numbers. See further details here.