

Quantile-Composited Feature Screening for Ultrahigh-Dimensional Data
1
School of Mathematics, Shandong University, Jinan 250100, China
2
School of Science, National University of Defense and Technology, Changsha 410000, China
*
Author to whom correspondence should be addressed.
Mathematics 2023, 11(10), 2398; https://doi.org/10.3390/math11102398
Submission received: 24 April 2023
/
Revised: 12 May 2023
/
Accepted: 19 May 2023
/
Published: 22 May 2023
(This article belongs to the Special Issue Methods and Applications in Multivariate Statistics)
Abstract
:Ultrahigh-dimensional grouped data are frequently encountered by biostatisticians working on multi-class categorical problems. To rapidly screen out the null predictors, this paper proposes a quantile-composited feature screening procedure. The new method first transforms the continuous predictor to a Bernoulli variable, by thresholding the predictor at a certain quantile. Consequently, the independence between the response and each predictor is easy to judge, by employing the Pearson chi-square statistic. The newly proposed method has the following salient features: (1) it is robust against high-dimensional heterogeneous data; (2) it is model-free, without specifying any regression structure between the covariate and outcome variable; (3) it enjoys a low computational cost, with the computational complexity controlled at the sample size level. Under some mild conditions, the new method was shown to achieve the sure screening property without imposing any moment condition on the predictors. Numerical studies and real data analyses further confirmed the effectiveness of the new screening procedure.
1. Introduction
With the rapid advancements in science and technology, ultrahigh-dimensional data are becoming increasingly common across various fields of scientific research: these include, but are not limited to, biomedical imaging, neuroscience, tomography, and tumor classifications, where the number of variables or parameters can exponentially increase with the sample size. In such a situation, an important task is to recover the important features from thousands or even millions of predictors.
In order to rapidly lower the huge dimensionality of data to an acceptable size, Fan and Lv [1] introduced the method of sure independence screening, which ranks the importance of predictors according to their marginal utilities. Since then, a series in the literature has been devoted to this issue, in various scenarios, which can basically be divided into two groups: the model-based and the model-free methods. For the former, the typical literature includes, but is not limited to, Wang [2], Chang et al. [3], and Wang and Leng [4] for linear models, Fan et al. [5] for additive models, and Fan et al. [6] and Liu et al. [7] for varying coefficients models, amongst others. Model-based methods are computationally efficient, but can suffer from the risk of model misspecification. To avoid such a risk, researchers developed the model-free methods, without specifying a concrete model. For example, Zhu et al. [8] proposed a screening procedure named SIRS for the multi-index model; Li et al. [9] introduced a sure screening procedure via the distance correlation called DCS; for the heterogeneous data, He et al. [10] developed a quantile-adaptive screening method; Lin et al. [11] proposed a novel approach, dubbed Nonparametric Ranking Feature Screening (NRS), leveraging the local information flows of the predictors; Lu and Lin [12] developed a conditional model-free screening procedure, utilizing the conditional distance correlation; and Tong et al. [13] proposed a model-free conditional feature screening method with FDR control. Additionally, Ref. [14] recently introduced a data-adaptive threshold selection procedure with error rate control, which is applicable to most kinds of popular screening methods. Ref. [15] proposed a feature screening method for the interval-valued response.
The literature listed above mainly concentrated on the continuous response; however, ultrahigh-dimensional grouped data, in which the label of a sample can be seen as a categorical response, are also very frequently encountered in many scientific research fields—specifically, for biostatisticians who work on multi-class categorical problems. For example, in the diagnosis of tumor classification, researchers need to judge the type of tumor, according to the gene expression level. If we do not reduce the dimension of the predictors, the established classifier will behave as poorly as random guessing, due to the diverging spectra and accumulation of noise (Fan et al. [16]); therefore, it makes sense to screen out the null predictors before further analysis. The following are the existing works that have made some progress on this issue. Huang et al. [17] proposed a screening method based on Pearson chi-square statistics, for discrete predictors. Pan et al. [18] set the maximal mean difference for each pair of classes as a ranking index and, based on this, proposed a corresponding screening procedure. Mai and Zou [19] built a Kolmogorov–Smirnov type distance, to measure the dependence between two variables, and used it as a filter for screening out noise predictors. Cui et al. [20] proposed a screening method via measuring the distance of the distribution of the subgroup from the whole distribution. Recently, Xie et al. [21] established a category-adaptive screening procedure, by calculating the difference between the conditional distribution of the response and the marginal one. All these aforementioned methods were clearly motivated, and have been examined effectively for feature screening in different settings.
In this paper, we propose a new robust screening method for ultrahigh-dimensional grouped data. Our research was partly motivated by an empirical analysis of a leukemia dataset, consisting of 72 observations and 3571 genes, of which 47 were acute lymphocytic leukemia (ALL), and 25 were acute myelogenous leukemia (AML). Figure 1 plots the density function of the first 20 features selected from the 3571 genes of the 47 ALLs, from which it can be seen that all of them are far from being a regular distribution, most of them have sharp peaks and heavy tails (e.g., gene 9 and gene 12), and some of them are even multi-modal (e.g., gene 6 and gene 8), although these samples are from the same ALL group. This phenomenon challenges most of the existing methods. For example, the method in Pan et al. [18] might fail, if data are not normally distributed, and the method in Xie et al. [21] might lose efficiency when the distribution of a predictor is multi-modal. It is known that quantile-based statistics are not sensitive to outliers and heavy-tailed distributed data; thus, it was expected that the quantile-based screening method would be robust against heterogeneous data. Furthermore, compared to point estimation, quantile-based statistics can usually provide a more detailed picture of a predictor at different quantile levels. Motivated by the above discussion, we propose a quantile-composited screening approach, by aggregating the distributional information over many quantile levels. The basic idea of our method is straightforward. If has no contribution to predicting the category of an outcome variable, denoted by Y, at the -th quantile level, the conditional quantile function of given Y should be equal to the unconditional one, i.e, . Moreover, if and Y are independent, we have for all , where a.s. means ‘almost surely’. Thus, the equality plays a key role in measuring the independence between Y and . To quantify this kind of independence, we show that for a given is equivalent to the independence between the index variable and the label variable Y. Then, the equality between and is converted to testing the independence between two discrete variables, which can be easily checked by the Pearson chi-square test statistics. Finally, we aggregate all the discriminative information over the whole distribution in an efficient way, based on which, we establish the corresponding screening procedure. Our newly proposed screening method enjoys the following salient features. First of all, compared to the existing methods, it is robust against non-normal data, which are very common in high dimensions. Secondly, it is model-free, in the sense that we do not need to assume a specific statistical model, such as the linear or quadratic discriminant analysis model, between the predictor and the outcome variable. Thirdly, its ranking index has a very simple form, and the computational complexity is controlled at the sample size level, so that the proposed screening method can be implemented very quickly. In addition, as a by-product, our new method is invariant, in regard to the monotonic transformations of the data.
The rest of the paper is organized as follows. Section 2 gives the details of the quantile-composited screening procedure, including the methodological development, theoretical properties, and some extensions. Section 3 provides convincing numerical results and two real data analyses. Technical proofs of the main results are deferred to Appendix A.
2. A New Feature Screening Procedure
Let be the p-dimensional predictor, and without loss of generality, let be the outcome variable indicating which group belongs to, where K is allowed to grow with the sample size at some certain rate. Define the index set of active predictors corresponding to quantile level as
where . Denote by the cardinality of ; is usually less than the sample size n under the sparsity assumption. Denote by the -th quantile of . Intuitively, if does not functionally depend on Y, it should be the case that for all Y: in other words, has no ability to predict its label Y at the quantile level . On the other hand, if is far away from for some Y, will be helpful for predicting the category of Y. Hence, the difference between and determines whether is a contributive predictor at the -th quantile level. The following lemma was of central importance to our methodological development.
Lemma 1.
Let Y be the outcome variable, and let X be a continuous variable; then, we have two conclusions:
- (1)
- if and only if the Bernoulli variable and Y are independent, where is the indicator function;
- (2)
- for if Y and are independent.
The proof of this lemma is presented in Appendix A. Conclusions (1) and (2) imply that the independence between and Y for is equivalent to the independence between and Y; consequently, it is natural to apply the Pearson chi-square statistics, to measure the independence between them. Let , , . Then, the dependence of on the response Y, at quantile level , can be evaluated by
Clearly, iff and Y are independent.
provides a way to identify whether is active at quantile level . However, it is not easy to determine the informative quantiles for every predictor. Moreover, the active predictors could be contributive at many quantiles instead of a single one. For these reasons, we propose a quantile-composited screening index, which makes an integration for at the interval . More specifically, the ranking index is defined as
where is some positive weight function, and is a value tending to 0 at some certain rate related to the sample size, which will be specified in the next section. Note that avoids making integration at the endpoints 0 and 1, because could be ill-defined at the two points. Theoretically, if X is independent of Y, regardless of the choice of , which is easy to prove according to Lemma 1. According to the above analysis, is always non-negative for , and will equal 0 if is independent of Y.
For the choice of weight , the different settings will lead to different values of . For example, a naive setting is for , which means that all are treated equally. Clearly, this is not a good option. Intuitively, if is active, should be large for some in . Then, we should place more weight on these quantile levels. For this reason, we set ; then, the resultant has the following form:
In addition, for the precise-definition of , we restrict when for all .
In the following, we give the estimation of . Suppose is a set of i.i.d samples from , where i.i.d means independent and identically distributed. Let be the th sample quantile of and , , and can be estimated as , and , respectively. Then, by plug-in method, is estimated as
and is estimated as
Regarding , we make the following remarks:
Remark 1.
- 1.
- If , follows the distribution with degrees of freedom [22].
- 2.
- is invariant to any monotonic transformation on predictors, because is free of the monotonic transformation on .
- 3.
- The computation of involves the integration of τ. We can calculate it by an approximate numerical method as
- 4.
- The choice of s. Intuitively, a large s will make the approximation of integration more accurate. However, our method aims to efficiently separate the active predictors from the null ones, instead of getting an accurate estimate of . Figure 2 displays the density curves of marginal utilities of active and inactive predictors versus different choices of s with Example 2 in Section 3. It can be seen that the choice of s does not affect the distribution of either active predictors or inactive ones.
- 5.
- Figure 2 also shows that the gap between the indices of active predictors and inactive ones is clear, which means the proposed method is efficient at separating the influential predictors from the inactive ones well. Moreover, it can also be observed that the marginal utilities of active predictors are, with a smaller variance, comparable to those of inactive ones, which implies that the new method is sensitive to the active predictors.
With the estimation of , the index set of active predictors can be estimated as
where c and are two predetermined thresholding values. In practice, we usually take a hard threshold criterion, to determine the submodel as
where is a predetermined threshold value. We call the above quantile-composited screening procedure, based on as QCS.
2.1. Theoretical Properties
This section provides the sure screening property of the newly proposed method, which guarantees the effectiveness of the newly proposed method. The corresponding technical details of the proof can be found in Appendix A.
We first prove the consistency of . To this end, we require the following condition.
(C1): There exist two constants , such that for with .
Condition C1 requires that the sample size of each subgroup can be neither too small nor too large. The condition allows that the number of categories can diverge to infinity at some certain rate, with the increase of sample size. The following theorem states the consistency of .
Theorem 1.
For a given quantile , under condition (C1),
where .
This theorem shows that the consistency of can be guaranteed under suitable conditions. In addition, it reminds us that we cannot select the quantiles either very close to zero or to one, because the items would collapse to zero, which would make the consistency of problematic. Based on the above theorem, the following theorem provides the consistency of .
Corollary 1.
According to the conditions in Theorem 1, if ,
This theorem states that the gap between and will disappear with probability tending to 1 as . This theorem also shows that our method can address the dimensionality of order .
In the following, we provide the sure screening property of our method.
Theorem 2.
Sure screening property: let ; then, under condition (C1) and the following condition, ,
where is the cardinality of .
2.2. Extensions
Up to this point, the new methods have been designed for ultrahigh-dimensional categorical data. In this section, to make the proposed methods applicable in more settings, we give two natural extensions for our method, and in the next section, we use some numerical simulation, to illustrate the effectiveness of these extensions.
Extension to Genome-Wide Association Studies. We first apply our method to the typical case of the genome-wide association studies (GWAS), where the predictors are single-nucleotide polymorphisms (SNPs) in three classes, denoted by , and the response is continuous. Our strategy for this problem is straightforward: define the sample space as , respectively; then, the marginal utility of at quantile level is defined as
where , , , for .
Extension to additive models. We can extend our method to the model in which both the response and predictors are continuous. To make our method applicable, we first slice the predictors into several segments, according to some threshold values. For example, taking the quartiles of the predictor as the cut points, then the predictors are transformed to a balanced four-categorical variable. Specifically, let be N percentiles of , and define , where ; here, we define and . Then, similar to (9), we define the marginal utility of at quantile level as
where , , for .
3. Numerical Studies
3.1. General Settings
For this section, we first conducted some Monte Carlo simulations, to compare our method to those of several competitors. Then, we applied our screening procedure to two real data examples.
We compared our method to: (1) MV-based sure independence screening (MVS) [20], which can be seen as the weighted average of the Cramér–von Mises distances between the conditional distribution function of X given and the unconditional distribution function of X; (2) distance correlation–sure independence screening (DCS) [9], which employs distance correlation as a measure to evaluate the importance of each predictor; (3) category-adaptive variable screening (CAS) [21], which screens the inactive predictor, by comparing its marginal distribution to its marginal conditional one; (4) Kolmogorov filter screening (KFS) [19], which filters the inactive predictors, by comparing the Kolmogorov distance between the conditional distribution and the unconditional one. Note that DCS is not efficient for categorical variables. Thus, we transferred the categorical variable into a multivariate dummy variable, with the i-th coordinate equal to 1, and other coordinates equal to 0, where i was the category of a sample, e.g., we transformed into if Y was five-category.
Throughout the simulation, we repeated each experiment 1000 times, and always set . To fairly evaluate the performances of the different methods, the following criteria were employed: (1) MS: the minimum model size of the selected models that are required to have a sure screening; (2) : the percentage of submodels that contain all active predictors under a predetermined model size over 1000 replications. We let MS(t) be the result of the t-th numerical experiment, and denoted by MS the -level quantile of {MS(1),⋯,MS(1000)}; then, we reported the median of MS (MMS), the interquartile range (IQR) of MS, and the extreme percentile range (EPR) of MS, namely:
We considered and for a small and large model size, respectively, where was the integer part of a. By the two criteria, a well-behaved screening method should have small MS, but with close to 1.
3.2. Monte Carlo Simulations
Example 1.
Data were generated in the following manner. For a given , the p-dimensional random vector of was generated from a mixture distribution , where , with being the identity matrix and ; W was a random vector, with each component being an independent student’s t-distribution with one degree of freedom. Here, r was used to check the robustness of our method against the heavy-tailed distribution. We considered and 0.15, representing, respectively, a low and high proportion of the heavy-tailed samples in the data. The categorical variable Y was set to be binary and multi-category, with both balanced and imbalanced design, by the following scenarios:
- Case 1.
- , and .
- Case 2.
- The same setup as Case 1, except that and .
- Case 3.
- for , and for , where represented a d-dimensional zero-valued vector.
- Case 4.
- The same setup as Case 1, except that .
The numerical results are reported in Table 1, by setting for , and for . From this table, it can be seen that the QCS, MVS, CAS, and KFS performed comparably well with both and equal to 100%. However, the performance of DCS was unsatisfactory, in that it was sensitive to heavy-tailed data, and was easily affected by the imbalanced response.
Example 2.
In this example, we used a more complex setting to check the effectiveness of the proposed methods. This example was similar to Example 2 in Xie et al. [21]. For a given , the p-dimensional random vector of was generated in the same way as in Example 1, but the correlation structure among the predictors was set as Corr. We considered a five-categorical response; the mean shifts for each class were , , , , , so the corresponding active sets were , , . Y was also generated in a balanced way, with for , and in an imbalanced way, with for and for . We considered and or 3000.
Table 2 presents the simulation results. In this example, we can see that QCS performed better than its competitors: it had the smallest MMS, IQR, and EPR. Secondly, it can be seen that the increase of dimensionality p had a negative effect on all methods, but that our method suffered the least.
Example 3.
This example mimicked the scenario that the samples in the same group had multi-modals. Given , the random vector of X was generated in the same way as in Example 1, except that we fixed , and generated Z from a mixture normal distribution, designed as follows:
- Case 1.
- ;
- Case 2.
- ;
- Case 3.
- ,
where for and 0 for other components in . In this example, we only considered a balanced setting for Y. Similarly, we considered and , respectively.
The simulation results are shown in Table 3. This table shows that the category K of Y had a greatly negative effect on all the competitors, in that they suffered much efficiency loss for the screening when we increased K from 2 to 8. In particular, in case 3, where the distribution of data had two comparable modals, all methods except ours missed the active predictors completely, even under a large model size . The above results show that the newly proposed method is very robust.
Example 4.
This example considered a K-categorical logistic model with
where the model settings were configured as follows:
- Case 1.
- , and with ;
- Case 2.
- , , ;and with .
We considered the multivariate normal distribution and the student t-distribution . The correlation structure among the predictors was equal to Corr. We set . The corresponding simulation results are shown in Table 4, which shows that all the methods performed similarly, but that our methods behaved slightly better under the t-distribution. In addition, it seems that the t-distribution led to a more accurate screening result for all methods. The reason may be attributed to the structure of the logistic model. Consider the simplest case, and : clearly, a larger will make the classification between positive and negative easier. Consequently, under logistic function, the t-distributed data will result in a more accurate result, because the t-distribution has a higher probability of generating predictors with large values.
Example 5.
This example aimed to check the effectiveness of the two extensions of the new method in Section 2.2. We considered the following three models:
- 1.
- , where with and ;
- 2.
- , where , , , , where was independent of ;
- 3.
- , where was equal to if , 1 if , and 0 otherwise, and where with , and and were the first and third quartiles, respectively, of a standard normal distribution.
Model 1 was an index model from Zhu et al. [8]. Model 2 was an additive model from Meier et al. [23]. Model 3 mimicked the SNPs, with equal allele frequencies representing , respectively; this model has been analyzed in Cui et al. [20]. We report the simulation results in Table 5. It is clear that the proposed method always demonstrated a superior performance under the three models. More specifically, in Models 1 and 2, DCS did not work, though the predictor was not heavy-tailed. In Model 3, the performance of DCS and CAS were unsatisfying, with large MS and less probability of including the active predictors.
Overall, through the above simulations, we can summarize that QCS was the most robust method: compared to its competitors, it had a very stable performance within different model settings.
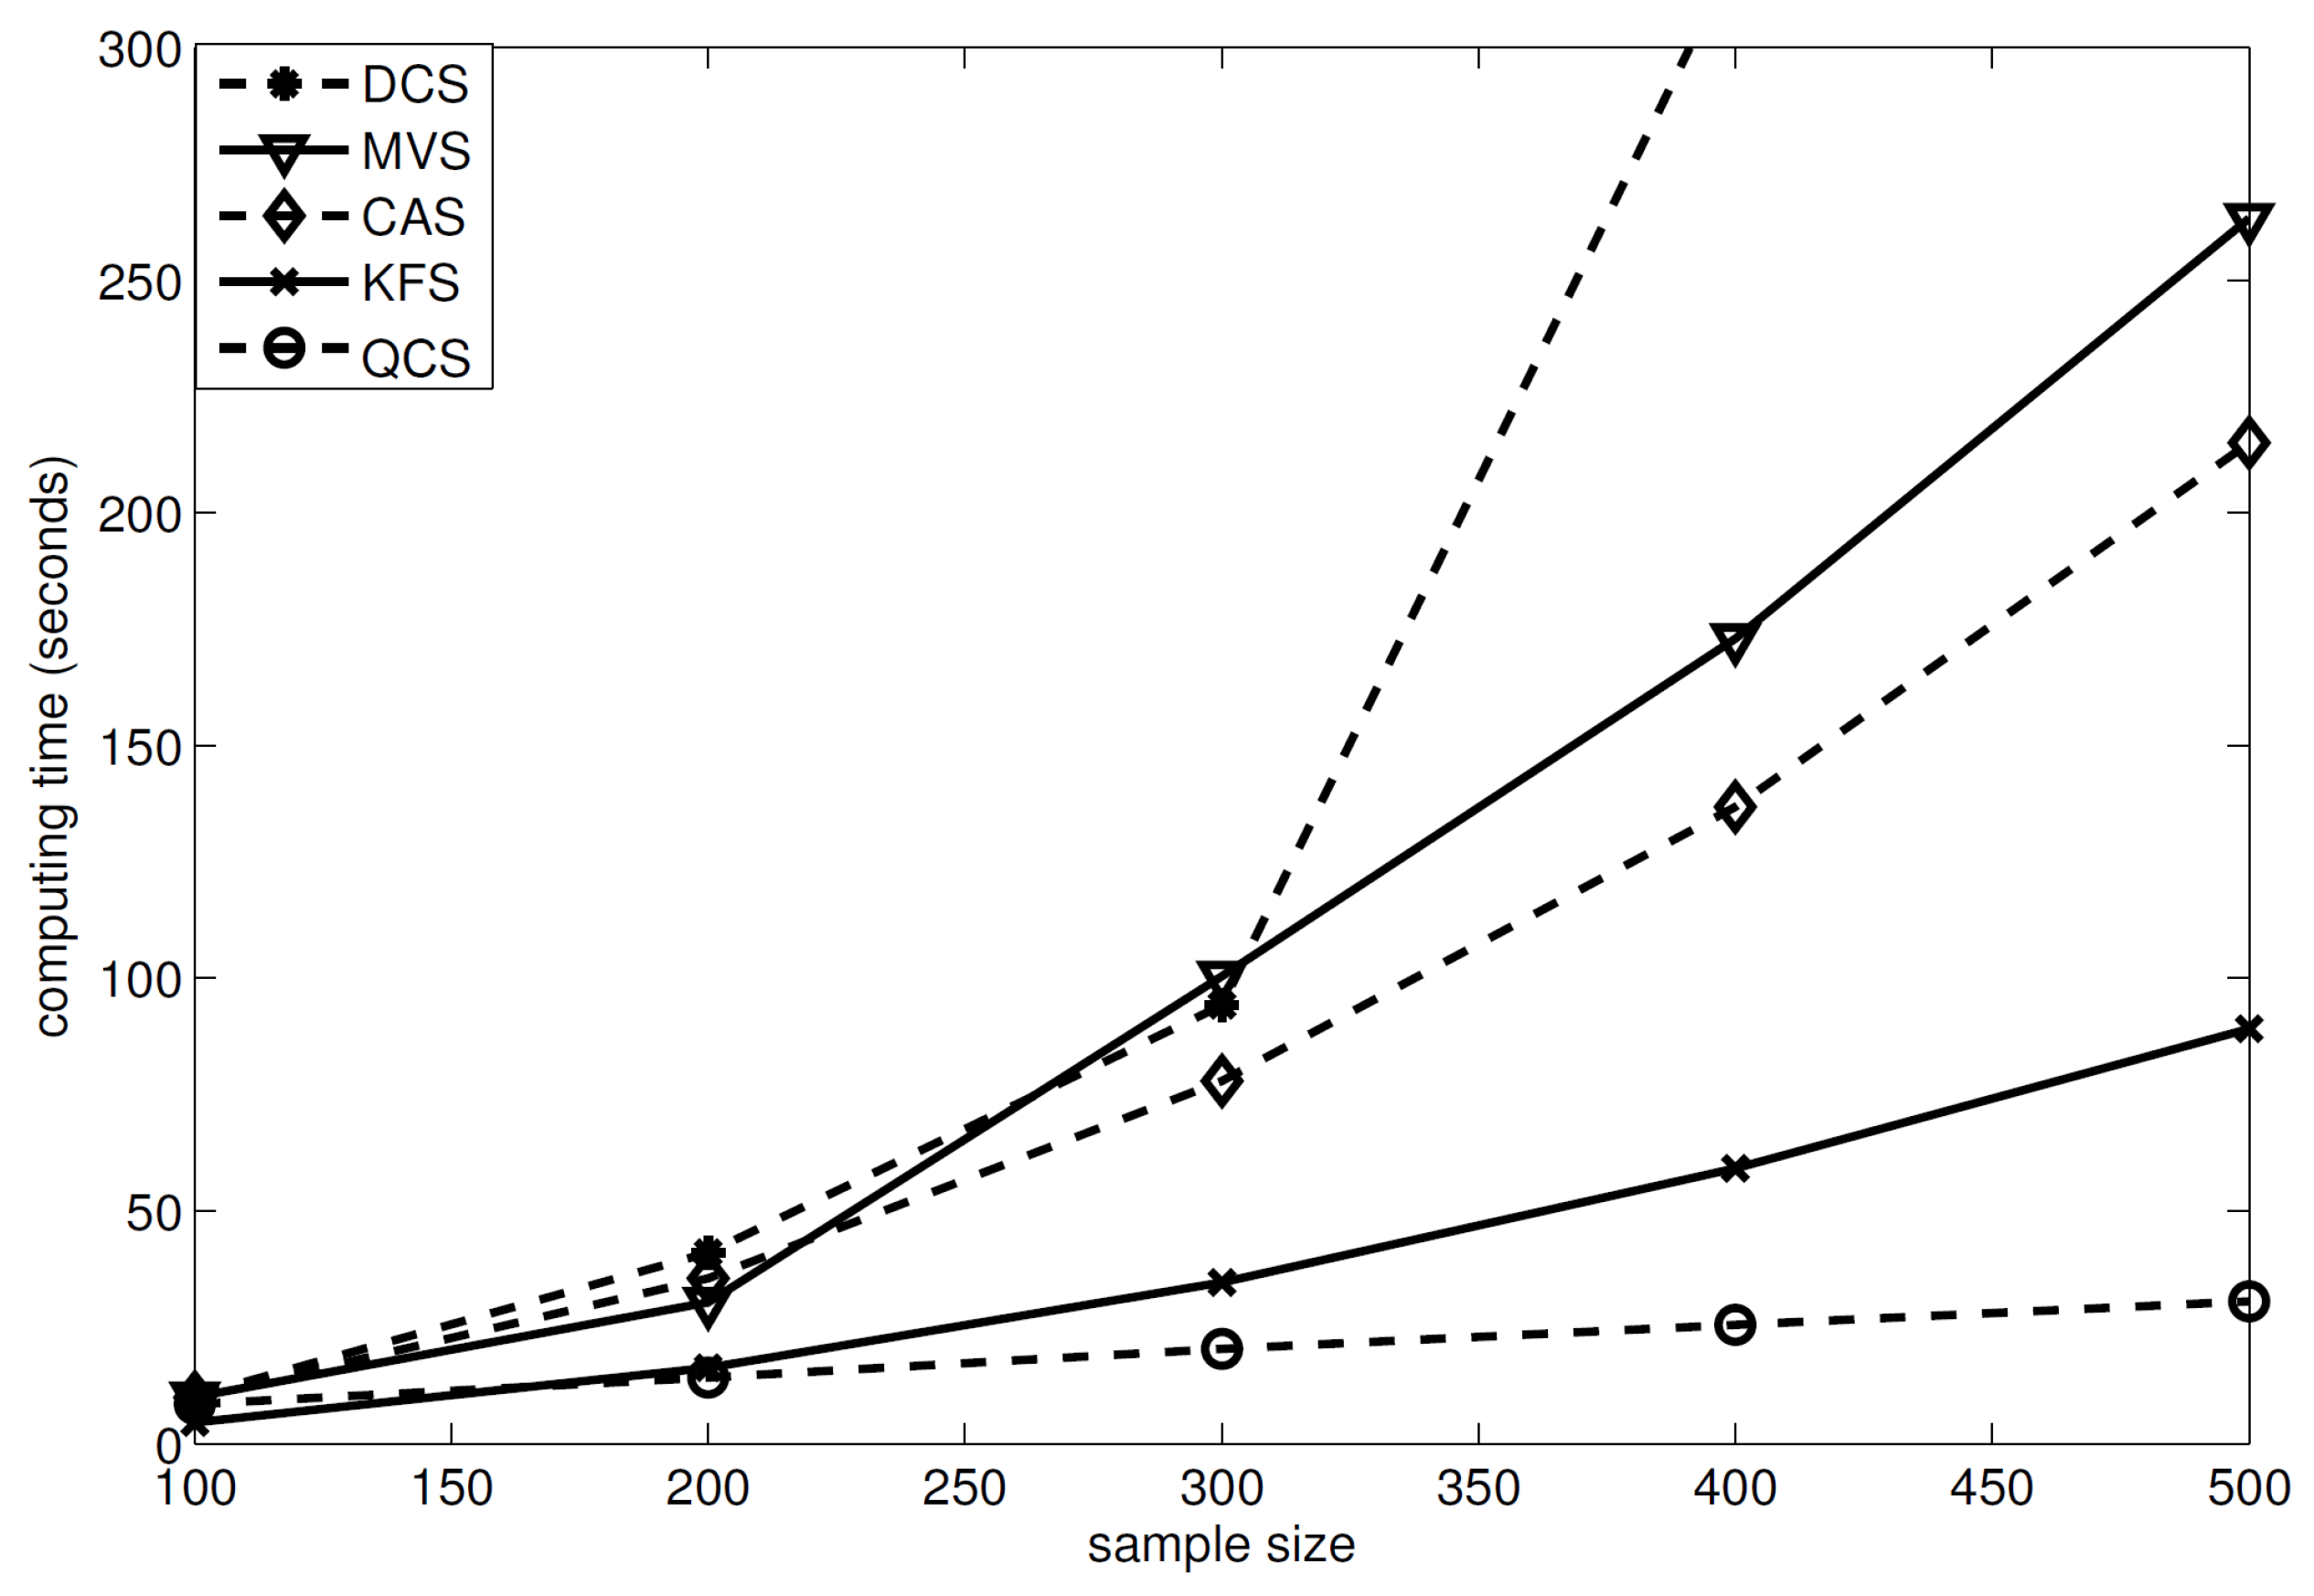
Computational complexity. Before the end of this subsection, we discuss the computational complexity of our method. Theoretically, the computational complexity of our method is , which is restricted at the sample size level. To obtain a clearer view of the computational complexity of our method, we conducted some simulations, to compare the computing time of our method to its competitors (see Figure 3). This figure showed that the computing time of our method linearly increased with the sample size, while the computing times of the other methods had a quadratic form against n. The simulations were conducted using Matlab 2013a in a Dell OptiPlex 7060 SFF, equipped with eight 3.20 GHz Intel(R) Core(TM) i7-8700 CPUs 3.20 Ghz and 16.0 GB RAM.
3.3. Real Data Analyses
For this section, we applied our new screening methods to two cancer datasets. One was leukemia data, consisting of 72 samples and 3571 genes, of which 47 were acute lymphocytic leukemia (ALL) and the rest 25 were acute myelogenous leukemia (AML). Note that the original leukemia data had 73 samples and 7129 genes. The data we analyzed here had been pre-feature-selected (see details in Dettling M. [24]). The other cancer dataset comprised small-round-blue-cell tumors (SRBCT) data, consisting of 63 samples and 2308 genes. Among the 63 subjects, there were four types of tumors, including Burkitt lymphoma (BL), having 23 cases, Ewing sarcoma (EWS), having 20 cases, neuroblastoma (NB), having 12 cases, and rhabdomyosarcoma (RMS), having 8 cases, respectively, so the data was four-categorical. The two datasets are available on the website http://www.stat.cmu.edu/~jiashun/Research/software/GenomicsData/, accessed on 5 March 2022.
The purpose of the two datasets was to identify the key genes that have a dominant effect on predicting the diagnostic category of a tumor. We first employed the screening methods, to reduce the large p to a suitable scale s. Then, we invoked the penalized linear discriminant analysis (penLDA) [25], to further select the discriminative predictors from the predictors. The above procedure is the popular two-stage method that is commonly used in the analysis of ultrahigh-dimensional data. Note that we could also replace the penLDA in the second stage with other penalized methods, such as sparse discriminant analysis, as proposed by Clemmensen et al. [26].
We randomly extracted 70% of the samples from each class, as the training data, and set the rest of the samples as the testing data, in which the training data were used both to implement the screening procedure and to build the classifier, while the testing data were used to check the performance of the trained classifier. We repeated the above procedure for 500 replications, and we report both the training errors and testing errors for different methods. Note that in the screening stage, we set and , respectively: thus, and 32 in the leukemia dataset, and and 30 in the SRBCT dataset. In the second stage, the tuning parameter of the penLDA method was determined according to the 5-fold cross-validation method. Table 6 displays the corresponding results, where QCS–penLDA denotes the two-stage method of QCS followed by penLDA; a similar definition applies to MQS–penLDA, MVS–penLDA, etc.
The numerical results are summarized in Table 6, from which the following conclusion can be obtained. For the leukemia dataset, all methods except DCS performed reasonably well, such that all of them could control the testing errors below 1. However, for the SRBCT data, our method performed significantly better than the other methods: it achieved the smallest training errors, and testing errors closer to 0. The CAS-based two-stage method yielded bad results for both the training error and the testing error. The reason may be that the distribution behind the data was not unimodal.
4. Conclusions
This paper proposes a new quantile-composited feature screening (QCS) procedure, to rapidly screen out the null predictors. Compared to the existing methods, QCS sheds light on the following aspects. Firstly, the ranking index is a simple structure, so that the implementation of the screening procedure is computationally easy. Secondly, QCS is a quantile-composited method: it can utilize much distributional information, so as to significantly improve the screening efficiency, but retains the computational cost at a low level. The simulation and real data analysis also demonstrated the effectiveness of QCS.
In addition, it is worth mentioning that QCS can be further improved. For example, the selection of the number s of the quantiles is still a problem, which could be the focus of future work, based on this article.
Author Contributions
Methodology, S.C. and J.L.; Formal analysis, S.C.; Writing—review & editing, S.C. and J.L.; Funding acquisition, J.L. All authors have read and agreed to the published version of the manuscript.
Funding
Jun Lu’s research was partly supported by National Natural Science Foundation of China (No.12001486), Natural Science Foundation of Zhejiang Province (No.LQ20A010001), and Advance Research Plan of National University of Defense Technology.
Data Availability Statement
The datasets used in this paper can be accessed freely on the website http://www.stat.cmu.edu/~jiashun/Research/software/GenomicsData/.
Conflicts of Interest
The authors declare no conflict of interest.
Appendix A. Proof of Main Results
Proof of Lemma 1.
For Lemma 1(1), we only prove the sufficient; the necessity can be proved similarly. If , then for any ,
For , the proof is the same.
To prove Lemma 1(2), we have , ; then,
□
Proof of Theorem 1.
We prove this theorem in two steps.
Firstly, we prove the consistency of , , and .
(1) If , then
The conclusion for can be proved similarly.
(2) By using Hoeffding’s inequality, we obtain
(3) Define , such that
For (A3), for each j, for any i, or for any i. Using Hoeffding’s inequality, (A3) can be deduced, such that
For (A4), using Hoeffding’s inequality,
Consequently, combining the results of (A5) and (A6), it is simple to establish that
(4) By employing a similar argument, can be bounded easily, as
where the second inequality holds because and where the last inequality holds due to Hoeffding’s inequality.
Secondly, we prove the consistency of . Because
we only need to prove the consistency of .
When ,
For (A9), combining the results of (A1), (A2), (A7) and (A8), we have:
and
For (A10),
Combining the results of (A9)–(A13),
For , by employing a similar argument, it can be proved that
For any , by (A14) and (A15), it holds that
where , , and . For (A7) and (A16), we can obtain
Let , and by condition (C1), it can be derived that
Let and , if ; then
The proof of Corollary 1. Under the conditions in Theorem 1, following (A17) and (A19), we obtain
□
Proof of Theorem 2.
If , then there must exist some , such that It follows from condition (C2) that for some , indicating that the events satisfy , for some , and hence Consequently,
where is the cardinality of . □
References
- Fan, J.; Lv, J. Sure independence screening for ultrahigh dimensional feature space. J. R. Statist. Soc. B 2008, 70, 849–911. [Google Scholar] [CrossRef] [PubMed]
- Wang, H. Forward regression for ultra-high dimensional variable screening. J. Am. Statist. Assoc. 2009, 104, 1512–1524. [Google Scholar] [CrossRef]
- Chang, J.; Tang, C.; Wu, Y. Marginal empirical likelihood and sure independence feature screening. Ann. Statist. 2013, 41, 2123–2148. [Google Scholar] [CrossRef] [PubMed]
- Wang, X.; Leng, C. High dimensional ordinary least squares projection for screening variables. J. R. Statist. Soc. B 2016, 78, 589–611. [Google Scholar] [CrossRef]
- Fan, J.; Feng, Y.; Song, R. Nonparametric independence screening in sparse ultrahigh dimensional additive models. J. Am. Statist. Assoc. 2011, 106, 544–557. [Google Scholar] [CrossRef] [PubMed]
- Fan, J.; Ma, Y.; Dai, W. Nonparametric independence screening in sparse ultra-high-dimensional varying coefficient models. J. Am. Statist. Assoc. 2014, 109, 1270–1284. [Google Scholar] [CrossRef] [PubMed]
- Liu, J.; Li, R.; Wu, R. Feature selection for varying coefficient models with ultrahigh-dimensional covariates. J. Am. Statist. Assoc. 2014, 109, 266–274. [Google Scholar] [CrossRef]
- Zhu, L.; Li, L.; Li, R.; Zhu, L. Model-free feature screening for ultrahigh-dimensional data. J. Am. Statist. Assoc. 2011, 106, 1464–1475. [Google Scholar] [CrossRef]
- Li, R.; Zhong, W.; Zhu, L. Feature screening via distance correlation learning. J. Am. Statist. Assoc. 2012, 107, 1129–1139. [Google Scholar] [CrossRef]
- He, X.; Wang, L.; Hong, H. Quantile-adaptive model-free variable screening for high-dimensional heterogeneous data. Ann. Statist. 2013, 41, 342–369. [Google Scholar] [CrossRef]
- Lin, L.; Sun, J.; Zhu, L. Nonparametric feature screening. Comput. Statist. Data Anal. 2013, 67, 162–174. [Google Scholar] [CrossRef]
- Lu, J.; Lin, L. Model-free conditional screening via conditional distance correlation. Statist. Pap. 2020, 61, 225–244. [Google Scholar] [CrossRef]
- Tong, Z.; Cai, Z.; Yang, S.; Li, R. Model-Free Conditional Feature Screening with FDR Control. J. Am. Statist. Assoc. 2002. [Google Scholar] [CrossRef]
- Guo, X.; Ren, H.; Zou, C.; Li, R. Threshold Selection in Feature Screening for Error Rate Control. J. Am. Statist. Assoc. 2022, 36, 1–13. [Google Scholar] [CrossRef]
- Zhong, W.; Qian, C.; Liu, W.; Zhu, L.; Li, R. Feature Screening for Interval-Valued Response with Application to Study Association between Posted Salary and Required Skills. J. Am. Statist. Assoc. 2023. [Google Scholar] [CrossRef]
- Fan, J.; Feng, Y.; Tong, X. A road to classification in high dimensional space: The regularized optimal affine discriminant. J. R. Statist. Soc. B 2012, 74, 745–771. [Google Scholar] [CrossRef]
- Huang, D.; Li, R.; Wang, H. Feature screening for ultrahigh dimensional categorical data with applications. J. Bus. Econ. Stat. 2014, 32, 237–244. [Google Scholar] [CrossRef]
- Pan, R.; Wang, H.; Li, R. Ultrahigh-dimensional multiclass linear discriminant analysis by pairwise sure independence screening. J. Am. Statist. Assoc. 2016, 111, 169–179. [Google Scholar] [CrossRef]
- Mai, Q.; Zou, H. The fused kolmogorov filter: A nonparametric model-free feature screening. Ann. Statist. 2015, 43, 1471–1497. [Google Scholar] [CrossRef]
- Cui, H.; Li, R.; Zhong, W. Model-free feature screening for ultrahigh dimensional discriminant analysis. J. Am. Statist. Assoc. 2015, 110, 630–641. [Google Scholar] [CrossRef]
- Xie, J.; Lin, Y.; Yan, X.; Tang, N. Category-Adaptive Variable Screening for Ultra-high Dimensional Heterogeneous Categorical Data. J. Am. Statist. Assoc. 2019, 36, 747–760. [Google Scholar] [CrossRef]
- Shao, J. Mathematical Statistics; Springer Science & Business Media: Berlin/Heidelberg, Germany, 2003. [Google Scholar]
- Meier, L.; van de Geer, S.; Buhlmann, P. High-Dimensional Additive Modeling. Ann. Statist. 2009, 37, 3779–3821. [Google Scholar] [CrossRef]
- Dettling, M. Bagboosting for tumor classification with gene expression data. Bioinformatics 2004, 20, 3583–3593. [Google Scholar] [CrossRef] [PubMed]
- Witten, D.M.; Tibshirani, R. Penalized classification using fisher’s linear discriminant. J. R. Statist. Soc. B 2011, 73, 753–772. [Google Scholar] [CrossRef]
- Clemmensen, L.; Hastie, T.; Witten, D.; Ersbøll, B. Sparse discriminant analysis. Technometrics 2011, 53, 406–413. [Google Scholar] [CrossRef]
Figure 1.
The sample histograms of the 47 ALLs corresponding to the first 20 features selected from 3571 genes.
Figure 1.
The sample histograms of the 47 ALLs corresponding to the first 20 features selected from 3571 genes.
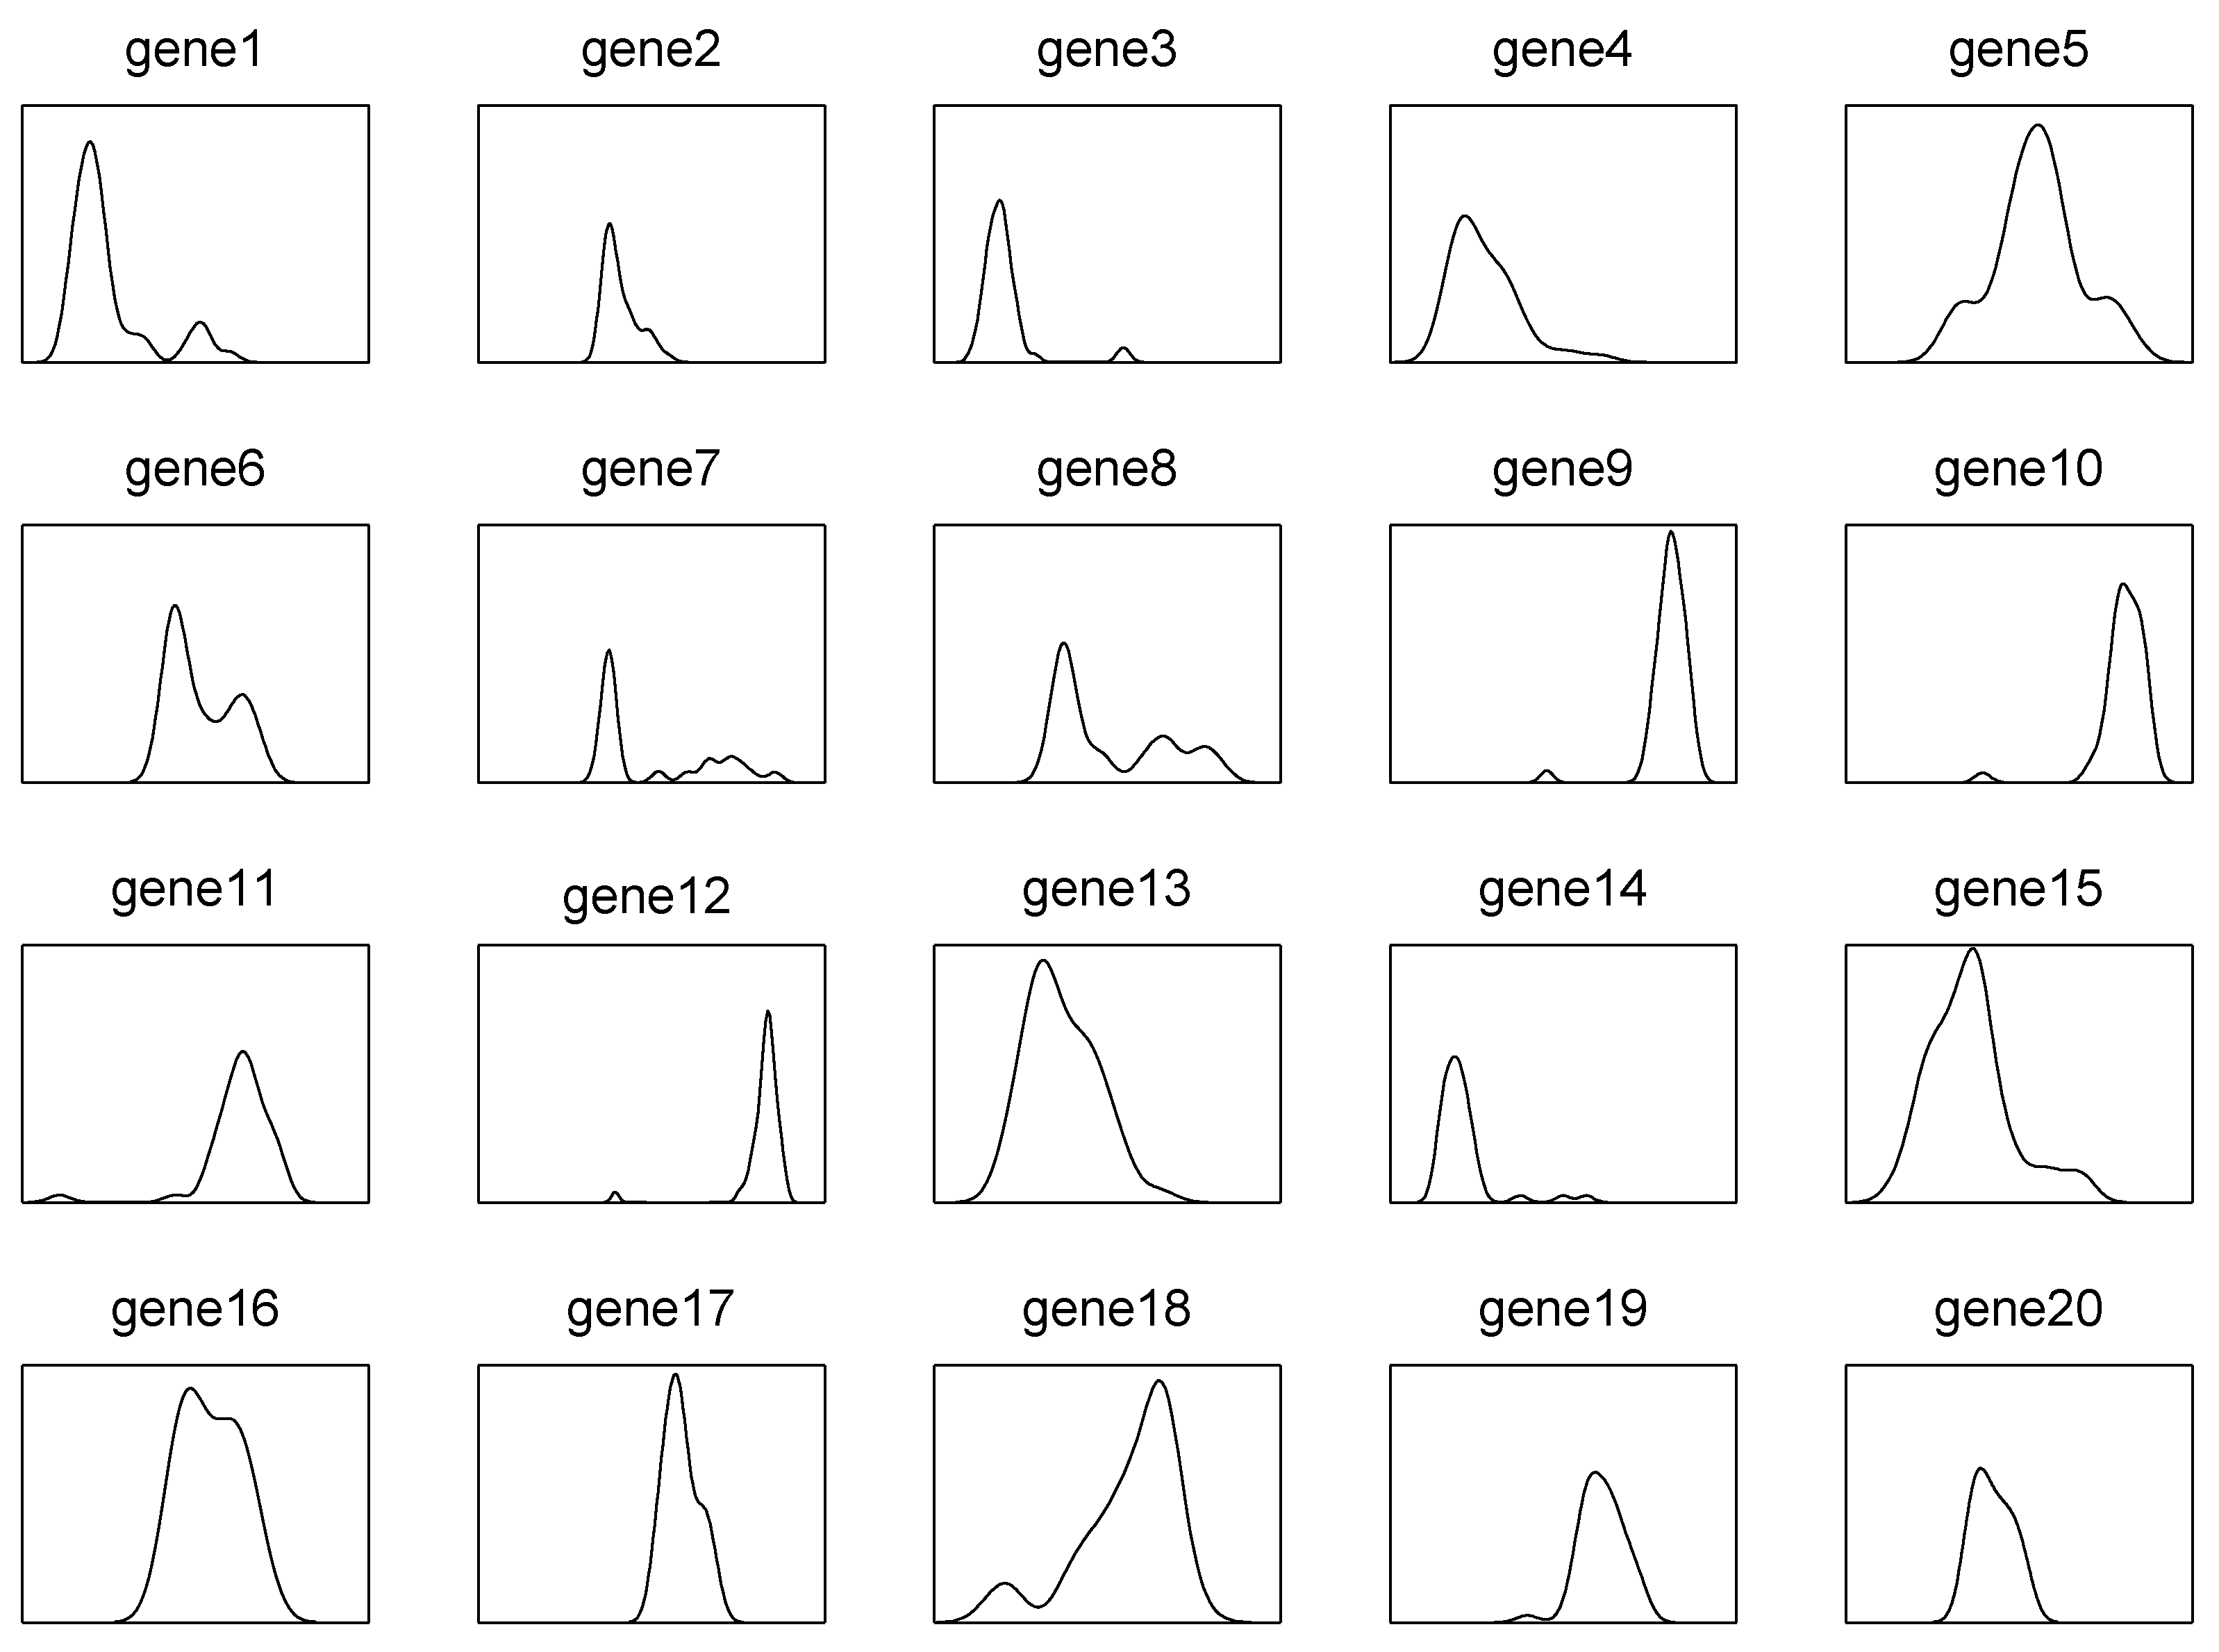
Figure 2.
Density curves of marginal utilities of active predictors (solid line) and inactive ones (dashed line) for (red), 20 (green), 50 (blue), 100 (black). The simulations were repeated 1000 times, using the model in Example 2 in Section 3 with a balanced response and .
Figure 2.
Density curves of marginal utilities of active predictors (solid line) and inactive ones (dashed line) for (red), 20 (green), 50 (blue), 100 (black). The simulations were repeated 1000 times, using the model in Example 2 in Section 3 with a balanced response and .

Figure 3.
Computing time of different methods based on 100 replications, where QCS is our method, MVS is the MV-based sure independence screening method in [20], DCS is the distance correlation–sure independence screening procedure in [9], CAS is the category-adaptive variable screening in [21], and KFS is the Kolmogorov filter method in [19]. This simulation used Example 1, with .

Table 1.
Simulation results of Example 1.
| Method | ||||||||||
|---|---|---|---|---|---|---|---|---|---|---|
| MMS | IQR | EPR | MMS | IQR | EPR | |||||
| Case 1 | ||||||||||
| QCS | 2 | 1 | 12 | 94.2 | 97.3 | 2 | 2 | 21 | 91.2 | 95.4 |
| MVS | 2 | 1 | 6 | 97.1 | 98.6 | 2 | 1 | 16.5 | 93.4 | 97.0 |
| DCS | 7 | 5 | 14 | 86.4 | 98.0 | 20 | 13 | 44 | 12.0 | 65.2 |
| CAS | 2 | 0 | 5 | 97.5 | 98.9 | 2 | 1 | 15 | 92.1 | 95.9 |
| KFS | 2 | 2 | 16 | 91.2 | 96.1 | 2 | 3 | 29 | 86.2 | 93.1 |
| Case 2 | ||||||||||
| QCS | 2 | 2 | 23 | 90.7 | 94.7 | 3 | 4 | 34 | 85.8 | 92.6 |
| MVS | 2 | 1 | 15 | 91.6 | 96.0 | 2 | 2 | 22 | 90.4 | 93.7 |
| DCS | 7 | 6 | 23.5 | 78.8 | 94.8 | 22.5 | 19 | 62 | 13.3 | 56.1 |
| CAS | 2 | 1 | 16 | 93.3 | 96.0 | 2 | 3 | 24 | 90.1 | 93.2 |
| KFS | 3 | 4 | 35 | 85.0 | 91.1 | 3 | 5 | 53 | 83.0 | 90.2 |
| Case 3 | ||||||||||
| QCS | 8 | 0 | 3 | 98.8 | 99.3 | 8 | 0 | 10 | 98 | 99.3 |
| MVS | 8 | 2 | 15 | 96.4 | 98.3 | 8.5 | 3 | 45 | 92.3 | 96.0 |
| DCS | 68.5 | 31 | 126 | 0.2 | 41.2 | 190.5 | 103 | 334 | 0 | 0 |
| CAS | 8 | 0 | 2 | 99.7 | 99.9 | 8 | 1 | 6 | 98.2 | 98.9 |
| KFS | 9.5 | 4 | 21 | 96.0 | 99.2 | 11 | 7 | 43 | 90.0 | 96.3 |
| Case 4 | ||||||||||
| QCS | 8 | 0 | 11 | 96.9 | 98.7 | 8 | 2 | 24.5 | 94.9 | 97.0 |
| MVS | 9 | 4 | 39.5 | 92.6 | 96.0 | 11 | 14 | 84 | 83.5 | 92.0 |
| DCS | 91 | 63 | 270.5 | 0.0 | 19.2 | 272 | 213 | 630 | 0.0 | 0.0 |
| CAS | 8 | 1 | 6 | 98.4 | 99.4 | 9 | 4 | 19 | 93.1 | 96.3 |
| KFS | 12 | 10 | 47 | 86.6 | 96.2 | 14.5 | 20 | 98 | 77.0 | 91.6 |
Table 2.
Simulation results of Example 2.
| Method | ||||||||||
|---|---|---|---|---|---|---|---|---|---|---|
| MMS | IQR | EPR | MMS | IQR | EPR | |||||
| Balanced response, | ||||||||||
| QCS | 20 | 0 | 1 | 100 | 100 | 20 | 0 | 1 | 99.2 | 100 |
| MVS | 20 | 0 | 0 | 100 | 100 | 20 | 0 | 1 | 99.5 | 100 |
| DCS | 33 | 8 | 19 | 74.0 | 99.7 | 68.5 | 21 | 58 | 0 | 66.3 |
| CAS | 20 | 0 | 0 | 100 | 100 | 20 | 0 | 0 | 100 | 100 |
| KFS | 20 | 0 | 2 | 100 | 100 | 20 | 1 | 6 | 99.2 | 100 |
| Imbalanced response, | ||||||||||
| QCS | 20 | 3 | 24 | 92.5 | 98.0 | 22 | 8 | 51 | 85.5 | 95.3 |
| MVS | 21 | 7 | 31 | 88.8 | 97.6 | 23 | 14 | 66 | 78.4 | 92.4 |
| DCS | 83 | 83 | 287 | 1.7 | 41.6 | 203.5 | 143 | 420 | 0 | 0.7 |
| CAS | 26 | 13 | 38 | 80.2 | 97.3 | 32 | 19 | 55 | 63.5 | 94.0 |
| KFS | 31 | 20 | 64 | 64.7 | 91.6 | 36 | 29 | 137 | 52.4 | 83.1 |
| Balanced response, | ||||||||||
| QCS | 20 | 0 | 1 | 100 | 100 | 20 | 0 | 2 | 99.2 | 100 |
| MVS | 20 | 0 | 1 | 100 | 100 | 20 | 0 | 3 | 99.2 | 100 |
| DCS | 61 | 16 | 56 | 0 | 80.4 | 159.5 | 50 | 162 | 0 | 0 |
| CAS | 20 | 0 | 0 | 100 | 100 | 20 | 0 | 1 | 100 | 100 |
| KFS | 20 | 2 | 8 | 96.8 | 100 | 21 | 2 | 17 | 95.1 | 98.8 |
| Imbalanced response, | ||||||||||
| QCS | 21 | 8 | 80 | 84.4 | 93.2 | 24 | 27 | 230 | 69.9 | 83.2 |
| MVS | 23 | 15 | 106 | 77.1 | 90.3 | 29 | 46 | 220 | 60.2 | 78.2 |
| DCS | 228.5 | 237 | 908 | 0 | 1.2 | 581 | 423 | 1148 | 0 | 0 |
| CAS | 37 | 34 | 109 | 50.9 | 81.7 | 57 | 62 | 161 | 20.5 | 63.3 |
| KFS | 48.5 | 56 | 257 | 36.6 | 69.2 | 68.5 | 80 | 306 | 19.1 | 54.8 |
Table 3.
Simulation results of Example 3.
| Method | ||||||||||
|---|---|---|---|---|---|---|---|---|---|---|
| MMS | IQR | EPR | MMS | IQR | EPR | |||||
| Case 1 | ||||||||||
| QCS | 2 | 0 | 3 | 98.9 | 99.7 | 8 | 0 | 4 | 98.9 | 99.8 |
| MVS | 2 | 0 | 2 | 100 | 100 | 21 | 29 | 141 | 64.5 | 83.4 |
| DCS | 10 | 4.5 | 12 | 75.0 | 99.0 | 147.5 | 79 | 238 | 0 | 0 |
| CAS | 3 | 3 | 12.5 | 92.9 | 97.4 | 31 | 37.5 | 169.5 | 50.5 | 79.5 |
| KFS | 2 | 0 | 2 | 99.6 | 100 | 22 | 23 | 102 | 67.0 | 87.2 |
| Case 2 | ||||||||||
| QCS | 3 | 2 | 14 | 93.6 | 97.3 | 9 | 3 | 27.5 | 94.3 | 96.9 |
| MVS | 4 | 5 | 12.5 | 93.3 | 98.4 | 103 | 126.5 | 366 | 3.0 | 25.5 |
| DCS | 13 | 5 | 16 | 49.5 | 96.5 | 192.5 | 92 | 420 | 0 | 0 |
| CAS | 35 | 41 | 125 | 11.3 | 33.0 | 467 | 385 | 1014 | 0 | 0 |
| KFS | 2 | 2 | 11 | 95.0 | 97.6 | 103.5 | 108 | 344.5 | 8.0 | 28.4 |
| Case 3 | ||||||||||
| QCS | 6 | 10 | 44.5 | 74.5 | 87.6 | 13 | 16 | 86.5 | 78.1 | 89.7 |
| MVS | 12 | 13 | 49 | 52.1 | 79.4 | 346.5 | 277.5 | 841 | 0 | 0 |
| DCS | 15 | 8 | 21 | 28.7 | 88.2 | 271 | 153.5 | 545.5 | 0 | 0 |
| CAS | 297.5 | 207.5 | 550.5 | 0 | 0 | 1644 | 317 | 696.5 | 0 | 0 |
| KFS | 9 | 18 | 55 | 60.9 | 79.3 | 411 | 332.5 | 738 | 0 | 0 |
Table 4.
Simulation results of Example 4.
| Method | ||||||||||
|---|---|---|---|---|---|---|---|---|---|---|
| MMS | IQR | EPR | MMS | IQR | EPR | |||||
| QCS | 12.5 | 15 | 112 | 77.7 | 88.3 | 12 | 12 | 101 | 81.6 | 90.4 |
| MVS | 13 | 18 | 165 | 75.2 | 84.8 | 12 | 14 | 143 | 76.6 | 88.1 |
| DCS | 13 | 18 | 177 | 76.0 | 85.6 | 18 | 37 | 210 | 65.1 | 80.0 |
| CAS | 12.5 | 13 | 153 | 78.1 | 87.1 | 31.5 | 46.0 | 172 | 47.2 | 72.8 |
| KFS | 21 | 36 | 281 | 62.2 | 78.1 | 32.5 | 53 | 230 | 48.0 | 70.4 |
| QCS | 10 | 15 | 137 | 85.6 | 92.2 | 10 | 12 | 49 | 92.0 | 95.2 |
| MVS | 10 | 15 | 150 | 85.3 | 92.4 | 10 | 12 | 67 | 90.1 | 94.4 |
| DCS | 10 | 15 | 133 | 84.7 | 91.2 | 11 | 23 | 112 | 79.0 | 88.6 |
| CAS | 10 | 14 | 106 | 85.2 | 92.8 | 14 | 30 | 136 | 72.6 | 83.6 |
| KFS | 12 | 24 | 139 | 79.2 | 88.5 | 13 | 34 | 174 | 72.8 | 82.8 |
Table 5.
Simulation results of Example 5.
| Method | MMS | IQR | EPR | |||
|---|---|---|---|---|---|---|
| Model 1 | QCS | 11 | 10 | 111 | 86.2 | 92.1 |
| MVS | 11.5 | 14 | 132 | 82.4 | 89.5 | |
| DCS | 957 | 713 | 1513 | 0.4 | 0.8 | |
| CAS | 30 | 78 | 338 | 56.7 | 71.2 | |
| KFS | 14 | 18 | 165 | 83.2 | 90.3 | |
| Model 2 | QCS | 4 | 1 | 7 | 98.1 | 100 |
| MVS | 4 | 1 | 9 | 98.0 | 100 | |
| DCS | 49 | 58 | 195 | 34.6 | 64.5 | |
| CAS | 6 | 10 | 35 | 92.9 | 98.3 | |
| KFS | 5 | 13 | 72 | 92.4 | 94.1 | |
| Model 3 | QCS | 6.5 | 14 | 109 | 88.7 | 94.2 |
| MVS | 7 | 16 | 114 | 86.4 | 90.8 | |
| DCS | 13 | 26 | 215 | 76.5 | 86.6 | |
| CAS | 17 | 54 | 258 | 60.8 | 78.9 | |
| KFS | 25 | 87 | 316 | 58.2 | 68.4 |
Table 6.
Numerical results of the real data analyses.
| Data | Method | No. of Training Errors | No. of Testing Errors | |||
|---|---|---|---|---|---|---|
| Mean | Std | Mean | Std | |||
| Leukemia | 16 | QCS-penLDA | 0.176 | 0.401 | 0.794 | 0.865 |
| MVS-penLDA | 0.166 | 0.383 | 0.828 | 0.864 | ||
| DCS-penLDA | 1.188 | 0.783 | 1.334 | 1.082 | ||
| CAS-penLDA | 0.140 | 0.353 | 0.814 | 0.867 | ||
| KFS-penLDA | 0.260 | 0.478 | 0.896 | 0.924 | ||
| 32 | QCS-penLDA | 0.152 | 0.359 | 0.670 | 0.813 | |
| MVS-penLDA | 0.130 | 0.336 | 0.696 | 0.808 | ||
| DCS-penLDA | 0.898 | 0.732 | 0.974 | 0.920 | ||
| CAS-penLDA | 0.128 | 0.334 | 0.682 | 0.801 | ||
| KFS-penLDA | 0.210 | 0.417 | 0.792 | 0.873 | ||
| SRBCT | 15 | QCS-penLDA | 0.100 | 0.319 | 0.574 | 0.818 |
| MVS-penLDA | 0.436 | 1.777 | 1.180 | 1.399 | ||
| DCS-penLDA | 1.366 | 2.753 | 1.740 | 1.701 | ||
| CAS-penLDA | 7.236 | 2.246 | 5.744 | 2.174 | ||
| KFS-penLDA | 2.850 | 1.665 | 2.852 | 1.744 | ||
| 30 | QCS-penLDA | 0.088 | 1.343 | 0.206 | 0.872 | |
| MVS-penLDA | 0.130 | 1.710 | 0.470 | 1.021 | ||
| DCS-penLDA | 0.320 | 2.693 | 0.604 | 1.458 | ||
| CAS-penLDA | 3.360 | 1.601 | 3.864 | 1.787 | ||
| KFS-penLDA | 0.594 | 0.831 | 0.860 | 0.964 | ||
Disclaimer/Publisher’s Note: The statements, opinions and data contained in all publications are solely those of the individual author(s) and contributor(s) and not of MDPI and/or the editor(s). MDPI and/or the editor(s) disclaim responsibility for any injury to people or property resulting from any ideas, methods, instructions or products referred to in the content. |
© 2023 by the authors. Licensee MDPI, Basel, Switzerland. This article is an open access article distributed under the terms and conditions of the Creative Commons Attribution (CC BY) license (https://creativecommons.org/licenses/by/4.0/).
Share and Cite
MDPI and ACS Style
Chen, S.; Lu, J. Quantile-Composited Feature Screening for Ultrahigh-Dimensional Data. Mathematics 2023, 11, 2398. https://doi.org/10.3390/math11102398
AMA Style
Chen S, Lu J. Quantile-Composited Feature Screening for Ultrahigh-Dimensional Data. Mathematics. 2023; 11(10):2398. https://doi.org/10.3390/math11102398
Chicago/Turabian StyleChen, Shuaishuai, and Jun Lu. 2023. "Quantile-Composited Feature Screening for Ultrahigh-Dimensional Data" Mathematics 11, no. 10: 2398. https://doi.org/10.3390/math11102398
Note that from the first issue of 2016, this journal uses article numbers instead of page numbers. See further details here.