Article

Computational Study of Phase Change Heat Transfer and Latent Heat Energy Storage for Thermal Management of Electronic Components Using Neural Networks

1
Department of Computer Science, College of Arts and Science, Prince Sattam bin Abdul Aziz University, Wadi Ad-Dawasir 11991, Saudi Arabia
2
Laboratory on Convective Heat and Mass Transfer, Tomsk State University, 634045 Tomsk, Russia
3
Physics Department, Faculty of Applied Science, Umm Al-Qura University, Makkah 24381, Saudi Arabia
4
Department of Mathematics, College of Science, Qassim University, Buraydah 51452, Saudi Arabia
*
Author to whom correspondence should be addressed.
Mathematics 2023, 11(2), 356; https://doi.org/10.3390/math11020356
Submission received: 16 December 2022 / Revised: 28 December 2022 / Accepted: 29 December 2022 / Published: 10 January 2023
(This article belongs to the Section Difference and Differential Equations)

Abstract

:
The phase change heat transfer of nano-enhanced phase change materials (NePCMs) was addressed in a heatsink filled with copper metal foam fins. The NePCM was made of 1-Tetradecanol graphite nanoplatelets. The heatsink was an annulus contained where its outer surface was subject to a convective cooling of an external flow while its inner surface was exposed to a constant heat flux. The governing equations, including the momentum and heat transfer with phase change, were explained in a partial differential equation form and integrated using the finite element method. An artificial neural network was employed to map the relationship between the anisotropic angle and nanoparticles fractions with the melting volume fraction. The computational model data were used to successfully train the ANN. The trained ANN showed an R-value close to unity, indicating the high prediction accuracy of the neural network. Then, ANN was used to produce maps of melting fractions as a function of design parameters. The impact of the geometrical placement of metal foam fins and concentrations of the nanoparticles on the surface heat transfer was addressed. It was found that spreading the fins (large angles between the fins) could improve the cooling performance of the heatsink without increasing its weight. Moreover, the nanoparticles could reduce the thermal energy storage capacity of the heatsink since they do not contribute to heat transfer. In addition, since the nanoparticles generally increase the surface heat transfer, they could be beneficial only with 1.0% wt in the middle stages of the melting heat transfer.

1. Introduction

There are a wide variety of electrochemical batteries; however, lithium-ion batteries with high power, energy density, and low self-discharge rates are the most common. This battery type creates a lot of heat, particularly during the quick drain process [1]. The lack of an effective thermal management system (TMS) could raise the battery temperature and ultimately affect its performance, efficiency, capacity, power, safety, and life cycle [2]. Furthermore, attaining temperatures below the battery’s operating range will result in a loss of capacity and autonomy and various other issues during setup [3]. Battery temperature monitoring systems maintain the battery temperature consistently and within a safe range [4]. As a solution, researchers have proposed combining active and passive approaches [5]. Air cooling [6], liquid cooling [7], and PCM cooling [8] systems are among the approaches employed in battery TMSs.
PCM use in battery TMSs has many drawbacks, including poor heat absorption capacity, a significant rise in battery temperature after completely melting the PCM, and the need for re-preparation (PCM solidification). Using PCM in cold weather also reduces the pace at which the battery heats up during the first driving period, which may deteriorate the battery [4]. For most PCM materials, the heat conductivity coefficient is about 0.2, which causes significant issues when using PCMs to absorb heat produced by the battery. Once completely melted, however, PCM’s low thermal conductivity changes it into an insulator, limiting heat transmission and causing a fast temperature rise [9]. As a result, the PCM conductivity coefficient must be raised for the produced heat to be correctly transmitted [10]. There are numerous ways to improve the heat transfer rate in PCMs, including the use of nanoparticles [11,12,13], metal foams [14,15,16], and fins [17,18,19].
Sushobhan and Kar [20] reported that nanoparticles in volume fractions of 5 and 2.5 percent might improve PCM performance and melting rate. Another method is to scatter metallic nanoparticles (NPs) throughout PCMs, producing nanoparticle-enhanced PCMs (NePCMs) [21]. The inclusion of NPs may improve PCM conductivity and properties [22]. However, many studies [23] have shown that highly thermally conductive materials improve NePCM viscosity and conduction while lowering heat convection. Loading NPs can only enhance the performance of the TES system at a specific concentration. Li et al. [24] performed an experimental study that proved the synergistic effects of a fin and NePCM on TES unit performance and presented a technique for assessing efficiencies [25]. The researchers discovered that NPs boost TES performance when compared to clean PCM. Using nano-encapsulated phase change particles in working fluids also exhibits lower heat resistance than nano-encapsulated PCM, according to Ho et al. [26]. Li et al. [27] investigated three methods for improving a triple-tube LHTES: MF addition, nanoparticle addition, and geometry modification. The findings demonstrated that nanoparticles and a porous medium did not influence performance. Metal foams may accelerate solidification with decreased porosity or nanoparticles with a more significant volume.
Recent studies on the impact of fins on energy transfer in PCM-filled enclosures have been reported. Ji et al. [28] calculated the melting of PCM in a hollow with a metal double-finned heat sink. PCM melting is boosted by increasing the bottom fin’s length and decreasing the top fin’s size. According to Jmal and Baccar [29], a significant number of fins leads to PCM confinement. Each system should have a suitable number of fins. Abdi et al. [30] estimated the phase change performance of a PCM in a TES with and without aluminum fins. According to research, longer fins transport energy more effectively than a considerable number of fins. By altering the slope and number of fins, Yazici et al. [31] examined PCM melting in a chamber. The results revealed that the number of fins and chamber angle substantially impacted the system’s operating duration. Nakhchi and Esfahani [32] studied heat sink fin designs. It has been shown that the structure of the fins influences PCM melting.
Among the several heat transfer enhancement options outlined above, nanoparticle hybrid fins [33,34], metal foam fin hybrids [35], and porous foams with nanoparticles [36] stand out. Guo et al. [37] investigated the influence of MF and foam on heat transfer via a series of comparative studies. Each MF and fin enhanced the phase change rate of PCMs, but various MF and fin combinations showed the most effect. In a simulated investigation, Zhang et al. [38] evaluated three popular ways of enhancing TES performance. These include heat pipes, copper foam, and fins. Fins and heat pipes offered the best solidification performance, whereas heat pipes and MF enhanced melting. Joshi et al. [39] studied how MF and fins affected heat transfer performance. The application of MF increased solidification and melting rates by 33.33 and 16.67%, respectively, whereas fins increased by 5.56 and 50%. Senobar et al. [40] studied the combined effects of PCM, MF, and NPs. Hybrids increased the phase change rate by 24% compared to pure PCM.
Sheikholeslami et al. [41] studied the phase-changing properties of a triangular fin TES containing CuO nanoparticles. Discharge and melting are minimized for NePCMs. When triangular fins are employed, solidification rates increase by 40.75 percent but reduce by 44.88 percent when using NePCMs. In a finned tank, Kok [42] examined NePCM charging and observed that increasing the number of fins enhanced TES while lowering melt time. Pássaro et al. [43] examined the impact of fins on the melting and output temperatures of TES units and the combined effect of NePCMs and fins. Consequently, introducing graphene nanoparticles considerably increased thermal conductivity, and combining NePCMs with fins enhanced discharge performance.
Ren et al. [44] investigated the thermal performance of PCMs using metal foam and nanoparticles. According to the research, integrating metal foams into the PCM improves its heat transmission capacity more effectively than introducing nanoparticles. Singh et al. [45] used statistics to investigate the impact of a Nanoparticle-Enhanced PCM with a finned conical shell. There have been several studies that examine the effects of HTS tube design. Mahdi et al. [46] examined the thermal performance of an LHS unit comprised of modules with varying PCM melting temperatures. The LHS was enhanced by the use of a variety of PCMs with different melting points. Together with cascaded foam metal and nanoparticles, multi-PCMs provided the best results. Li et al. [47] developed a game-changing MFPCM design for enhanced LHS systems that use nano-encapsulated components. They featured foam porosity for evaluating MF-NePCM heat transmission capacities.
The literature review shows there are only a few studies utilizing NEPMCs and metal foam fins to manage the heat transfer of electronic components. This study investigates the impact of NePCM, fin shape, and MF on the phase change performance of a phase change heatsink.

2. Physical Model

Figure 1 shows a schematic view of a battery with a heated temperature of Th covered with a NePCM heatsink. The heatsink is a cylindrical enclosure partially filled with a metal foam layer. The foam layer covered the battery section. Some fin shape metal foams are also used to improve the heat transfer in the NePCM further. The NePCM comprises 1-Tetradecanol as the host PCM and graphite nanoplatelets (GNPs) as the nanoparticles. Gravity acts in the horizontal direction, as depicted in Figure 1. The entire foam layers and remaining cylindrical space are filled by a NePCM. The inside tube of the heatsink is subject to a heat flux of power q0. The outer perimeter of the heatsink is cooled by a natural convection flow of convective heat transfer coefficient of h and temperature T.
Flow and heat transport in a porous media are the governing equations. The Darcy–Brinkman model, which is similar to the Navier–Stokes equation but includes a source component (fDarcy) that explains the Darcy flow resistance, is used to represent the flow in the porous media. The convective heat transfer equation with effective thermophysical parameters is heat transfer. The heat capacity is a function of temperature (T), which is represented by a time-dependent source component in the heat equation (hsource). Finally, the solid region’s velocity should be lowered to zero. To manage the velocity in solid and liquid zones, a sink component (fsink) was introduced to momentum equations. The sink term acts as a substantial resistance force against the fluid flow in a solid location, bringing the velocity to a stop. The governing equations for mass, momentum, and energy conservation in the aforementioned model are as follows [48,49,50]:
Conservation of mass:
u i x i = 0
Conservation of momentum:
ρ NePCM ε u i t + ρ NePCM ε 2 u j u i x j = P x i + x j μ NePCM ε u i x j + f Darcy , i + f sink , i + f b , i
Conservation of energy:
( ρ c p ) eff , NePCM T t + ( ρ c p ) NePCM u i T x i = x i k eff , NePCM T x i + h source
in which u1 and u2 are the velocity components in the x1 and x2 directions. The thermophysical parameters include density (ρ) and dynamic viscosity (μ) in the momentum equations. The heat equation contains the thermal conductivity (k) and specific heat capacity (cp). The subscripts NePCM and eff denote the nano-enhanced PCM and the effective thermophysical characteristics, respectively. In the governing equations, the source and sink terms are presented as:
f Darcy , i = μ NePCM κ u i ,   f sink , i = A m u s h 1 2 θ T + θ 2 T λ + θ 3 T   u i ,
f b , i 0 i = 1 β NePCM ρ NePCM g T T f i = 2
and
h source = ε ρ NePCM L f θ T t
in which the thermophysical features are the heat of phase change (Lf), phase change temperature (Tf), and volumetric thermal expansion (β). In addition, λ = 0.001, Amush = 1010 (Pa·s/m2), and g = 9.81 m/s2. The liquid PCM concentration, θ, is a function of temperature and is expressed as [50]:
θ T = 0 T < T f Δ T f / 2 T T f Δ T f + 1 2 T f Δ T f / 2 < T < T f + Δ T f / 2 1 T > T f + Δ T f / 2
In the above, the fully molten and solid PCM are denoted by θ = 1 and θ = 0. There is a layer of metal foam fins with a fixed value of permeability (K) and porosity (ε). The porosity in the clear region (no metal foam) is unity, and the permeability tends to infinity. Thus, the domain can be explained as:
ε = ε 1 metal   foam 1 clear   space ,   and   K :   K 1 meal   foam clear   space
According to Table 1, 1-tetradecanol thermophysical characteristics in the solid and liquid states were assumed to be constant. The thermophysical features of 1-tetradecanol-GNPs were used based on the experimental data [51] and summarized in Table 1.
The composite PCM-metal foam’s effective heat capacity and thermal conductivity are calculated as:
ρ C p eff , NePCM = 1 ε ρ C p m + ε ρ C p NePCM
The thermal conductivity of the composite was calculated using the following formula [52]:
k eff , NePCM = 1 δ 1 ε k m + ε k N e P C M + δ k N e P C M ε + k m 1 ε
in which the coefficient δ takes a value of 0.35, according to [52]. The practical observations of [53] are well supported by Equation (8). The metal foam is indicated by the subscript m. Furthermore, [48] was used to obtain the porous permeability:
K = d p 2 73 × 10 5 1 ε 0.224 d l d p 1 1.11
d l d p 1 = 1.18 1 ε 3 π 0.5 1 exp 1 ε / 0.04 1
in which dp = 0.0254/10PPI. The permeability of the foam layer was computed as K = 9.6536 × 10⁻⁸ m2 for a porosity of ε = 0.95. The characteristics parameters melting volume fraction (MVF), the average temperature at the heated surface, and stored energy (SE), were expressed as
MVF = A ε θ d A A ε d A
T a v g = s T d s s d s
SE = Q latent + Q sensible
where A is the domain surface, and s is the length of the heated wall. Qlatent and Qsensible denote the latent and sensible heat stored in the heatsink domain.
Considering the boundary conditions, all surfaces are impermeable with zero slip. The symmetric boundary conditions were also applied for the heat and fluid equations at the symmetry line. The PCM-heatsink is initially at a supper cold temperature T0 = Tf − 10 °C, where the fusion temperature of NePCM is Tf = 37 °C. The heated tube is exposed to a heat flux of q0 = 5000 W/m2, and the heatsink perimeter is exposed to a cooling fluid of T = Tf − 10 °C and h = 25 W/m2 K.

3. Numerical Approach, Mesh Sensitivity Study, and Verification

3.1. The Finite Element Method

The finite element technique (FEM) [54] was used to integrate the momentum and energy equations, as well as the related initial and boundary conditions, across a discretized time and space. Based on the FEM, the weak form transformation was applied for the partial differential equations. Then, the basis set was invoked to expand the filed variables. Furthermore, the second-order shape functions were applied to the field variables. Gauss’s quadrature elements method was then utilized to integrate the field variable and get residual equations. As a result of using the Gauss quadrature integration to integrate the equations over the domain of the solution, the residual functions equations at each element. The residual equations are estimated by using the second-order Gaussian quadratic method. The Galerkin finite-element-method details can be found in [55,56].
In a linked approach, the Newton technique, A PARDISO (PARallel DIrect SOlver (PARDISO) solver [57,58,59], was used to solve the residual equations for the field variables, with a relaxation factor of 0.9. In addition, the backward differential formula [60] with a first-second order was then used to regulate the timesteps and precision of the calculations, resulting in a relative error of less than 10−4. MVF > 0.999 met the halt criterion for calculations, which was complete melting.

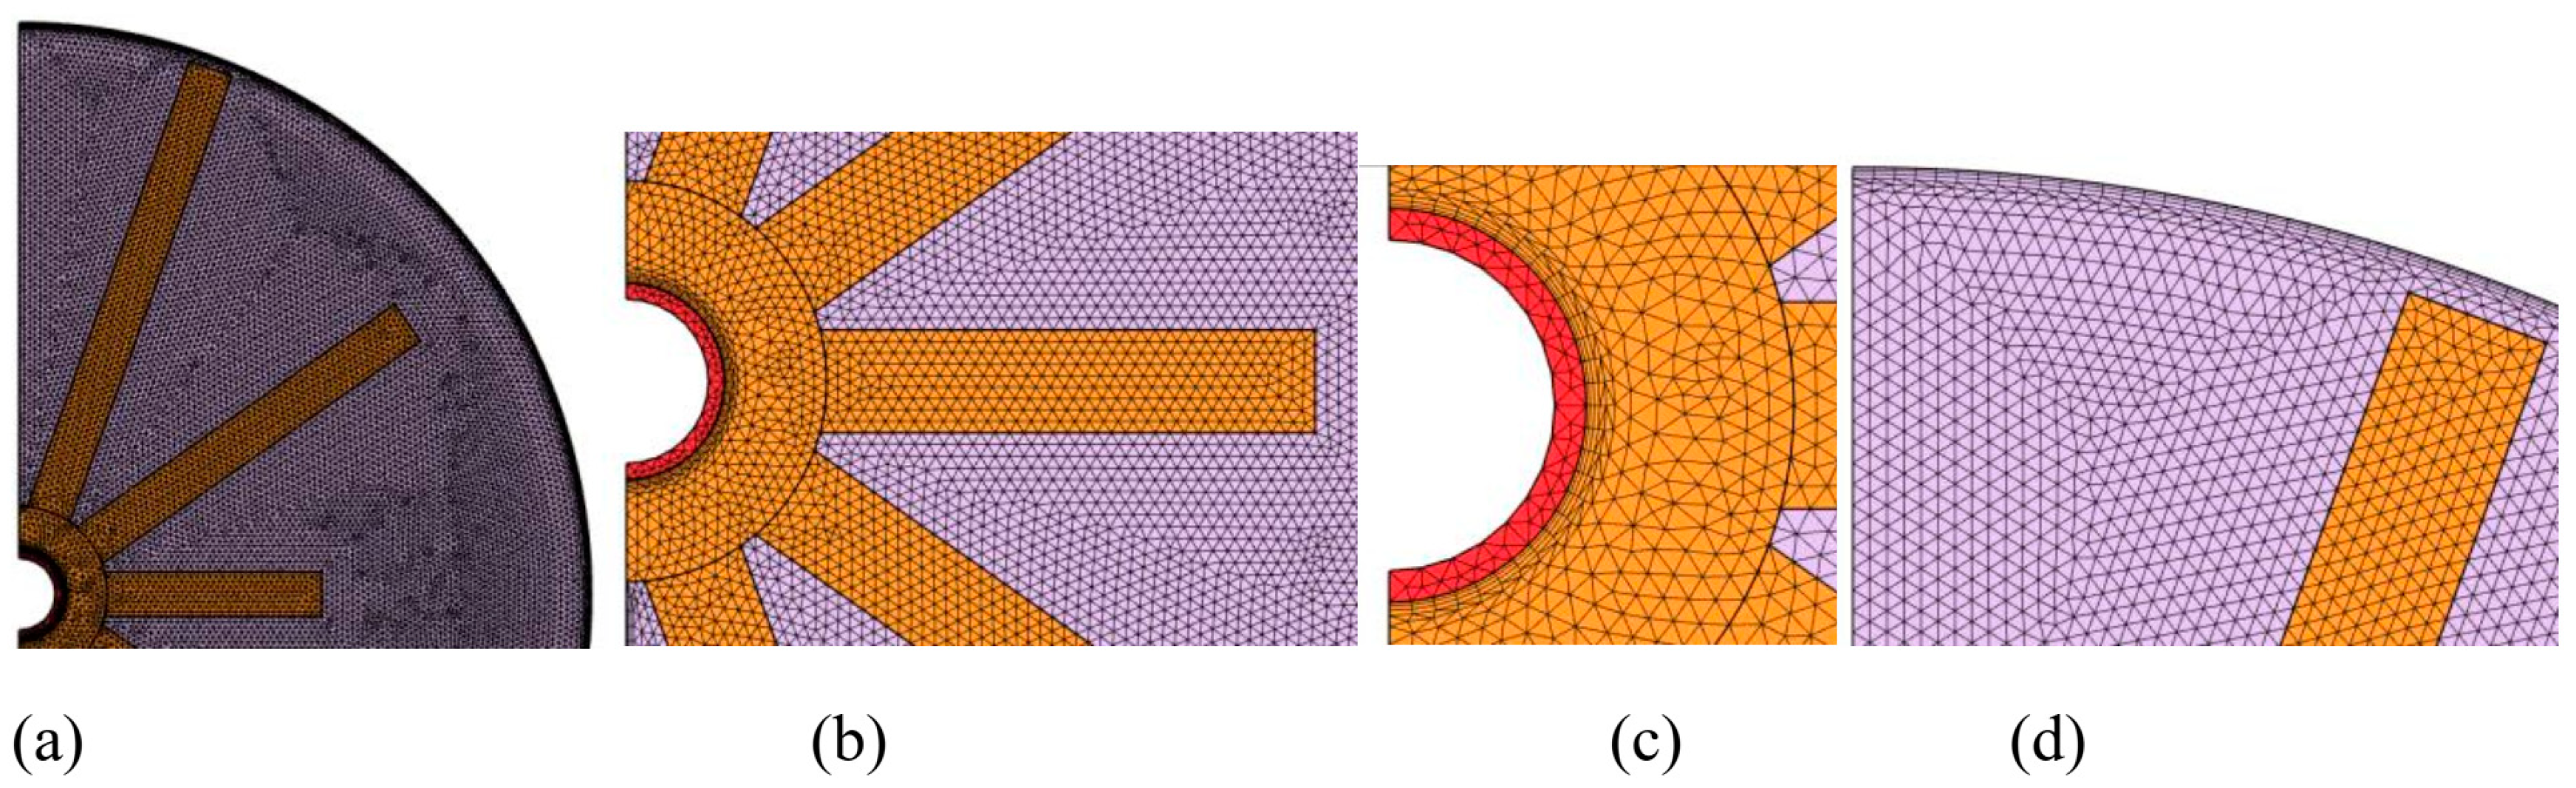
3.2. Mesh Sensitivity

An unstructured mesh was selected to discretize the domain. The boundary layer shape meshes were used for walls to better capture velocity and temperature gradients. Mesh sensitivity analysis was performed on a case with γ = 35° and ω = 1% wt to check the effectiveness of different grid sizes on the findings. A mesh control variable, Nmesh, is introduced to control the mesh sizes. The smaller the Nmesh variable, the finer the mesh elements. Table 2 summarizes the specific features of each analyzed mesh, including the elements, edges, MVF, and heated wall average temperature after 5 h of heating. Figure 2 illustrates the impact of mesh sizes on the computed MVF in the enclosure for various Nmesh values. As seen, a mesh produced by a Nmesh value of 0.25 could provide an accurate wall temperature and also evaluate MVF with fair accuracy. As a consequence, the current study’s findings are calculated using a Nmesh = 0.25. Figure 3 shows a broad and detailed perspective of the preferred mesh.

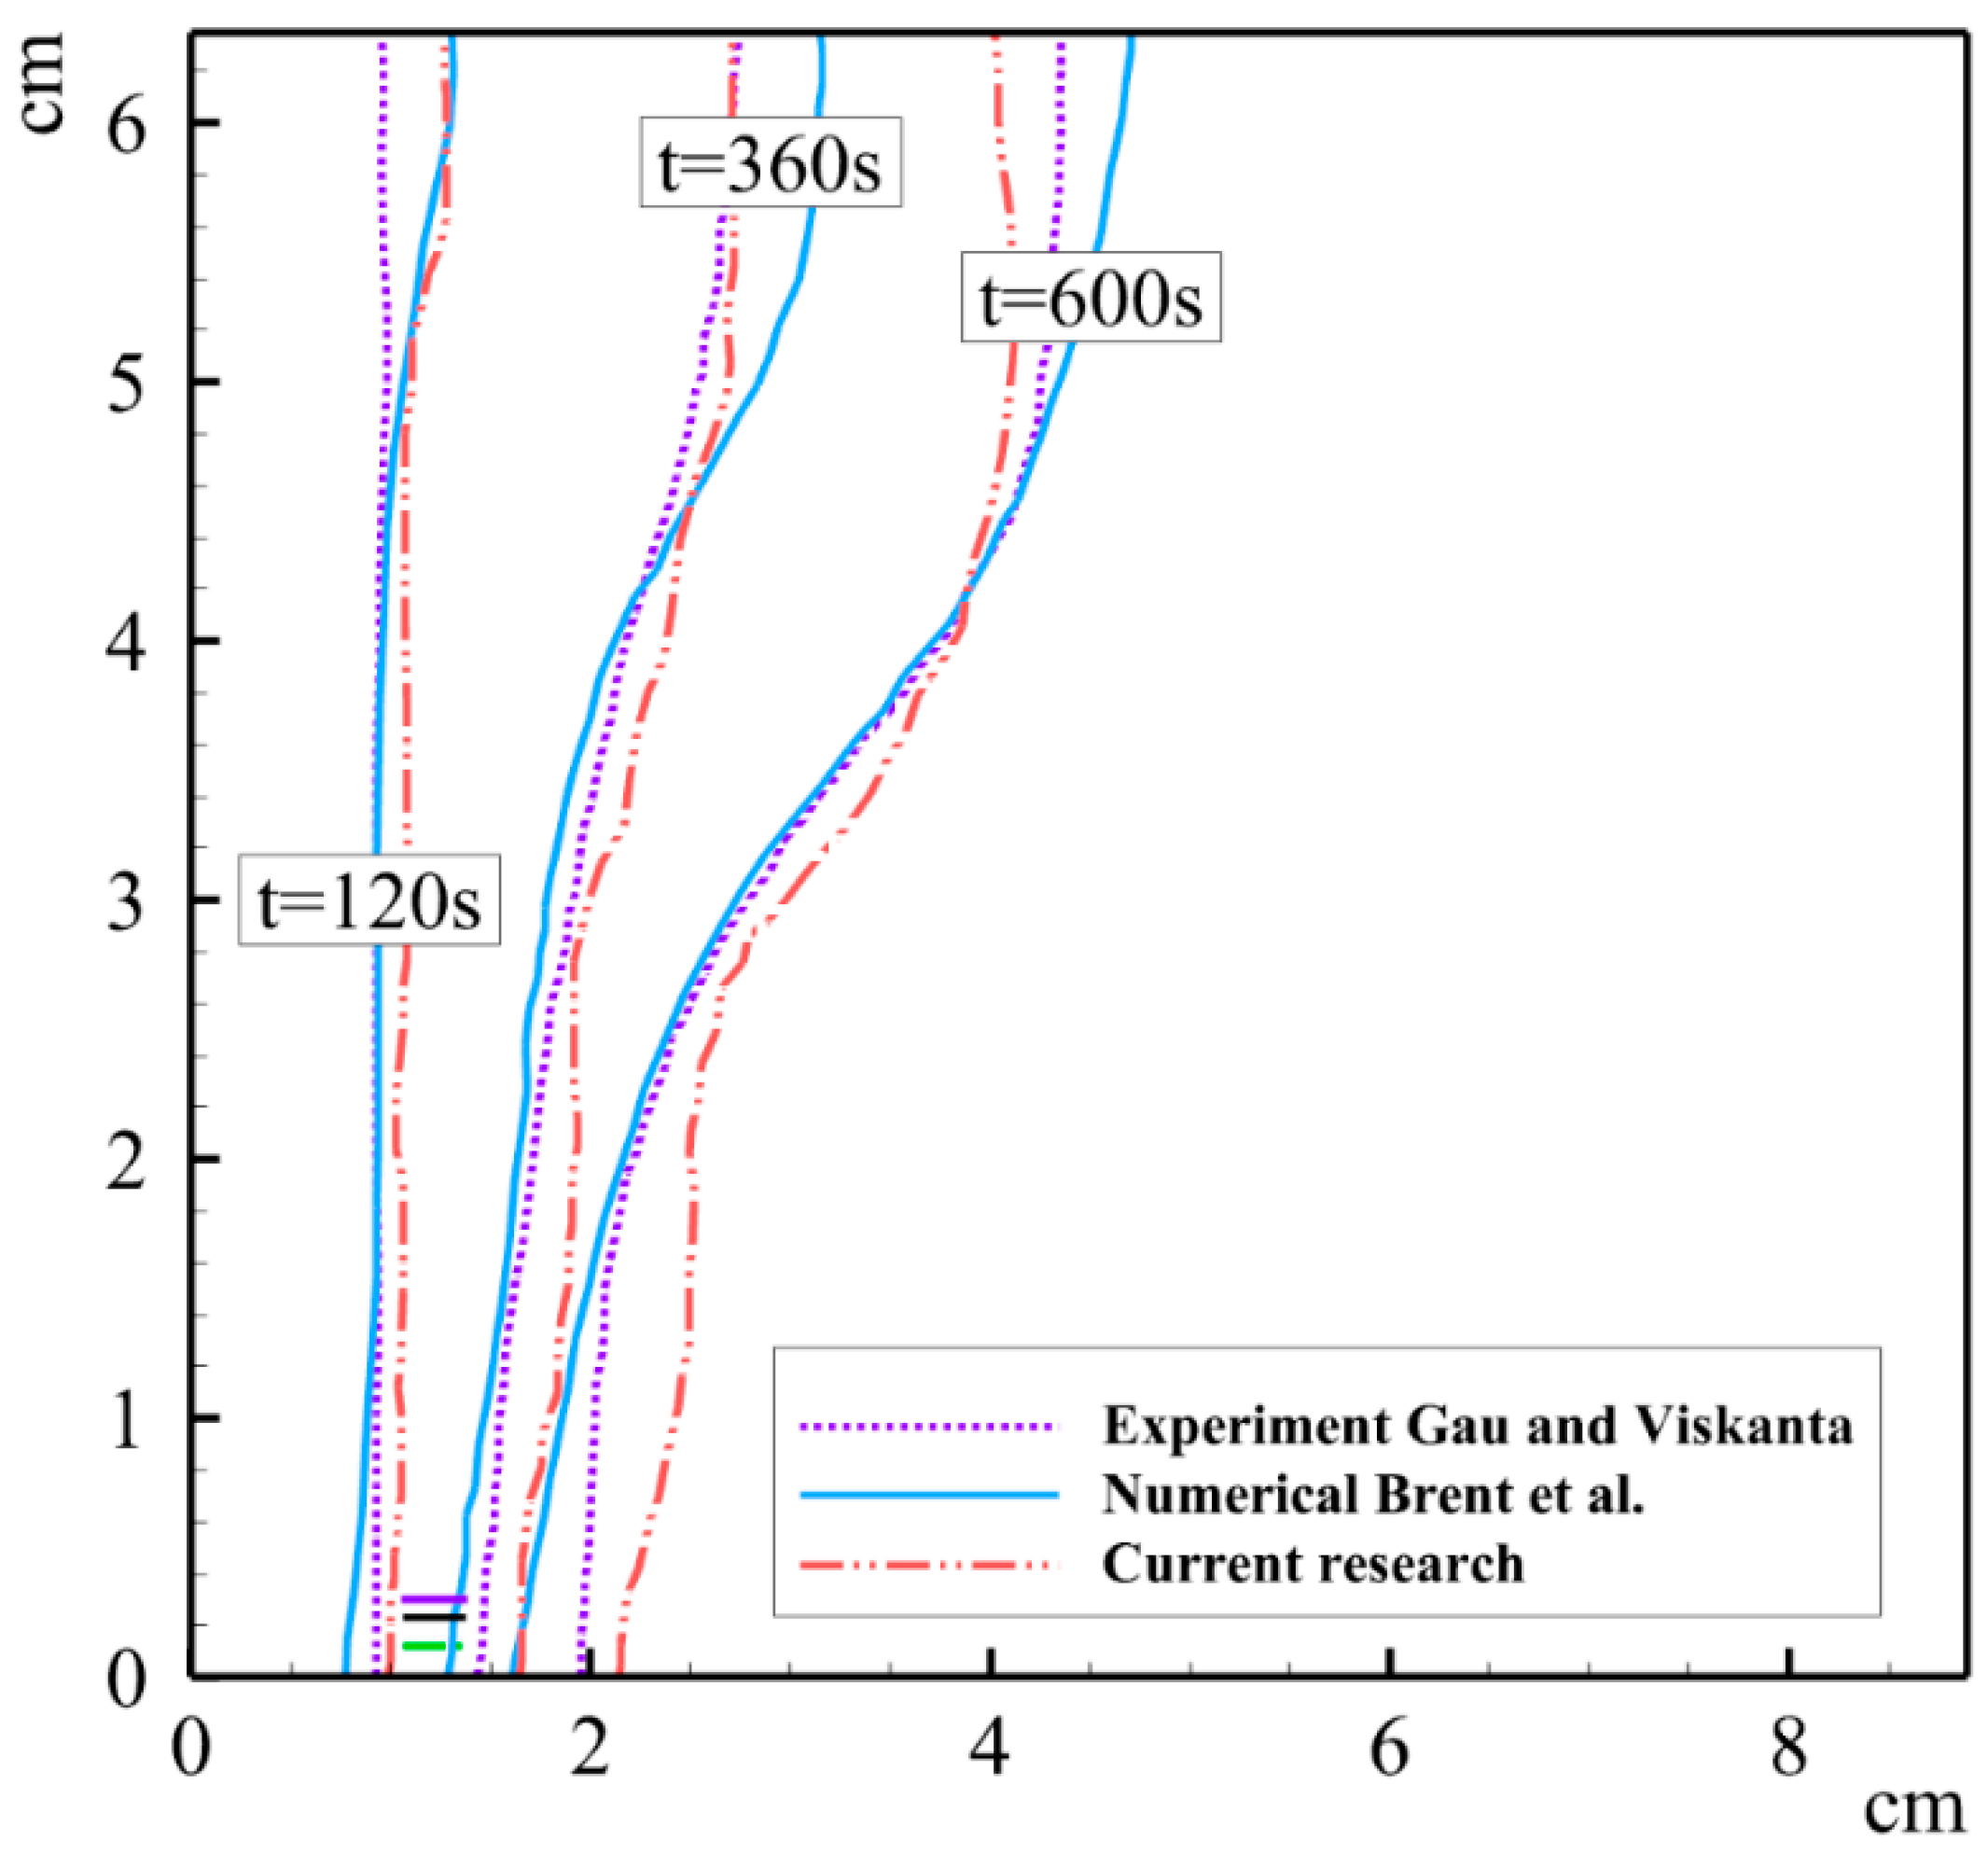
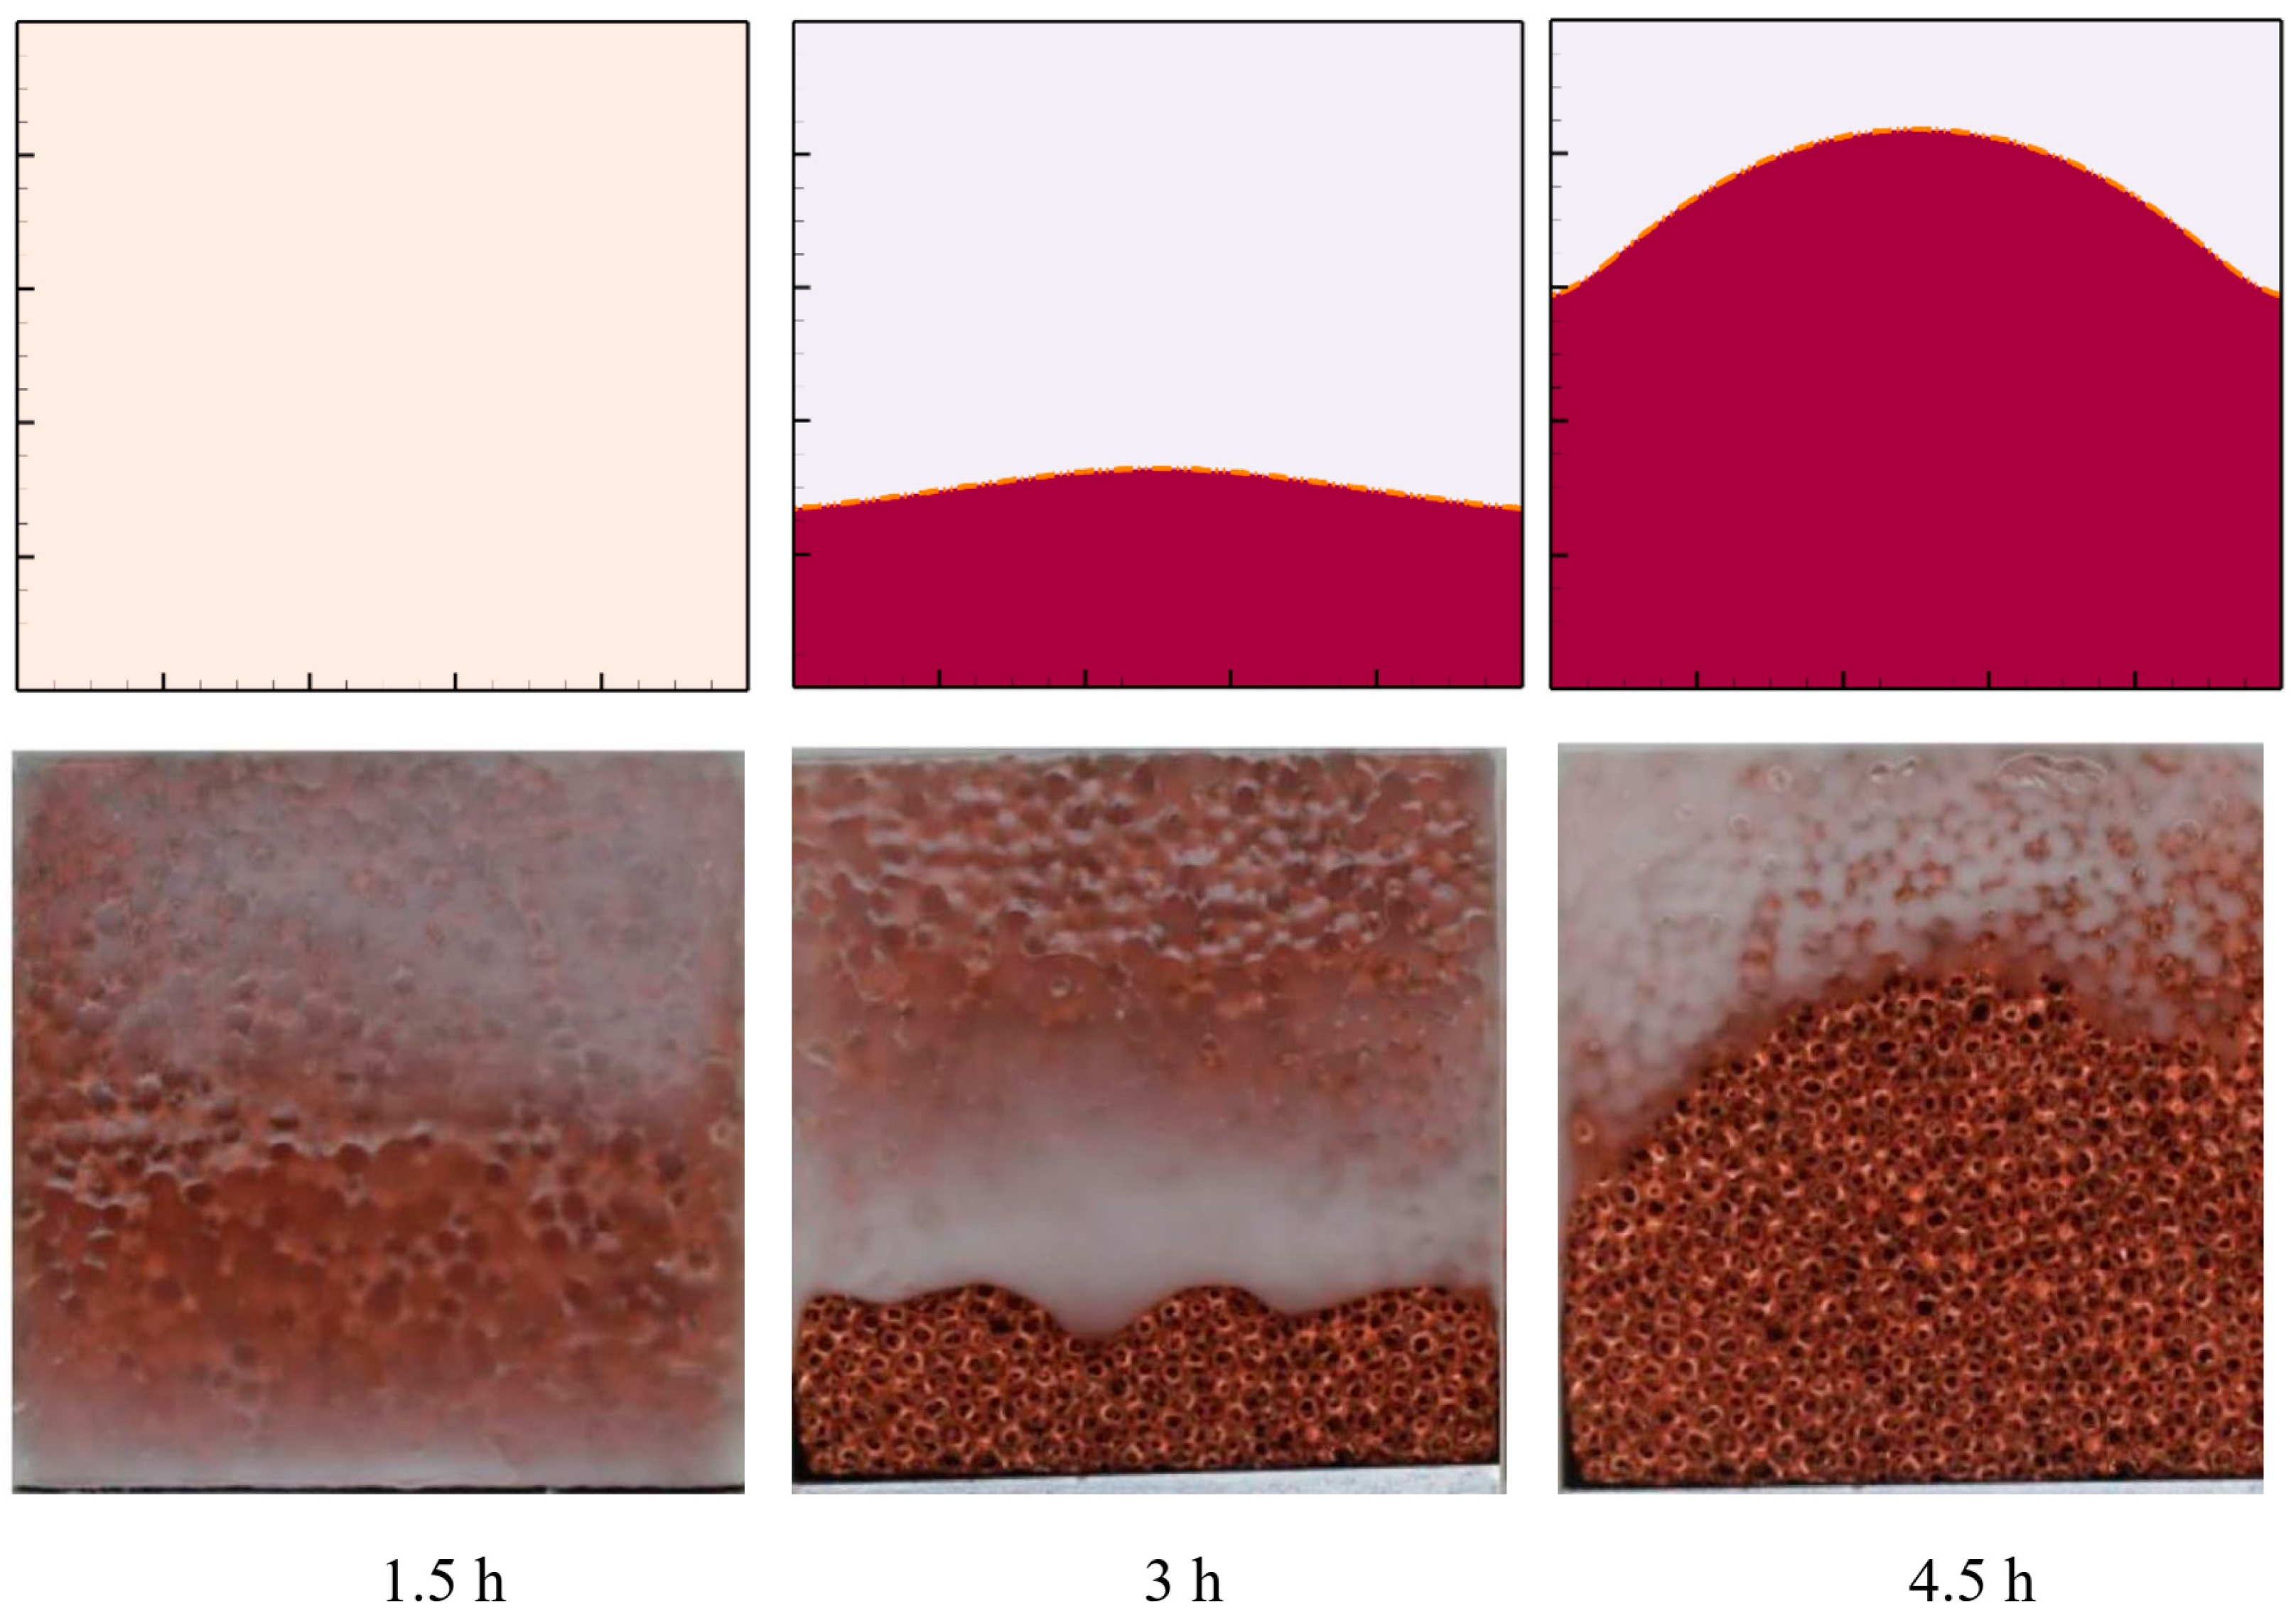
3.3. Validation and Verification

The accuracy of the present model and computations were examined by comparing the outcomes with the literature study of Gau and Viskanta [61] for PCM melting in a rectangular shape container (63.5 × 88.9 mm). The results simulated the melting of a super-cold PCM (28.3 °C) while the contained wall was subject to a heated temperature of 38 °C. The shape of the melting interface is compared with the experimental study of [61] and simulations of [62] in Figure 4. This figure represents acceptable proximity between the results.
Moreover, the melting of paraffin wax in a copper metal foam, as explained in [63], was simulated. The simulations were performed for melting paraffin-embedded in Cu foam (ε = 0.975) enclosed in a square container with a height of 10 cm. The PCM was heated from below. The results are reported in Figure 5. This figure also denoted fair proximity between the simulated data of the current research and [63].

4. Results and Discussion

In the current study, the impact of the fin’s angles and the weight concentration of nanoparticles on the cooling performance of the heatsink was investigated.

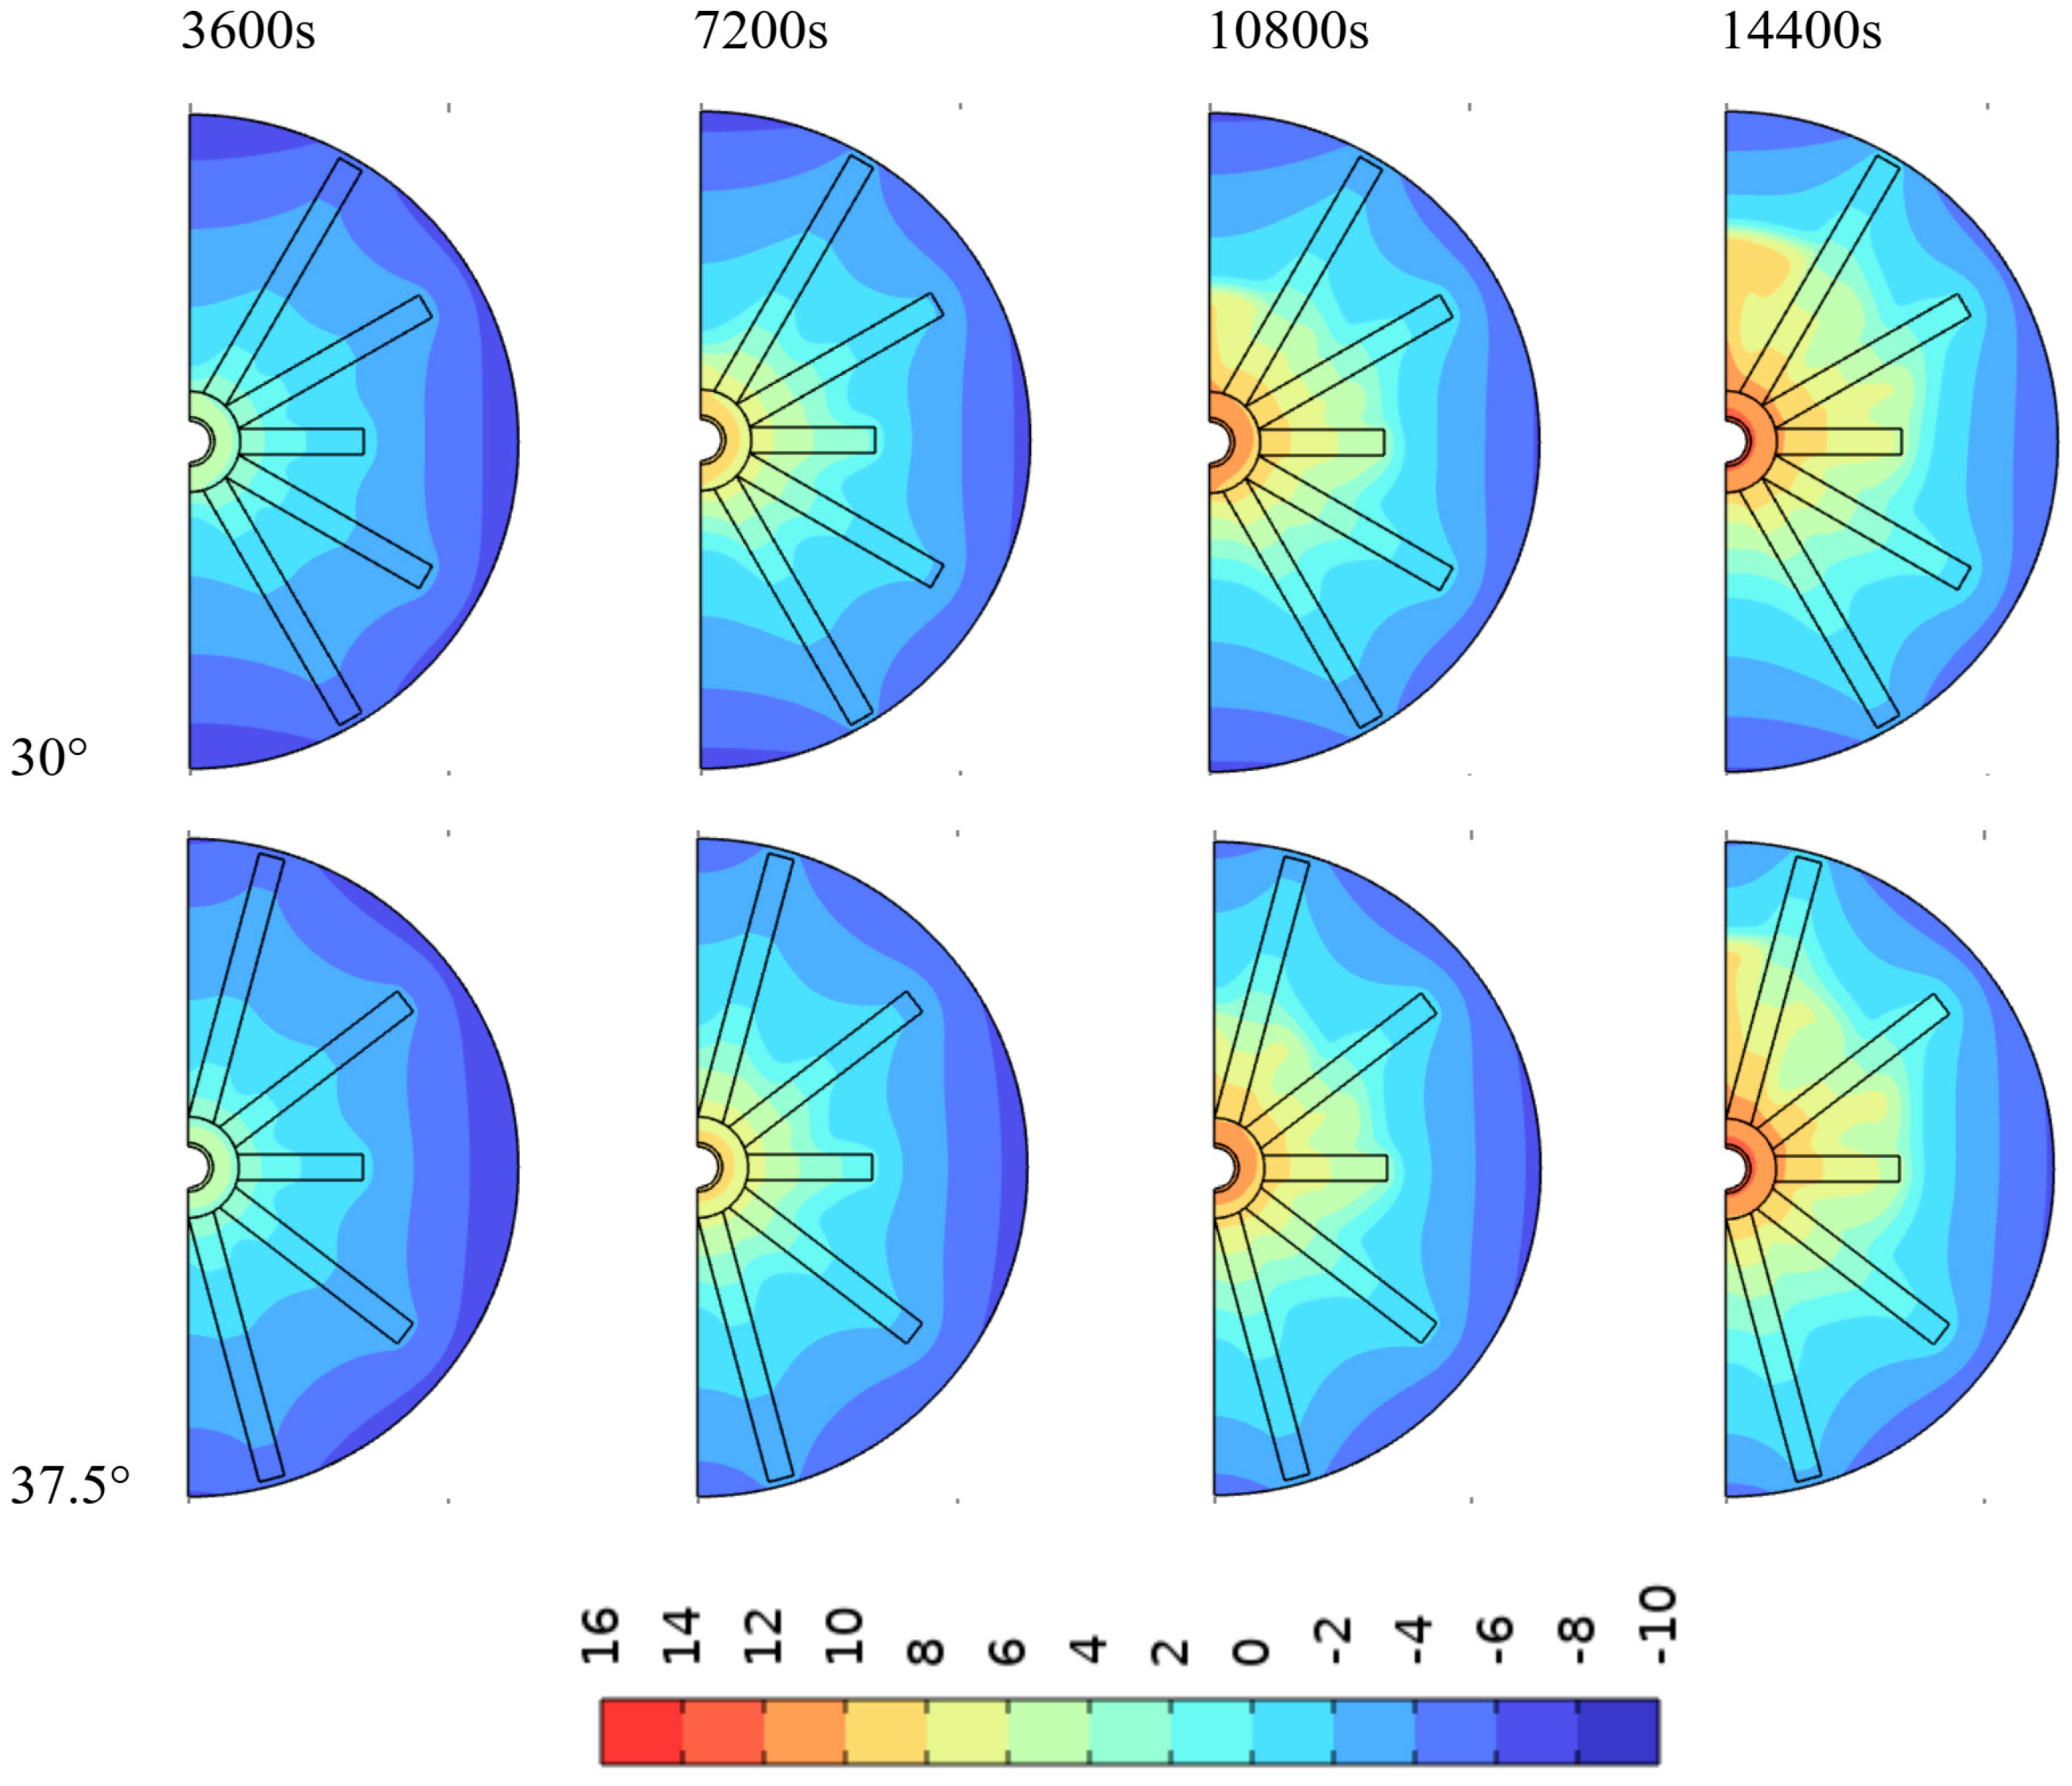
4.1. Impact of Fin Angle

Here, four fin placement angles of 30, 32.5, 35, and 37.5° were investigated. The impact of the fin’s placement angle, δ, was addressed on MVF, surface temperature difference (TaveTf), and the stored energy in Figure 6. From now on, for the sake of simplicity, we call the surface average temperature difference the surface temperature.
As seen, the change of δ induces almost no impact on the MVF and the stored energy. This could be expected since the amount of energy that enters the heatsink is equal to the heat flux power (q0) times the surface area of the heated wall. Thus, the net amount of heat rate is a fixed value, and the change of δ does not change the heat capacity of the heatsink. Therefore, the net amount of stored energy in the enclosure should remain constant regardless of the value of δ. Since there is a negligible temperature gradient in the solid PCM, the amount of MVF also follows the trend of stored energy.
Moreover, the variation of δ slightly changes the surface temperature. A larger δ results in a smaller surface temperature in the middle of the melting process. This is because the larger the δ, the better the fin distribution in the entire heatsink. Thus, for a fixed amount of metal foam, a heatsink with a larger δ could work well.
Figure 7 and Figure 8 illustrate the maps of MVF and temperature differences in the heatsink for four timesteps of one (3600 s), two (7200 s), three (10,800 s), and four (14,400 s) hours. Initially, the MVF patterns for both cases of δ = 30° and δ = 37.5° are similar. As time progresses, and since the effective thermal conductivity of the composite fins is enhanced compared to the rest of the medium, the MVF has a tendency to extend along the directions of the fins. Moreover, at the final melting times (four hours) for the case of δ = 37.5, there is a larger molten area at the top regions of the enclosure compared to the case of δ = 30°. The bottom region for both cases looks similar. The temperature patterns for both cases also show similar patterns. The most notable difference between the isotherms is at the final stages of the melting process (four hours). In the case of δ = 30°, a large plume of heated PCM (+10 °C) can be seen in the upper region of the enclosure. This is a Rayleigh–Bénard shape natural convection shape that forms toward the top cold regions of the heatsink container. In the case of δ = 37.5°, the melting interface is more advanced toward the top, and there is a larger gap between the heated surface and the top region (melting interface); thus, the heated plume is smaller.

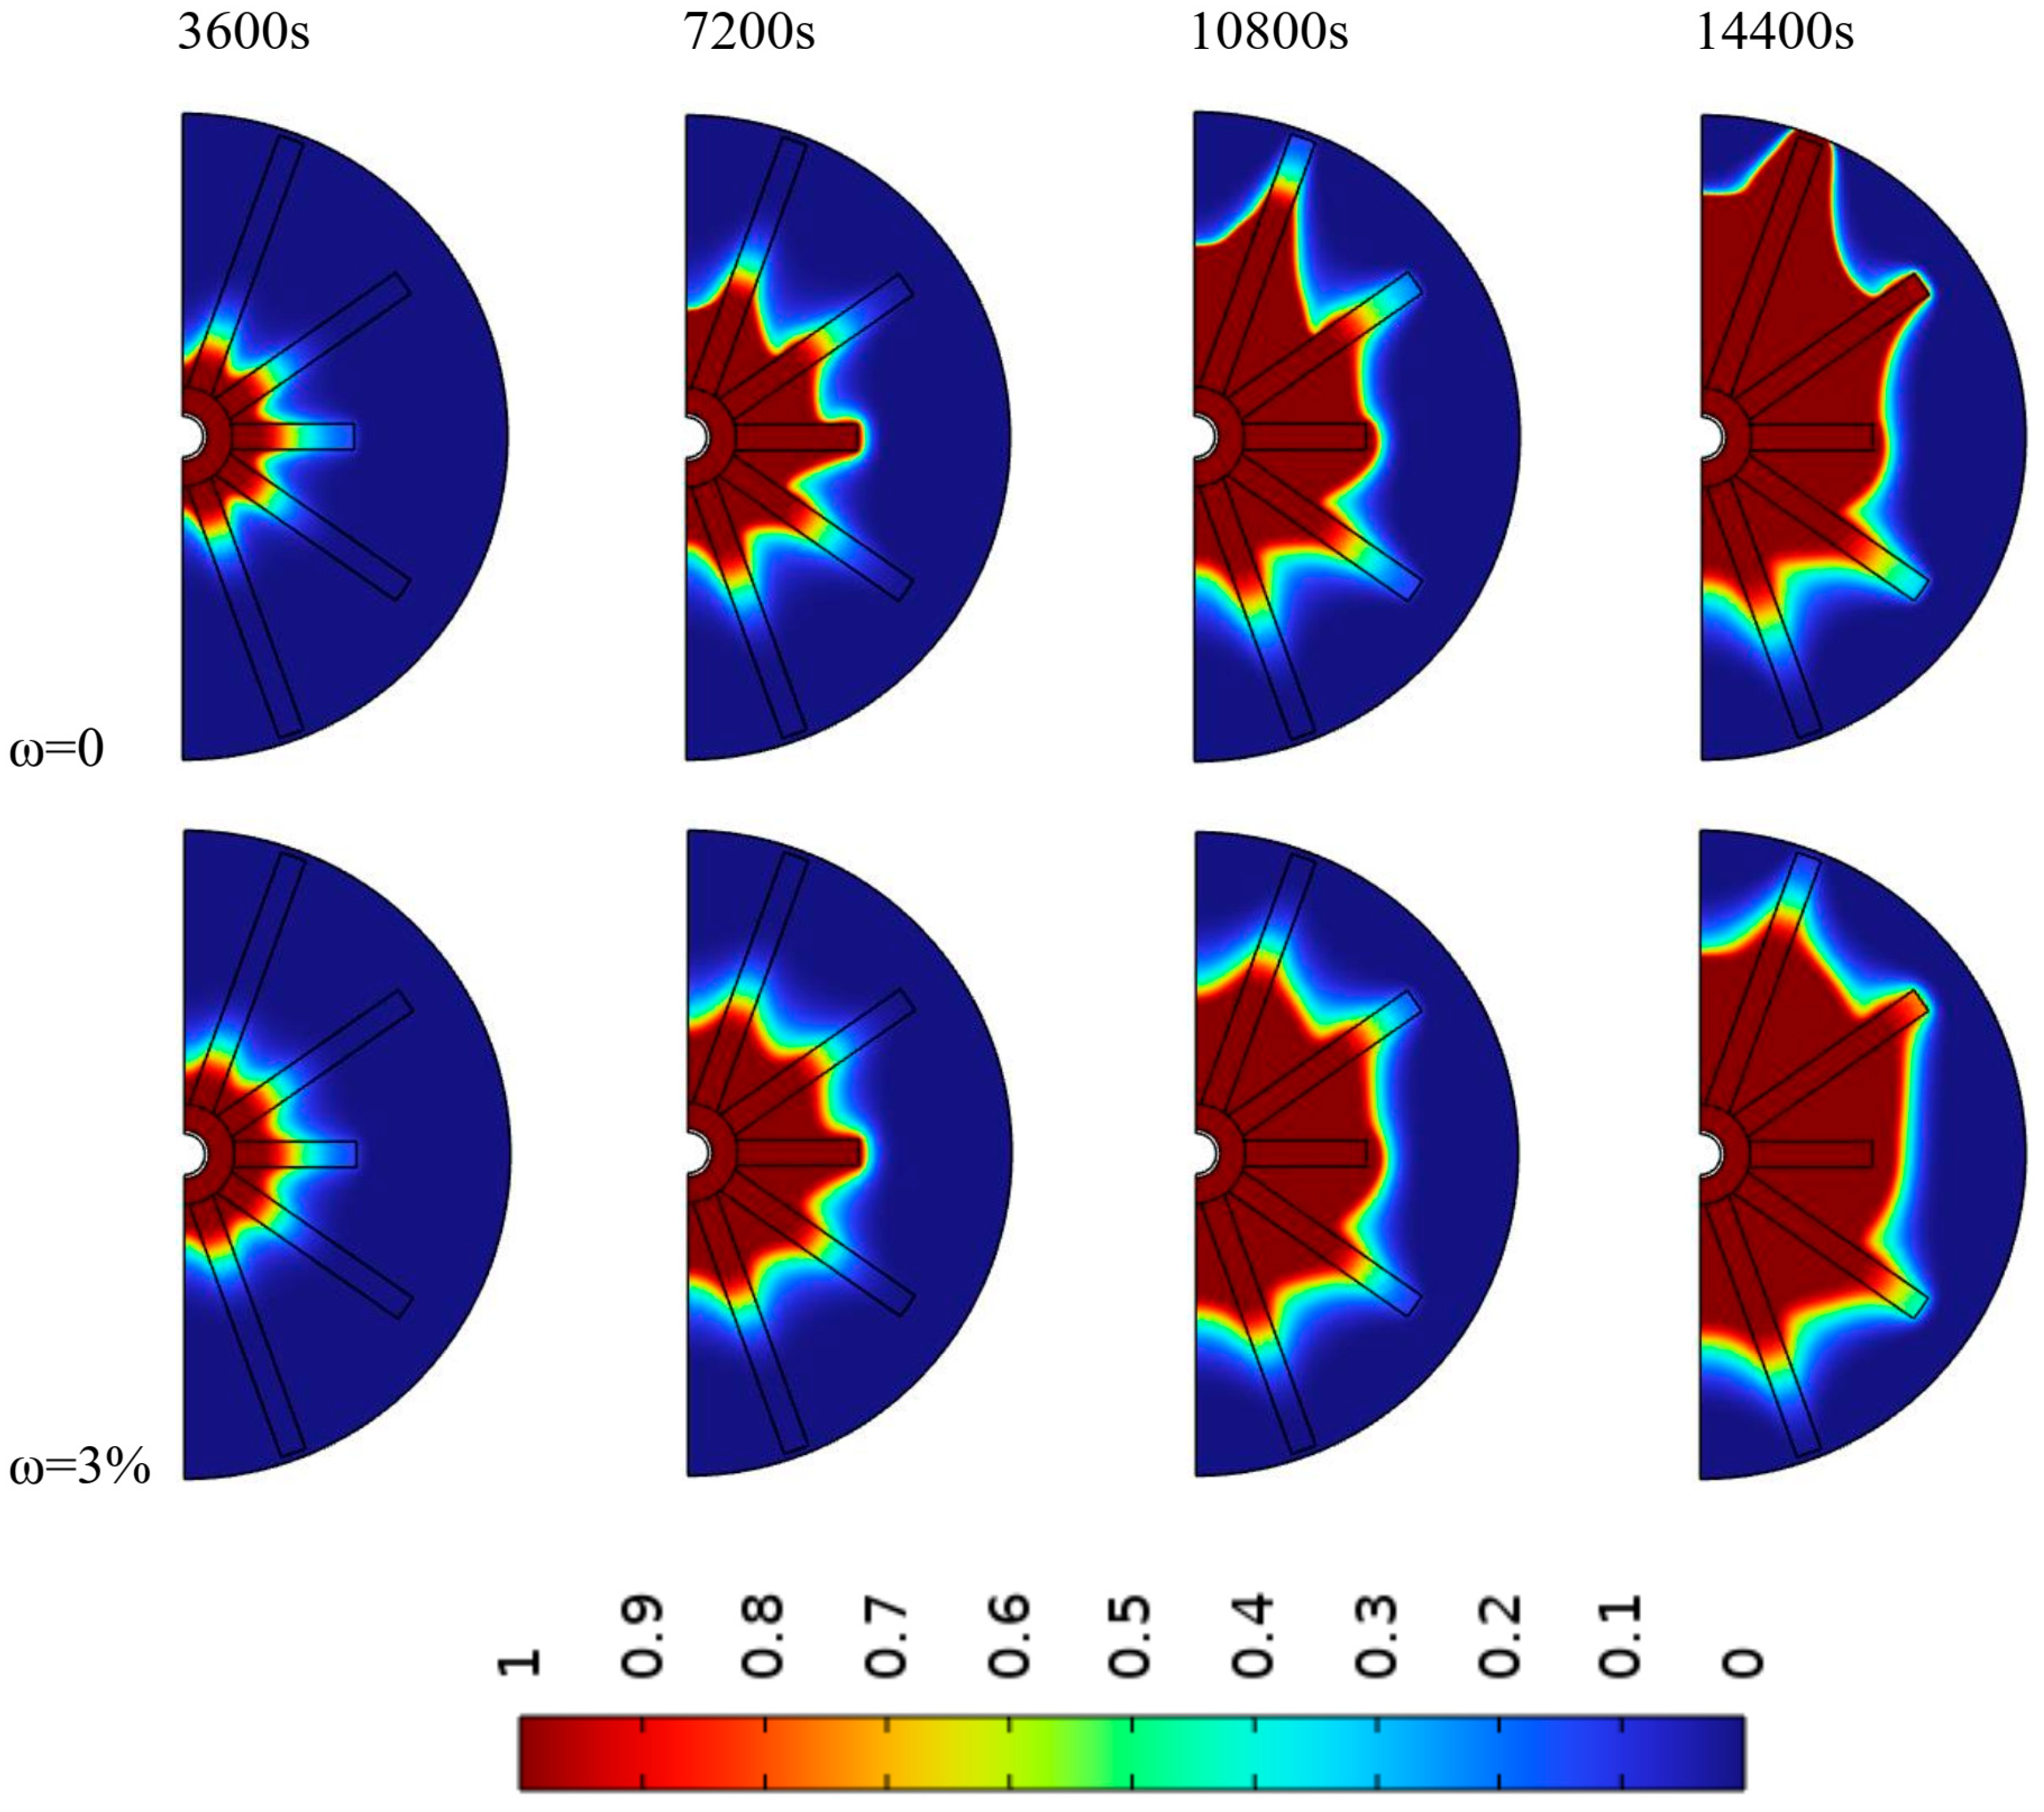
4.2. Impact of Nanoparticles Concentration

The impact of the weight fraction of GNPs (ω) on the MVF, surface temperature, and stored energy is depicted in Figure 9. With the increase of ω, the MVF rises. Indeed, the GNPs do not contribute to the phase change heat transfer, and since the amount of heat rate from the heated surface is fixed, the MVF increases. This means more NePCM should be melted to absorb the input heat from the heated surface. The amount of stored energy per unit weight of the heatsink reduces by increasing the weight fraction of nanoparticles because the GNP is much heavier than the base PCM and does not contribute to the phase change heat transfer. Thus, the heavy and low heat capacity GNPs reduced the overall normal heat capacity of the heatsink. Finally, the presence of GNP nanoparticles raises the temperature of the heated surface at final times. However, a small decrease in surface temperature in the middle of the melting process can be observed for the case ω = 1.0%. It should be noted that the heat flux at the heated surface is constant; thus, the surface temperature is directly related to the heat transfer rate. The reduction of surface temperature for ω = 1.0% could be the result of improved thermal conductivity caused by the presence of GNPs. In the initial stages of melting heat transfer, the convection heat transfer mechanisms are negligible, and conduction is the dominant mechanism of heat transfer. However, as the melting advances, the amount of molten NePCM increases, and natural convection effects appear. The dynamic viscosity NePCM is an important parameter in controlling the strength of the natural convection flows. The presence of NePCM particles increases the dynamic viscosity of the NePCM mixture and thus reduces the strength of the natural convection flows. Therefore, an increased surface temperature can be observed at the final stages of melting heat transfer.
Figure 10 and Figure 11 show the influence of nanoparticle concentrations on the contours of MVF and temperature for two weight fractions of 0% and 3.0%. It is interesting that the melting front extends more uniformly in the presence of GNPs compared to the case with no GNPs. For example, the edge of the top fin (t = 14,400 s) is completely melted when ω = 0, whereas a fair portion of the top fin is still in the solid region when ω = 3.0%. This could be due to a pure PCM’s lower dynamic viscosity, which results in a stronger natural convection circulation. Moreover, attention to the temperature contours shows the heated surface and its neighbor regions are generally at a higher temperature when ω = 3.0% wt compared to the case of ω = 0%. This observation agrees with the average surface temperature, i.e., TavgTf, noted in Figure 9.

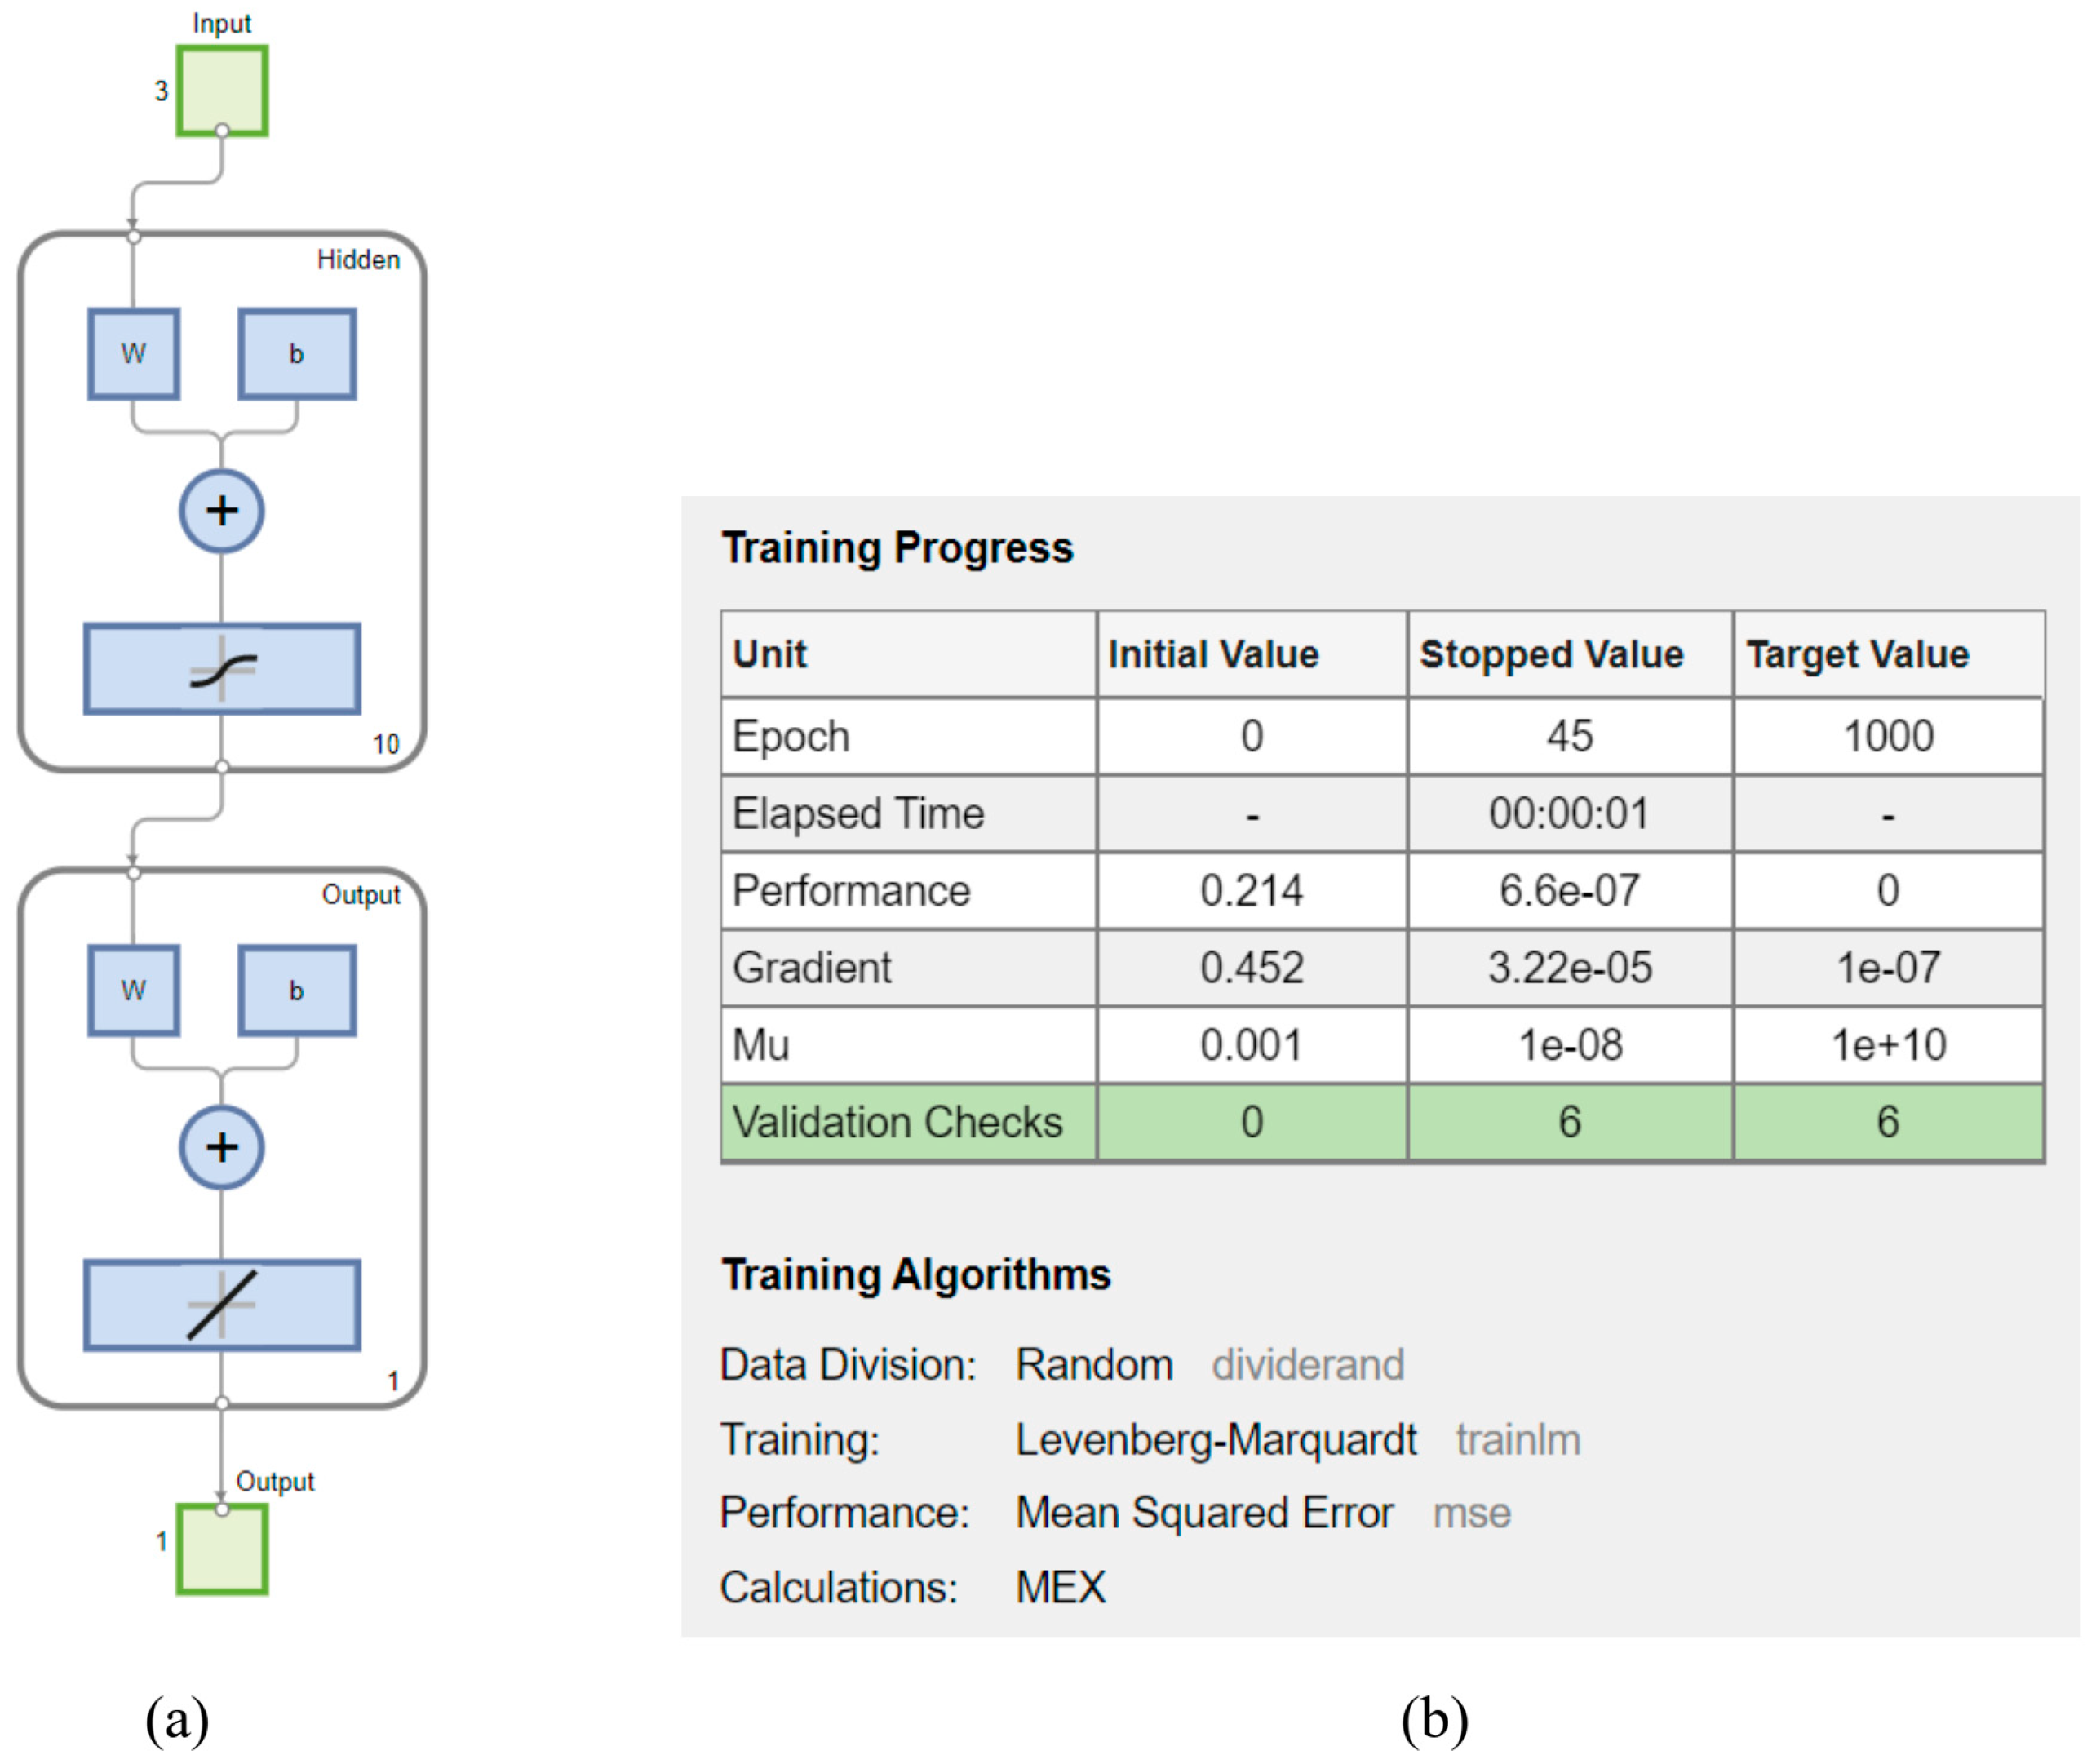
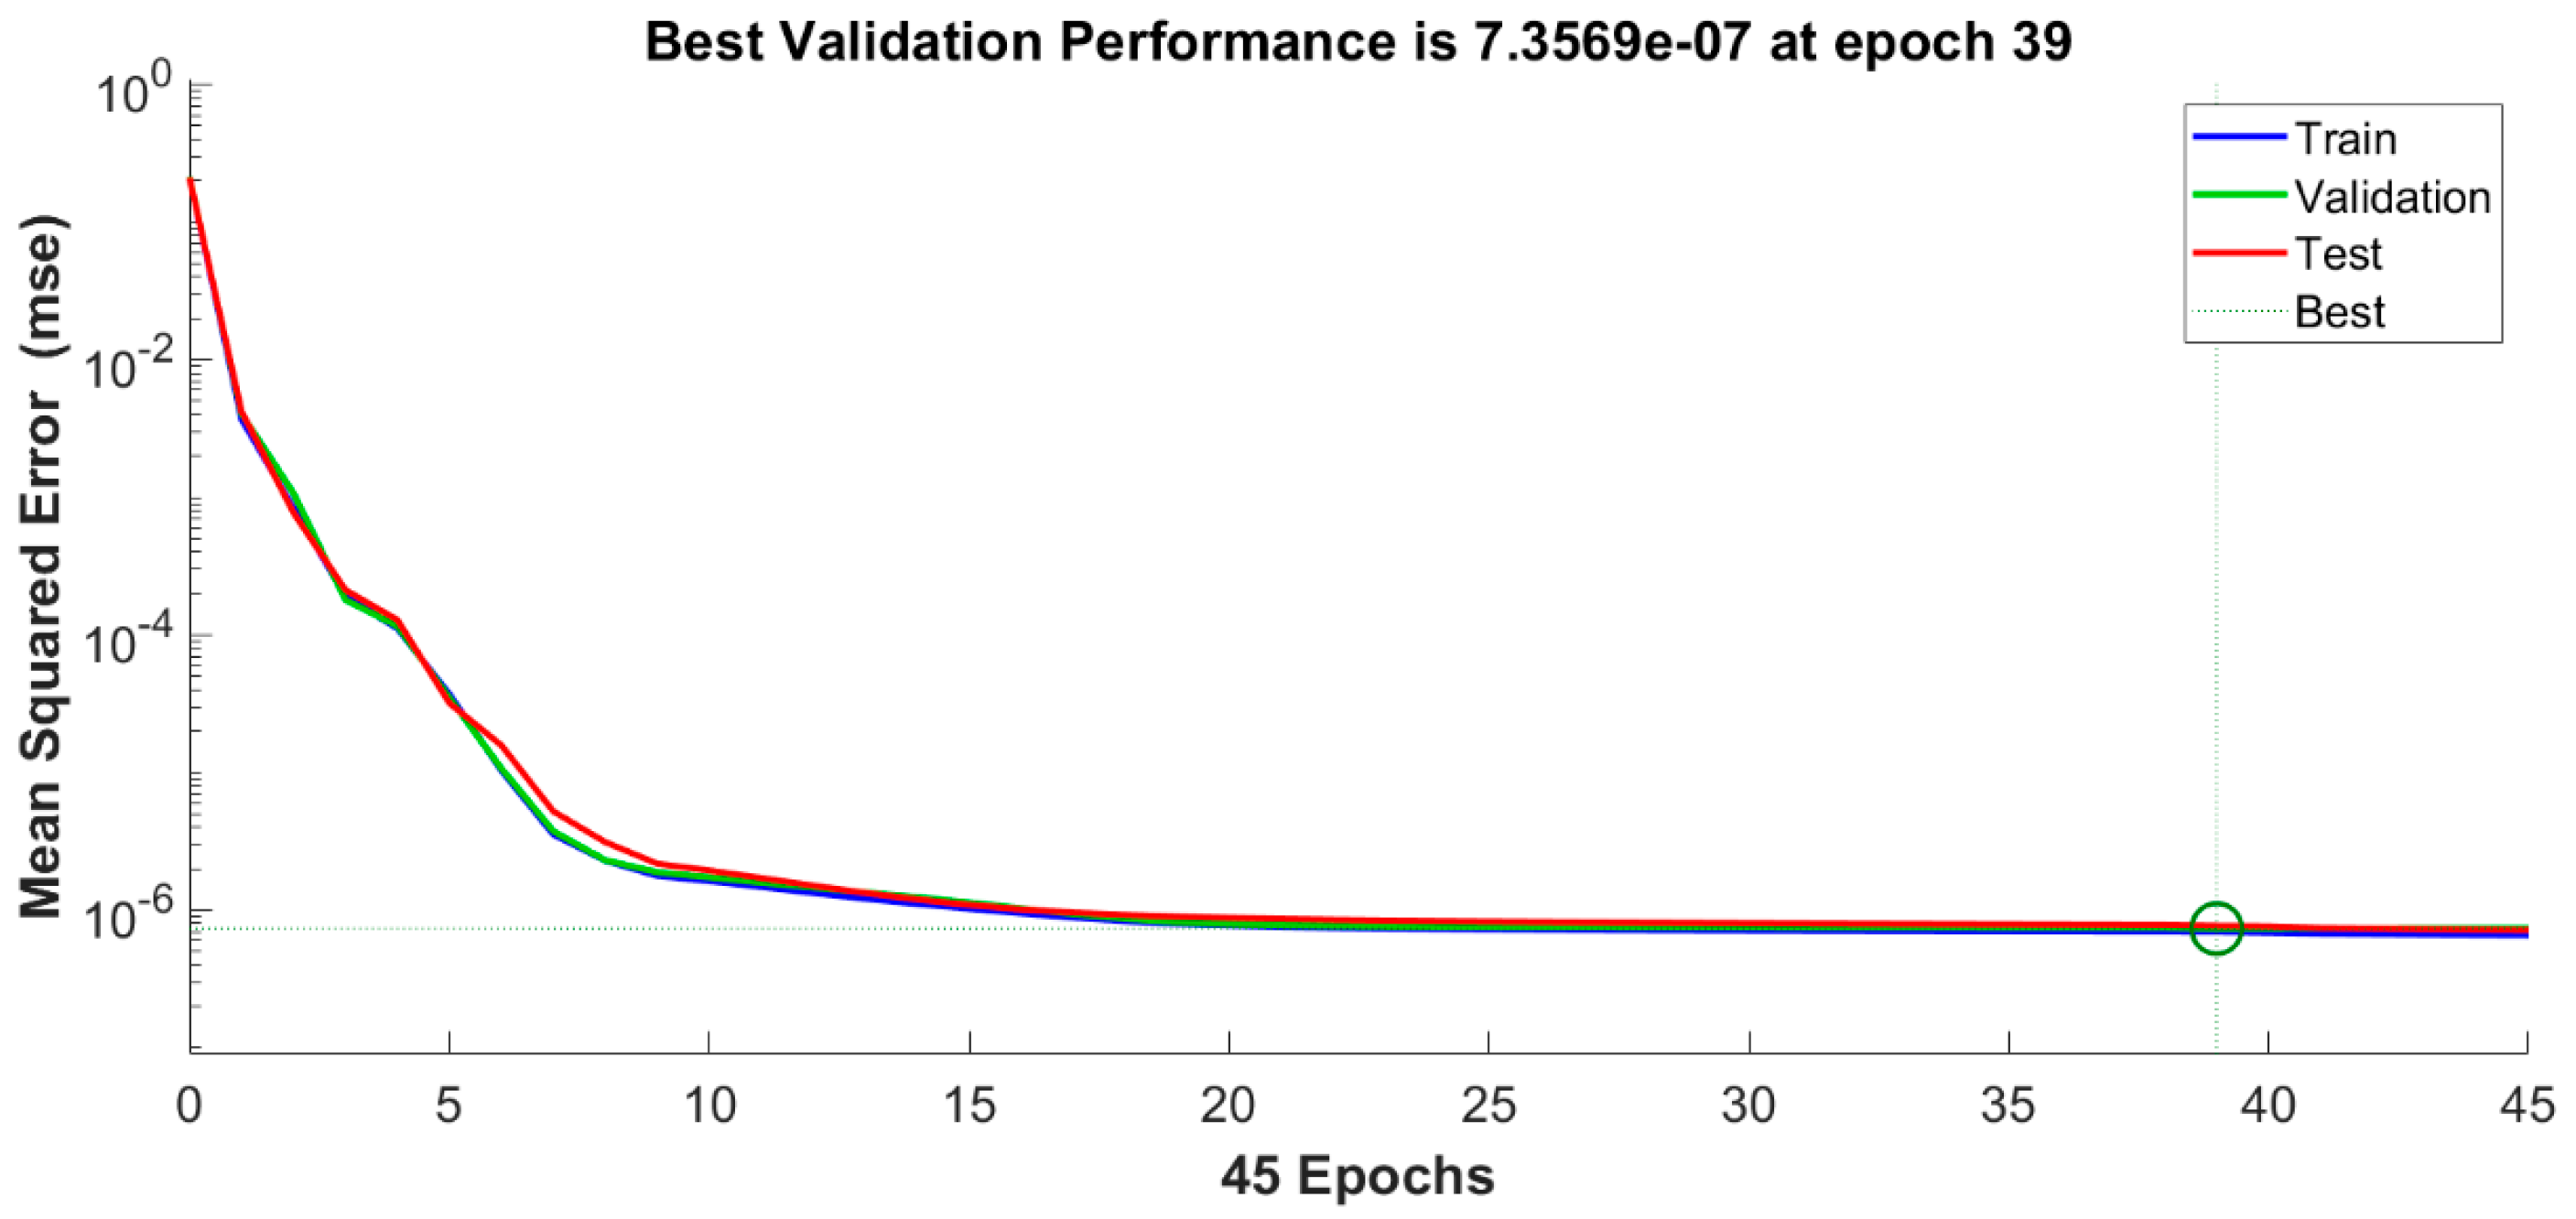
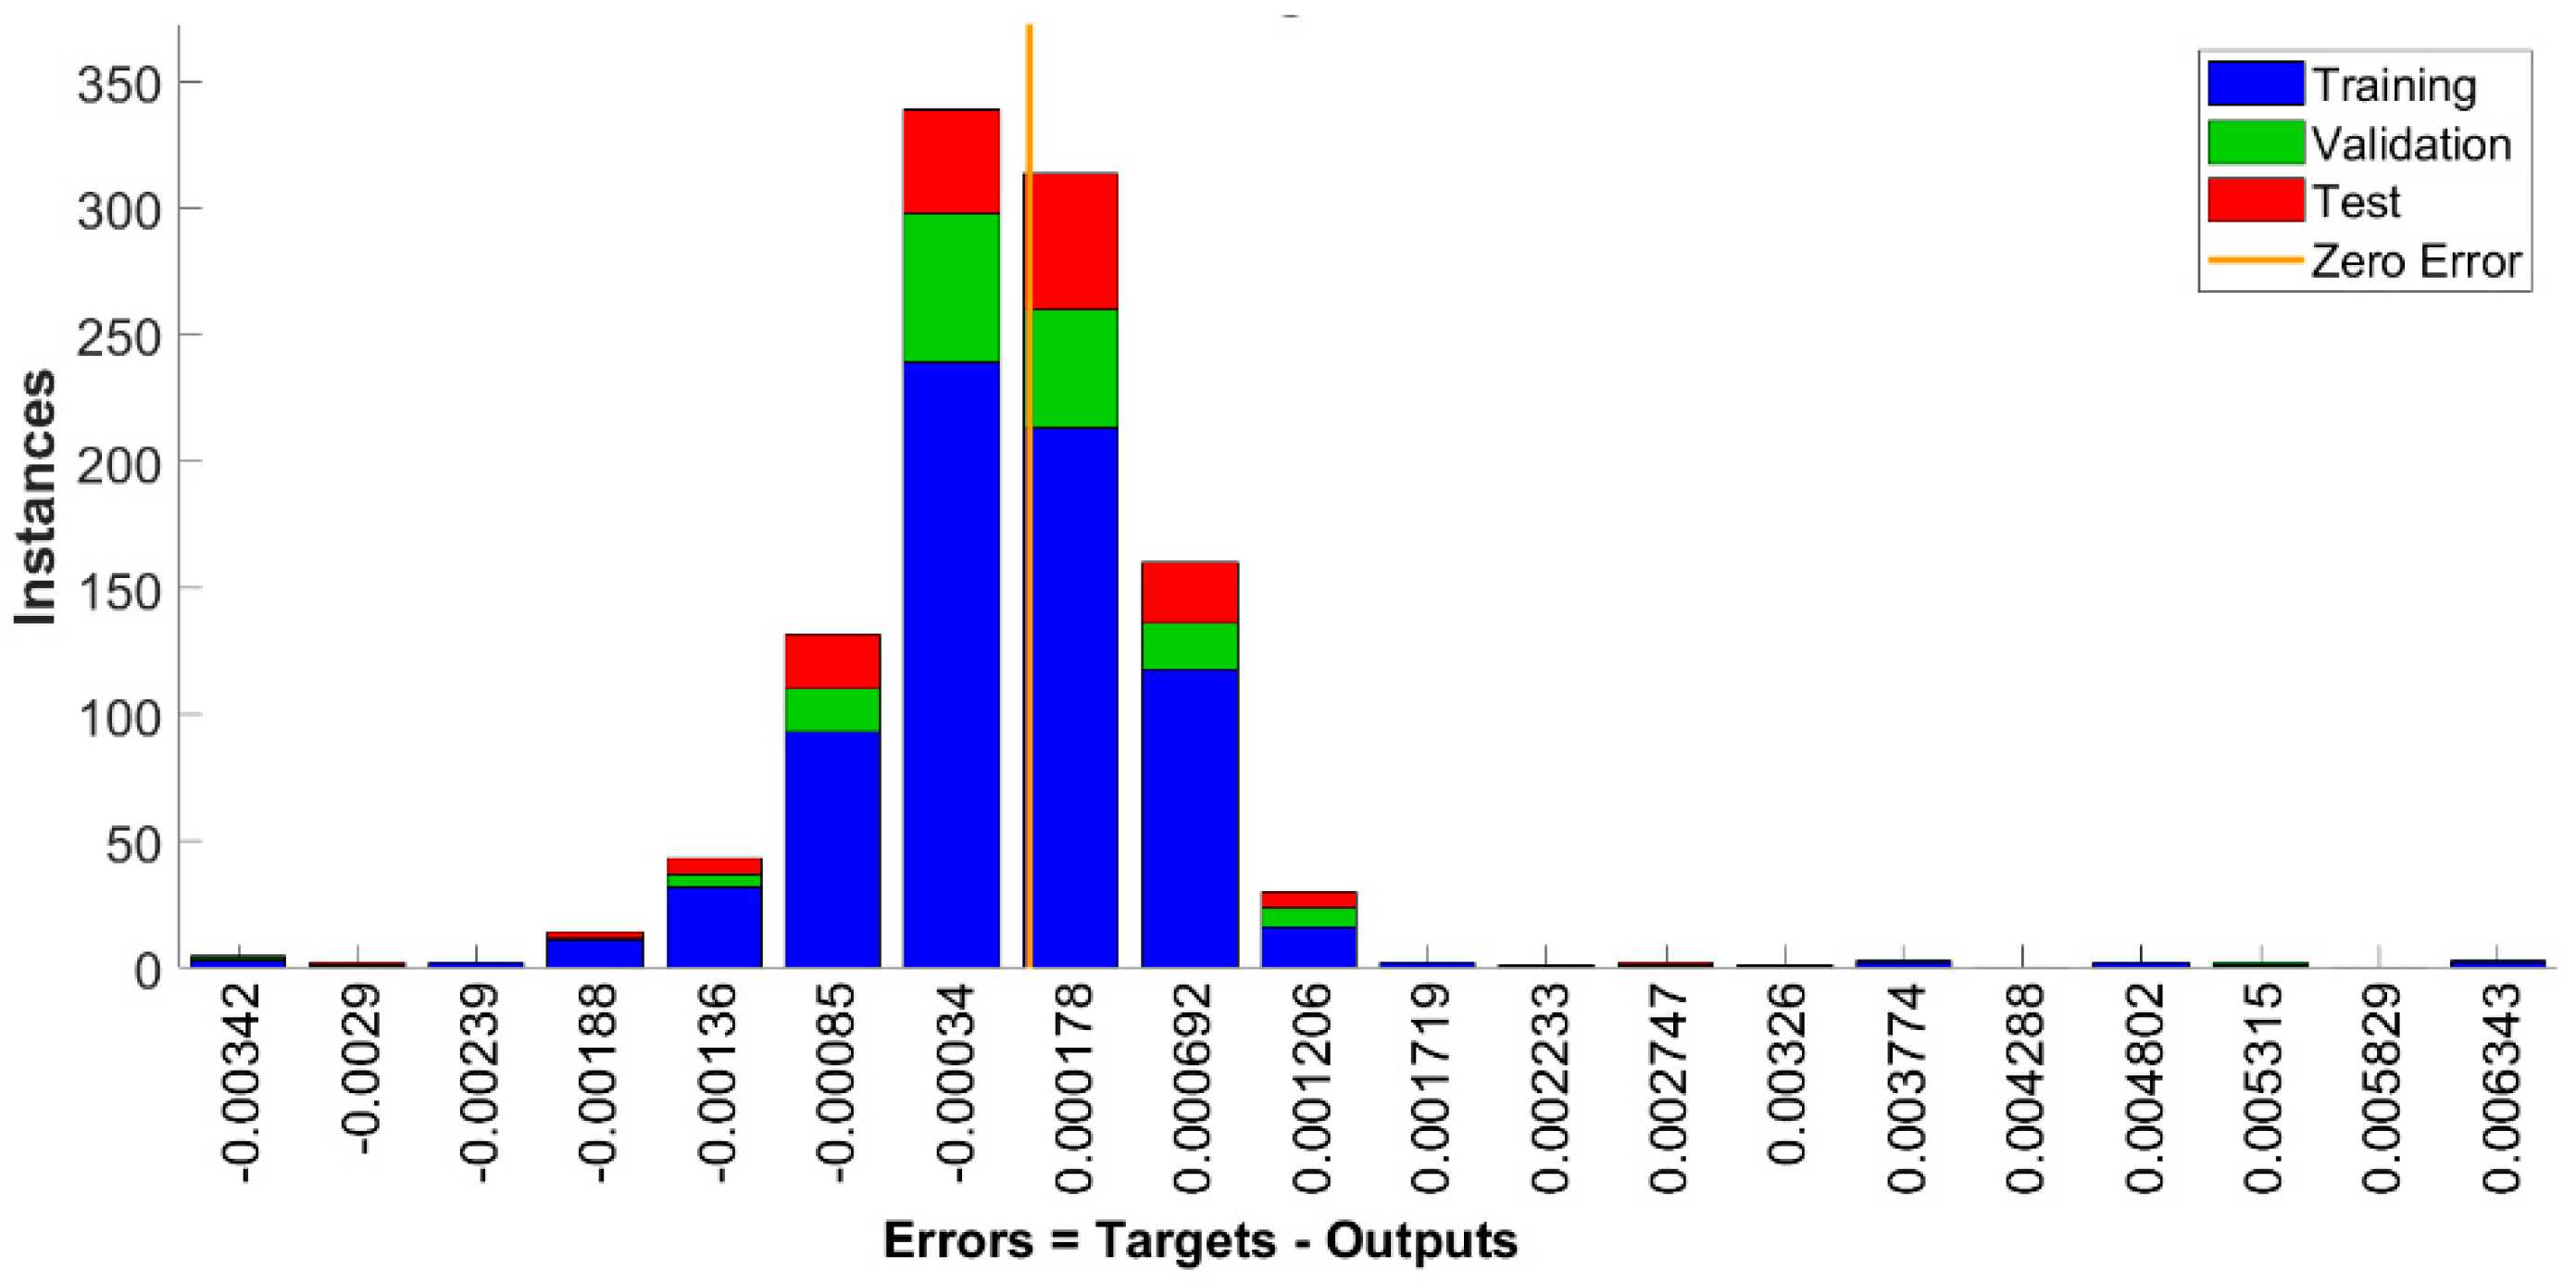
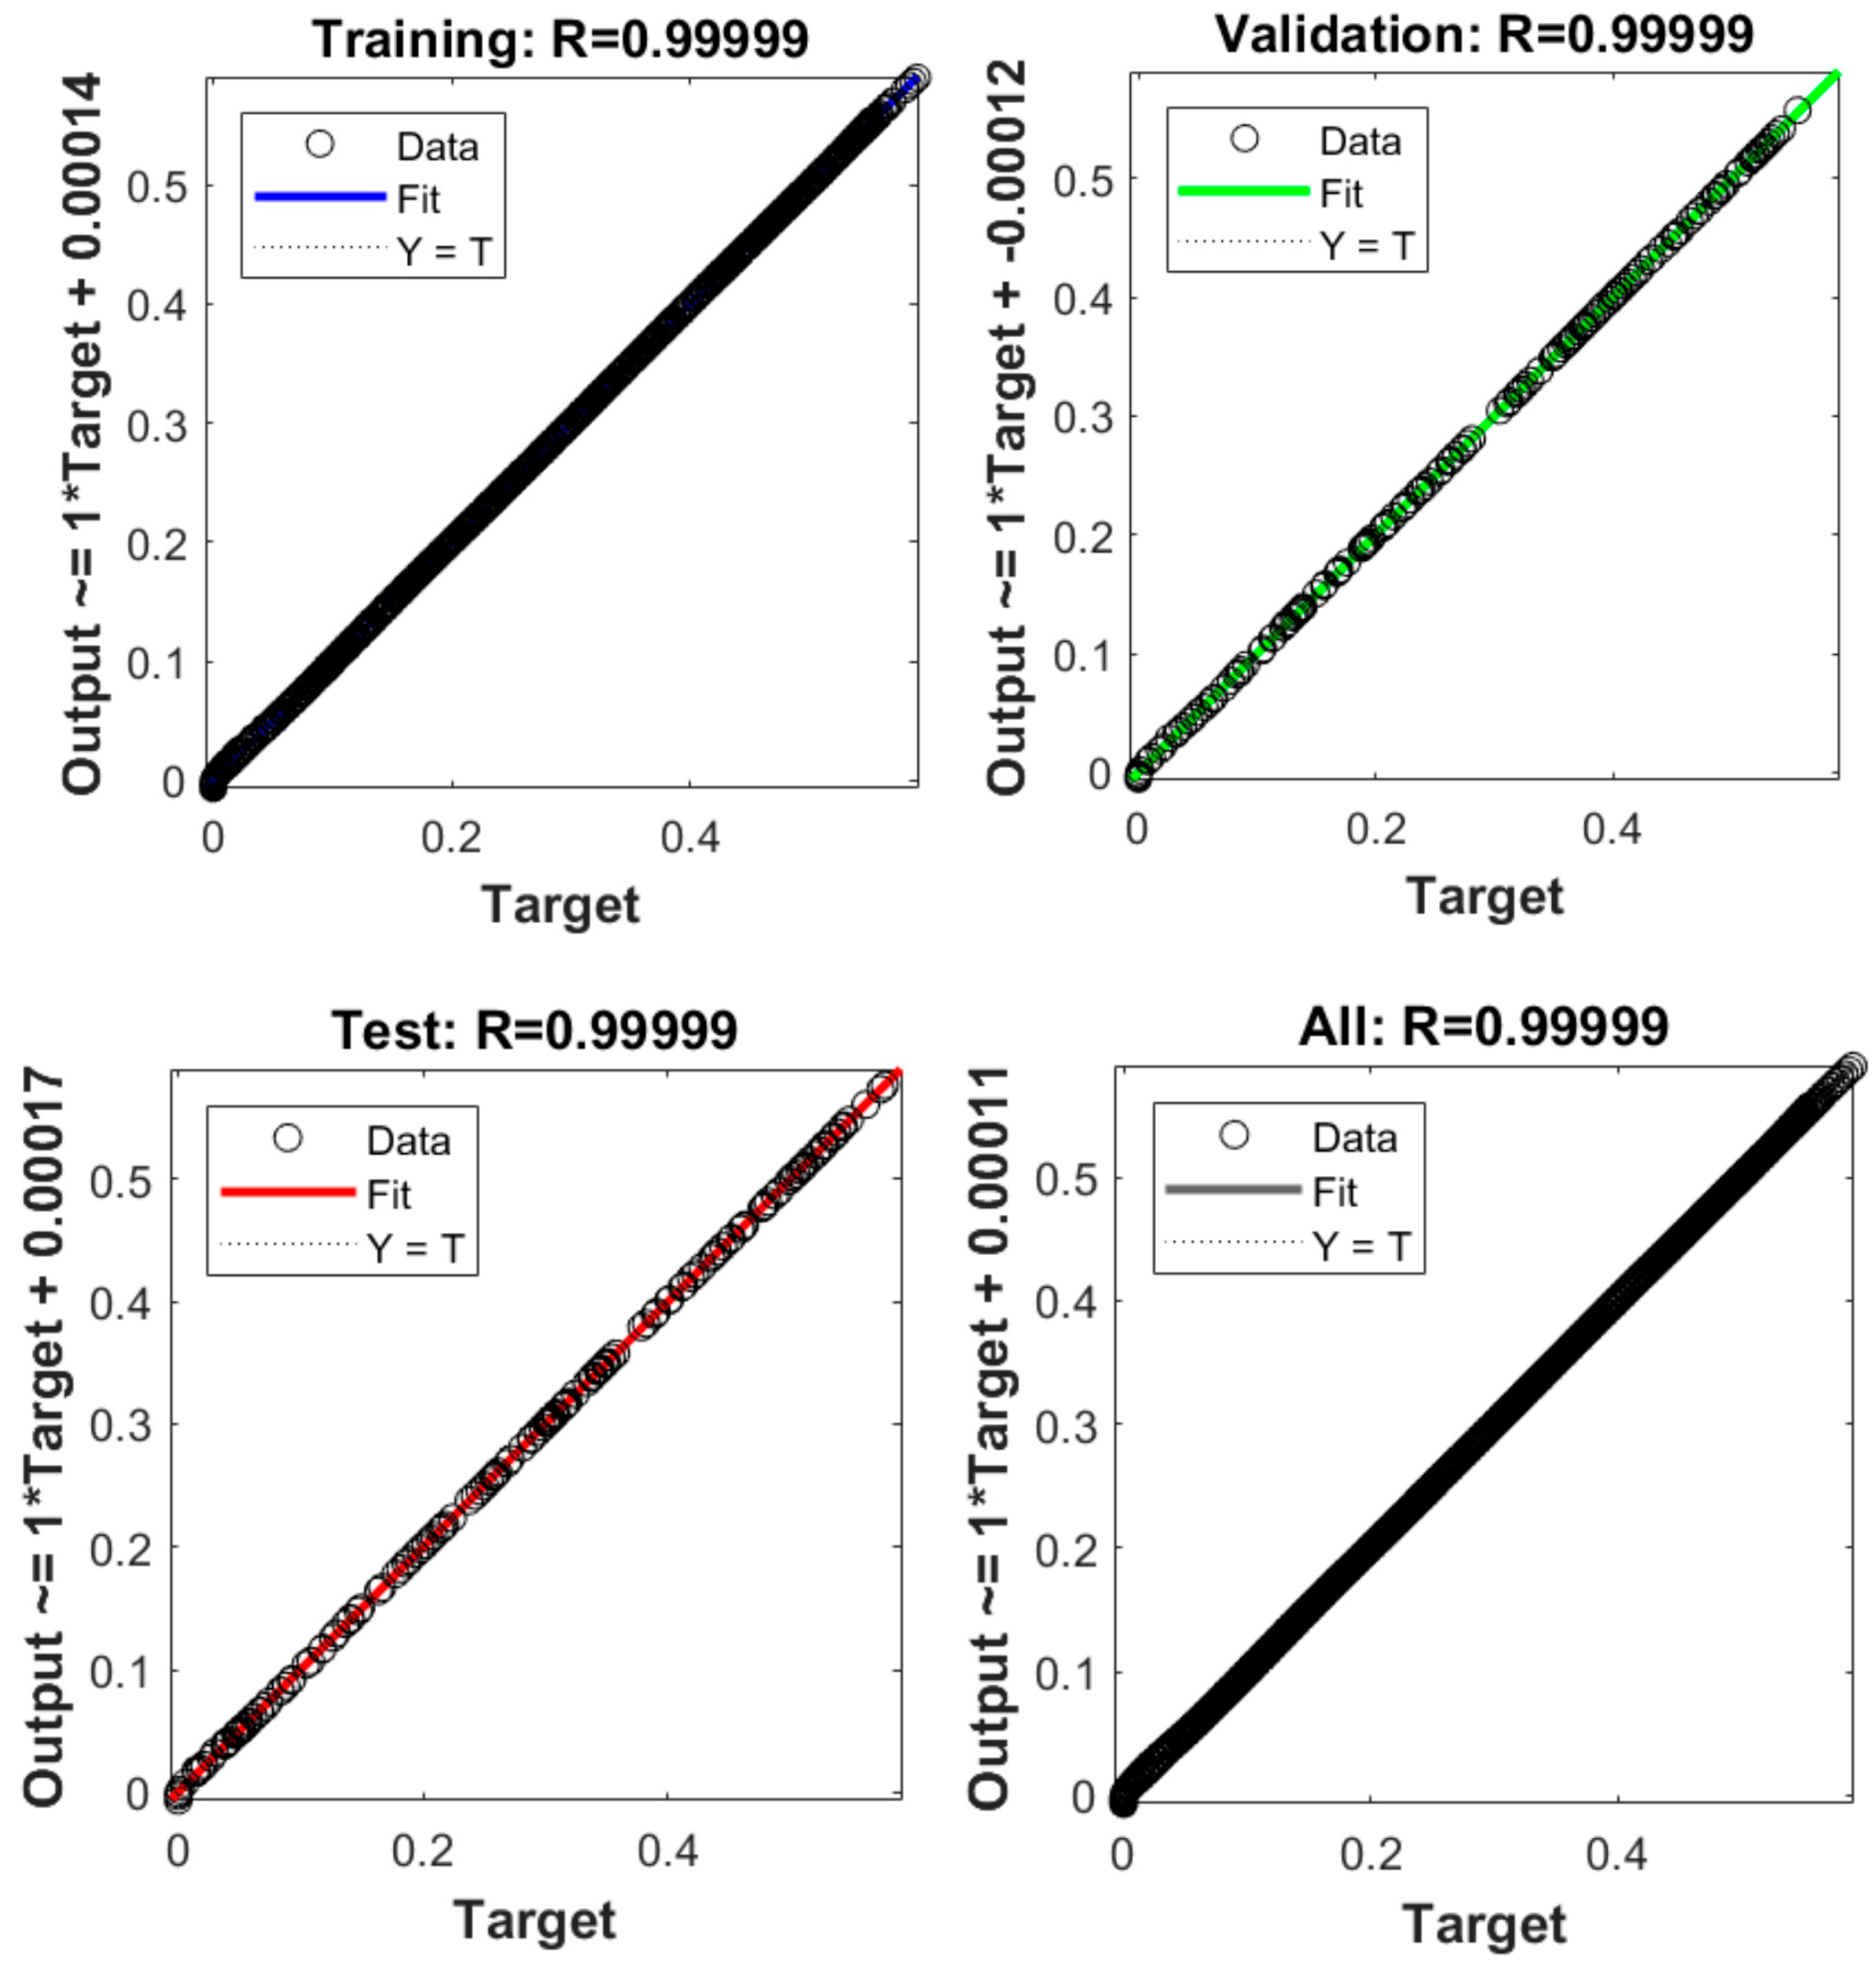
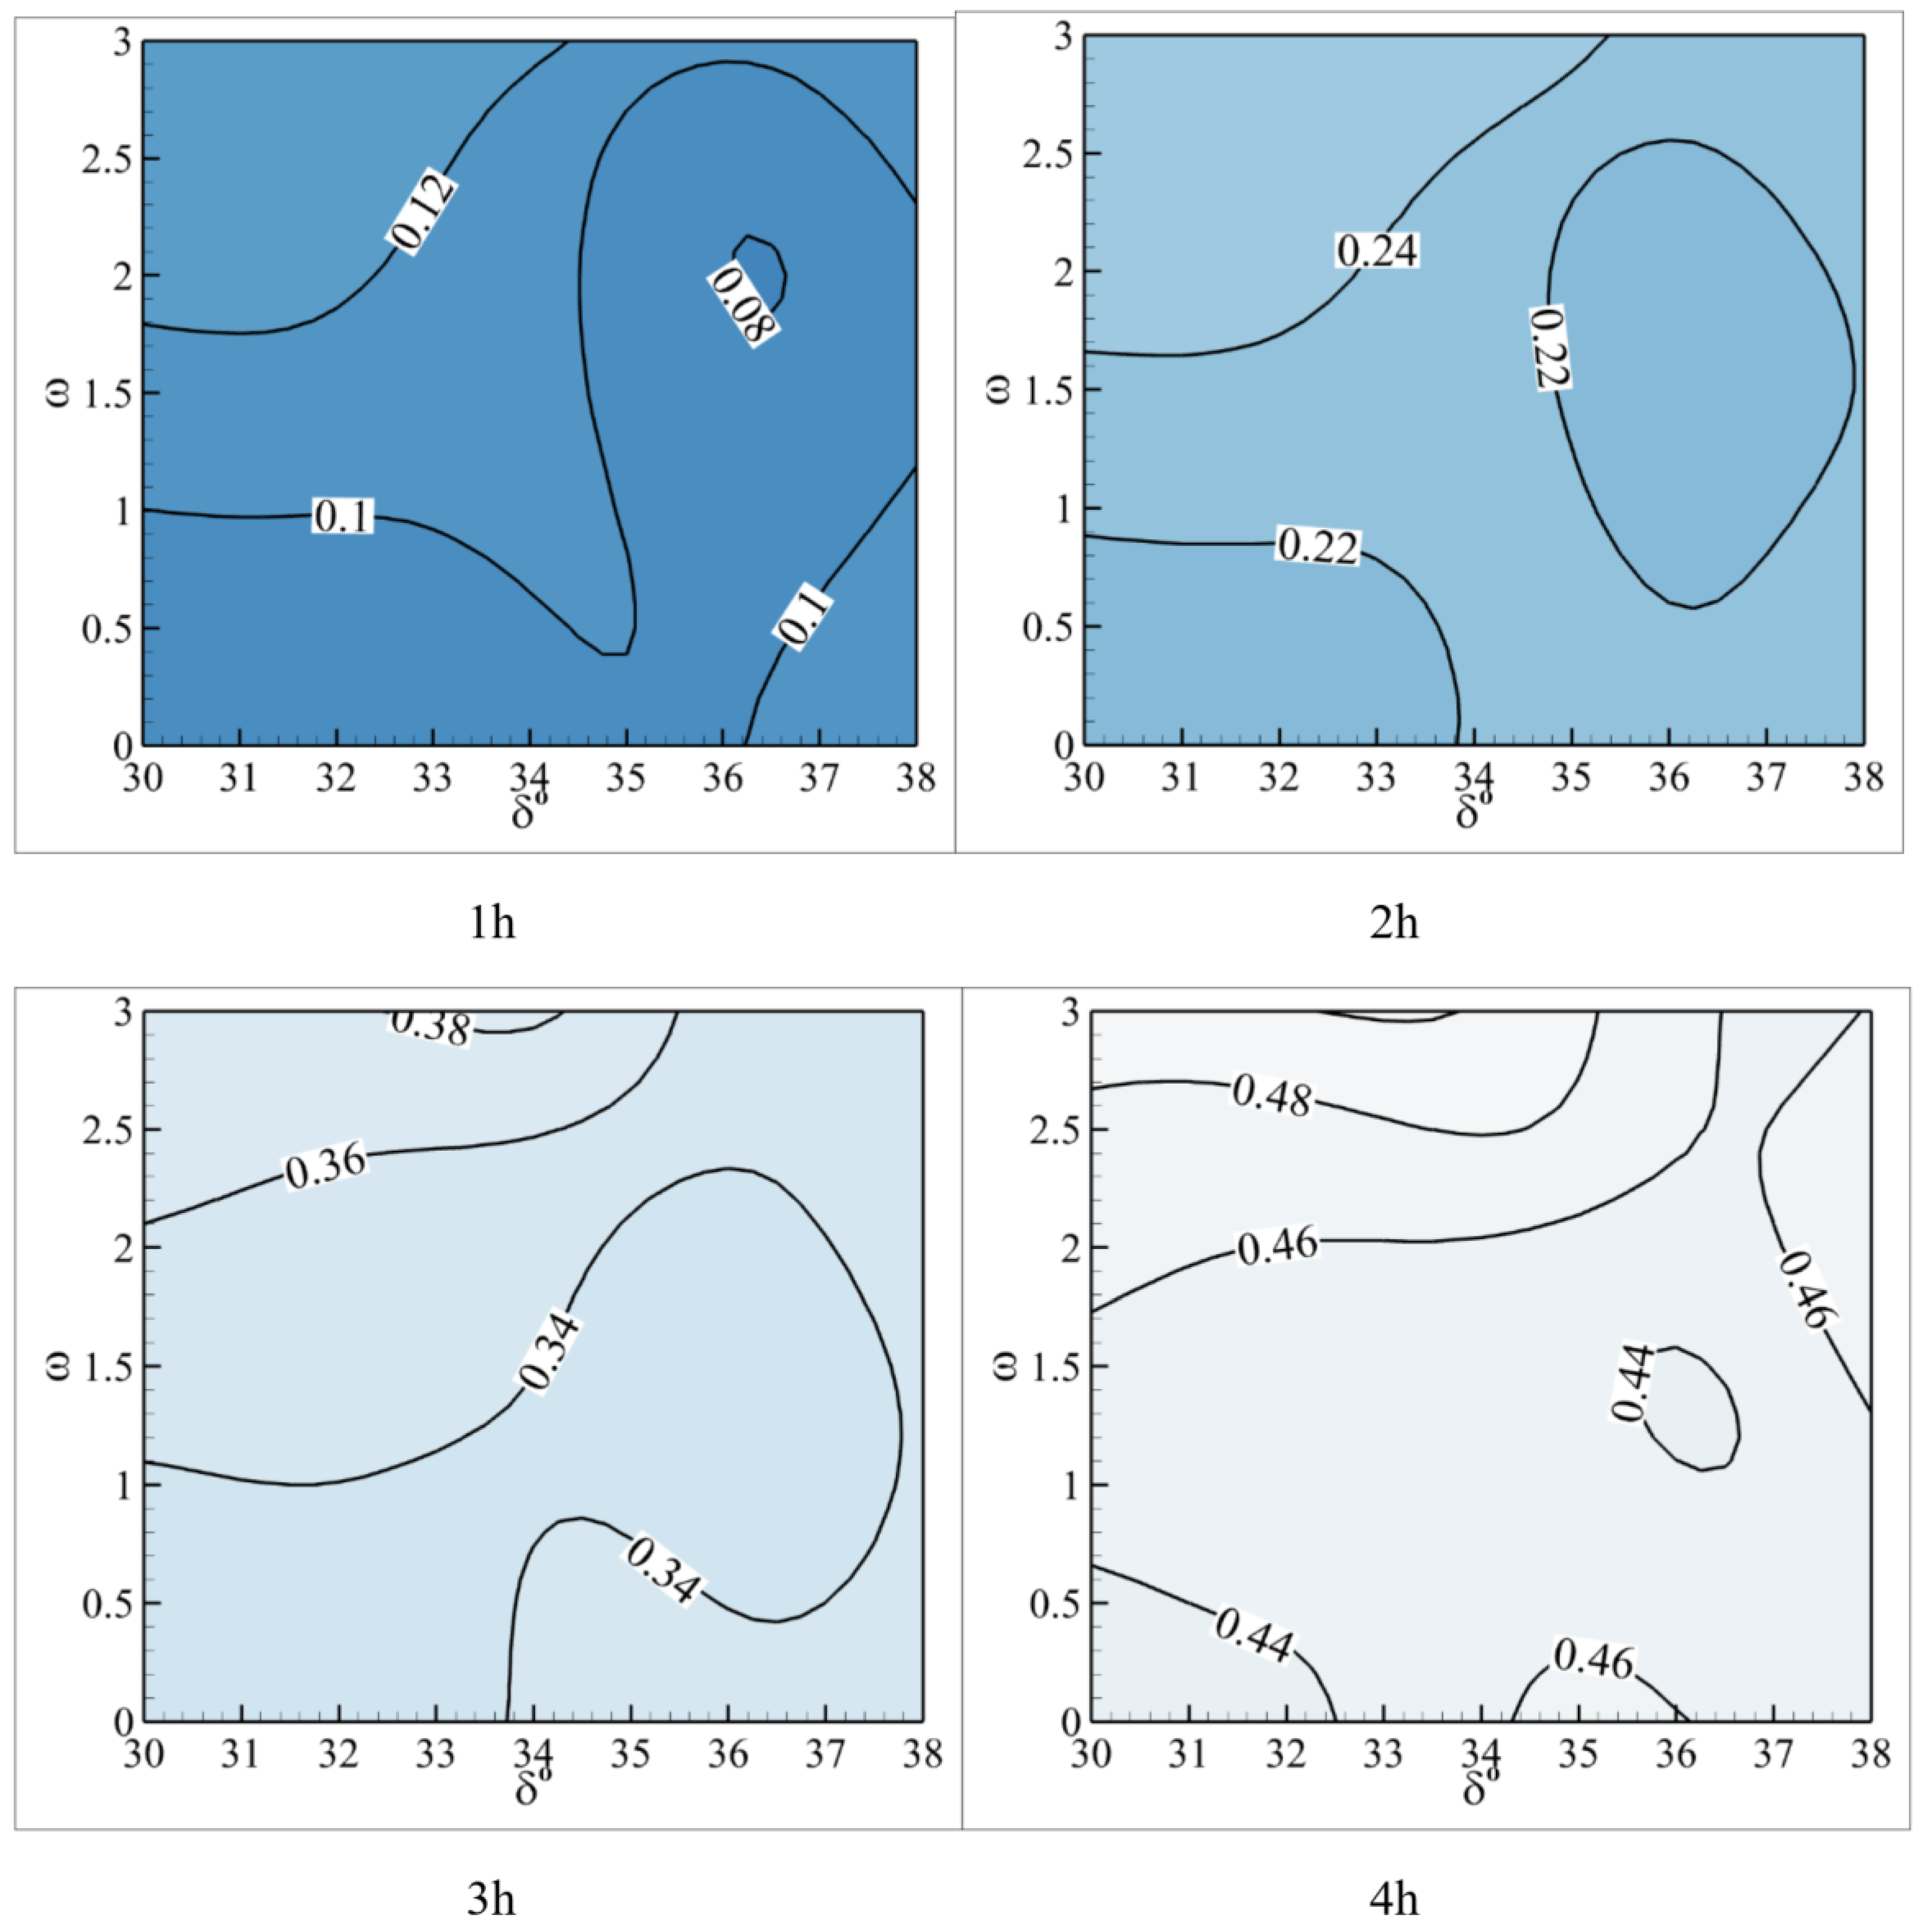
4.3. Neural Network Analysis

The study of complex, intelligent calculations similar to those regularly carried out by the human brain is known as artificial intelligence (AI), and it is a branch of computer science. It encompasses techniques, tools, and systems designed to mimic how people acquire knowledge logically and inductively and use their brains to reason through difficulties. AI advancements fall into two primary groups. The first category includes techniques and programs, such as expert systems, that mimic the human experience and derive conclusions from a set of rules. The second category consists of devices that simulate how the brain functions, including artificial neural networks (ANNs).
Expert systems, also known as knowledge-based systems or the fifth generation of computing, are a development of conventional computing. This knowledge base gives an expert the ability to specify the rules that imitate a thought process and offers a straightforward method for coming to decisions and finding solutions by adhering to a set of rules. Expert systems propose that logical reasoning may be represented by creating lists of logical propositions and applying logical operations to them. Expert systems help address diagnostic problems in medicine and other fields [64,65]. It offers a roadmap for making predictions and decisions in ambiguous and uncertain situations.
ANNs come in a wide variety of forms, some of which are more well-known than others. The feedforward neural networks are well-suitable for mapping simple nonlinear inputs to nonlinear outputs [66].
Here, a feedforward artificial neural network (ANN) with a hidden layer (made of ten neurons), one input layer, and one output layer was adopted. The sensitivity analysis and network structure analysis can be used to select the effective parameters [67,68] and adequate network structure [69]. However, here, the input parameters are clear from the numerical step, and the impact of these design parameters on the storage design is notable.
The ANN maps the physical relationship between the control and target parameters. Three inputs of angles (δ), nanoparticles fractions (ω), and time (t) were considered as the control parameters, whereas the melting volume fraction (MVF) was adopted as the target parameter (output). The computational data were recorded every two mins. A schematic view of the utilized ANN is depicted in Figure 12a. The hyperbolic tangent function was used for the activation function of neurons [70]. A dataset made of 1057 sample data was used to train the ANN using the mean of squared errors (MSE) [71]. All investigated cases in Section 4.1 and Section 4.2 were adopted to make the sample data.
The details of the training setup are reported in Figure 12b. The sample data were randomly divided into 15% test, 15% validation, and 70% train data. Figure 13 shows the performance history for the train, test, and validation data. As seen, epoch 39 provides the best validation data; hence, the ANN after 39 training epochs was adopted for further simulations. Figure 14 provides a histogram for the error distributions. The figure divides the range of the predicted errors into 20 intervals (bins), and it then shows the number of samples for each bin. As seen, the error range for the prediction of MVF is quite small. Most of the samples were placed at the center with an error next to zero. Only a few samples were placed on the edges of the figure with an absolute error of 0.0063 or lower. Finally, Figure 15 depicts the regression data for the training, test, validation, and all cases. The results show an excellent R-value next to unity. There is an excellent match between the target and predicted MVF values. Only a few sample data next to the origin show a slight error. These data are related to the initial melting when the storage unit has strong conduction heat transfer gradients. The initial temperature gradients vanish after a few minutes, and the neural network recovers its full accuracy.
The basis and the weights of the neural network are reported in Table 3. The weights for the input layer to the hidden layer (IW), the weights from the hidden layer to the output (LW), and the basis for the hidden layer and the output layer are summarized in Table 3. Since there are three inputs and ten neurons in the hidden layer, the size of IW is 3 × 10. There are ten neurons in the hidden layer and one output layer. Thus, the size of LW is 10 × 1, and the size of the basis is equal to the neurons in the hidden layer, i.e., ten. There is a basis for the output neuron with a value of 0.20576.
Each numerical experiment takes a long time (see Table 2). Thus, exploring the design space is computationally expensive. Hence, the simulated neural network was used to produce a map of melting behavior as a function of the design parameter of angle (δ) and nanoparticles fraction (ω). In order to produce these maps, the trained ANN was simulated for the angle in the range of 30° to 38° with an interval of 0.25°, whereas the nanoparticles fraction was changed in the range of 0 to 3 with an interval of 0.1. Thus, for each contour, 1023 simulations were performed by the ANNs. The results for each hour are reported in Figure 16. After one hour of the melting process, most melting (MVF = 0.12) occurs for a case with the highest nanoparticles fraction (1.8 < ω < 3) at an angle in the range of 30° < δ < 34°. The lowest melting corresponds to an angle of 36° and a nanoparticles fraction of about 2%. In the second hour of the melting process, the best melting (MVF = 0.24) occurs in the range of 1.7 < ω < 3 and 30° < δ < 34°. Angles higher than 35° are not suitable. For the third hour, the maximum melting (MVF = 0.38) can be observed for the highest nanoparticles fraction (ω ≈ 3) and an angle of δ ≈ 33.5°. A high nanoparticles fraction and low angle provide a fair MVF = 0.36. For high angles and low nanoparticles fractions, the MVF drops to 0.34. For the fourth hour, the maximum MVF = 0.5 takes place for a similar case as the third hour. Thus, it can be concluded that a design with ω ≈ 3 and δ ≈ 33.5° can provide the maximum melting fraction during the whole melting process.

5. Conclusions

The cooling capability and thermal storage of phase change heatsinks were filled by a 1-tetradecanol-GPNs and copper metal foam fins. The heatsink was exposed to a constant heat flux source at its heated surface. The natural convection effects in the liquid NePCM were taken into account. The thermophysical properties of NePCM were adopted directly from the actually measured properties. The finite element method was applied to solve the governing equations. An automatic time step based on BDF was invoked to control the solution accuracy. The melting heat transfer was simulated for different porous fin angles and mass fractions of GPNs. It was found that using fins with large mounding angles (37.5°) is better than close angles (30°). Moreover, the GNPs could increase the surface temperature since they increase the dynamic viscosity and suppress the natural convection flows. A 1.0% wt GPNs could add some advantage in reducing the surface temperature in the middle of the melting process. The presence of GPNs reduces the amount of stored energy per unit weight of the heatsink since these heavy nanoparticles do not contribute to the latent heat thermal energy storage. An ANN was trained to map the relationship between the melt fraction and the design variable. The computed data were used to train the ANN. The results showed that the ANN could accurately estimate the MVF at various times for any set of design variables. Finally, the ANN was used to provide contours of MVF as a function of angle and nanoparticles fractions at different times during the melting process. Using the MVF maps produced by ANN, it was concluded that a design with ω ≈ 3 and δ ≈ 33.5° provided the highest melting fraction during the entire melting process.

Author Contributions

Conceptualization, J.S., M.S., M.F., A.M.S. and M.G.; methodology, J.S., M.S., M.F., A.M.S. and M.G.; software, J.S. and M.G.; validation, M.G.; formal analysis, J.S., M.S., M.F. and M.G., investigation, J.S., M.S., M.F., A.M.S. and M.G.; resources, J.S., M.S., M.F., A.M.S. and M.G.; data curation, M.F. and M.G.; writing—original draft preparation, J.S., M.S., M.F., A.M.S. and M.G.; writing—review and editing, J.S., M.S., M.F., A.M.S. and M.G.; visualization, M.G.; supervision, M.G.; project administration, M.G.; funding acquisition, M.S., M.F. and M.G. All authors have read and agreed to the published version of the manuscript.

Funding

This research was funded by Deanship of Scientific Research at Umm Al-Qura University, who supporting this work through Grant Code: (22UQU4310414DSR04). This research of Mikhail Sheremet and Mohammad Ghalambaz was supported by the Tomsk State University Development Programme (Priority-2030).

Data Availability Statement

Not applicable.

Acknowledgments

The authors would like to thank the Deanship of Scientific Research at Umm Al-Qura University for supporting this work through Grant Code: (22UQU4310414DSR04). This research of Mikhail Sheremet and Mohammad Ghalambaz was supported by the Tomsk State University Development Programme (Priority-2030).

Conflicts of Interest

The authors declare no conflict of interest.

References

  1. Shahsavar, A.; Moradi, K.; Yıldız, Ç.; Farhadi, P.; Arıcı, M. Effect of nanoparticle shape on cooling performance of boehmite-alumina nanofluid in a helical heat sink for laminar and turbulent flow regimes. Int. J. Mech. Sci. 2021, 217, 107045. [Google Scholar] [CrossRef]
  2. Landini, S.; Leworthy, J.; O’Donovan, T.S. A Review of Phase Change Materials for the Thermal Management and Isothermalisation of Lithium-Ion Cells. J. Energy Storage 2019, 25, 100887. [Google Scholar] [CrossRef]
  3. Heyhat, M.M.; Mousavi, S.; Siavashi, M. Battery thermal management with thermal energy storage composites of PCM, metal foam, fin and nanoparticle. J. Energy Storage 2020, 28, 101235. [Google Scholar] [CrossRef]
  4. Ghadbeigi, L.; Day, B.; Lundgren, K.; Sparks, T.D. Cold temperature performance of phase change material based battery thermal management systems. Energy Rep. 2018, 4, 303–307. [Google Scholar] [CrossRef]
  5. Riaz Siddiqui, F.; Tso, C.-Y.; Qiu, H.; Chao, C.Y.H.; Chung Fu, S. Hybrid nanofluid spray cooling performance and its residue surface effects: Toward thermal management of high heat flux devices. Appl. Therm. Eng. 2022, 211, 118454. [Google Scholar] [CrossRef]
  6. Wei, Y.; Agelin-Chaab, M. Development and experimental analysis of a hybrid cooling concept for electric vehicle battery packs. J. Energy Storage 2019, 25, 100906. [Google Scholar] [CrossRef]
  7. Feng, L.; Zhou, S.; Li, Y.; Wang, Y.; Zhao, Q.; Luo, C.; Wang, G.; Yan, K. Experimental investigation of thermal and strain management for lithium-ion battery pack in heat pipe cooling. J. Energy Storage 2018, 16, 84–92. [Google Scholar] [CrossRef]
  8. Jilte, R.D.; Kumar, R.; Ahmadi, M.H.; Chen, L. Battery thermal management system employing phase change material with cell-to-cell air cooling. Appl. Therm. Eng. 2019, 161. [Google Scholar] [CrossRef]
  9. Mousavi, S.; Siavashi, M.; Heyhat, M.M. Numerical melting performance analysis of a cylindrical thermal energy storage unit using nano-enhanced PCM and multiple horizontal fins. Numer. Heat Transf. Part A Appl. 2019, 75, 560–577. [Google Scholar] [CrossRef]
  10. El-Khouly, M.M.; El Bouz, M.A.; Sultan, G.I. Experimental and computational study of using nanofluid for thermal management of electronic chips. J. Energy Storage 2021, 39, 102630. [Google Scholar] [CrossRef]
  11. Selimefendigil, F.; Oztop, H.F.; Chamkha, A.J. Natural convection in a CuO–water nanofluid filled cavity under the effect of an inclined magnetic field and phase change material (PCM) attached to its vertical wall. J. Therm. Anal. Calorim. 2018, 135, 1577–1594. [Google Scholar] [CrossRef]
  12. Selimefendigil, F.; Öztop, H.F. Effects of an inner stationary cylinder having an elastic rod-like extension on the mixed convection of CNT-water nanofluid in a three dimensional vented cavity. Int. J. Heat Mass Transf. 2019, 137, 650–668. [Google Scholar] [CrossRef]
  13. Selimefendigil, F.; Öztop, H.F. Corrugated conductive partition effects on MHD free convection of CNT-water nanofluid in a cavity. Int. J. Heat Mass Transf. 2019, 129, 265–277. [Google Scholar] [CrossRef]
  14. Yang, X.; Wei, P.; Cui, X.; Jin, L.; He, Y.-L. Thermal response of annuli filled with metal foam for thermal energy storage: An experimental study. Appl. Energy 2019, 250, 1457–1467. [Google Scholar] [CrossRef]
  15. Yang, X.; Bai, Q.; Guo, Z.; Niu, Z.; Yang, C.; Jin, L.; Lu, T.J.; Yan, J. Comparison of direct numerical simulation with volume-averaged method on composite phase change materials for thermal energy storage. Appl. Energy 2018, 229, 700–714. [Google Scholar] [CrossRef]
  16. Yang, X.; Yu, J.; Guo, Z.; Jin, L.; He, Y.-L. Role of porous metal foam on the heat transfer enhancement for a thermal energy storage tube. Appl. Energy 2019, 239, 142–156. [Google Scholar] [CrossRef]
  17. Bayrak, F.; Oztop, H.F.; Selimefendigil, F. Effects of different fin parameters on temperature and efficiency for cooling of photovoltaic panels under natural convection. Sol. Energy 2019, 188, 484–494. [Google Scholar] [CrossRef]
  18. Selimefendigil, F.; Öztop, H.F. Forced convection in a branching channel with partly elastic walls and inner L-shaped conductive obstacle under the influence of magnetic field. Int. J. Heat Mass Transf. 2019, 144, 118598. [Google Scholar] [CrossRef]
  19. Wang, Z.; Zhang, H.; Xia, X. Experimental investigation on the thermal behavior of cylindrical battery with composite paraffin and fin structure. Int. J. Heat Mass Transf. 2017, 109, 958–970. [Google Scholar] [CrossRef]
  20. Sushobhan, B.R.; Kar, S.P. Thermal Modeling of Melting of Nano based Phase Change Material for Improvement of Thermal Energy Storage. Energy Procedia 2017, 109, 385–392. [Google Scholar] [CrossRef]
  21. Khodadadi, M.; Sheikholeslami, M. Heat transfer efficiency and electrical performance evaluation of photovoltaic unit under influence of NEPCM. Int. J. Heat Mass Transf. 2022, 183, 122232. [Google Scholar] [CrossRef]
  22. Leong, K.Y.; Abdul Rahman, M.R.; Gurunathan, B.A. Nano-enhanced phase change materials: A review of thermo-physical properties, applications and challenges. J. Energy Storage 2019, 21, 18–31. [Google Scholar] [CrossRef]
  23. Li, Z.-R.; Hu, N.; Liu, J.; Zhang, R.-H.; Fan, L.-W. Revisiting melting heat transfer of nano-enhanced phase change materials (NePCM) in differentially-heated rectangular cavities using thermochromic liquid crystal (TLC) thermography. Int. J. Heat Mass Transf. 2020, 159, 120119. [Google Scholar] [CrossRef]
  24. Li, Z.-R.; Fu, G.-T.; Fan, L.-W. Synergistic effects of nano-enhanced phase change material (NePCM) and fin shape on heat storage performance of a finned shell-and-tube unit: An experimental study. J. Energy Storage 2022, 45, 103772. [Google Scholar] [CrossRef]
  25. Li, D.; Wu, Y.; Liu, C.; Zhang, G.; Arıcı, M. Numerical investigation of thermal and optical performance of window units filled with nanoparticle enhanced PCM. Int. J. Heat Mass Transf. 2018, 125, 1321–1332. [Google Scholar] [CrossRef]
  26. Ho, C.J.; Guo, Y.-W.; Yang, T.-F.; Rashidi, S.; Yan, W.-M. Numerical study on forced convection of water-based suspensions of nanoencapsulated PCM particles/Al2O3 nanoparticles in a mini-channel heat sink. Int. J. Heat Mass Transf. 2020, 157, 119965. [Google Scholar] [CrossRef]
  27. Li, Z.; Shahsavar, A.; Al-Rashed, A.A.A.A.; Talebizadehsardari, P. Effect of porous medium and nanoparticles presences in a counter-current triple-tube composite porous/nano-PCM system. Appl. Therm. Eng. 2020, 167, 114777. [Google Scholar] [CrossRef]
  28. Ji, C.; Qin, Z.; Dubey, S.; Choo, F.H.; Duan, F. Simulation on PCM melting enhancement with double-fin length arrangements in a rectangular enclosure induced by natural convection. Int. J. Heat Mass Transf. 2018, 127, 255–265. [Google Scholar] [CrossRef]
  29. Jmal, I.; Baccar, M. Numerical investigation of PCM solidification in a finned rectangular heat exchanger including natural convection. Int. J. Heat Mass Transf. 2018, 127, 714–727. [Google Scholar] [CrossRef]
  30. Abdi, A.; Martin, V.; Chiu, J.N.W. Numerical investigation of melting in a cavity with vertically oriented fins. Appl. Energy 2019, 235, 1027–1040. [Google Scholar] [CrossRef]
  31. Yazici, M.Y.; Avci, M.; Aydin, O. Combined effects of inclination angle and fin number on thermal performance of a PCM-based heat sink. Appl. Therm. Eng. 2019, 159, 113956. [Google Scholar] [CrossRef]
  32. Nakhchi, M.E.; Esfahani, J.A. Improving the melting performance of PCM thermal energy storage with novel stepped fins. J. Energy Storage 2020, 30, 101424. [Google Scholar] [CrossRef]
  33. Masoumi, H.; Haghighi Khoshkhoo, R. Investigation of melting of nanoparticle-enhanced phase change materials (NePCMs) in a shell-and-tube heat exchanger with longitudinal fins. Heat Mass Transf. 2020, 57, 681–701. [Google Scholar] [CrossRef]
  34. Bahiraei, M.; Mazaheri, N.; Daneshyar, M.R. Employing elliptical pin-fins and nanofluid within a heat sink for cooling of electronic chips regarding energy efficiency perspective. Appl. Therm. Eng. 2021, 183, 116159. [Google Scholar] [CrossRef]
  35. Amani, Y.; Takahashi, A.; Chantrenne, P.; Maruyama, S.; Dancette, S.; Maire, E. Thermal conductivity of highly porous metal foams: Experimental and image based finite element analysis. Int. J. Heat Mass Transf. 2018, 122, 1–10. [Google Scholar] [CrossRef]
  36. Masoumi, H.; Haghighi Khoshkhoo, R.; Mirfendereski, S.M. Experimental and numerical investigation of melting/solidification of nano-enhanced phase change materials in shell & tube thermal energy storage systems. J. Energy Storage 2022, 47, 103561. [Google Scholar] [CrossRef]
  37. Guo, J.; Liu, Z.; Du, Z.; Yu, J.; Yang, X.; Yan, J. Effect of fin-metal foam structure on thermal energy storage: An experimental study. Renew. Energy 2021, 172, 57–70. [Google Scholar] [CrossRef]
  38. Zhang, C.; Yu, M.; Fan, Y.; Zhang, X.; Zhao, Y.; Qiu, L. Numerical study on heat transfer enhancement of PCM using three combined methods based on heat pipe. Energy 2020, 195, 116809. [Google Scholar] [CrossRef]
  39. Joshi, V.; Rathod, M.K. Experimental and numerical assessments of thermal transport in fins and metal foam infused latent heat thermal energy storage systems: A comparative evaluation. Appl. Therm. Eng. 2020, 178, 115518. [Google Scholar] [CrossRef]
  40. Senobar, H.; Aramesh, M.; Shabani, B. Nanoparticles and metal foams for heat transfer enhancement of phase change materials: A comparative experimental study. J. Energy Storage 2020, 32, 101911. [Google Scholar] [CrossRef]
  41. Sheikholeslami, M.; Keshteli, A.N.; Shafee, A. Melting and solidification within an energy storage unit with triangular fin and CuO nano particles. J. Energy Storage 2020, 32, 101716. [Google Scholar] [CrossRef]
  42. Kok, B. Examining effects of special heat transfer fins designed for the melting process of PCM and Nano-PCM. Appl. Therm. Eng. 2020, 170, 114989. [Google Scholar] [CrossRef]
  43. Pássaro, J.; Rebola, A.; Coelho, L.; Conde, J.; Evangelakis, G.A.; Prouskas, C.; Papageorgiou, D.G.; Zisopoulou, A.; Lagaris, I.E. Effect of fins and nanoparticles in the discharge performance of PCM thermal storage system with a multi pass finned tube heat exchange. Appl. Therm. Eng. 2022, 212, 118569. [Google Scholar] [CrossRef]
  44. Ren, Q.; Meng, F.; Guo, P. A comparative study of PCM melting process in a heat pipe-assisted LHTES unit enhanced with nanoparticles and metal foams by immersed boundary-lattice Boltzmann method at pore-scale. Int. J. Heat Mass Transf. 2018, 121, 1214–1228. [Google Scholar] [CrossRef]
  45. Singh, R.P.; Xu, H.; Kaushik, S.C.; Rakshit, D.; Romagnoli, A. Charging performance evaluation of finned conical thermal storage system encapsulated with nano-enhanced phase change material. Appl. Therm. Eng. 2019, 151, 176–190. [Google Scholar] [CrossRef]
  46. Mahdi, J.M.; Mohammed, H.I.; Hashim, E.T.; Talebizadehsardari, P.; Nsofor, E.C. Solidification enhancement with multiple PCMs, cascaded metal foam and nanoparticles in the shell-and-tube energy storage system. Appl. Energy 2020, 257, 113993. [Google Scholar] [CrossRef]
  47. Li, W.Q.; Guo, S.J.; Tan, L.; Liu, L.L.; Ao, W. Heat transfer enhancement of nano-encapsulated phase change material (NEPCM) using metal foam for thermal energy storage. Int. J. Heat Mass Transf. 2021, 166, 120737. [Google Scholar] [CrossRef]
  48. Nield, D.A.; Bejan, A. Convection in Porous Media; Springer: Berlin/Heidelberg, Germany, 2006; Volume 3. [Google Scholar]
  49. Bondareva, N.S.; Buonomo, B.; Manca, O.; Sheremet, M.A. Heat transfer performance of the finned nano-enhanced phase change material system under the inclination influence. Int. J. Heat Mass Transf. 2019, 135, 1063–1072. [Google Scholar] [CrossRef]
  50. Ghalambaz, M.; Mehryan, S.A.M.; Hajjar, A.; Younis, O.; Sheremet, M.A.; Pour, M.S.; Hulme-Smith, C. Phase-Transition Thermal Charging of a Channel-Shape Thermal Energy Storage Unit: Taguchi Optimization Approach and Copper Foam Inserts. Molecules 2021, 26, 1235. [Google Scholar] [CrossRef] [PubMed]
  51. Zhu, Z.-Q.; Liu, M.-J.; Hu, N.; Huang, Y.-K.; Fan, L.-W.; Yu, Z.-T.; Ge, J. Inward solidification heat transfer of nano-enhanced phase change materials in a spherical capsule: An experimental study. J. Heat Transf. 2018, 140, 022301. [Google Scholar] [CrossRef]
  52. Bhattacharya, A.; Calmidi, V.V.; Mahajan, R.L. Thermophysical properties of high porosity metal foams. Int. J. Heat Mass Transf. 2002, 45, 1017–1031. [Google Scholar] [CrossRef]
  53. Xiao, X.; Zhang, P.; Li, M. Preparation and thermal characterization of paraffin/metal foam composite phase change material. Appl. Energy 2013, 112, 1357–1366. [Google Scholar] [CrossRef]
  54. Zienkiewicz, O.C.; Taylor, R.L.; Nithiarasu, P. The Finite Element Method for Fluid Dynamics, 7th ed.; Butterworth-Heinemann: Oxford, UK, 2014. [Google Scholar]
  55. Reddy, J.N.; Gartling, D.K. The Finite Element Method in Heat Transfer and Fluid Dynamics; CRC Press: Boca Raton, FL, USA, 2010. [Google Scholar]
  56. Zienkiewicz, O.C.; Taylor, R.L.; Nithiarasu, P. The Finite Element Method for Fluid Dynamics; Elsevier: Amsterdam, The Netherlands, 2015; Volume 6. [Google Scholar]
  57. Schenk, O.; Gärtner, K. Solving unsymmetric sparse systems of linear equations with PARDISO. Future Gener. Comput. Syst. 2004, 20, 475–487. [Google Scholar] [CrossRef]
  58. Wriggers, P. Nonlinear Finite Element Methods; Springer Science & Business Media: Berlin/Heidelberg, Germany, 2008. [Google Scholar]
  59. Verbosio, F.; De Coninck, A.; Kourounis, D.; Schenk, O. Enhancing the scalability of selected inversion factorization algorithms in genomic prediction. J. Comput. Sci. 2017, 22, 99–108. [Google Scholar] [CrossRef]
  60. Söderlind, G.; Wang, L. Adaptive time-stepping and computational stability. J. Comput. Appl. Math. 2006, 185, 225–243. [Google Scholar] [CrossRef] [Green Version]
  61. Gau, C.; Viskanta, R. Melting and solidification of a pure metal on a vertical wall. Heat Transf. 1986, 108, 174–181. [Google Scholar] [CrossRef]
  62. Brent, A.; Voller, V.R.; Reid, K. Enthalpy-porosity technique for modeling convection-diffusion phase change: Application to the melting of a pure metal. Numer. Heat Transf. Part A Appl. 1988, 13, 297–318. [Google Scholar]
  63. Zheng, H.; Wang, C.; Liu, Q.; Tian, Z.; Fan, X. Thermal performance of copper foam/paraffin composite phase change material. Energy Convers. Manag. 2018, 157, 372–381. [Google Scholar] [CrossRef]
  64. Heckerman, D.E.; Shortliffe, E.H. From certainty factors to belief networks. Artif. Intell. Med. 1992, 4, 35–52. [Google Scholar] [CrossRef]
  65. Jimison, H.B.; Fagan, L.M.; Shachter, R.D.; Shortliffe, E.H. Patient-specific explanation in models of chronic disease. Artif. Intell. Med. 1992, 4, 191–205. [Google Scholar] [CrossRef]
  66. Kolokythas, K.; Argiriou, A. An application of a feedforward neural network model for wind speed predictions. Int. J. Sustain. Energy 2022, 41, 323–340. [Google Scholar] [CrossRef]
  67. Hussain, I.; Bibi, F.; Bhat, S.A.; Sajjad, U.; Sultan, M.; Ali, H.M.; Azam, W.; Kaushal, S.K.; Hussain, S.; Yan, W.-M. Evaluating the parameters affecting the direct and indirect evaporative cooling systems. Eng. Anal. Bound. Elem. 2022, 145, 211–223. [Google Scholar] [CrossRef]
  68. Sajjad, U.; Hussain, I.; Hamid, K.; Ali, H.M.; Wang, C.-C.; Yan, W.-M. Liquid-to-vapor phase change heat transfer evaluation and parameter sensitivity analysis of nanoporous surface coatings. Int. J. Heat Mass Transf. 2022, 194, 123088. [Google Scholar] [CrossRef]
  69. Bhat, S.A.; Huang, N.-F.; Hussain, I.; Bibi, F.; Sajjad, U.; Sultan, M.; Alsubaie, A.S.; Mahmoud, K.H. On the Classification of a Greenhouse Environment for a Rose Crop Based on AI-Based Surrogate Models. Sustainability 2021, 13, 12166. [Google Scholar] [CrossRef]
  70. Rajput, G.; Raut, G.; Chandra, M.; Vishvakarma, S.K. VLSI implementation of transcendental function hyperbolic tangent for deep neural network accelerators. Microprocess. Microsyst. 2021, 84, 104270. [Google Scholar] [CrossRef]
  71. Edalatifar, M.; Tavakoli, M.B.; Ghalambaz, M.; Setoudeh, F. Using deep learning to learn physics of conduction heat transfer. J. Therm. Anal. Calorim. 2021, 146, 1435–1452. [Google Scholar] [CrossRef]
Figure 1. The physical model of the battery and PCM heatsink, and metal foam fins.
Mathematics 11 00356 g001
Figure 2. Mesh sensitivity data for various element sizes.
Mathematics 11 00356 g002
Figure 3. A view of utilized mesh for case Nmesh = 0.25. (a) An overall mesh view, (b) mesh details over the fins and PCM domain, (c) mesh details at the tube wall and metal foam layer, and (d) the mesh details at the fin edge and PCM domain outer wall.
Mathematics 11 00356 g003
Figure 4. The melting interface simulated in the current study and [62] against the experiment of [61].
Mathematics 11 00356 g004
Figure 5. The melting interface shapes simulated in the current study and the experimental reports adapted with permission from Ref. [63]. 2018, Elsevier.
Mathematics 11 00356 g005
Figure 6. The (a) melting volume fraction, (b) surface heat transfer rate, and (c) stored energy as a function of time when ε = 0.95 and ω = 1%.
Mathematics 11 00356 g006
Figure 7. The MVF maps at different time steps for two cases of δ = 30° and δ = 37.5° when ε = 0.95 and ω = 1% wt.
Mathematics 11 00356 g007
Figure 8. The temperature difference distribution (°C), TTf, maps at different time steps for two cases of δ = 30° and δ = 37.5° when ε = 0.95 and ω = 1% wt.
Mathematics 11 00356 g008
Figure 9. The (a) melting volume fraction, (b) surface heat transfer rate, and (c) stored energy as a function of time when ε = 0.95 and δ = 35.
Mathematics 11 00356 g009
Figure 10. The MVF maps at different time steps for two cases of ω = 0 and ω = 3% wt when ε = 0.95 and δ = 35°.
Mathematics 11 00356 g010
Figure 11. The difference distribution (°C) and TTf, maps at different time steps for two cases of ω = 0 and ω = 3% wt when ε = 0.95 and δ = 35°.
Mathematics 11 00356 g011
Figure 12. The structure of the utilized ANN and the applied settings. (a) the structure of the ANN with a hidden layer and input and output layer. (b) the training parameters and convergence criteria.
Mathematics 11 00356 g012
Figure 13. The performance curves during the training process. Epoch 39 provided the best validation performance and was selected for simulations.
Mathematics 11 00356 g013
Figure 14. Error histogram with 20 bins for the training, test, and validations. Error ranges between −0.0034 to +0.0063. Most samples were predicted with a tiny error next to zero. There are only a few samples’ data with an absolute error of about 0.0063.
Mathematics 11 00356 g014
Figure 15. Regression reports for the training, validation, test, and all data. The R-value for each case is reported above each subfigure.
Mathematics 11 00356 g015
Figure 16. Contours of MVF for each melting hour as a function of angle (δ) and nanoparticles fraction (ω).
Mathematics 11 00356 g016
Table 1. Thermophysical features of NePCM-GNPs [51].
Thermophysical Features3 wt%1 wt%0.5 wt%0 wt%Cu Foam
Thermal expansion coefficient, β (1/K)0.0009870.0010080.0010180.001018
Thermal conductivity (solid) W/(m K)0.5400.4510.3500.2528900
Thermal conductivity (liquid) W/(m K)0.3200.2600.1800.159380
Density (solid) kg/m3907.9896.9894.1891.4
Density (liquid) kg/m3837.6826.9824.3821.6
Dynamic viscosity mPa·s194.0159.523.4513.23
Melting point (°C)37373737
Specific heat capacity (solid) J/Kg K1910199020202040386
Specific heat capacity (Liquid) J/Kg K2190230023302360
Latent heat183.5212.2219.5227.8
Table 2. The specification of investigated meshes.
NmeshElementsEdgesMVF @5 hTavg − Tf (°C) @5 hComputational Time (s)
1.12522633550.54112.523321
0.87535984070.54612.545327
0.593356290.55012.625535
0.2534,19011900.54912.5321442
0.125133,26623510.54112.5234907
Table 3. The weights and the basis of the trained neural network.
IWLWBasis
−1.75662−2.87270−1.37869−0.071412.67276
−0.770970.59404−0.38713−0.255460.96215
−3.08972−0.290390.202470.072881.34066
0.06595−0.04451−1.03930−0.821220.02993
−2.844751.695110.645770.02496−0.50272
0.812392.27725−1.819460.016890.32215
0.04182−0.04045−2.86907−0.16864−1.93782
−1.38479−2.23744−0.91333−0.03850−1.95756
0.29314−0.29432−1.85788−0.222292.00081
1.53578−0.675362.608170.004542.74161
Disclaimer/Publisher’s Note: The statements, opinions and data contained in all publications are solely those of the individual author(s) and contributor(s) and not of MDPI and/or the editor(s). MDPI and/or the editor(s) disclaim responsibility for any injury to people or property resulting from any ideas, methods, instructions or products referred to in the content.

