Stock Price Prediction Using CNN-BiLSTM-Attention Model


1
School of Computer Science and Mathematics, Fujian University of Technology, Fuzhou 350108, China
2
Department of Mathematics, Wilfrid Laurier University, Waterloo, ON N2L 3C5, Canada
*
Author to whom correspondence should be addressed.
Mathematics 2023, 11(9), 1985; https://doi.org/10.3390/math11091985
Submission received: 5 March 2023
/
Revised: 13 April 2023
/
Accepted: 19 April 2023
/
Published: 23 April 2023
Abstract
:Accurate stock price prediction has an important role in stock investment. Because stock price data are characterized by high frequency, nonlinearity, and long memory, predicting stock prices precisely is challenging. Various forecasting methods have been proposed, from classical time series methods to machine-learning-based methods, such as random forest (RF), recurrent neural network (RNN), convolutional neural network (CNN), Long Short-Term Memory (LSTM) neural networks and their variants, etc. Each method can reach a certain level of accuracy but also has its limitations. In this paper, a CNN-BiLSTM-Attention-based model is proposed to boost the accuracy of predicting stock prices and indices. First, the temporal features of sequence data are extracted using a convolutional neural network (CNN) and bi-directional long and short-term memory (BiLSTM) network. Then, an attention mechanism is introduced to fit weight assignments to the information features automatically; and finally, the final prediction results are output through the dense layer. The proposed method was first used to predict the price of the Chinese stock index—the CSI300 index and was found to be more accurate than any of the other three methods—LSTM, CNN-LSTM, CNN-LSTM-Attention. In order to investigate whether the proposed model is robustly effective in predicting stock indices, three other stock indices in China and eight international stock indices were selected to test, and the robust effectiveness of the CNN-BiLSTM-Attention model in predicting stock prices was confirmed. Comparing this method with the LSTM, CNN-LSTM, and CNN-LSTM-Attention models, it is found that the accuracy of stock price prediction is highest using the CNN-BiLSTM-Attention model in almost all cases.
1. Introduction
The stock market is an important part of the financial market, and large fluctuations in the stock market can have a large adverse impact on the economy [1]. If stock prices can be predicted more accurately, stock market crashes can be avoided through targeted actions, and the stock market can be guided to operate well, which will eventually lay a more solid foundation for the healthy development of the financial market [2]. As a result, the study of intrinsic value and prediction of the stock market has attracted more and more attention from both scholars and practitioners, and a series of results have been achieved [3].
The stock market is volatile and irregular, and its stock data present complex characteristics such as large data volume, ambiguous information, non-linearity, and non-smoothness. Traditional econometric methods such as autoregressive-moving-average (ARMA), generalized autoregressive conditional heteroskedasticity (GARCH), and others have better prediction effects on less volatile data [4,5,6]. Conventional machine learning algorithms such as Random Forest and Support Vector Machines could be a good choice for learning the nonlinear relationships between stocks and various influencing factors. Still, these methods rely excessively on the selection of samples in the process of model construction, which makes the model construction and updating inflexible, resulting in the prediction accuracy having trouble meeting the forecasting requirements [7,8]. Deep learning models have more powerful learning ability and self-adaptive capability than traditional machine models and can perform better in analyses of stock prices [9].
Long Short-Term Memory (LSTM) neural network is a type of recurrent neural network that can better handle long input sequences while considering stock data’s time series and non-linear nature. It is, therefore, widely used in stock prediction because of its exceptional memory capacity and gate structure, compared with other recurrent neural networks that can only remember short sequences [10]. Moghar and Hamiche propose an LSTM-based recurrent neural network (RNN) model for predicting the opening price trend of GOOGL and NKE, and the test results verified the effectiveness of the model [11]. Vidal and Kristjanpoller proposed a hybrid CNN and LSTM to predict gold price volatility and concluded that the model could adequately extract time series features for high-accuracy prediction. The prediction results are better than those of individual CNN, and LSTM models [12]. Nelson et al. use the LSTM network to predict future trends of stock prices based on historical prices and technical analysis indicators. Experimental results show that this method reaches an average accuracy of 55.9% [13].
BiLSTM, a Bi-directional Long Short-Term Memory, was proposed as an extension of the traditional unidirectional LSTM to further improve model prediction accuracy with its ability to learn bi-directional time series features. Jia et al. use the BiLSTM model to predict GREE stock prices and showed that BiLSTM improved the prediction accuracy over the LSTM model [14]. Wang et al. propose a combined CNN-BiSLSTM model, an improvement of the BiLSTM model, for stock price prediction and compare it with the LSTM model, BiLSTM model, CNN-LSTM model, and CNN-BiLSTM model, and conclude that the proposed model is the best among these models [15].
Attention mechanism in neural networks is a resource allocation scheme to allocate computational resources to more critical tasks while solving the information overload problem in conditions of limited computational power. Cinar et al. propose an extended attention model for RNN. The experimental results showed that the model with RNN could capture the pseudo period in time series. Its extended performance was significantly better than the original [16]. Wang et al. propose a hybrid model based on quadratic decomposition (SD), multifactor analysis (MFA), and attention-based Long Short-Term Memory (ALSTM) to predict stock market price trends in four major Asian countries. The results of the empirical analysis showed that the proposed model could obtain at least 30% higher accuracy compared to the general Long Short-Term Memory, proving the effectiveness of the hybrid model [17].
The current related literature rarely considers both the problem that LSTM short-term stock price prediction models do not enable a closer connection between past and future data and the impact of local characteristics of stock data on the prediction accuracy of the models.
In summary, the main contribution of this paper is proposing a CNN-BiLSTM-Attention model to predict stock prices based on the advantages of BiLSTM’s ability to learn bi-directional temporal features, which improves the accuracy of model prediction and the ability of the attention mechanism to assign weights according to the importance of information used in [18,19,20]. To illustrate the superiority of the proposed model over some frequently used deep learning models, such as RNN, LSTM, CNN-LSTM, CNN-biLSTM models, etc., twelve stock market indices—four from China and eight from international markets—were used as the experimental objects. First, CNN was used to extract the nonlinear local features of stock data. Then, BiLSTM was used to remove the bidirectional time series features of the sequence data. Last, the attention mechanism reduced the impact of redundant information on stock price prediction accuracy by assigning greater weights to the more important feature components through the automatic fitting of weight assignments to the information features extracted by the BiLSTM layer. The test results showed that the proposed model performs the best among all the used models in index prediction.
The rest of the paper is organized as follows. Section 2 presents the description of model structures for the used neural networks. The data and evaluation indicators used in the experiment are unfolded in Section 3. Section 4 displays and explains numerical analysis results. Finally, Section 5 concludes the paper.
2. Model Structure
2.1. Convolutional Neural Network (CNN)
The Convolutional Neural Network (CNN) was proposed by Lecun et al. in 1998 [21]. A CNN consists of five major components: input layer, convolutional layer, pooling layer, fully connected layer, and output layer [22]. The convolutional layer and the pooling layer are the focus of the whole model structure, mainly used to extract features and perform dimensionality reduction on features. With its excellent feature extraction and recognition capabilities, CNN has been successfully applied in classification tasks of image and time series data [23]. This study focused on effective nonlinear local feature extraction for stock data using convolutional layers and feature extraction using pooling layer compression to generate more critical feature information.
2.2. Long Short-Term Memory Networks (LSTM)
Hochreiter and Schmidhuber first proposed Long Short-Term Memory networks (LSTM) in 1997 as a Recurrent Neural Network (RNN) variant [10]. Compared with the traditional RNN, LSTM neural network presents the characteristics suitable for processing and predicting important events with long intervals and delays in time series [24]. LSTM improves the hidden layer structure of RNN by introducing a system of gating units composed of input gates, forgetting gates, and output gates, which effectively alleviates the gradient disappearance and gradient explosion problems in model training. The structure is shown in Figure 1. Among them, the forgetting gate is used to decide which information needs to be removed from the neuron in the model, the input gate is used to update the unit state, and the output gate is used to control the output to the next moment of the neuron [25].
The structure of the LSTM cell is shown in Figure 1. In the figure, and are the outputs of the previous cell and the current cell, respectively. is the inputs of the current unit, Sigmoid and tanh are the activation functions, and the circles in the figure all indicate the arithmetic rules between the vectors. is the state of the neuron at the moment t. is the forgetting threshold, which controls how the cell should discard information through the Sigmoid activation function. is the input threshold that determines the information that needs to be updated by the Sigmoid function, which then generates a new memory using the tanh activation function and ultimately controls how much new information is added to the neuronal state. is the output threshold, which determines the output neuron state of the Sigmoid function, and finally processes the neuron state using the tanh activation function to obtain the final result [26].
2.3. Systemic Risk Prediction Model
The algorithm flow chart of the Savgol-TCN error correction systemic risk prediction method proposed in this paper is shown in Figure 2, and the specific steps are as follows.
where , and are the forgetting gate, the input gate, and the output gate, respectively; and are the weight coefficient matrices corresponding to the forgetting gate, the input gate, and the output gate, respectively; and denote the offset constants corresponding to the forgetting gates, input gates, and output gates, respectively; is the state of the neuron; is the output of the hidden layer; is the Sigmoid function; and ⊗ is the Hadamard product.
2.4. Bidirectional Long Short-Term Memory (BiLSTM) Neural Network
A Bidirectional Long Short-Term Memory (BiLSTM) neural network is an optimized improvement of LSTM [27]. While the traditional LSTM predicts the next moment’s output by past time series information, BiLSTM can fully take into account past and future information by connecting a forward LSTM layer and a backward LSTM layer, which facilitates both forward and backward sequence information input, thus making the model more robust [28]. Therefore, this paper used the BiLSTM neural network to learn the bi-directional serial features from the feature information extracted from the CNN layer, fully exploit the long-term dependent features of the sample data for learning, and finally output the stock price prediction results through the fully linked layer. The BiLSTM structure is shown in Figure 2.
The formulas of each part of BiLSTM are given below.
where , and are the activation functions of their corresponding layers.
2.5. Attention Mechanism
The attention mechanism originated from studies of human vision. Traditional neural networks cannot distinguish the importance of signals in processing information. At the same time, the attention mechanism can assign different weights according to different features, that is, to assign greater weights to critical information and choose to discard unimportant information to improve the efficiency of information processing through differentiated weight assignment and solve the problem of information loss caused by long sequences in LSTM. Therefore, the attention mechanism’s introduction may further improve stock price prediction accuracy.
2.6. CNN-BILSTM-Attention Prediction Model Composition
As pointed out earlier, forecasting stock (or other asset) prices is so crucial that scholars have tried to use various methods for that purpose. There is a lot of room to enhance prediction accuracy, especially with the help of new development in technologies. This paper proposed a stock closing price prediction method based on the CNN-BiLSTM-Attention model. The process of this method can be described as follows.
- Step 1:
- The collected stock data were normalized and divided into training and testing levels.
- Step 2:
- First, the CNN layer was used to extract the internal features of the stock data, and the CNN layer consists of a 2D convolutional layer, a pooling layer, and a dropout layer. Then, the BiLSTM layer was trained on the local features extracted by the CNN to learn the internal dynamic change pattern. An attention mechanism was introduced to automatically assign different weights to the features extracted by the BiLSTM layer to explore the deep temporal correlation. Finally, the output was passed through a dense layer. Its network structure diagram is shown in Figure 3.
- Step 3:
- The prediction results were normalized to obtain the desired values.
Figure 3.
CNN-BiLSTM-Attention neural network.

This paper used the software Paycharm to construct the CNN-BiLSTM-Attention model. The activation function used is ReLU. The loss function used is MSE (Mean_squared_erro) function. The optimizer used is the common Adam optimization algorithm to update the parameters of each layer of the network. The Dropout layer involved helped to prevent the occurrence of overfitting, improved the generalization of the model, and reduced the training time for the model. To verify the model’s effectiveness, the constructed model was also compared with LSTM, CNN-LSTM, and CNN-LSTM-Attention models for prediction performance in this paper.
3. Experiment
3.1. Data Description
This paper selected the data of the CSI 300 Index from 4 January 2011 to 31 December 2021, a total of 2675 trading days for stock price prediction and predicting the closing price. The Shanghai Shenzhen CSI 300 Index is one of China’s most closely followed stock market indices. It includes the 300 A-share stocks traded on the Shanghai and Shenzhen stock exchanges and is seen as indicative of trends in both those markets. The selected features include opening price, highest price, lowest price, closing price, volume, turnover, and return. A direct single-step prediction strategy was used. The ratio of the data used for the training set, test set, and validation set is 6:2:2.
3.2. Data Pre-Processing
There is a large scale between the feature data in this paper. In order to eliminate the influence of the scale between the features, the data set was normalized in this paper. The normalization process is helpful to speed up the convergence of the loss function, prevent the gradient explosion in the network training, and improve computational accuracy. In this paper, the data were normalized to [0, 1] using Min-Max normalization, and the calculation process is shown in Equation (1).
where is the original data, is the normalized value, and are the minimum and maximum values of the original data, respectively. Since the data normalized by the model are also normalized, the output data are denormalized by the flip-flop process. The calculation formula is shown in (2).
where is the normalized stock price forecast. is the actual stock price forecast value obtained after denormalization.
3.3. Evaluation Indicators
This paper used three evaluation indicators, Mean Absolute Percentage Error (MAPE), Root Mean Square Error (RMSE), and coefficient of determination , to evaluate the model prediction performance. They are calculated by Equations (3)–(5), respectively.
where , , and are the predicted stock value, the real stock value, and the average forecast value at i time, respectively, and n represents the total number of test samples. A smaller value of MAPE or RMSE represents a more accurate stock price prediction, while takes values in the range of , and in general, the closer the value of to 1, the better the model fits.
4. Analysis of Results
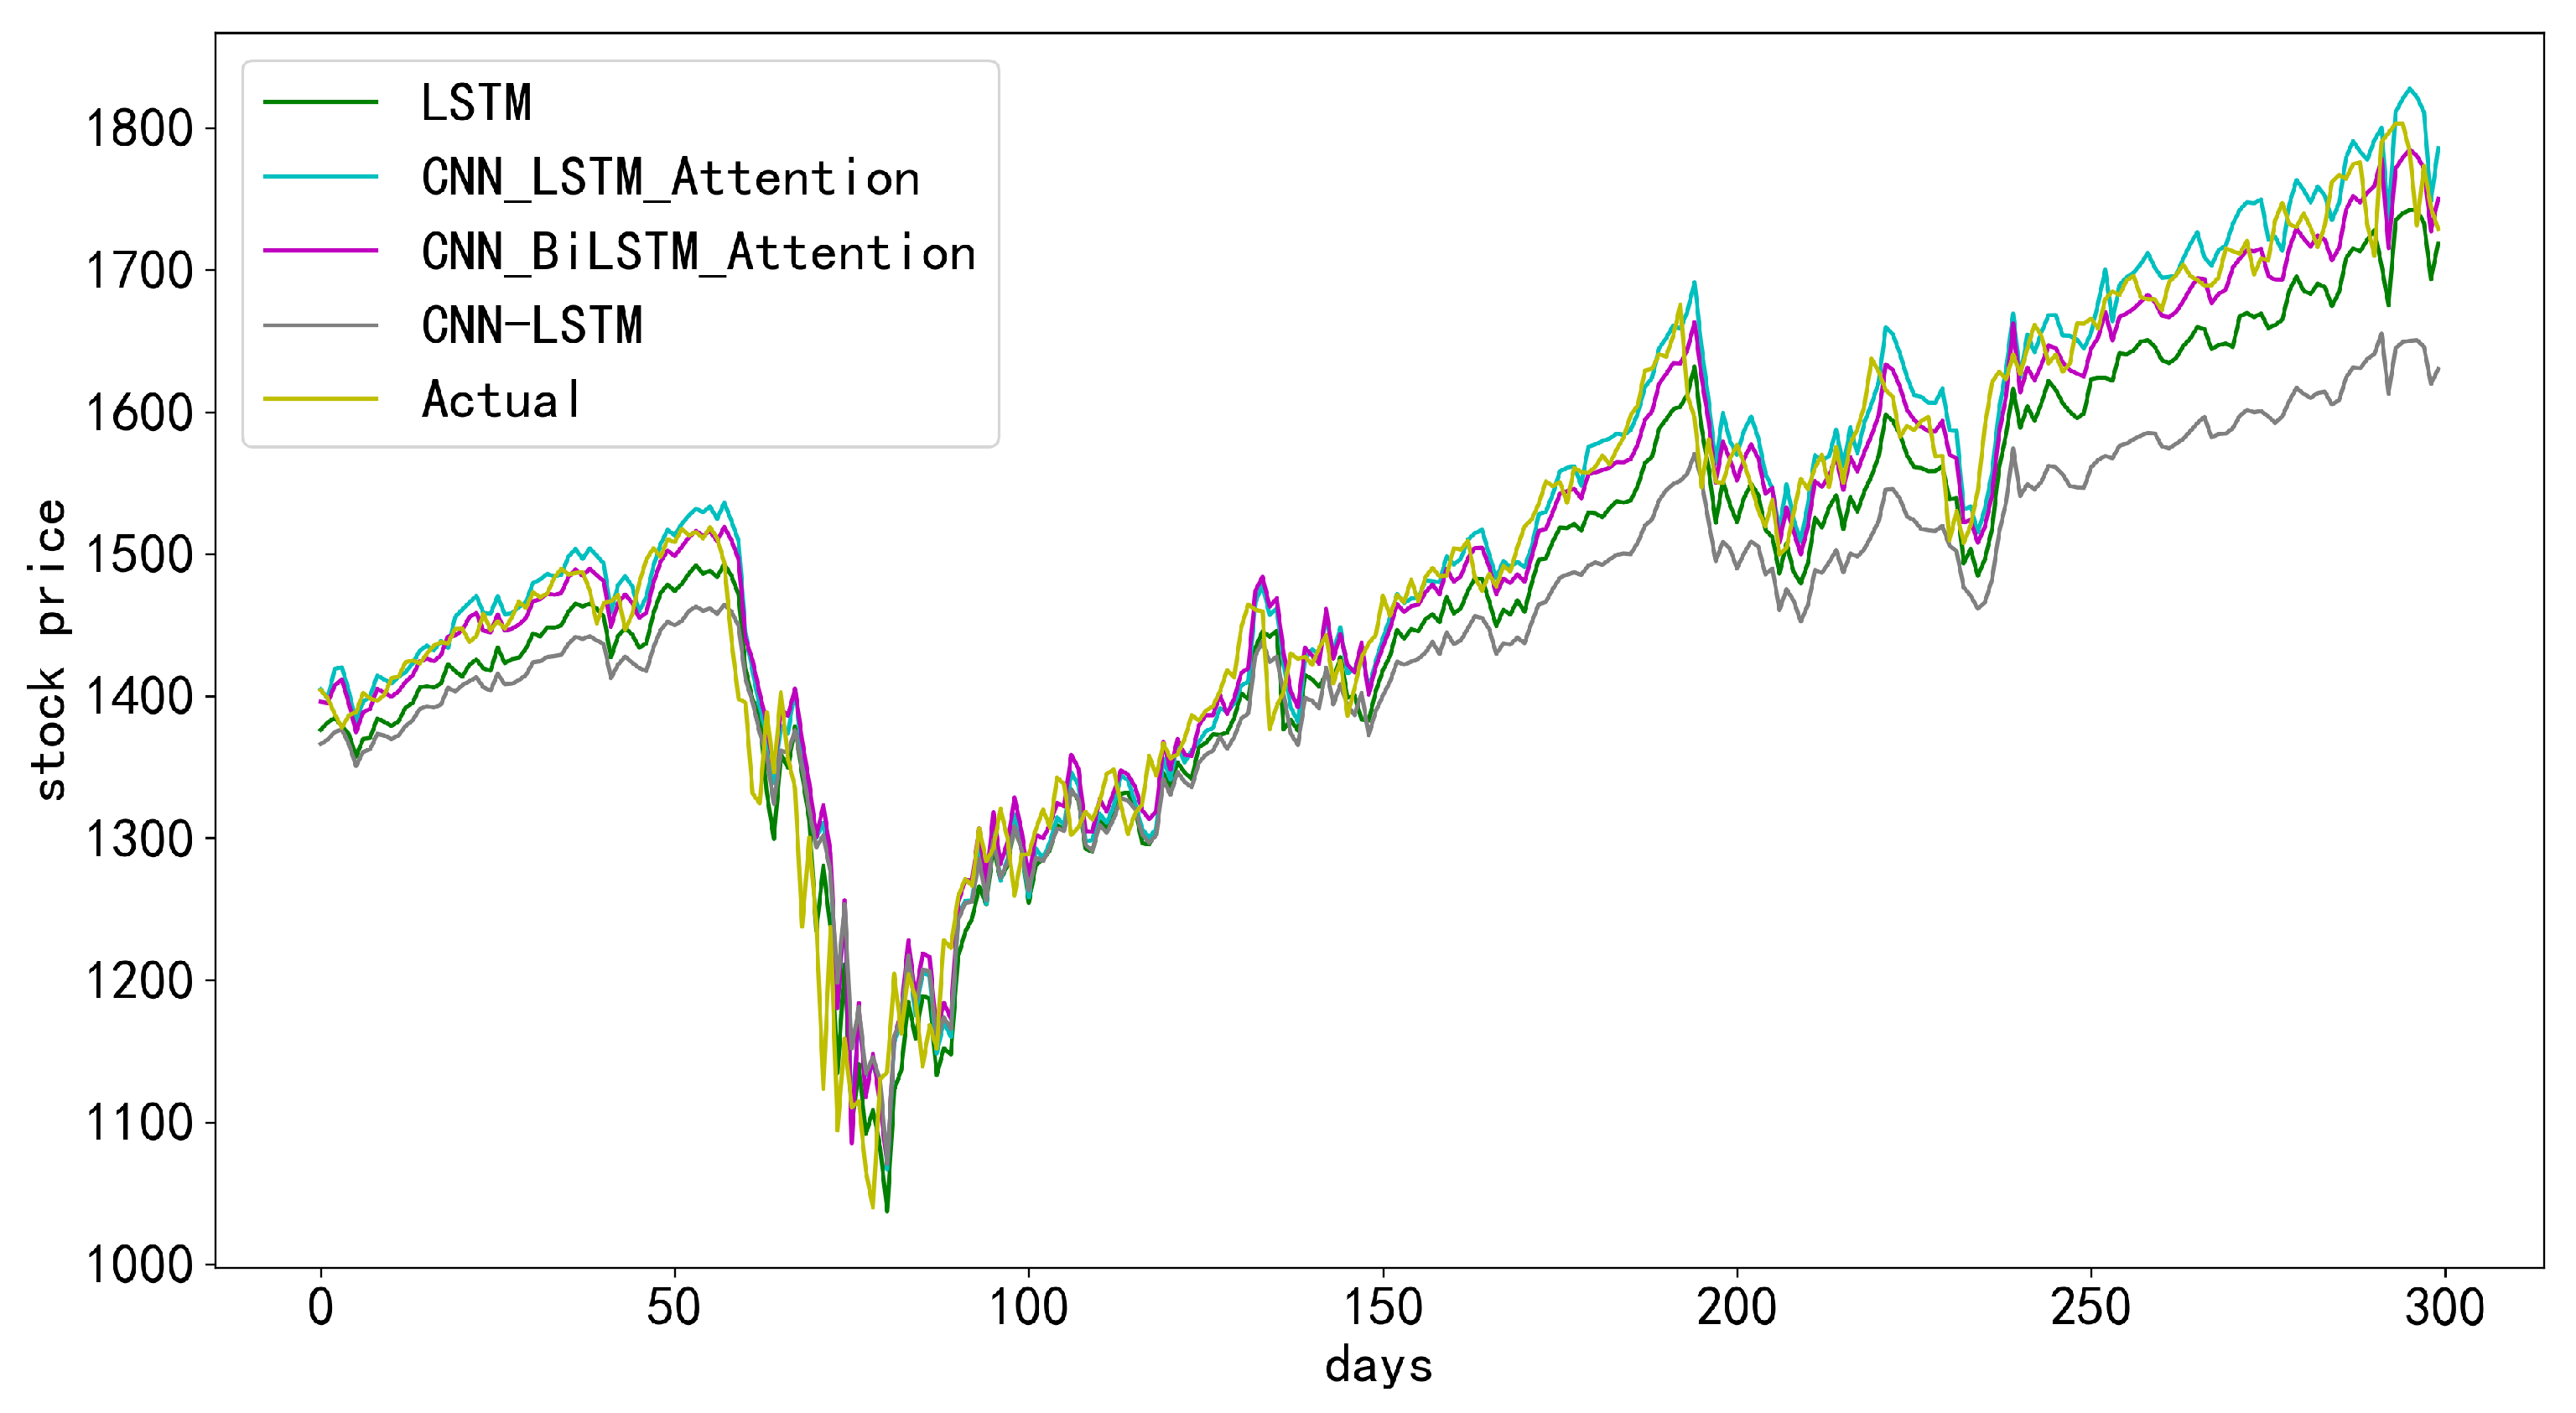
To further verify the superiority of the CNN-BiLSTM-Attention model proposed in this paper for short-term stock price prediction, the LSTM model, CNN-LSTM model, and CNN-LSTM-Attention model were selected as the comparative models for analyses. The prediction results are shown in Figure 4, Figure 5, Figure 6 and Figure 7. The horizontal axis represents the number of days, the vertical axis represents the stock prices, the solid orange line is the actual stock closing price, and the solid blue line is the predicted stock closing price with the corresponding model. In each of the figures, the closer the two curves, the better the model. As one can observe, the curve of the predicted results of the CNN-BiLSTM-Attention model is closest to the curve of the actual data in general. That is, the CNN-BiLSTM-Attention model is the most accurate among these four models for the prediction of CSI 300 with the selected range of data.
Compared with the prediction results of the other three models, it can be seen that the CNN-BiLSTM-Attention model had higher accuracy in predicting stock closing prices, and the predicted values matched the changes in the actual values. Its prediction curve was similar to the proper value curve. Both LSTM and CNN-LSTM models had the phenomenon of “discontinuity” in the prediction of closing indices and CNN-LSTM-Attention. However, the prediction accuracy of the CNN-LSTM-Attention was improved compared with the previous two models; the prediction results were not as good as the CNN-BiLSTM-Attention model. In general, the single LSTM model had the least satisfied prediction effect, and the CNN-LSTM model, stock price prediction effect, was not as good as it was with the attention mechanism added because the attention mechanism enables the model to obtain the critical features with essential effects on the prediction results from a large number of features that significantly impact prediction results. The CNN-BiLSTM-Attention achieved the best prediction effect, probably because the bi-directional LSTM model fully uses the relationship between the forward and backward time dimensions on the time series, which can obtain more feature information and thus improve the prediction accuracy of the model.
The above comparisons with figures are very intuitive but also quite rough. To quantify the comparison of prediction results, the values of the three quantities calculated by Equations (3)–(5) for the four models with the index are shown in Table 1, where the best result among the models is in boldface (similarly for other tables).
From Table 1, it can be seen that the prediction accuracy ordered from high to low is the CNN-BiLSTM-Attention model, CNN-LSTM-Attention model, CNN-LSTM model, and LSTM model, respectively. The RMSE of the CNN-BiLSTM-Attention model to predict the closing price of the CSI 300 Index is 64.84, which is lower than single LSTM, CNN-LSTM, and CNN-LSTM-Attention by 43.9, 24.2, and 11.606, respectively. In terms of MAPE, the CNN-BiLSTM-Attention model, compared with the LSTM model, CNN-LSTM model, and CNN-LSTM-Attention model, reduced by 0.854%, 0.459%, and 0.265%, respectively, further quantitatively verifying the rationality and effectiveness of the CNN-LSTM-Attention model proposed in this paper.
5. Model Robust Analysis
To further verify the accuracy and robustness of the model proposed in this paper, the CNN-BiLSTM-Attention model and three other models will be used to predict the closing prices of the Chinese and international stock market indices to obtain the test errors. The Chinese index is selected as the SSE A-share index, SSE Composite index, and SZSI constituent index, and the international index is chosen as AEX (Amsterdam Exchange index), ATX (Austrian Traded Index), FCHI (CAC 40 Index), FTSE (Financial Times Stock Exchange 100 Index), HSI (Hang Seng Index), JKSE (Jakarta Stock Exchange), KLSE (Kuala Lumpur Stock Exchange), and OEX (S&P 100).
5.1. Model Robust Analysis Based on Chinese Market Indices
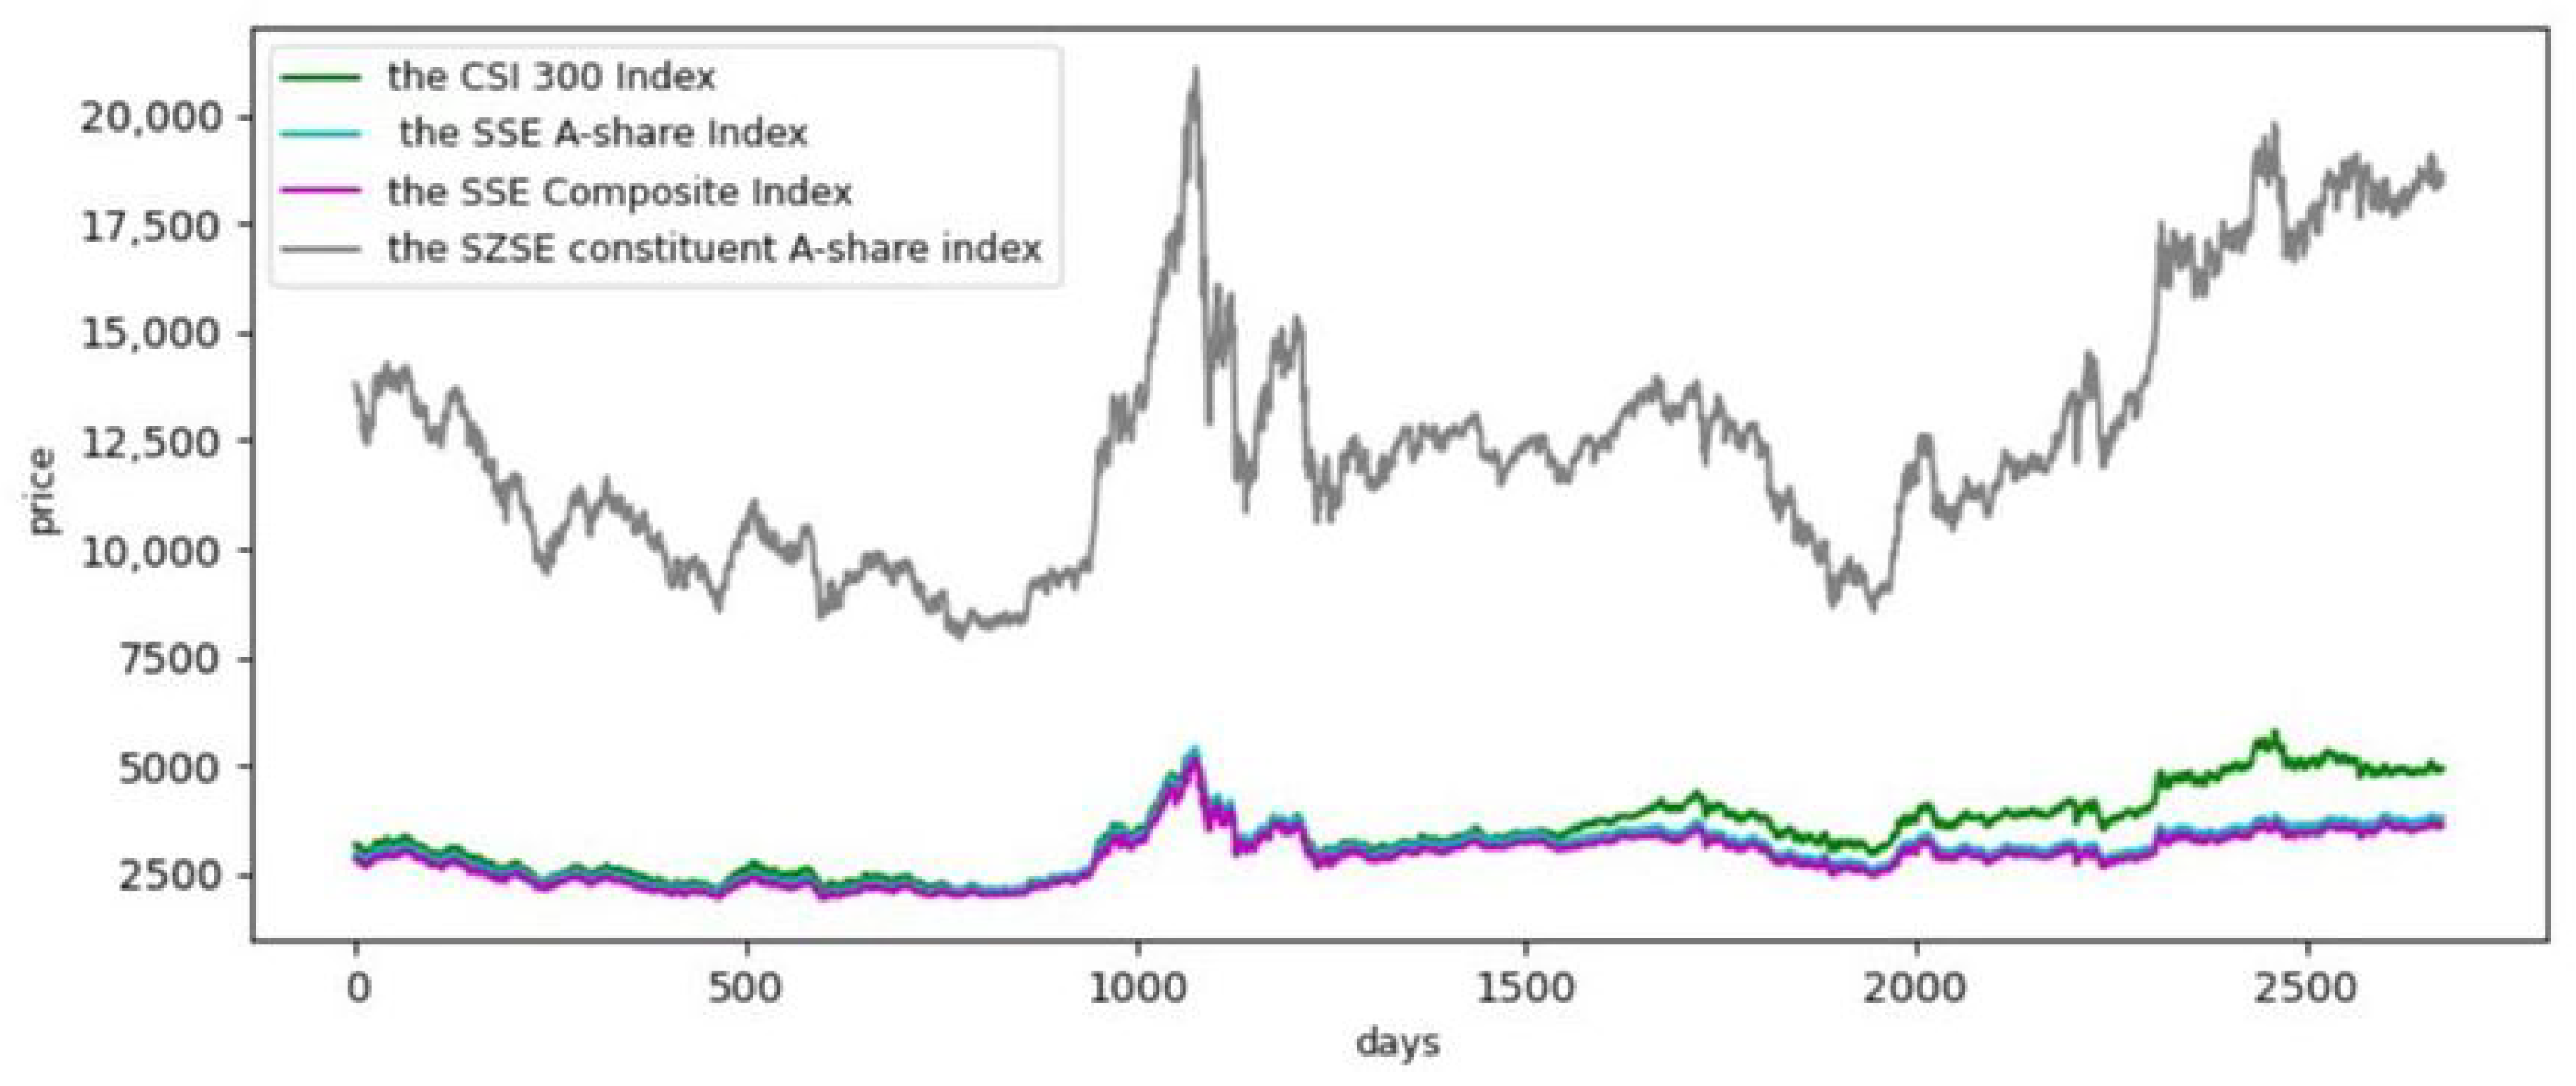
The data were selected for stock price prediction from 4 January 2011 to 31 December 2021 (at the time when the project was started), for a total of 2675 trading days; the closing price trends of the stock indices are shown in Figure 8.
The figure shows that the four selected stock indices generally have similar trends, especially the SSE A-share Index, SSE Composite Index, and CSI 300 Index. The normalization would eliminate the effect of the magnitude, and the hyperparameters used in the prediction would remain unchanged.
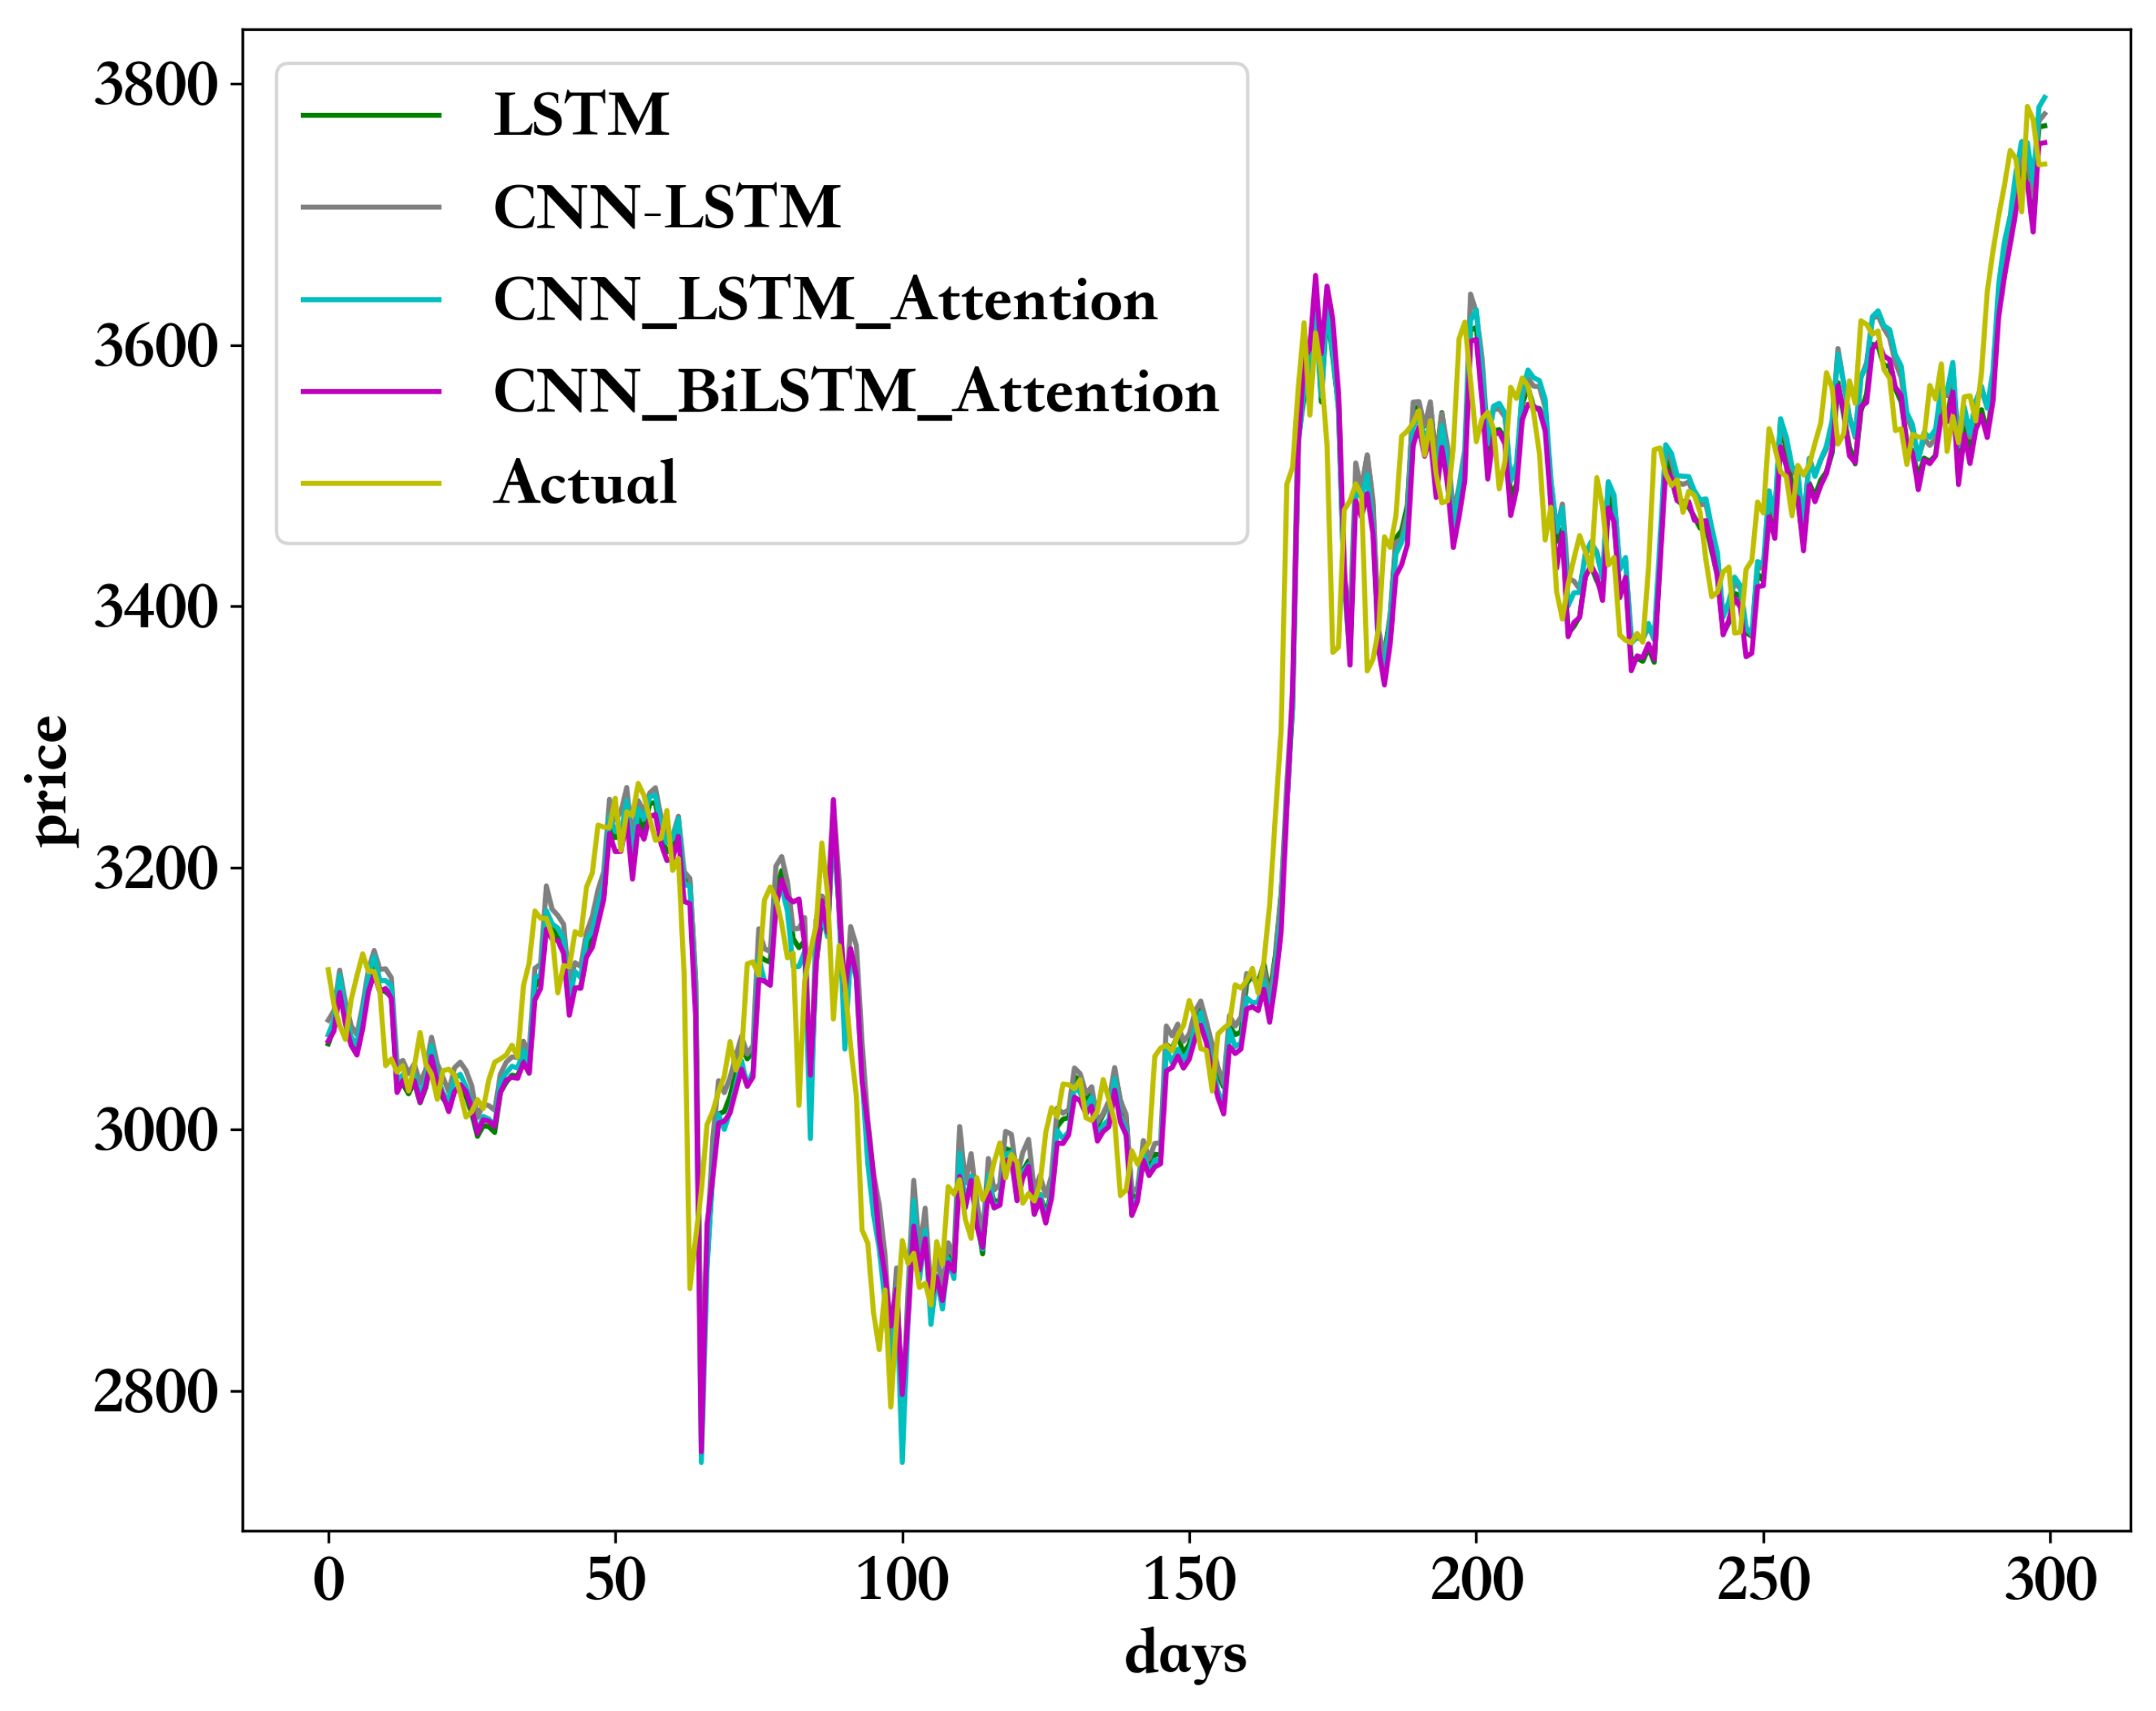
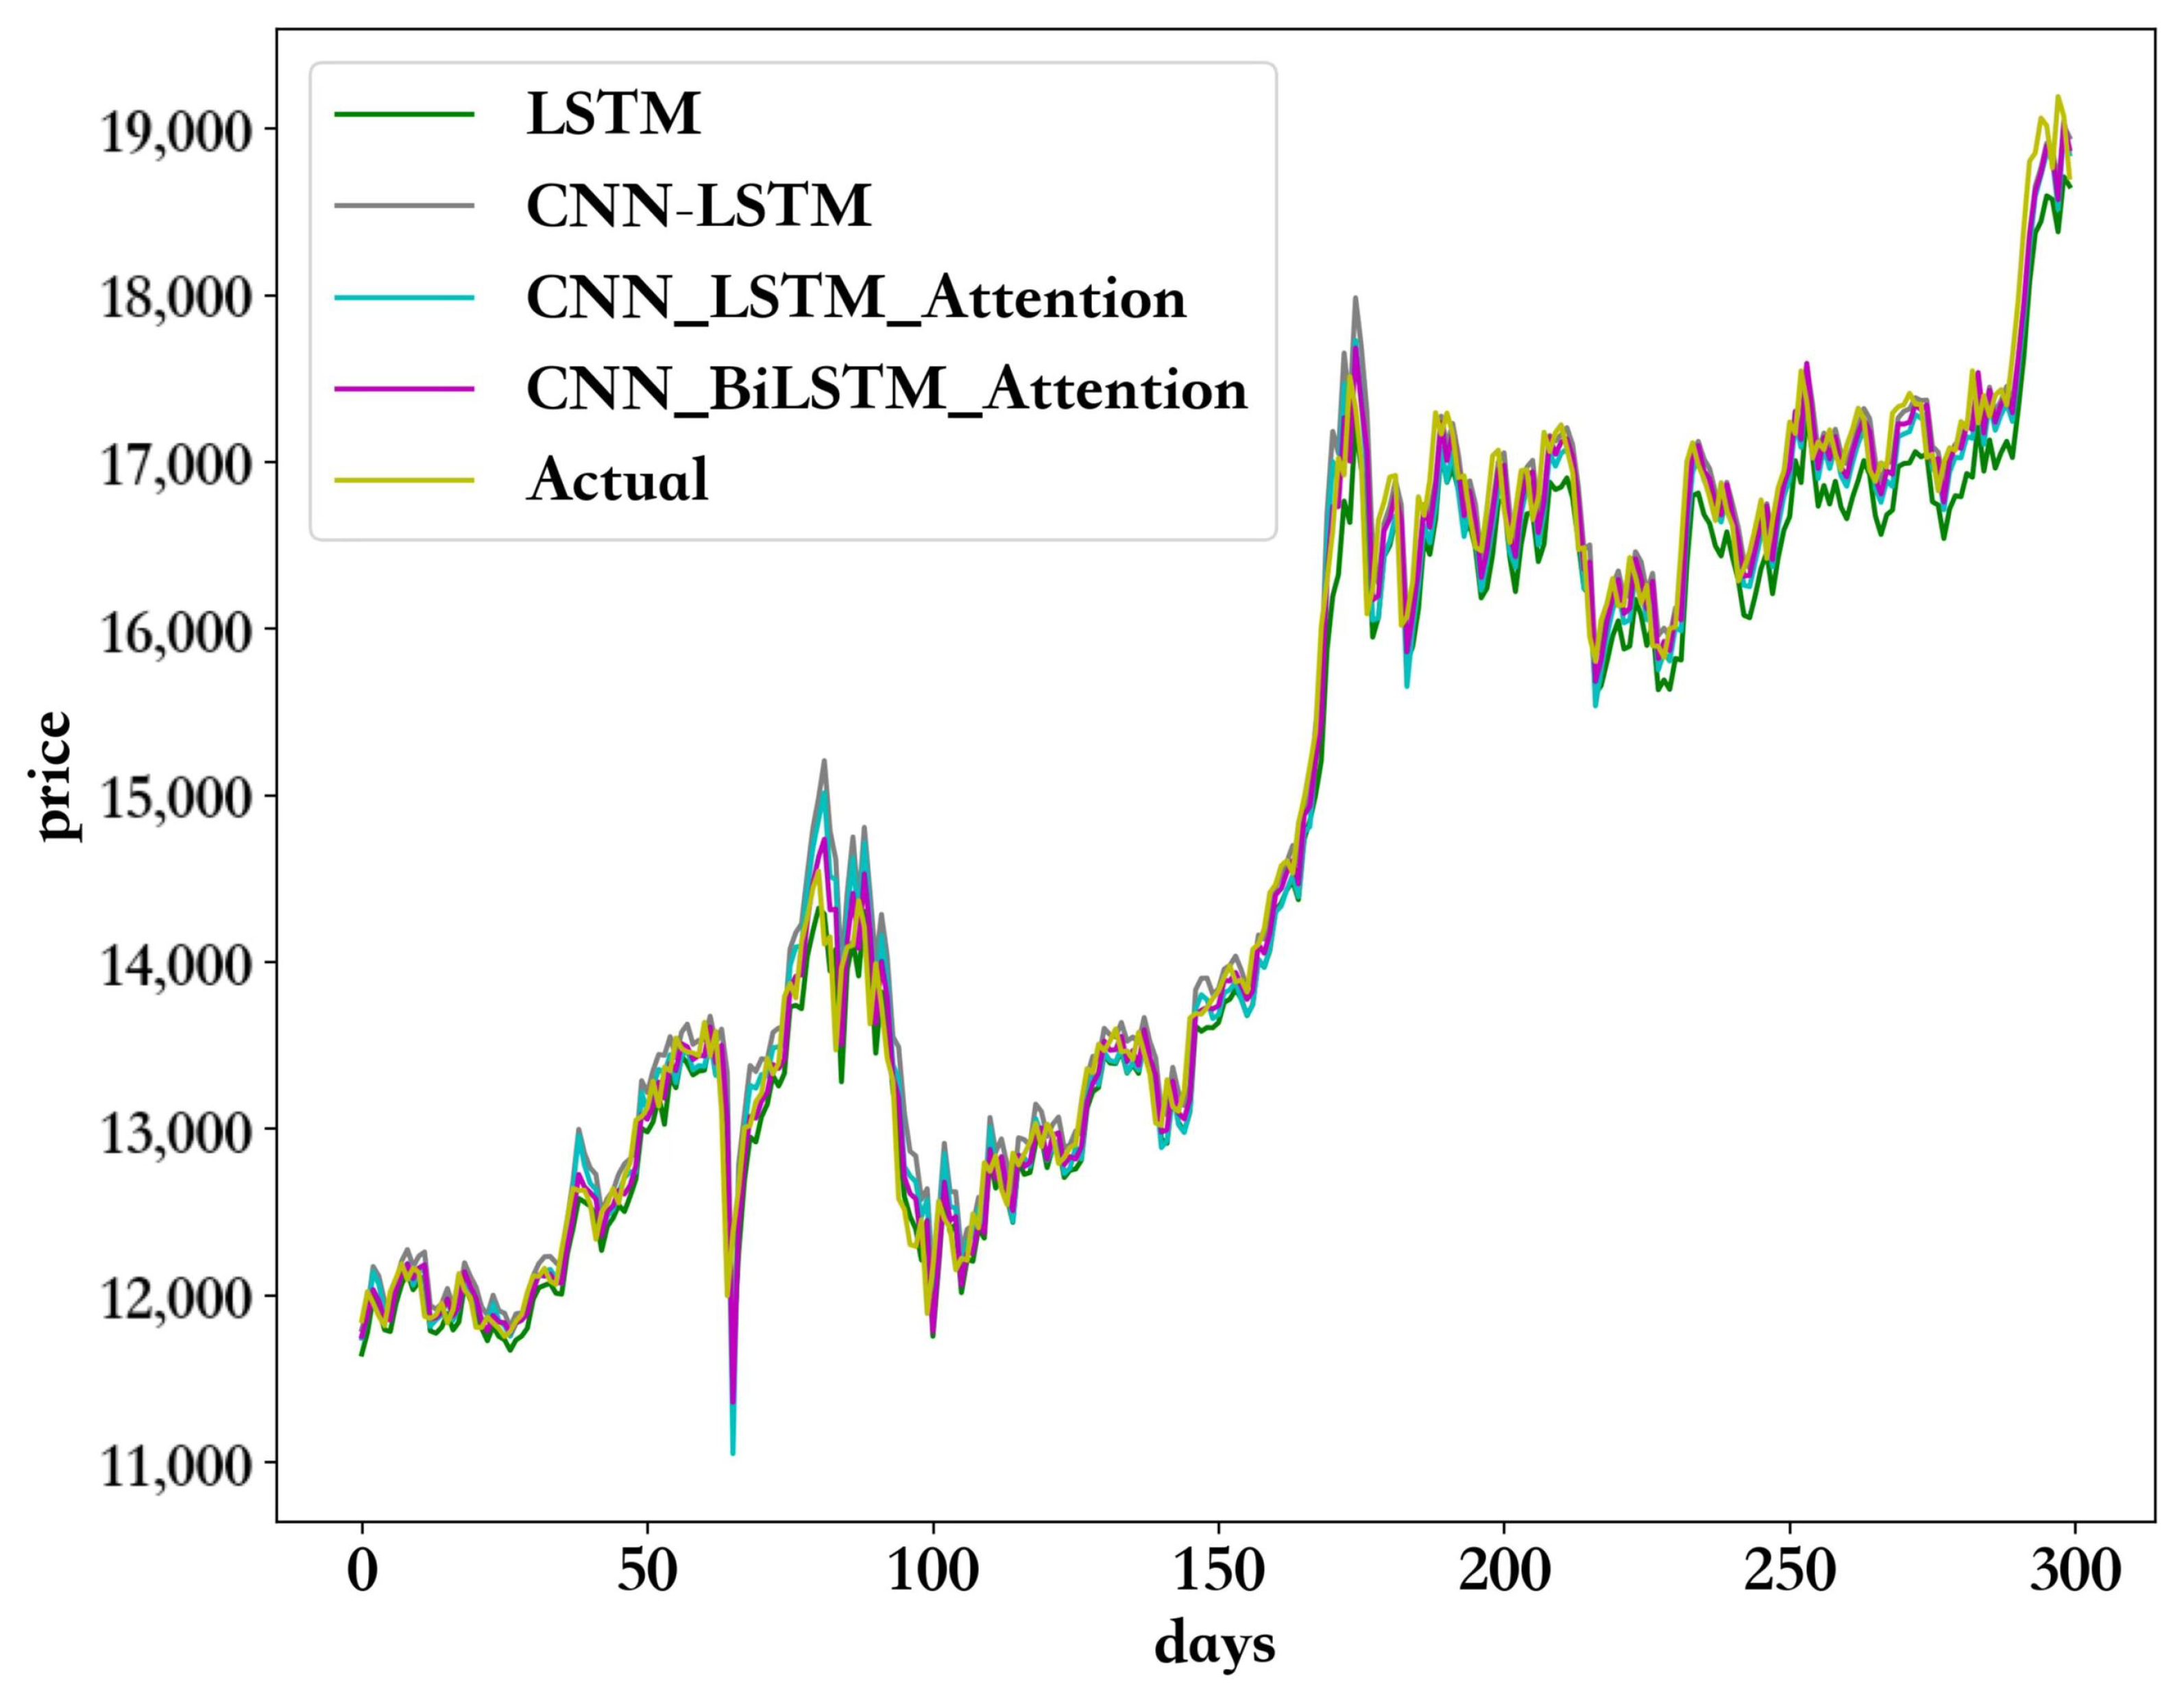
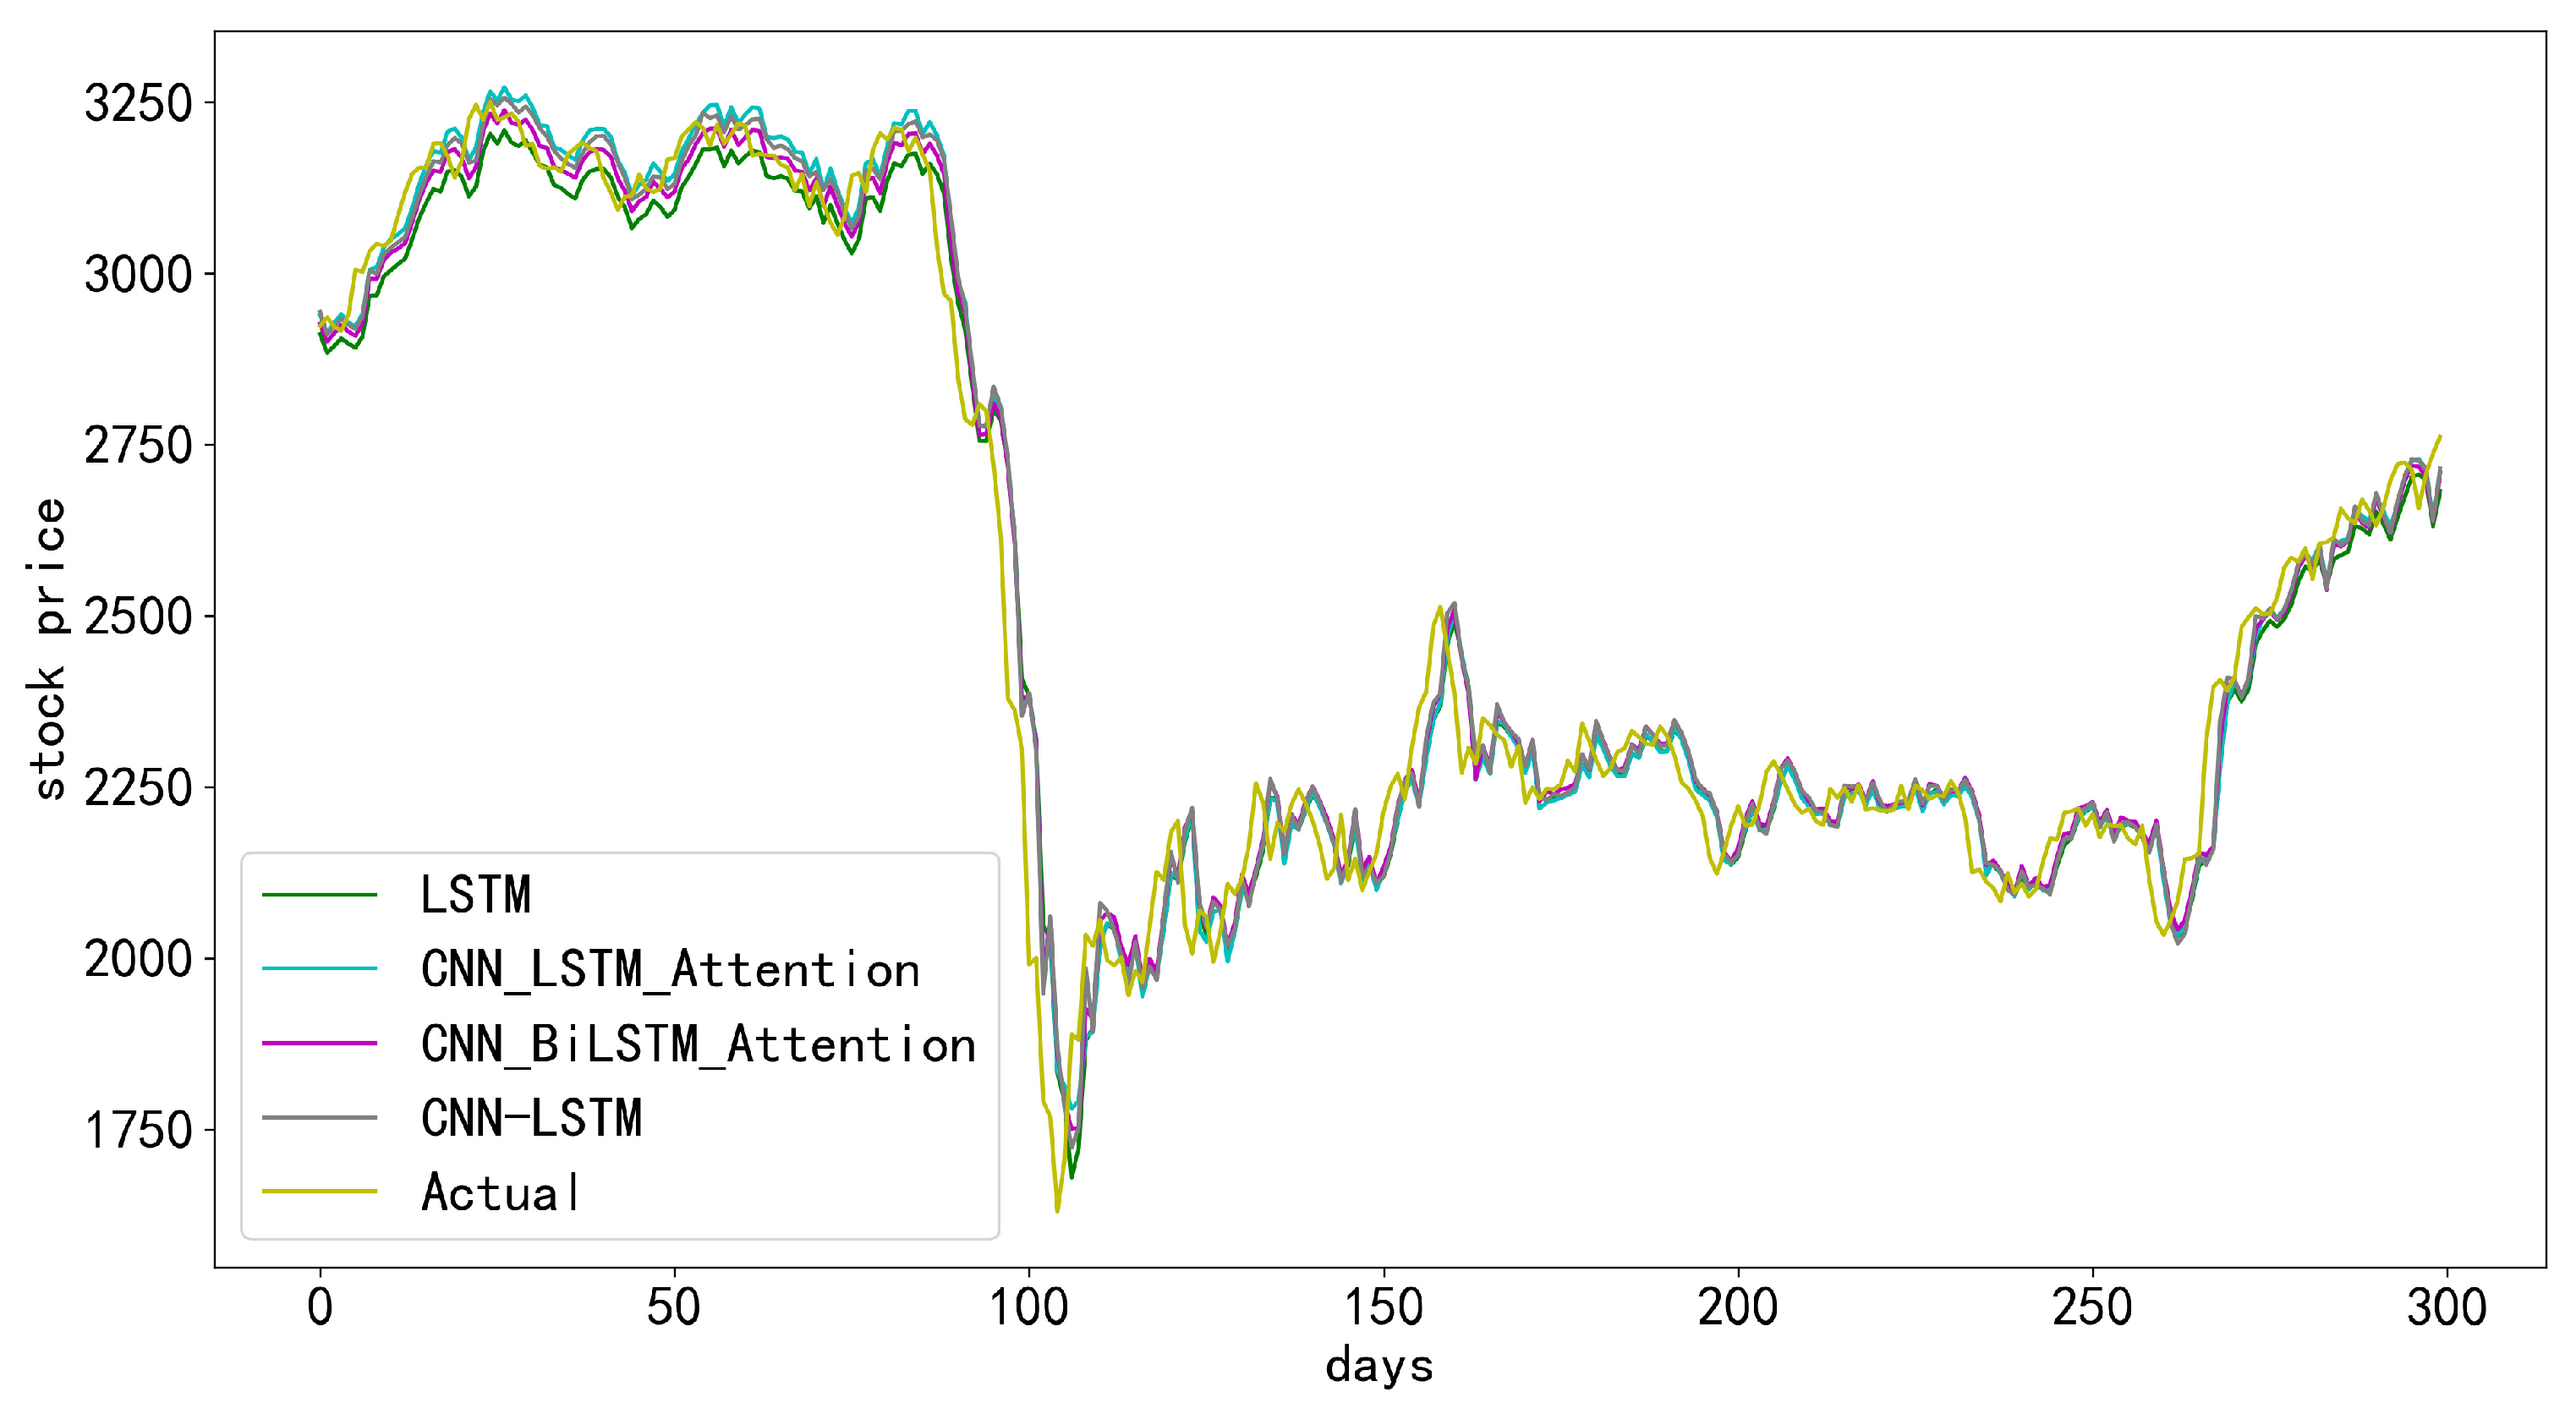
To save space, the comparison of the prediction of each index mentioned above by the chosen four models is plotted in one figure. The meaning is similar to the explanation given above—the closer the curve of a model to the actual curve, the better the model. The prediction results are shown in Figure 9, Figure 10 and Figure 11, respectively. It can be seen that the CNN-BiLSTM-Attention model has good generalization ability and good robustness. However, the local prediction accuracy of the model decreases at the spikes in the stock price.
Again, the above comparisons with figures are very intuitive but quite rough. To quantify the comparison of prediction results, the values of the three quantities calculated by Equations (3)–(5) for the four models with each index are shown in Table 2.
Table 2 shows that the CNN-BiLSTM-Attention model outperforms other models in predicting the closing prices of the SSE A-share Index, the SSE Composite Index, and the SZSE Component A-share Index. The analysis of SSE A-share Index prediction results shows that the RMSE value of the CNN-BiLSTM-Attention model is 7.13% lower than that of the second-best model, CNN-LSTM-Attention, and the value has also improved. The analysis of the prediction results for the SSE Composite Index shows that the CNN-BiLSTM-Attention model has a 5.88% lower RMSE value and an improved value compared with the CNN-LSTM-Attention model. The analysis of the prediction results of the SZSE constituent A-share index shows that the RMSE value of the CNN-BiLSTM-Attention model is 20.3% lower than the second-best model, CNN-LSTM-Attention, and the value is improved from 0.982 to 0.989, which indicates that the prediction accuracy of the model has been improved. Meanwhile, one can see from Table 2 that the MAPE and of the three indices are similar. Still, the RMSE of the SSE A-share Index and SSE Composite Index is much lower than that of the SZSE Constituent A-share Index due to the difference in the original data outline, and the mean square error will be different.
5.2. Model Robust Analysis Based on International Market Indices
Eight international indices, namely AEX, ATX, FCHI, FTSE, HSI, JKSE, KLSE, and OEX, were selected to forecast their closing prices and derive test errors by selecting characteristics including opening price, high price, low price, closing price, volume, and return. The trading data from 3 January 2011 to 29 October 2021 are selected. The data are first normalized to eliminate the effect of volume, and the hyperparameters used for forecasting are unchanged.
The comparisons of the prediction results of these indices are shown in Figure 12, Figure 13, Figure 14, Figure 15, Figure 16, Figure 17, Figure 18 and Figure 19, where the meaning for each figure can be explained similarly to the previous ones. The curve of the predicted results of the CNN-BiLSTM-Attention model is closest to the curve of the actual data in general. That is, the CNN-BiLSTM-Attention model is the most accurate among these four models. Compared with the forecast results of the Chinese indices, the international indices have more lagging forecasts, which is probably related to the “T+1” trading system in China and the “T+0” system in the international markets.
Once more, the above comparisons with figures are very intuitive but also quite rough. To quantify the comparison of prediction results, the values of the three quantities calculated by Equations (3)–(5) for the four models with each index are shown in Table 3.
Table 3 shows that the CNN-BiLSTM-Attention model outperforms the LSTM, CNN-LSTM, and CNN-LSTM-Attention models in predicting stock index prices, with the smallest mean absolute percentage error and root mean square error and the coefficient of determination closest to 1. Analysis of the AEX prediction results shows that the CNN-BiLSTM-Attention model RMSE value is 7.6% lower than the second value and the ATX prediction results show that the CNN-BiLSTM-Attention model RMSE value is 7.6% lower than the second value. The RMSE value of the CNN-BiLSTM-Attention model is 7.6% lower than the second value; the RMSE value of the ATX model is 5.9% lower than the second value; the RMSE value of the FCHI model is 5.9% lower than the second value; and the RMSE value of the CNN-BiLSTM-Attention model is 7.6% lower than the second value. As a result, the RMSE value is 32.8% lower than the second value, and the value increases from 0.967 to 0.985; the analysis of the FTSE prediction results shows that the RMSE value of the CNN-BiLSTM-Attention model is 10.7% lower than the second value; the study of the prediction results indicates that the RMSE value of the CNN-BiLSTM-Attention model is 3.3% lower than the second value; the analysis of the JKSE prediction results shows that the RMSE value of the CNN-BiLSTM-Attention model is 16.3% lower than the second value; the study of the KLSE prediction results shows that the RMSE value of the CNN-BiLSTM-Attention model is 1.3% lower than the second value; and the analysis of OEX prediction results shows a 2.7% reduction in the RMSE value of CNN-BiLSTM-Attention model compared to the next value. This indicates that the prediction accuracy of the model has been improved.
6. Conclusions and Future Work
Asset (such as stock) price forecasting is very important in financial investment activities. Accurate prediction is challenging due to the complexity of the issue. Therefore, the state-of-the-art available methods and technologies are used to predict asset prices, from RNN, LSTM, CNN-LSTM, biLSTM, CNN-biLSTM, etc. This process will continue as new methods or technologies appear. In order to improve the accuracy of stock price prediction, the combination of the CNN-BiLSTM and the attention mechanism, i.e., the CNN-BiLSTM-Attention model, is proposed for price prediction in this paper first using the CSI 300 index data. The test results show that the CNN-BiLSTM-Attention model achieves the best accuracy in stock price index prediction among the four models—LSTM, CNN-LSTM, CNN-LAST-Attention, and CNN-BiLSTM-Attention. To conduct the model stability analysis of the proposed model, the above four models were used to predict stock prices or indices using 12 stock market index data chosen from China and abroad. Again, the test results show that the proposed model can effectively predict stock indices of the stock markets in China and other countries, indicating that the proposed model has a certain degree of generalizability. However, the evaluation index used in this paper is stock trading data, and there are many factors affecting a stock price or index in a financial market. So, just like other models, there are also limitations to the proposed model, mainly due to the model structure. To further improve the prediction accuracy, more work can be done, such as the integration of stock multi-source heterogeneous information into the index, or combining the most up-to-date models, or even developing new models, which is difficult, of course. Due to time and space limitations, the authors did not perform the test of the methods used in this study with data in North American markets, although it is believed that a similar conclusion can be obtained. All these could be considered in future work.
Author Contributions
Methodology, Y.L.; Software, L.Y.; Validation, L.Y.; Formal analysis, Y.L.; Investigation, J.Z. and L.Y.; Data curation, L.Y.; Writing—original draft, L.Y.; Writing—review & editing, Y.L.; Supervision, J.Z.; Project administration, J.Z. and Y.L.; Funding acquisition, J.Z. and Y.L. All authors have read and agreed to the published version of the manuscript.
Funding
This research was supported by the Natural Science & Engineering Research Council (NSERC) of Canada (RGPIN-2019-05906) and the National Science Fund of Fujian Province (No:2020J01892).
Data Availability Statement
Data used in the paper are available upon request.
Acknowledgments
The authors are very grateful to the Editor and three anonymous Reviewers for their help, valuable suggestions, and comments.
Conflicts of Interest
The authors declare no conflict of interest.
References
- Yu, W.; Peng, W. Forecasting volatility of ssec in the Chinese stock market using multifractal analysis. Phys. Stat. Mech. Appl. 2008, 387, 1585–1592. [Google Scholar]
- Wang, P.; Lou, Y.; Lei, L. Research on Stock Price Prediction Based on BP Wavelet Neural Network with Mexico Hat Wavelet Basis. In Proceedings of the 2017 International Conference on Education, Economics and Management Research (ICEEMR 2017), Singapore, 29–31 May 2017; pp. 99–102. [Google Scholar]
- Hao, Y.; Gao, Q. Predicting the trend of stock market index using the hybrid neural network based on multiple time scale feature learning. Appl. Sci. 2020, 10, 3961. [Google Scholar] [CrossRef]
- Dwivedi, S.A.; Attry, A.; Parekh, D.; Singla, K. Analysis and forecasting of Time-Series data using S-ARIMA, CNN and LSTM. In Proceedings of the 2021 International Conference on Computing, Communication, and Intelligent Systems (ICCCIS), Greater Noida, India, 19–20 February 2021; pp. 131–136. [Google Scholar]
- Parmar, K.; Singh, S.; Kumar, J. Soft computing models coupled with statistical models estimate the future of the stock market. Neural Comput. Appl. 2021, 33, 7629–7647. [Google Scholar]
- Xiang, Y. Using the ARIMA-GARCH model to analyze the fluctuation law of international oil prices. Math. Probl. Eng. 2022, 2022, 3936414. [Google Scholar] [CrossRef]
- Ince, H.; Trafalis, T.B. Kernel principal component analysis and support vector machines for stock price prediction. In Proceedings of the 2004 IEEE International Joint Conference on Neural Networks, Budapest, Hungary, 25–29 July 2004; IEEE Cat. No. 04CH37541. Volume 3, pp. 2053–2058. [Google Scholar]
- Yin, L.; Li, B.; Li, P.; Zhang, R. Research on stock trend prediction method based on optimized random forest. CAAI Trans. Intell. Technol. 2021, 8, 274–284. [Google Scholar] [CrossRef]
- Sun, L.; Xu, W.; Liu, J. Two-channel attention mechanism fusion model of stock price prediction based on cnn-lstm. ACM Trans. Asian -Low-Resour. Lang. Inf. Process. 2021, 20, 1–12. [Google Scholar] [CrossRef]
- Hochreiter, S.; Schmidhuber, J. Long Short-Term Memory. Neural Comput. 1997, 9, 1735–1780. [Google Scholar] [CrossRef] [PubMed]
- Moghar, A.; Hamiche, M. Stock market prediction using LSTM recurrent neural network. Procedia Comput. Sci. 2020, 170, 1168–1173. [Google Scholar] [CrossRef]
- Vidal, A.; Kristjanpoller, W. Gold volatility prediction using a CNN-LSTM. Expert Syst. Appl. 2020, 157, 113481. [Google Scholar] [CrossRef]
- Nelson, D.; Pereira, A.; Oliveira, R. Stock market’s price movement prediction with LSTM neural networks. In Proceedings of the 2017 International Joint Conference on Neural Networks (IJCNN), Anchorage, AL, USA, 14–19 May 2017; IEEE: New York, NY, USA, 2017; p. 1419. [Google Scholar]
- Jia, M.; Huang, J.; Pang, L.; Zhao, Q. Analysis and Research on Stock Price of LSTM and Bidirectional LSTM Neural Network. In Proceedings of the 3rd International Conference on Computer Engineering, Information Science & Application Technology (ICCIA 2019), Chongqing, China, 30–31 May 2019; pp. 467–473. [Google Scholar]
- Wang, H.; Wang, J.; Cao, L.; Li, Y.; Sun, Q.; Wang, J. A stock closing price prediction model based on CNN-biLSTM. Complexity 2021, 2021, 5360828. [Google Scholar] [CrossRef]
- Cinar, Y.G.; Mirisaee, H.; Goswami, P.; Gaussier, E.; Strijov, V. Position-based content attention for time series forecasting with sequence-to-sequence RNNs. In Neural Information Processing: 24th International Conference, ICONIP 2017, Guangzhou, China, 14–18 November 2017; Springer: Berlin/Heidelberg, Germany, 2017; pp. 533–544. [Google Scholar]
- Wang, J.; Cui, Q.; Sun, X.; He, M. Asian stock markets closing index forecast based on secondary decomposition, multi-factor analysis, and attention-based LSTM model. Eng. Appl. Artif. Intell. 2022, 113, 104908. [Google Scholar] [CrossRef]
- Chen, Y.; Fang, R.; Liang, T.; Sha, Z.; Li, S.; Yi, Y.; Zhou, W.; Song, H. Stock price forecast based on CNN-BiLSTM-ECA model. Sci. Program. 2021, 2021, 2446543. [Google Scholar] [CrossRef]
- Lu, W.; Li, J.; Wang, J.; Qin, L. A CNN-BiLSTM-AM method for stock price prediction. Neural Comput. Appl. 2020, 33, 4741–4753. [Google Scholar] [CrossRef]
- Zhao, H.; Xue, L. Research on Stock Forecasting Based on LSTM-CNN-CBAM Model. Comput. Eng. Appl. 2021, 57, 203–207. [Google Scholar]
- Lecun, Y.; Botou, L.; Bengio, Y.; Haffner, P. Gradient-based learning applied to document recognition. Proc. IEEE 1998, 86, 2278–2324. [Google Scholar] [CrossRef]
- Luo, J.; Zhang, X. Convolutional neural network based on attention mechanism and bi-lstm for bearing remaining life prediction. Appl. Intell. Int. J. Artif. Intell. Neural Netw. Complex-Probl.-Solving Technol. 2022, 52, 1076–1091. [Google Scholar] [CrossRef]
- Selvin, S.; Vijayakumar, R.; Gopalakrishnan, E.A.; Menon, V.K.; Soman, K.P. Stock price prediction using LSTM, RNN, and CNN-sliding window model. In Proceedings of the International Conference on Advances in Computing Communications and Informatics (ICACCI), Manipal, India, 13–16 September 2017; IEEE: New York, NY, USA, 2017; pp. 1643–1647. [Google Scholar]
- Wu, Q.; Guan, F.; Lv, C.; Huang, Y. Ultra-short-term multi-step wind power forecasting based on cnn-lstm. IET Renew. Power Gener. 2021, 15, 1019–1029. [Google Scholar] [CrossRef]
- Sun, Y.; Sun, Q.; Zhu, S. Prediction of Shanghai stock index based on investor sentiment and cnn-lstm model. J. Syst. Sci. Inf. Technol. Engl. Ed. 2022, 10, 620–632. [Google Scholar] [CrossRef]
- Lu, W.; Li, J.; Li, Y.; Sun, A.; Wang, J. A cnn-lstm-based model to forecast stock prices. Complexity 2020, 2020, 1–10. [Google Scholar] [CrossRef]
- Xu, Y.; Prince, H.; Wu, Z. Predicting Stock Trends with CNN-Bi LSTM Based Multi-FeatureIntegration Model. Data Anal. Knowl. Discov. 2021, 7, 126–137. [Google Scholar]
- Eapen, J.; Bein, D.; Verma, A. Novel Deep Learning Model with CNN and Bi-Directional LSTM for Improved Stock Market Index Prediction. In Proceedings of the 2019 IEEE 9th Annual Computing and Communication Workshop and Conference (CCWC), Las Vegas, NV, USA, 7–9 January 2019; IEEE: New York, NY, USA, 2019; pp. 0264–0270. [Google Scholar]
Figure 1.
LSTM memory cell.

Figure 2.
BiLSTM structure.

Figure 4.
Prediction results based on LSTM.

Figure 5.
Prediction results based on CNN-LSTM.

Figure 6.
Prediction results based on CNN-LSTM-Attention.

Figure 7.
Prediction results based on CNN-BiLSTM-Attention.

Figure 8.
Trends of Chinese Stock Indices.

Figure 9.
Comparison of SSE A-share Index prediction results.

Figure 10.
Comparison of SSE Composite Index prediction results.

Figure 11.
Comparison of SZSE Component A-Share Index prediction results.

Figure 12.
Comparison of AEX Index prediction results.

Figure 13.
Comparison of ATX Index prediction results.

Figure 14.
Comparison of FCHI Index prediction results.

Figure 15.
Comparison of FTSE Index prediction results.

Figure 16.
Comparison of HSI Index prediction results.

Figure 17.
Comparison of JKSE Index prediction results.

Figure 18.
Comparison of KLSE Index prediction results.

Figure 19.
Comparison of OEX Index prediction results.


Table 1.
Comparison of evaluation error indexes of the four methods.
| Method | MAPE (%) | RMSE | |
|---|---|---|---|
| LSTM | 1.877 | 108.748 | 0.958 |
| CNN-LSTM | 1.482 | 89.048 | 0.972 |
| CNN-LSTM-Attention. | 1.288 | 76.454 | 0.979 |
| CNN-BiLSTM-Attention | 1.023 | 64.848 | 0.985 |
Numbers in boldface indicate the best results among the models.
Table 2.
Comparison of evaluation error indexes of four methods in three indexes.
| Index | LSTM | CNN-LSTM | CNN-LSTM-Attention | CNN-BiLSTM-Attention | |
|---|---|---|---|---|---|
| SSE | MAPE | 1.136 | 0.943 | 0.914 | 0.836 |
| A-share | RMSE | 50.859 | 41.988 | 42.801 | 39.750 |
| Index | 0.970 | 0.979 | 0.979 | 0.982 | |
| SSE | MAPE | 0.968 | 0.995 | 0.874 | 0.851 |
| Composite | RMSE | 42.737 | 41.600 | 40.360 | 37.988 |
| Index | 0.977 | 0.978 | 0.979 | 0.982 | |
| SZSE | MAPE | 1.429 | 1.185 | 1.565 | 1.160 |
| Component | RMSE | 291.072 | 251.561 | 315.153 | 251.095 |
| A-Share Index | 0.985 | 0.989 | 0.982 | 0.989 |
Numbers in boldface indicate the best results among the models.
Table 3.
Comparison of the errors of the prediction results of the international stock market indices by various models.
Table 3.
Comparison of the errors of the prediction results of the international stock market indices by various models.
| Index | LSTM | CNN-LSTM | CNN-LSTM-Attention | CNN-BiLSTM-Attention | |
|---|---|---|---|---|---|
| AEX | MAPE | 2.216 | 7.548 | 1.473 | 1.360 |
| RMSE | 16.789 | 60.953 | 11.958 | 11.733 | |
| 0.963 | 0.516 | 0.981 | 0.982 | ||
| ATX | MAPE | 1.617 | 1.368 | 1.350 | 1.282 |
| RMSE | 58.111 | 54.533 | 51.087 | 48.055 | |
| 0.989 | 0.991 | 0.991 | 0.992 | ||
| FCHI | MAPE | 1.866 | 2.873 | 2.186 | 1.112 |
| RMSE | 131.868 | 265.854 | 162.568 | 88.527 | |
| 0.967 | 0.866 | 0.950 | 0.985 | ||
| FTSE | MAPE | 1.238 | 1.163 | 1.075 | 0.914 |
| RMSE | 97.471 | 93.177 | 86.936 | 77.576 | |
| 0.965 | 0.968 | 0.972. | 0.978 | ||
| HSI | MAPE | 1.609 | 1.431 | 1.682 | 1.404 |
| RMSE | 519.059 | 498.572 | 543.748 | 481.974 | |
| 0.912 | 0.919 | 0.903 | 0.924 | ||
| JKSE | MAPE | 1.552 | 1.380 | 1.807 | 1.141 |
| RMSE | 110.962 | 101.035 | 146.146 | 84.538 | |
| 0.976 | 0.980 | 0.958 | 0.986 | ||
| KLSE | MAPE | 0.953 | 0.929 | 0.864 | 0.898 |
| RMSE | 20.043 | 20.453 | 20.477 | 19.782 | |
| 0.940 | 0.937 | 0.937 | 0.941 | ||
| OEX | MAPE | 2.873 | 6.217 | 1.587 | 1.501 |
| RMSE | 57.432 | 130.388 | 33.193 | 32.278 | |
| 0.947 | 0.726 | 0.982. | 0.983 |
Numbers in boldface indicate the best results among the models.
Disclaimer/Publisher’s Note: The statements, opinions and data contained in all publications are solely those of the individual author(s) and contributor(s) and not of MDPI and/or the editor(s). MDPI and/or the editor(s) disclaim responsibility for any injury to people or property resulting from any ideas, methods, instructions or products referred to in the content. |
© 2023 by the authors. Licensee MDPI, Basel, Switzerland. This article is an open access article distributed under the terms and conditions of the Creative Commons Attribution (CC BY) license (https://creativecommons.org/licenses/by/4.0/).
Share and Cite
MDPI and ACS Style
Zhang, J.; Ye, L.; Lai, Y. Stock Price Prediction Using CNN-BiLSTM-Attention Model. Mathematics 2023, 11, 1985. https://doi.org/10.3390/math11091985
AMA Style
Zhang J, Ye L, Lai Y. Stock Price Prediction Using CNN-BiLSTM-Attention Model. Mathematics. 2023; 11(9):1985. https://doi.org/10.3390/math11091985
Chicago/Turabian StyleZhang, Jilin, Lishi Ye, and Yongzeng Lai. 2023. "Stock Price Prediction Using CNN-BiLSTM-Attention Model" Mathematics 11, no. 9: 1985. https://doi.org/10.3390/math11091985
Note that from the first issue of 2016, this journal uses article numbers instead of page numbers. See further details here.