
Link Prediction and Graph Structure Estimation for Community Detection


1
Software College, Northeastern University, Shenyang 110819, China
2
College of Engineering, Computing and Cybernetics, Australian National University, Canberra, ACT 2601, Australia
*
Author to whom correspondence should be addressed.
Mathematics 2024, 12(8), 1269; https://doi.org/10.3390/math12081269
Submission received: 1 April 2024
/
Revised: 16 April 2024
/
Accepted: 18 April 2024
/
Published: 22 April 2024
(This article belongs to the Special Issue Theory and Application of Neural Networks and Complex Networks)
Abstract
:In real-world scenarios, obtaining the relationships between nodes is often challenging, resulting in incomplete network topology. This limitation significantly reduces the applicability of community detection methods, particularly neighborhood aggregation-based approaches, on structurally incomplete networks. Therefore, in this situation, it is crucial to obtain meaningful community information from the limited network structure. To address this challenge, the LPGSE algorithm was designed and implemented, which includes four parts: link prediction, structure observation, network estimation, and community partitioning. LPGSE demonstrated its performance in community detection in structurally incomplete networks with 10% missing edges on multiple datasets. Compared with traditional community detection algorithms, LPGSE achieved improvements in NMI and ARI metrics of 1.5781% to 29.0780% and 0.4332% to 31.9820%, respectively. Compared with similar community detection algorithms for structurally incomplete networks, LPGSE also outperformed other algorithms on all datasets. In addition, different edge-missing ratio settings were also attempted, and the performance of different algorithms in these situations was compared and analyzed. The results showed that the algorithm can still maintain high accuracy and stability in community detection across different edge-missing ratios.
Keywords:
community detection; incomplete structure; edge-missing; link prediction; graph structure estimationMSC:
05C821. Introduction
With the continuous development of computer technology and the rapid growth of the amount of data, the network has become an important and ubiquitous structure in the real world. It can describe the relationship between entities and the entity itself by edges and nodes, respectively. In order to detect the community structure in the network, many community detection algorithms have been proposed, including those based on modular optimization [1,2], based on deep learning [3,4,5], and based on random block model (SBM) [6,7,8,9]. Related experimental results show that these community detection methods have achieved good results in different datasets.
However, the vast majority of community detection algorithms are based on the assumption that the network is fully observed. But, in reality, many networks are hard to fully observe. This assumption is often violated because graphs are typically extracted from complex interactive systems. This is often due to the uncertainty or errors inherent in these interactive systems [10]. For example, in the protein interaction map, the inaccurate experimental error in the laboratory is the main source of errors, which causes the protein interaction network to be incomplete or introduces some noise. Additionally, privacy protection may also result in incomplete data collection. For example, some users on Twitter may hide part of their friends list, making the edges between the corresponding user pairs not visible in the network, which will lead to an incompletely built network [11].
In the case of incomplete network structure, in recent years, researchers have proposed some two-stage methods or unified framework that combines link prediction and community detection to solve this problem [12,13]. However, the goal of link prediction is to predict as many correct edges as possible, which is not consistent with the requirement of predicting important edges to identify associations in the edge-missing network. Therefore, directly combining link prediction and community detection does not effectively detect the community structure of marginal missing networks.
In view of the above problems, this paper proposes an algorithm framework called LPGSE (Link Prediction and Graph Structure Estimation for Community Detection). The goal is to estimate an optimal graph by using a combination of link prediction, graph representation learning, and probability estimation, and, finally, to conduct a community detection task on the optimal graph. The main contributions of this study are as follows:
- We conducted an in-depth analysis of the current situation and problems of the existing research, considered the generation process of the graph, comprehensively used various information, and proposed a new method for community detection on incomplete networks.
- LPGSE was designed and implemented in the algorithm, which realized efficient community detection on the incomplete structure network through the steps of link prediction, structure observation, probability estimation, and optimal graph generation.
- We performed experimental validation of the proposed LPGSE algorithm using multiple open source datasets. Experimental results showed that LPGSE outperforms community detection on poorly structured networks compared to other contrast algorithms.
2. Related Work
An incomplete information network refers to the missing or incomplete graph data in terms of network structure or attribute information. In the real world, such networks are very common because complete information is often difficult to obtain during many data acquisition processes. For example, in data collection, due to limited resources, individuals or organizations may only obtain a subset of data in a specific geographic query area, resulting in incomplete data; in addition, due to user-specified privacy settings, individuals may partially or completely hide some of their activity trajectory or friendship relationships, which further aggravate the problem of incomplete information [14]. A typical example is that about 52.6% of New York City Facebook users hide their friend list [15], based on statistics from June 2011. Some users on Twitter may hide part of their friend list, making the edges between the corresponding user pairs not visible in the network [11]. In the network of terrorist organizations, each node represents terrorist activities, and the edge between two nodes indicates that two activities come from the same organization. We may not know which terrorist organizations carried out terrorist activities. Therefore, the relationship between certain terrorist activities is unclear. When facing networks with incomplete information, researchers need to consider adopting a more robust, flexible, and adaptive approach to fully utilize the existing information and solve the challenges due to missing information.
Traditional community detection techniques assume the complete network topology, and the discovery process relies on graph analysis to measure node similarity in the neighborhood. However, real-world networks have limited structural information, and incomplete networks can affect neighborhood analysis and further reduce the accuracy of community detection. CNN architecture can gradually recover complete latent features from basic inputs, so the first supervised CNN model [16] for incomplete structural networks (TINs) was proposed for community detection. The model includes two CNN layers with maximum pooling operation for network representation and a fully connected DNN layer for cluster detection. The CNN architecture recovers the complete potential features from the original input, the convolution layer represents the local features of each node from different angles, and the last fully connected layer updates the community of each node.
These methods are divided into three categories, namely, methods based on link prediction completion networks [17,18], methods based on probabilistic models [19,20], and methods based on graph neural networks [21,22,23].
Based on the link prediction and completion network method, the link prediction method is used to predict some missing edges to complete the network, and then carry out the community detection task on this complete network. The method is divided into two categories. The first category includes the two-stage algorithm [24]; specifically speaking, the first phase requires a link prediction to recover the missing edges, and the second stage requires community detection on a complementary network, as proposed by Burgess et al. [12]. EDGEBOOST is a consensus clustering approach using link prediction enhancement to address the community detection problem of complex networks; specifically speaking, it applies a link prediction algorithm in a given network to predict the missing edges and performs basic clustering on the original network and predicted edges using different community detection algorithms, which produces multiple basic community divisions. These basic community divisions are integrated into a consensus matrix, and the consensus clustering algorithm is applied to obtain the final stable and accurate division of communities. The second category includes the method [25] for simultaneous community detection and link prediction in a unified framework, such as CLMC [25], which is one of the most representative algorithms in the category; its goal is to learn a similarity matrix in the Unity framework to detect communities and a complement matrix to predict missing edges. Zhang et al. proposed a joint optimization framework, COPE [13], where link prediction and community detection are mutually reinforcing; by learning the probability of invisible links and nodes joining communities, the framework aims to improve the quality of community detection and can produce better results. He et al. argue that all these algorithms assume that the more the algorithm can correctly predict the missing edges [7], the more accurate the group detection. However, the goal of link prediction is to predict as many correct edges as possible, which is inconsistent with the requirement of predicting important edges to identify communities in the edge-missing network. Therefore, combining link prediction and community detection does not effectively detect the community structure of networks with missing edges. Thus, by proposing a community self-directed generative model, SGCD, the improvement is achieved by accommodating two sets of variables in our model, one for recovering the missing edges and one for describing associations.
The method based on probabilistic models mainly relies on probabilistic models to represent the relationship between nodes and edges, thus making inferences on the basis of known partial network structure and attribute information. For example, Tran et al. proposed the regularized non-negative matrix factorization (NMF) community detection framework KroMFac and the DeepNC method based on the Kronecker graph model [24]. The expectation maximization (EM) algorithm was applied in KroMFac. Specifically, the parameter matrix is generated from an inferred Kronecker, the missing part of the network is estimated first, and then the community structure is revealed by solving the regularized NMF-assisted optimization problem to maximize the possibility of the underlying graph. Chen et al. proposed a general framework based on the Gumbel-softmax network inference (GIN) to infer network structure and node information from time series data with missing nodes [26]. We addressed this problem by finding an optimized network structure, a suitable set of initial states, and a network dynamic approximator that minimizes the error between the observed time series of nodes and the time series generated by the GIN model. Jelena et al. argue that the network traffic estimation may suffer large errors due to the incompleteness of the observed data, and, to solve this problem, a method based on the maximum entropy model was proposed to reconstruct the network traffic [27].
The method based on the graph neural network mainly applies the graph convolutional network (GCN) class model to the network completion problem. For example, Xu et al. proposed a GCN-based model [28], which regards the process of completing a graph as the growth process of the network and learns growth rules to supplement the whole network. META-CODE [29] infers network structure by using the multi-allocation cluster (MAC) and the community attribution graph model (AGM). Tran et al. proposed a new approach, DeepNC, for completing missing parts of the inference network based on a graph depth generative model [30]. Specifically, the DeepNC method uses a deep generative model to infer the missing parts of the network. Specifically, first, autoregressive generative models are used to learn the likelihood distribution of edges in the network. This model can capture the underlying topology and node features in the network. Based on the learned autoregression generation model, we determined the completion network that maximizes the likelihood distribution given by the observable graph topology.
3. Problem Definition
The network with a missing edge is depicted as , where V is a collection of nodes and is the collection of edges; the missing-edge network with a number of can be understood as coming from a real network , where is the complete set of edges of the real network, . Edges describe the relationship between nodes, and the adjacency matrix of a network with missing edges can be represented by , where represent the connection relationship between node and . Given an incomplete graph containing a set of nodes and a subset of connections between nodes, the goal is to learn an optimal graph and, finally, perform community detection on .
4. Methodology
The objective of the LPGSE algorithm is to estimate an optimal graph by using a combination of link prediction, graph representation learning, and probability estimation. Finally, the community detection task is conducted on the optimal graph, which includes four parts, namely, link prediction, structure observation, network estimation, and community detection. First, link prediction is conducted to predict possible edges present but not observed in the network, helping to improve the integrity of the network; then, by constructing the observation set in the input GCN of the completed network, these sets can reflect the possible structure of the network. Next, according to the observation set, the original network is estimated using the probability estimates to generate a new network structure. The process is repeated for link prediction, and probability estimation until an optimal graph is obtained. In this process, predicted edges are added to the original network, and the observation set is used to guide the process of network estimation, and, for community detection on this optimal graph, to identify the community structure in the network. The specific algorithm process and framework are shown in Figure 1.
4.1. Link Prediction
The integrity of the network is crucial to community detection tasks, because an incomplete network structure may seriously affect the accuracy of community detection. In the LPGSE algorithm, completing the network whenever possible is a key step. Link prediction is a method used to predict the possible connections between nodes in a network, which can help us to better understand and mine the potential relationships in the network. In order to take full advantage of the link prediction in the community detection task, the LPGSE algorithm first uses the link prediction technology to complete the missing edges in the network. This step can improve the network integrity by learning the patterns in the existing network structure to predict the missing connections.
In LPGSE, the link prediction algorithm is not mandatory, and any link prediction algorithm can use [31] as the link prediction part in this algorithm. uses the WL transformation to capture the local and global structure information of the graph, which helps to better understand the potential links between nodes, and, thus, improves the accuracy of link prediction. The WL transformation shows strong discriminative ability in the graph isomorphism test, which means that the model can have strong generalization ability on different types of graph structures, and can also achieve a good prediction effect for diverse network structures. can be integrated with other neural network structures, such as convolutional neural networks and recurrent neural networks, which can help to further improve the performance of the model.
The algorithm mainly includes closed subgraph extraction, subgraph pattern coding, adjacency matrix construction, and neural network training. First, for each edge, the closed subgraph node set containing neighbor nodes is extracted, and the extraction process starts from first-order neighbors and then gradually extends to second-order neighbors, third-order neighbors, etc., until neighbor nodes are reached. These subgraphs can capture the higher-order neighborhood structure between the nodes. After extracting and encoding the subgraphs, the former K subgraphs are selected according to certain criteria (e.g., importance, frequency of the subgraphs, etc.) ensuring that the model focuses on the most important local structural features. Next, each subgraph is represented as an adjacency matrix, with the node order given by the Palette-WL labeling algorithm. This is a color refinement method based on the modified hash function. Then, an upper triangle adjacency matrix is constructed for each node, reflecting the connections between the nodes. Subsequently, the adjacency matrix is input into the neural network for learning. Neural networks can learn the connections between nodes by optimizing the loss functions. After training the neural network, the existence of the test link can be predicted by extracting a closed subgraph of the test link, encoding using Palette-WL, and feeding the resulting adjacency matrix to the neural network. Finally, a predicted score between 0 and 1 is output for each test link, representing the estimated probability that the test link is positive. The flow of the algorithm is shown in Figure 2.
4.2. Structural Observation
Learning the graph-structured data from a single information source inevitably results in bias and uncertainty. If an edge exists in multiple measurements, its confidence will be greater, as will the community information. Therefore, a reliable graph structure should consider the integrated information to inject multifaceted information and reduce bias [32]. The LPGSE algorithm constructs a set of observations for the optimal graph using the graph X’ after completing the link prediction, and then estimates the graph based on these observation sets. Here, the GCN is selected as the backbone, and the graph , after link prediction completion, is input into the GCN to construct the initial observation sets K and C for the network estimation.
Specifically, GCN follows the neighbor aggregation strategy by iteratively updating the representation of nodes by pooling the representation of the node neighbors. Formally, the k-layer aggregation rule of the GCN is shown in Equation (1).
where is the normalized adjacency matrix, , is the hierarchical trainable weight matrix, represents the activation function, is the matrix represented by the k-layer nodes, and . The GCN parameter can be trained by gradient descent.
The current GCN takes action on the after completion of the link prediction. To estimate the optimal graph structure of the GCN, we need to build multifaceted observations that can be integrated to resist bias. After k-aggregate iterations, the node representation captures structural information within the k-order graph neighborhood, providing local-to-global information.
Specifically, the fixed GCN parameter , taking out the node representation , deconstructs the KNN graph as the observation set for the optimal graph, where is the adjacency matrix of the KNN graph generated by , characterizing the similarity of the order neighborhood. Obviously, the original graph is also an important observation of the optimal graph, so it is combined with the set of KNN graphs to form the complete observation set . Meanwhile, the initial community detection is performed in these KNN maps, constituting the observation set . The observation set results K and C represent the optimal graph structure from different viewpoints and can be integrated to infer more reliable graph structures. These observations, and , and the predicted values Z are fed into the estimator to accurately infer the posterior distribution of the graph structure.
4.3. Network Estimation
Considering the local smoothing characteristics of GCN, the random block model (Stochastic Block Model, SBM) is a good choice; it is widely used for community detection and is suitable to model for graphs with strong community structure [20,33]. It should be noted that the probability distribution is used to generate graph G, and the specific method is shown in Equation (2).
where is the parameter of SBM; it assumes that the probability of edges between nodes only depends on the result set of multiple observations C of community relationships. For example, for node (belonging to the observed community ) and node (belonging to the multiple observed community ), the edge probability between them is denoted by ; this means that generating graph the G also generated edges between nodes, which only depend on the multiple observed community division results. In order to obtain a more accurate community structure, the label only chooses the observation repeats for further analysis, because multiple observations are the same, with higher confidence.
The observation model is introduced to describe how the generative graph G maps to the observations, which assumes that the observations at the edges are independent, identically distributed Bernoulli random variables, conditional on the presence or absence of edges in the generative graph. This assumption has been widely accepted in previous studies, such as community detection and graph generation, and has been shown to be viable [34]. The represent the probability of these observations K appearing under the generating graph G and the model parameters and . We suppose that, in the observation of , one side is observed to have an edge on the and no edge on the other . With these definitions, the specific form of is shown in Equation (3).
If an edge indeed exists in the generative graph G, among the total M observations, the nodes and can be rewritten as , and, if not, the probability is .
Based on the above process, it is difficult to directly calculate the posterior probability of the generating graph G. However, combining the probability with the above model and applying Bayesian estimation, as shown in Equation (4), we have
where are independent of each other. All possible values of generating graph G are summed to obtain posterior probability expressions for the parameters , , and as shown in Equation (5).
To maximize the posterior estimation, MAP calculates the estimated adjacency matrix Q of the resulting graph G, which is shown in (6). It should be noted that the generative graph G is used as the next loop iteration or the optimal graph for community division.
where, is expressed as the posterior probability of having an edge between the node and the node , which is the confidence of that edge. To update the estimated adjacency matrix , will be solved using the expectation maximization (EM) algorithm [35] maximization equation.
In E-step, the Jensen inequality is applied to Equation (5) because directly maximizing the probability is inconvenient. This inequality is then used to derive Equation (7) after taking the logarithm.
where is an arbitrary non-negative function satisfying and can be regarded as a probability distribution over G. When the realization is completely equal, the right side of Equation (7) is maximized to obtain the following equation:
In M-step, the maximum value of the parameter can be found by differentiation. On the right side of Equation (7), the derivative remains unchanged, and, assuming that the prior is uniform, we can obtain the following equations:
The solutions of these equations provide the MAP estimates of , , and . Further, an updated equation for each parameter is obtained, as shown in the following equations:
The calculation of can be understood as the observed probability of an edge rs of two societies r and s, which is calculated from the average probability of a single edge between all nodes, that is, when and are in the same community equations as shown in Equation (14), otherwise as shown in Equation (15).
The calculation of the value is as shown in the following Equation (16):
4.4. Community Detection
It should be noted that the above link prediction, structure observation, and network estimation are circular iterative processes that learn an optimal graph S. After obtaining the optimal graph S, the community detection algorithm can be implemented on it and then divide the community. It is worth mentioning that in this step, there is no restriction on the community detection algorithm, and any applicable community detection algorithm can be used. In this case, the spectral clustering algorithm was selected as the method to implement community detection.
By summarizing the process of the above algorithm, the pseudocode implementation of the LPGSE algorithm is given as shown in the Algorithm 1.
| Algorithm 1 LPGSE. | |
| Input: | , KNN graph parameters k, GCN parameters , and , deviation , threshold , estimated number of iterations . |
| Output: | Community collection C. |
| 1: | Initialization parameters ,, , and . |
| 2: | for do: |
| 3: | Link prediction for the input Figure . |
| 4: | GCN model training. |
| 5: | Use the KNN diagram to construct the observation set . |
| 6: | Build the observation set with spectral clustering. |
| 7: | while or do: |
| 8: | . |
| 9: | Calculate and by Equations (12) and (13). |
| 10: | Calculate by Equations (14) and (15). |
| 11: | Calculation Equation (16), update . |
| 12: | end while |
| 13: | The was extracted by using the threshold on the . |
| 14: | Set the next iteration . |
| 15: | end for |
| 16: | Using spectral clustering on . |
| 17: | return community collection C. |
5. Experiments
The performance of LPGSE was tested on four widely used real networks with known societies, with the specific dataset information shown in Table 1.
For a comprehensive evaluation, different categories of comparison algorithms were selected, including some traditional community detection algorithms and community detection algorithms for incomplete network structures. Traditional community detection algorithms usually assume that networks are complete, while the latter conduct community detection for networks with missing edges. The specific algorithms include the following ones:
- Louvain [36]: An efficient community detection algorithm based on modular degree optimization. It was proposed by Blondel et al. in 2008, and its main goal is to find a way of dividing the network that maximizes the modularity between the divided associations.
- Spectral [37]: An unsupervised learning algorithm based on graph theory is mainly applied in tasks such as data clustering and community detection.
- Km-node2vec: A community detection algorithm that combines the K-means clustering method and the Node2vec representation learning method. It first learns low-dimensional vector representations of nodes in the Node2vec, and then uses these representations for K-means clustering to obtain the community structure.
- Modularity [38]: A method to detect associations in a network by optimizing the modular degree values.
- PIC [32]: A fast clustering method based on the idea of spectral clustering that reduces the computational cost by avoiding computing eigenvalues and eigenvectors through power iteration.
- LPCD [12]: An approach combining link prediction and consensus clustering to address community detection problems in complex networks.
- CLMC [25]: A cluster-driven low-rank matrix completion method for clustering on networks supplemented with missing links to improve the performance of community detection.
Because these networks are complete networks, in order to simulate the structure of incomplete networks, we randomly deleted 10% of the existing edges of each network to produce the missing-edge network; specifically, for each network, we randomly generated 50 instances of missing-edge networks, and calculated the NMI and ARI of each algorithm tested on these networks.
NMI measures the amount of information shared between two clusterings, normalized by the total information in the two clusterings. It is calculated as follows:
where I(X;Y) is mutual information shared between X and Y. H(X) and H(Y) are the entropy of real clustering and modeled clustering, respectively. NMI takes values in the range [0,1].
ARI measures the similarity between two clusterings by considering pairs of samples and counting pairs that are assigned to the same or different clusters in the two clusterings, adjusted for chance. It is calculated as follows:
where is the number of samples that are in both cluster i and j. is the number of samples in cluster i. is the number of samples in cluster j. n is the total number of samples.
Experimental Results
In this study, comparative experiments were conducted on the four datasets presented above. To simulate the missing-edge network, 10% of the existing edges were randomly removed in each network. For each network, 50 missing-edge network instances were randomly generated and the NMI and ARI averages on these networks were calculated for each algorithm. The experimental results are shown in Table 2.
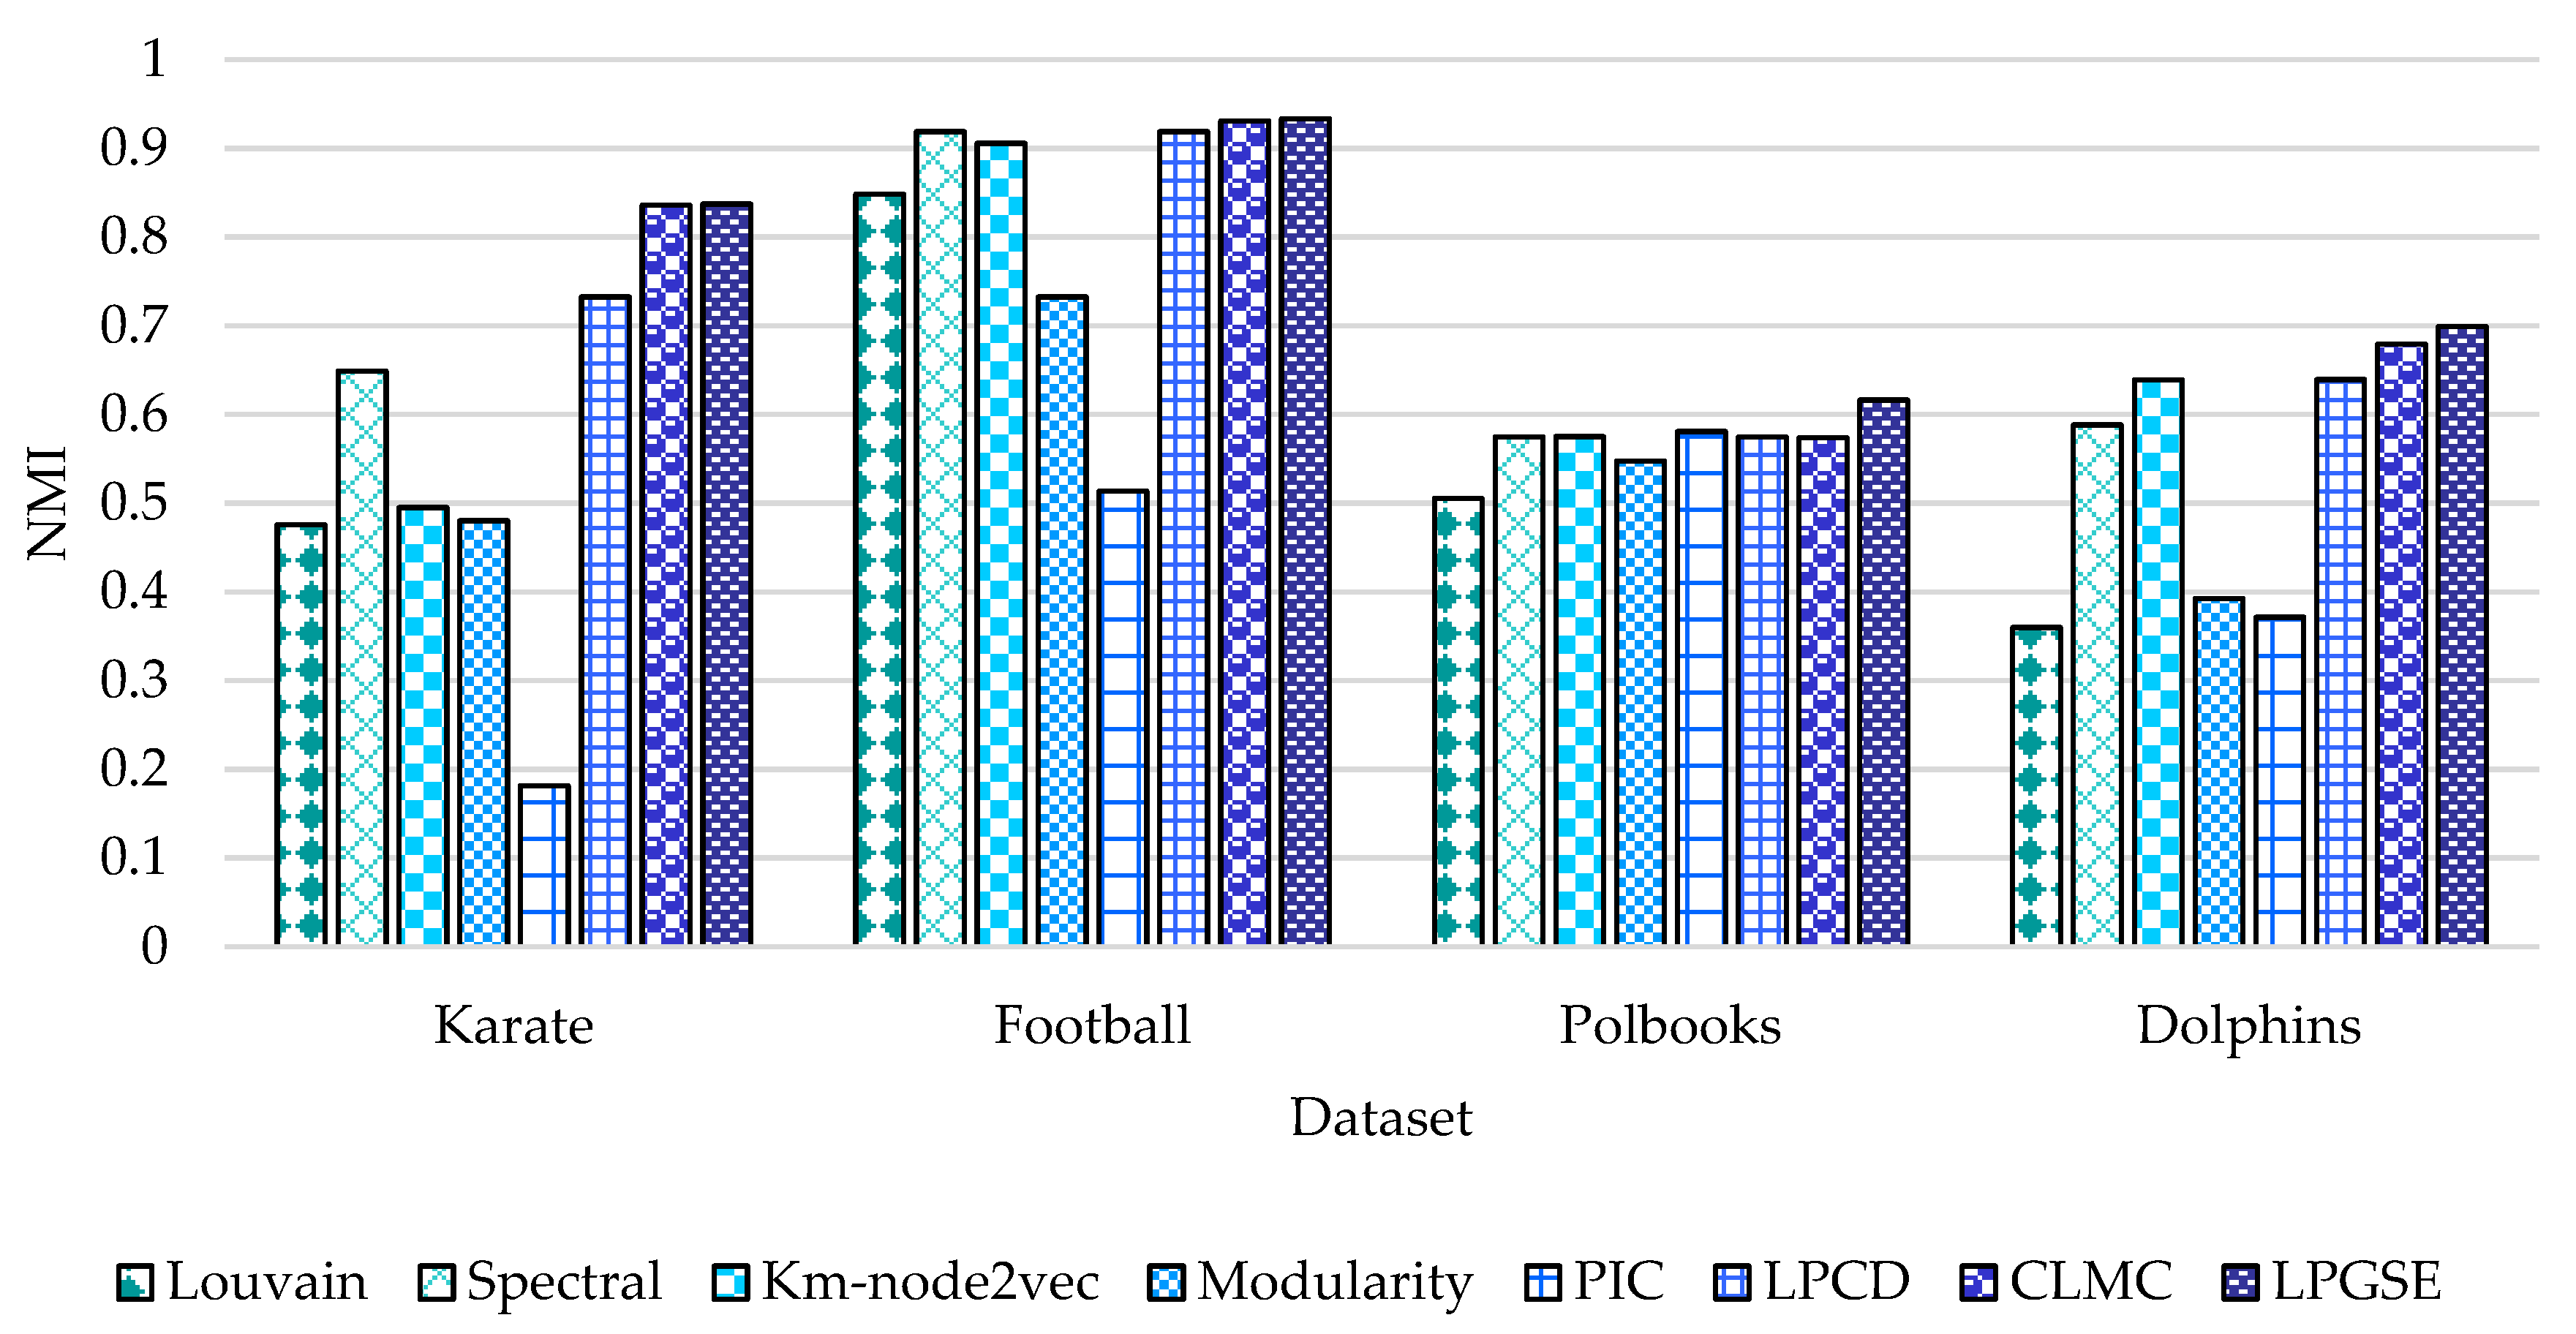
It is clear from the above table that traditional community detection algorithms have limitations in dealing with networks with incomplete structures. In the face of incomplete network structure, the performance of the NMI and ARI indicators of algorithms such as Louvain, Spectral, and Km-node2vec is greatly affected. The design of these traditional community detection algorithms is based on the premise of complete networks, so their effectiveness in dealing with incomplete networks is severely limited. However, some community detection algorithms designed specifically for incomplete network structures compensate for this deficiency to some extent, making them outperform traditional algorithms in NMI and ARI metrics. For example, LPCD, CLMC, and LPGSE complete the missing edges by using the link prediction method, which reduces the impact of incomplete network structure on the community detection task.
Among these algorithms, LPGSE, as a novel algorithm proposed in this study, showed better performance in various algorithm comparisons. Compared with the best traditional community detection algorithm, LPGSE improved by 29.0780% and 31.9820% in the NMI and ARI indexes in the Karate dataset; NMI and ARI increased by 1.5781% and 2.1980%, respectively; NMI and AMI improved by 6.060% and 0.4332% in the Polbooks dataset; NMI and ARI increased by 9.3726% and 7.7568% in the Dolphins dataset. Moreover, compared with the community detection algorithms of the same type for incomplete network structure, LPGSE also outperformed the other algorithms on all the datasets. From Figure 3 and Figure 4, we can see more intuitively that LPGSE exhibits improved NMI and ARI on different datasets.
By accumulating NMI and ARI metrics on four network datasets, the algorithm performance can be comprehensively evaluated in different scenarios to more accurately demonstrate the reliability and applicability of the algorithm. It can be seen from Figure 5 and Figure 6 that by comparing the comprehensive performance of different algorithms on the four datasets, the LPGSE algorithm has obvious advantages in handling the detection problem with incomplete network structures. This result further confirms the stability and effectiveness of the LPGSE algorithm in the face of incomplete networks.
To demonstrate the stability of the LPGSE algorithm, we conducted a set of experiments on the Karate dataset with different proportions of missing edges. By comparing the experimental results of various algorithms in these different edge-missing ratios, we evaluated the performance of LPGSE in different situations. The experimental results of the various algorithms with different proportions of deletions are presented in Table 3 and Table 4.
In order to more intuitively observe the changes of NMI and ARI indexes in different Karate networks with different edge-missing ratios by different algorithms, the data in the above table are plotted as a line diagram. As shown in Figure 7 and Figure 8, this will more intuitively compare and analyze the performance of different algorithms under the missing proportion of different edges.
From the above line diagram, it can be clearly observed that, in the Karate network, the LPGSE algorithm still shows good performance in different edge-missing ratios. In the face of different degrees of edge deletion, the NMI and ARI indicators of the LPGSE algorithm fluctuate less, which means that the algorithm can maintain high accuracy and stability of community detection. This feature is important for dealing with the unstable or absent network structure in real life.
6. Conclusions
Community detection in the network is an area of ongoing active research. The development of new algorithms has received significant attention, focusing in particular on improving accuracy and dealing with incomplete data. However, the vast majority of community detection algorithms are based on the assumption that the network is fully observed, which leads to incomplete data being ignored. To address the above problems, this paper proposes a framework called LPGSE. The goal is to estimate an optimal graph by using a combination of link prediction, graph representation learning, and probability estimation, and, finally, to conduct a community detection task on the optimal graph. Extensive experiments demonstrated the accuracy of our proposed algorithm. We also tried different settings of edge-missing ratios, and analyzed the performance of different algorithms in these cases by comparison. The results show that the model can still maintain high community detection accuracy and stability when processing network data with different edge-missing ratios.
Author Contributions
Conceptualization, D.C.; formal analysis, M.N. and D.W.; funding acquisition, D.C.; methodology, D.C., M.N. and F.X.; project administration, D.C. and D.W.; resources, D.W.; software, F.X.; supervision, D.C.; validation, M.N.; visualization, M.N., F.X. and H.C.; writing—original draft, F.X.; writing—review and editing, D.C., M.N. and H.C. All authors have read and agreed to the published version of the manuscript.
Funding
This work was supported in part by the Applied Basic Research Project of Liaoning Province under Grant 2023JH2/101300185, in part by the Key Technologies Research and Development Program of Liaoning Province in China under Grant 2021JH1/10400079, in part by the Fundamental Research Funds for the Central Universities under Grant N2217002, and in part by the Natural Science Foundation of Liaoning Provincial Department of Science and Technology under Grant No.2022-KF-11-04.
Data Availability Statement
The raw data supporting the conclusions of this article will be made available by the authors on request.
Conflicts of Interest
The authors declare no conflicts of interest.
References
- MacMahon, M.; Garlaschelli, D. Community detection for correlation matrices. arXiv 2013, arXiv:1311.1924. [Google Scholar] [CrossRef]
- Newman, M.E.J.; Girvan, M. Finding and evaluating community structure in networks. Phys. Rev. E 2004, 69, 026113. [Google Scholar] [CrossRef] [PubMed]
- Li, J.; Zhang, H.; Han, Z.; Rong, Y.; Cheng, H.; Huang, J. Adversarial attack on community detection by hiding individuals. In Proceedings of the Web Conference, Taipei, Taiwan, 20–24 April 2020; pp. 917–927. [Google Scholar]
- Rozemberczki, B.; Davies, R.; Sarkar, R.; Sutton, C. Gemsec: Graph embedding with self clustering. In Proceedings of the 2019 IEEE/ACM International Conference on Advances in Social Networks Analysis and Mining, Vancouver British, CO, Canada, 27–30 August 2019; pp. 65–72. [Google Scholar]
- Wang, X.; Cui, P.; Wang, J.; Pei, J.; Zhu, W.; Yang, S. Community preserving network embedding. In Proceedings of the AAAI Conference on Artificial Intelligence, San Francisco, CA, USA, 4–9 February 2017. [Google Scholar]
- Ball, B.; Karrer, B.; Newman, M.E. Efficient and principled method for detecting communities in networks. Phys. Rev. E 2011, 84, 036103. [Google Scholar] [CrossRef] [PubMed]
- He, D.; Li, S.; Jin, D.; Jiao, P.; Huang, Y. Self-Guided Community Detection on Networks with Missing Edges. In Proceedings of the IJCAI, Virtual, 19–26 August 2021; pp. 3508–3514. [Google Scholar]
- Ye, F.; Chen, C.; Zheng, Z. Deep autoencoder-like nonnegative matrix factorization for community detection. In Proceedings of the 27th ACM International Conference on Information and Knowledge Management, Torino, Italy, 22–26 October 2018. [Google Scholar]
- Zhang, H.; King, I.; Lyu, M. Incorporating implicit link preference into overlapping community detection. In Proceedings of the AAAI Conference on Artificial Intelligence, Austin, TX, USA, 25–30 February 2015. [Google Scholar]
- Marsden, P.V. Network data and measurement. Annu. Rev. Sociol. 1990, 16, 435–463. [Google Scholar] [CrossRef]
- Lin, W.; Kong, X.; Yu, P.S.; Wu, Q.; Jia, Y.; Li, C. Community detection in incomplete information networks. In Proceedings of the 21st International Conference on World Wide Web, Lyon, France, 16–20 April 2012. [Google Scholar]
- Burgess, M.; Adar, E.; Cafarella, M. Link-prediction enhanced consensus clustering for complex networks. PLoS ONE 2016, 11, e0153384. [Google Scholar] [CrossRef]
- Zhang, S.K.; Li, C.T.; Lin, S.D. A joint optimization framework for better community detection based on link prediction in social networks. Knowl. Inf. Syst. 2020, 62, 4277–4296. [Google Scholar] [CrossRef]
- Acquisti, A.; Brandimarte, L.; Loewenstein, G. Privacy and human behavior in the age of information. Science 2015, 347, 509–514. [Google Scholar] [CrossRef] [PubMed]
- Dey, R.; Jelveh, Z.; Ross, K. Facebook users have become much more private: A large-scale study. In Proceedings of the 2012 IEEE International Conference on Pervasive Computing and Communications Workshops, Lugano, Switzerland, 19–23 March 2012. [Google Scholar]
- Xin, X.; Wang, C.; Ying, X.; Wang, B. Deep community detection in topologically incomplete networks. Phys. A Stat. Mech. Its Appl. 2017, 469, 342–352. [Google Scholar] [CrossRef]
- Yan, B.; Gregory, S. Detecting community structure in networks using edge prediction methods. J. Stat. Mech. Theory Exp. 2012, 2012, P09008. [Google Scholar] [CrossRef]
- Yan, B.; Gregory, S. Finding missing edges and communities in incomplete networks. Phys. A Math. Theor. 2011, 44, 495102. [Google Scholar] [CrossRef]
- Kim, M.; Leskovec, J. The network completion problem: Inferring missing nodes and edges in networks. In Proceedings of the 2011 SIAM International Conference on Data Mining, Mesa, AZ, USA, 28–30 April 2011. [Google Scholar]
- Xue, Y.; Bogdan, P. Reconstructing missing complex networks against adversarial interventions. Nat. Commun. 2019, 10, 1738. [Google Scholar] [CrossRef] [PubMed]
- Du, L.; Lu, Z.; Wang, Y.; Song, G.; Wang, Y.; Chen, W. Galaxy network embedding: A hierarchical community structure preserving approach. In Proceedings of the IJCAI, Stockholm, Sweden, 13–19 July 2018. [Google Scholar]
- Du, L.; Wang, Y.; Song, G.; Lu, Z.; Wang, J. Dynamic network embedding: An extended approach for skip-gram based network embedding. In Proceedings of the IJCAI, Stockholm, Sweden, 13–19 July 2018. [Google Scholar]
- Wu, Z.; Pan, S.; Chen, F.; Long, G.; Zhang, C.; Philip, S.Y. A comprehensive survey on graph neural networks. IEEE Trans. Neural Netw. Learn. Syst. 2020, 32, 4–24. [Google Scholar] [CrossRef]
- Tran, C.; Shin, W.Y.; Spitz, A. Community detection in partially observable social networks. ACM Trans. Knowl. Discov. Data 2021, 16, 1–24. [Google Scholar] [CrossRef]
- Shao, J.; Zhang, Z.; Yu, Z.; Wang, J.; Zhao, Y.; Yang, Q. Community Detection and Link Prediction via Cluster-driven Low-rank Matrix Completion. In Proceedings of the IJCAI, Macao, China, 10–16 August 2019. [Google Scholar]
- Chen, M.; Zhang, Y.; Zhang, Z.; Du, L.; Wang, S.; Zhang, J. Inferring network structure with unobservable nodes from time series data. Chaos Interdiscip. J. Nonlinear Sci. 2022, 32, 013126. [Google Scholar] [CrossRef] [PubMed]
- Smiljanić, J.; Blöcker, C.; Edler, D.; Rosvall, M. Mapping flows on weighted and directed networks with incomplete observations. J. Complex Netw. 2021, 9, cnab044. [Google Scholar] [CrossRef]
- Xu, D.; Ruan, C.; Motwani, K.; Korpeoglu, E.; Kumar, S.; Achan, K. Generative graph convolutional network for growing graphs. In Proceedings of the ICASSP 2019—2019 IEEE International Conference on Acoustics, Speech and Signal Processing, Brighton, UK, 12–17 May 2019. [Google Scholar]
- Hou, Y.; Tran, C.; Shin, W.-Y. Meta-code: Community detection via exploratory learning in topologically unknown networks. In Proceedings of the 31st ACM International Conference on Information & Knowledge Management, Atlanta, GA, USA, 17–21 October 2022. [Google Scholar]
- Tran, C.; Shin, W.-Y.; Spitz, A.; Gertz, M. DeepNC: Deep Generative Network Completion. IEEE Trans. Pattern Anal. Mach. Intell. 2022, 44, 1837–1852. [Google Scholar] [CrossRef] [PubMed]
- Zhang, M.; Chen, Y. Weisfeiler-lehman neural machine for link prediction. In Proceedings of the 23rd ACM SIGKDD International Conference on Knowledge Discovery and Data Mining, Halifax, NS, Canada, 13–17 August 2017. [Google Scholar]
- Wang, R.; Mou, S.; Wang, X.; Xiao, W.; Ju, Q.; Shi, C.; Xie, X. Graph structure estimation neural networks. In Proceedings of the Web Conference 2021, Ljubljana Slovenia, 19–23 April 2021. [Google Scholar]
- Ng, A.; Jordan, M.; Weiss, Y. On spectral clustering: Analysis and an algorithm. Adv. Neural Inf. Process. Syst. 2001, 14, 849–856. [Google Scholar]
- You, J.; Ying, R.; Ren, X.; Hamilton, W.; Leskovec, J. Graphrnn: Generating realistic graphs with deep auto-regressive models. In Proceedings of the International Conference on Machine Learning, Stockholm, Sweden, 10–15 July 2018. [Google Scholar]
- Dempster, A.P.; Laird, N.M.; Rubin, D.B. Maximum likelihood from incomplete data via the EM algorithm. J. R. Stat. Soc. Ser. B (Methodol.) 1977, 39, 1–22. [Google Scholar] [CrossRef]
- Blondel, V.D.; Guillaume, J.L.; Lambiotte, R.; Lefebvre, E. Fast unfolding of communities in large networks. J. Stat. Mech. Theory Exp. 2008, 2008, P10008. [Google Scholar] [CrossRef]
- Von Luxburg, U. A tutorial on spectral clustering. Stat. Comput. 2007, 17, 395–416. [Google Scholar] [CrossRef]
- Newman, M.E. Modularity and community structure in networks. Proc. Natl. Acad. Sci. USA 2006, 103, 8577–8582. [Google Scholar] [CrossRef] [PubMed]
Figure 1.
Model framework of LPGSE.

Figure 2.
Model framework of .

Figure 3.
NMI values of different algorithms on the four datasets: Karate, Football, Polbooks, and Dolphins.
Figure 3.
NMI values of different algorithms on the four datasets: Karate, Football, Polbooks, and Dolphins.

Figure 4.
ARI values of different algorithms on the four datasets: Karate, Football, Polbooks, and Dolphins.
Figure 4.
ARI values of different algorithms on the four datasets: Karate, Football, Polbooks, and Dolphins.

Figure 5.
The accumulated NMI values of different algorithms on the four datasets: Karate, Football, Polbooks, and Dolphins.
Figure 5.
The accumulated NMI values of different algorithms on the four datasets: Karate, Football, Polbooks, and Dolphins.

Figure 6.
The accumulated ARI values of different algorithms on the four datasets: Karate, Football, Polbooks, and Dolphins.
Figure 6.
The accumulated ARI values of different algorithms on the four datasets: Karate, Football, Polbooks, and Dolphins.

Figure 7.
The NMI value changes of various algorithms under different edge-loss ratios in the Karate network.
Figure 7.
The NMI value changes of various algorithms under different edge-loss ratios in the Karate network.

Figure 8.
The ARI value changes of various algorithms under different edge-loss ratios in the Karate network.
Figure 8.
The ARI value changes of various algorithms under different edge-loss ratios in the Karate network.


Table 1.
Statistical information on datasets.
| Dataset | Number of Nodes | Number of Edges | Category |
|---|---|---|---|
| Zachary’s karate club | 34 | 78 | 2 |
| Football | 115 | 613 | 12 |
| Political books | 105 | 441 | 2 |
| Dolphin social network | 62 | 160 | 3 |
Table 2.
Experimental results of different algorithms on Karate, Football, Polbooks, and Dolphins.
| Method | Karate | Football | Polbooks | Dolphins | ||||
|---|---|---|---|---|---|---|---|---|
| NMI | ARI | NMI | ARI | NMI | ARI | NMI | ARI | |
| Louvain | 0.4756 | 0.3583 | 0.8485 | 0.6946 | 0.5052 | 0.5299 | 0.3600 | 0.2047 |
| Spectral | 0.6486 | 0.6685 | 0.9188 | 0.8917 | 0.5745 | 0.6745 | 0.5883 | 0.6957 |
| Km-node2vec | 0.4949 | 0.5720 | 0.9054 | 0.8683 | 0.5751 | 0.6889 | 0.6391 | 0.7516 |
| Modularity | 0.4801 | 0.3579 | 0.7326 | 0.5032 | 0.5475 | 0.6559 | 0.3924 | 0.2366 |
| PIC | 0.1813 | 0.1004 | 0.5134 | 0.2509 | 0.5809 | 0.6926 | 0.3714 | 0.2469 |
| LPCD | 0.7324 | 0.7719 | 0.9188 | 0.8918 | 0.5745 | 0.6745 | 0.6394 | 0.7523 |
| CLMC | 0.8361 | 0.8819 | 0.9308 | 0.9063 | 0.5736 | 0.6946 | 0.6792 | 0.8004 |
| LPGSE | 0.8372 | 0.8823 | 0.9333 | 0.9113 | 0.6161 | 0.6956 | 0.6990 | 0.8099 |
Table 3.
The NMI values of different algorithms under different edge-loss ratios in the Karate network.
Table 3.
The NMI values of different algorithms under different edge-loss ratios in the Karate network.
| Ratio of Missing Edges | 10% | 15% | 20% | 25% | 30% | 35% | 40% |
|---|---|---|---|---|---|---|---|
| Modularity | 0.4801 | 0.5809 | 0.5267 | 0.3797 | 0.5469 | 0.4261 | 0.4196 |
| Km-node2vec | 0.4949 | 0.6486 | 0.7324 | 0.6486 | 0.5778 | 0.2439 | 0.2065 |
| Spectral | 0.6486 | 0.7324 | 0.7324 | 0.2825 | 0.6485 | 0.4273 | 0.2825 |
| Louvain | 0.4756 | 0.5077 | 0.5267 | 0.5005 | 0.4371 | 0.4047 | 0.4196 |
| LPCD | 0.7324 | 0.7324 | 0.7324 | 0.2825 | 0.4273 | 0.4949 | 0.2439 |
| CLMC | 0.8361 | 0.8361 | 0.4949 | 0.5756 | 0.5778 | 0.0930 | 0.0110 |
| LPGSE | 0.8372 | 0.8372 | 0.7324 | 0.6486 | 0.7324 | 0.5756 | 0.4949 |
Table 4.
The ARI values of different algorithms under different edge-loss ratios in the Karate network.
Table 4.
The ARI values of different algorithms under different edge-loss ratios in the Karate network.
| Ratio of Missing Edges | 10% | 15% | 20% | 25% | 30% | 35% | 40% |
|---|---|---|---|---|---|---|---|
| Modularity | 0.3579 | 0.5897 | 0.3924 | 0.2705 | 0.4691 | 0.2726 | 0.2733 |
| Km-node2vec | 0.5720 | 0.6685 | 0.7717 | 0.6685 | 0.5725 | 0.1089 | 0.0724 |
| Spectral | 0.6685 | 0.7717 | 0.7717 | 0.1528 | 0.6685 | 0.4831 | 0.1528 |
| Louvain | 0.3583 | 0.4285 | 0.3924 | 0.4064 | 0.3590 | 0.2662 | 0.2733 |
| LPCD | 0.7719 | 0.7717 | 0.7717 | 0.1528 | 0.4831 | 0.5720 | 0.1089 |
| CLMC | 0.8819 | 0.8819 | 0.5720 | 0.6682 | 0.5725 | 0.0072 | 0.0064 |
| LPGSE | 0.8823 | 0.8823 | 0.7717 | 0.6685 | 0.7717 | 0.6682 | 0.5720 |
Disclaimer/Publisher’s Note: The statements, opinions and data contained in all publications are solely those of the individual author(s) and contributor(s) and not of MDPI and/or the editor(s). MDPI and/or the editor(s) disclaim responsibility for any injury to people or property resulting from any ideas, methods, instructions or products referred to in the content. |
© 2024 by the authors. Licensee MDPI, Basel, Switzerland. This article is an open access article distributed under the terms and conditions of the Creative Commons Attribution (CC BY) license (https://creativecommons.org/licenses/by/4.0/).
Share and Cite
MDPI and ACS Style
Chen, D.; Nie, M.; Xie, F.; Wang, D.; Chen, H. Link Prediction and Graph Structure Estimation for Community Detection. Mathematics 2024, 12, 1269. https://doi.org/10.3390/math12081269
AMA Style
Chen D, Nie M, Xie F, Wang D, Chen H. Link Prediction and Graph Structure Estimation for Community Detection. Mathematics. 2024; 12(8):1269. https://doi.org/10.3390/math12081269
Chicago/Turabian StyleChen, Dongming, Mingshuo Nie, Fei Xie, Dongqi Wang, and Huilin Chen. 2024. "Link Prediction and Graph Structure Estimation for Community Detection" Mathematics 12, no. 8: 1269. https://doi.org/10.3390/math12081269
Note that from the first issue of 2016, this journal uses article numbers instead of page numbers. See further details here.