

Spatial Network Analysis of Coupling Coordination between Digital Financial Inclusion and Common Prosperity in the Yangtze River Delta Urban Agglomeration

1
School of Foreign Studies, Yiwu Industrial & Commercial College, Yiwu 322000, China
2
Graduate School, Lyceum of the Philippines University, Batangas 4200, Philippines
3
Institute of Common Prosperity, Jiangsu University, Zhenjiang 212013, China
4
School of Economics & Management, University of Science and Technology Beijing, Beijing 100083, China
*
Author to whom correspondence should be addressed.
Mathematics 2024, 12(9), 1285; https://doi.org/10.3390/math12091285
Submission received: 14 March 2024
/
Revised: 18 April 2024
/
Accepted: 22 April 2024
/
Published: 24 April 2024
(This article belongs to the Special Issue Mathematical Modelling of Economics and Regional Development)
Abstract
:Digital financial inclusion and common prosperity are pivotal elements in promoting the sustainable socioeconomic development of China. This study introduces a novel Multi-Criteria Decision Analysis (MCDA) method to evaluate the Common Prosperity Index (CPI). Using this index, alongside the Digital Financial Inclusion Index (DFII) released by Peking University, it examines the evolution of the coupling coordination relationship between digital financial inclusion and common prosperity within the Yangtze River Delta (YRD) urban agglomeration from 2011 to 2021. By integrating gravity models and social network analysis, in this paper, we thoroughly investigate the spatiotemporal evolution characteristics of the spatial network of this coupling coordination relationship. The results indicate that both the DFII and CPI generally exhibit an upward trend, but the decline in the coupling degree reflects a weakened interaction strength between them. Specifically, Anhui significantly lags behind Jiangsu, Zhejiang, and Shanghai in the development of digital financial inclusion and common prosperity, indicating regional development imbalances. Furthermore, the strength of spatial connections in city coupling coordination has significantly increased, with Nanjing’s siphon effect on cities in Anhui becoming markedly stronger, and the number of core cities in the network increasing, which demonstrates a geographical proximity feature in network development. Additionally, the overall network characteristics are transitioning towards higher density and “small-world” properties, suggesting a trend toward network stabilization. The disparity in centrality among cities has decreased, with an overall enhancement in centrality, where the spatial spillover effects from core areas such as Hangzhou-Ningbo, Nanjing-Changzhou, and Shanghai-Suzhou-Wuxi significantly promote the development of peripheral cities. Based on these findings, this paper proposes policy recommendations for the sustainable development of digital financial inclusion and common prosperity in the YRD region.
Keywords:
digital financial inclusion; common prosperity; coupling coordination relationship; social network analysis; spatial spillover effectsMSC:
91-10; 91B721. Introduction
In the new era of sustainable socioeconomic development and continuous breakthroughs in technology and innovation, digital financial inclusion and common prosperity have garnered significant attention from the academic community. As outlined in the G20 Summit White Paper of 2016, digital financial inclusion encompasses a range of initiatives designed to leverage digital financial services to enhance inclusivity in the financial domain. These services are epitomized by their accessibility, convenience, cost-effectiveness, and minimal barriers, offering innovative solutions to the challenges inherent in inclusive finance [1]. Simultaneously, the pursuit of common prosperity, a pivotal developmental objective within Chinese societal frameworks, aims to improve standards of affluence and public welfare [2]. This is achieved through the optimization of distributive mechanisms amid high-quality economic growth, aiming to progressively reduce disparities in societal wealth.
The rise of digital financial inclusion has pioneered a financial service paradigm that transcends geographical boundaries and socioeconomic barriers, serving a broader populace. This concept of financial empowerment aligns with the vision of common prosperity, making the coordinated development of digital financial inclusion and common prosperity a crucial dynamic force in shaping the contemporary economic landscape. Research has shown that the extensive coverage and deep application of digital financial inclusion play a significant role in advancing common prosperity. For instance, promoting digital financial inclusion can enhance financing efficiency, stimulate entrepreneurial vigor, and foster technological innovation, thereby facilitating the achievement of common prosperity goals [3,4].
However, leveraging digital financial inclusion to achieve common prosperity requires the backing of strong financial regulatory policies and a supportive financial market ecosystem. As efforts towards common prosperity advance, regulatory frameworks in various sectors, including the financial domain, are expected to evolve, thus stimulating a diverse array of financial services and contributing to the healthy development of the financial market environment. Therefore, the relationship between digital financial inclusion and common prosperity should be viewed as a reciprocal and evolving dynamic. Despite this, existing studies often focus solely on the impact of digital financial inclusion on common prosperity, with few exploring the feedback effects of common prosperity on digital financial inclusion. Thus, this study primarily focuses on the coupling coordination between digital financial inclusion and common prosperity.
Given the heterogeneity of regional resource endowments, the levels of coupling coordination among diverse economic systems often manifest regional disparities. Urban agglomerations, in this regard, provide an exemplary lens through which to scrutinize such regional variances. Within the Chinese context, urban agglomerations, which are conglomerations of geographically proximate cities exhibiting high degrees of economic, social, and cultural integration with intrinsic connectivity and networked attributes, embody a crucial vector for economic development [5]. The YRD urban agglomeration, distinguished as one of the most economically vibrant urban agglomerations within China, assumes critical importance in examining the coupling coordination development between digital financial inclusion and common prosperity.
Geographical economics research has demonstrated that regional development disparities could evolve into issues of unbalanced regional development or lead to phenomena such as the “siphon effect” and the “radiating effect” in regional development [6,7,8]. Efficacious cross-regional collaborative frameworks have the potential to magnify the radiating effects from more developed to less developed regions, significantly enhancing the digital allocation of financial resources and spurring innovative outputs, thus advancing the cause of common prosperity [9,10]. The interactivity between regional financial institutions and government departments can enhance the levels of digital finance and common prosperity. Moreover, the spatial interconnections and spillover effects emanating from inter-regional factor flows are poised to further foster the coupling coordination development between digital financial inclusion and common prosperity. Constructing a coupling coordination spatial network is advocated as a strategy to engender effective cross-regional cooperation modalities [11]. However, optimizing such a spatially imbalanced network is a crucial issue that needs addressing. Therefore, this paper investigates the spatial network characteristics of the coordinated development between digital financial inclusion and common prosperity from a spatial network perspective, offering policy recommendations for network structure optimization.
In summary, this paper focuses on the YRD urban agglomeration to study the coupling coordination relationship between digital financial inclusion and common prosperity from 2011 to 2021. The research steps are as follows: Firstly, a new set of common prosperity evaluation indicators is constructed, and a novel MCDA method is proposed to calculate the CPI; secondly, a coupling coordination model is used to analyze the spatiotemporal evolution characteristics of the coupling coordination between digital financial inclusion and common prosperity; finally, the social network analysis is applied to analyze the spatial network structure of the coupling coordination between digital financial inclusion and common prosperity. The specific research framework is shown in Figure 1.
2. Literature Review
2.1. Measurement of Digital Financial Inclusion and Common Prosperity
DFII and CPI serve as pivotal metrics for gauging the inclusiveness of finance and the equitable distribution of wealth, respectively. They provide crucial data support for policy development and research in related areas. The calculation of such indices typically involves constructing an indicator system, standardizing indicators, determining indicator weights, and synthesizing indices, which methodologically is a classic MCDA problem.
Currently, the Digital Financial Inclusion Index of China (PKU-DFIIC), developed by Peking University, is widely adopted within the Chinese academic community. This index primarily employs the Analytical Hierarchy Process (AHP) to determine the weights of indicators, and the DFII is calculated using a weighted arithmetic mean, illustrating a classic MCDA method used for index determination. Since its release, the PKU-DFIIC has been widely used in academia to explore the relationships between digital financial inclusion and various socioeconomic dimensions, including household consumption, corporate environmental performance, multidimensional poverty reduction, innovation in small and medium-sized enterprises (SMEs), and the influence on factor flow and industrial structure upgrading [1,12,13,14,15]. These studies cover multiple dimensions, from the household level to the macroeconomic level, gradually establishing the PKU-DFIIC as an authoritative index for research related to digital financial inclusion. Therefore, this paper also utilizes the PKU-DFIIC to study the coupling coordination relationship between digital financial inclusion and common prosperity.
With the advancement of the goal of common prosperity, research related to the measurement of the CPI has become increasingly comprehensive. Researchers such as Yang et al. [16] and Jiang et al. [17] developed an evaluative system framework for common prosperity earlier but did not delve deeply into the evaluation methods. Subsequently, some scholars began to use the entropy method to calculate the regional CPI [18,19]. Considering that the traditional entropy method may not fully consider the correlation between indicators and is sensitive to outliers, Liu et al. [20,21] introduced an improved entropy weighting method for calculating the CPI in their research. To enhance the comparability of common prosperity development levels among regions, Xie et al. [22] and Cheng et al. [23] combined the entropy weighting method with the TOPSIS method to calculate the CPI for Chinese provinces and rural China, respectively. Meanwhile, MCDA methods that integrate Principal Component Analysis (PCA) [24] and Grey Relational Analysis (GRA) [25] with TOPSIS have also begun to be applied in the field of measuring the CPI. Entropy, PCA, and GRA are common objective weighting methods that may not fully reflect the decision-making environment’s actual situation due to their reliance on objective weighting, which lacks subjective initiative. However, using only subjective weighting methods may impact the fairness of decision-making. Hence, there is a need to develop a new MCDA method for calculating the CPI to enhance the scientific validity of CPI calculations.
2.2. The Relationship between Digital Financial Inclusion and Common Prosperity
Recent studies have confirmed the multifaceted impacts and mechanisms of digital financial inclusion on achieving common prosperity. Ge et al. [26] conducted an initial analysis on this topic by exploring the effects of the rural inclusive financial ecological environment on the income of rural households in China. Their findings underscore the critical role of an inclusive financial ecosystem in augmenting rural income levels, thus contributing to common prosperity. Expanding upon this foundation, Fang [27] examined the influence of digital finance in enhancing individual charitable contributions within China, providing empirical evidence that digital financial services cultivate a culture of philanthropy, an essential element of common prosperity. Zhang et al. [2] further investigated the impact of digital financial inclusion on common prosperity and its underlying mechanisms, identifying key channels through which digital financial services facilitate equitable economic growth. Additionally, Zhao et al. [28] explored the contribution of regional innovation in amplifying the effects of digital financial inclusion on common prosperity, positing that innovation serves as a pivotal catalyst in maximizing the advantages of digital financial services. Moreover, digital financial inclusion can also influence the upgrading of consumer behavior among Chinese residents, thereby facilitating the realization of common prosperity [29].
Informed by Von Bertalanffy’s Systems Theory [30], this study acknowledges the intricate interplay and mutual dependency of elements within socioeconomic networks, as exemplified by the relationship between digital financial inclusion and common prosperity. While the prevailing literature underscores digital financial inclusion’s significant role in fostering an environment conducive to common prosperity, the inquiry into how common prosperity might reciprocally influence digital financial inclusion remains less developed. Addressing this gap, the current article employs Systems Theory to depict a schematic diagram illustrating the coupling coordination mechanism between these two constructs (Figure 2). Digital financial inclusion, as portrayed in Figure 2, comprises accessibility, optimization of economic efficiency, and provision of customized financial solutions. This environment, proliferative and inclusive by nature, ostensibly benefits the diffusion and accessibility of financial services, resource allocation efficiency, support for small-scale enterprises and agricultural sectors, enhanced social welfare, and the facilitation of economic structural enhancement. Conversely, the achievement of common prosperity—with its inherent focus on shareability, development, and sustainability—purportedly promotes vigorous market demand, policy support, capital growth, technological diffusion, and innovation, while reinforcing the financial credit system.
However, the envisioned coupling coordination mechanism faces several challenges that could disrupt this harmonious interaction. Challenges such as technological disparities, regulatory hurdles, economic downturns, social inequity, and environmental changes could pose significant obstacles to digital financial inclusion [31]. Moreover, the digital divide and regulatory challenges identified in various regions highlight the intricacies of implementing fintech innovations effectively [32]. Furthermore, ethical concerns associated with the deployment of artificial intelligence in the banking sector underscore the complexity of ensuring inclusive and equitable financial services [33]. These factors collectively demonstrate that while the coupling coordination mechanism between digital financial inclusion and common prosperity offers a pathway to socioeconomic advancement, they also necessitate a nuanced understanding of potential barriers to sustainably achieving its objectives.
2.3. Research on Coupling Coordination Degree
Research into the coupling coordination degree (CCD) significantly contributes to understanding the interactions and mutual influences among various socioeconomic subsystems. To date, extensive studies have explored the coupling coordination of numerous socioeconomic subsystems [34,35,36]. Yet, investigations into coupling coordination concerning digital financial inclusion or common prosperity remain scarce. An et al. [37] employed the entropy method and the coupling coordination model to systematically evaluate the interaction between agricultural insurance and digital financial inclusion in China. Sun et al. [38] empirically examined the coupling coordination relationship and spatial interaction effects between digital financial inclusion and technological innovation. Zhang et al. [39] categorized common prosperity into three subsystems—wealth, equality, and sharing—and used the coupling coordination model to investigate their interrelations. Despite preliminary advancements in understanding the coupling coordination within digital financial inclusion and common prosperity domains, the exploration of their interplay warrants further research.
In summary, the current methodologies for measuring the CPI indicate room for enhancement, and there is a notable lack of discourse on the coupling coordination development between common prosperity and digital financial inclusion. Addressing these gaps, this study makes several contributions:
Firstly, this research devises an evaluation index system for common prosperity and introduces a novel MCDA method to assess the CPI in 27 cities within the YRD, broadening the scope of methodological approaches to gauge the level of common prosperity.
Secondly, this study quantifies the CCD between digital financial inclusion and common prosperity while also analyzing their spatiotemporal evolution to unveil the dynamic mechanisms underpinning their joint development.
Lastly, by employing social network analysis from a novel perspective of spatial networks, the analysis explores the coupled and coordinated spatial network structure between digital financial inclusion and common prosperity, for the first time. This approach not only enriches the existing research paradigm but also holds significant practical implications for regional development planning and decision-making.
3. Research Design
3.1. Study Area, Index System, and Data Source
3.1.1. Study Area
The YRD includes 27 central urban districts across three provinces and one city, with Shanghai serving as the core, and Nanjing and Hangzhou as sub-centers, as outlined in the “Regional Integration Development Plan for the YRD” (as shown in Figure 3). Given the national initiative to promote the integrated development of the YRD and the designation of Zhejiang Province as a demonstration zone for common prosperity, this area possesses significant economic, geographical, and political advantages for the development of digital financial inclusion and the achievement of common prosperity goals. Notably, despite covering only 2% of China’s land area, the YRD contributed approximately 20% of the nation’s GDP in 2021, highlighting its disproportionate impact on national economic output [40]. Moreover, the YRD’s significant contributions to carbon reduction through digital financial inclusion underscore its suitability as a model for sustainable economic and social development [41]. This economic vibrancy, coupled with the region’s strategic role in technological innovation and financial services, positions the YRD as a critical area for examining the coupling coordination between digital financial inclusion and common prosperity. Therefore, by investigating the spatial network characteristics of the coupling coordination between digital financial inclusion and common prosperity in the YRD, it is possible to identify potential barriers in the region’s development process. This study not only promotes the development of the YRD urban agglomeration but also provides insights for sustainable development in other urban agglomerations.
3.1.2. Index System and Data Sources
To assess the level of common prosperity within the urban agglomeration of the YRD, this study, informed by the existing literature [20,42,43,44,45], defines common prosperity across three dimensions: shareability, development, and sustainability. First, the dimension of shareability aims to evaluate whether the fruits of development are being equitably shared and whether economic gains are distributed fairly among all people. Indicators such as per capita disposable income and public safety expenditure reflect the general distribution of resources, while the urbanization rate and the urban–rural income ratio illustrate the evolution of economic disparities over time. Secondly, the dimension of development can reflect the level of prosperity in both the material and spiritual lives of the populace, measured through subdimensions such as cultural education, healthcare, infrastructure, and social security. Lastly, the sustainability index examines the harmony between economic and social development and the carrying capacity of the population, resources, and environment, assessing the long-term potential of openness to the world, technological innovation, and environmental and social ecology.
Following principles of scientific validity and data availability, 30 specific indicators were selected to construct an evaluation index system for common prosperity (Table 1). The primary sources of research data include the “China Urban Statistical Yearbook”, statistical bulletins from prefecture-level cities, and the Wind database. Missing data were addressed through interpolation methods.
3.2. A Novel MCDA Model for Measuring CPI
The measurement of CPI represents a typical MCDA issue. To address the lag in the development of measurement methods for common prosperity in existing research, this paper introduces a CPI measurement model that combines the Stepwise Weight Assessment Ratio Analysis (SWARA) Method based on the Removal Effects of Criteria (MEREC), and the Measurement of Alternatives and Ranking according to Compromise Solution (MARCOS). SWARA is a subjective weighting method that analyzes decision-makers’ preferences towards the priority of indicators, eliminating the need for consistency checks required by other subjective weighting methods, such as the AHP and Best Worst Method (BWM). This ensures simplicity and efficiency in computation [46]. MEREC is an objective weighting method proposed and validated by Keshavarz et al. [47], known for its superiority over other objective weighting methods like the entropy method and the Criteria Importance Through Inter-criteria Correlation (CRITIC). MARCOS is a novel MCDA ranking method based on compromise solutions, demonstrating greater robustness than the classical Technique for Order of Preference by Similarity to Ideal Solution (TOPSIS) method [48]. The basic process for measuring the CPI using the proposed method is as follows:
Step 1: Construct the initial decision matrix X. This step involves constructing a decision matrix that displays the rating or value of each criterion for each evaluation object. The elements in the matrix are denoted by xij, assuming m evaluation objects and n criteria, as shown below:
Step 2: Calculate the subjective weights of the indicators using the SWARA method and the objective weights using the MEREC method.
Step 3: Finally, apply the combined weights obtained from the subjective and objective weights in the MARCOS method to calculate the CPI for all evaluation objects.
Detailed descriptions of each method involved in these steps will be provided below.
3.2.1. Subjective Weighting Based on the Improved SWARA Method
The basic SWARA method assesses the subjective weights of indicators through evaluators’ rational judgments on the relative importance of adjacent indicators. To overcome the SWARA method’s limitations in addressing hesitancy, uncertainty, and probability in evaluation information, this paper employs the Probabilistic Language Terms (PLTs) proposed by Pang et al. [49]. This enhancement to the SWARA method improves the accuracy of the evaluation information. The granularity and meaning of PLTs in SWARA, as detailed in Table 2, are crucial for this process. According to research by Stanujkic et al. [50], The steps for determining the subjective weights of each indicator using the PLTs improved SWARA method are outlined below:
Step 1: Form a common prosperity evaluation expert group to establish the ordinal relationship among indicators, designating the j-th important indicator as Cj, where Cj-1 is considered more important than Cj.
Step 2: Calculate the importance of adjacent indicators, denoted as sj. The expert group employs PLTs to judge the relative importance of adjacent indicators, assuming the expert group, based on the definitions of probabilistic language [49] and the granularity of language provided in Table 2, specifies a PLT: . This indicates that the expert group believes that most of the time (with an 80% probability) the indicator Cj is strongly less important than Cj-1, and, occasionally (with a 20% probability), Cj is clearly less important than Cj-1. According to the transformation function provided by Geng et al. [51], this probabilistic language can be converted into a precise number, 0.514, which indicates that the relative importance of Cj to Cj-1 is 0.514. Using this calculation method, the relative importance sj between all indicators can be determined.
Step 3: Determine the coefficient Kj as follows:
Step 4: Determine the recalculated weight qj as follows:
Step 5: The relative weights of the evaluation criteria are determined as follows:
where denotes the relative subjective weight of criterion j.
3.2.2. Objective Weighting Based on MEREC
As outlined in Reference [47], the computational steps for the MEREC method are as follows:
Step 1: Normalization of X is carried out using Equation (5), resulting in the matrix , which is suitable for the MEREC method.
where represents the elements of matrix Y, B denotes benefit indicators, and C denotes cost indicators; these notations B and C will be similarly used throughout the text to represent benefit and cost indicators, respectively.
Step 2: Calculate the overall performance Si of the evaluation objects based on the evaluation matrix Y. In this step, a logarithmic measure with equal criterion weights is employed to determine the overall performance of the evaluation objects. Based on the normalized values obtained in the previous step, we ensure that smaller values produce larger performance values (Ui). This calculation uses the following formula:
Step 3: Calculate the performance of the evaluation objects by removing each indicator. This step employs a logarithmic measure similar to the previous one. The difference in this step is that the performance of the evaluation objects is calculated based on the removal of each indicator separately. Therefore, we have n sets of performance sets related to n indicators. denotes the overall performance of the i-th evaluation object concerning the removal of the j-th indicator. The following formula is used for the calculations in this step:
Step 4: Calculate the sum of absolute deviations. In this step, the effect of removing the j-th indicator is calculated based on the values obtained in Steps 2 and 3. Let Ej represent the effect of removing the j-th indicator. The following formula is used to calculate the value of Ej:
Step 5: Calculate the objective weights of the indicators:
3.2.3. Combined Weights
The combined subjective and objective weights are calculated using the Bayesian method [52]:
3.2.4. Measurement of CPI Based on the MARCOS Method
As detailed in Reference [48], the computational steps for the MARCOS method are as follows:
Step 1: By introducing the ideal (AI) and anti-ideal (AAI) solution into the initial evaluation matrix, an expanded matrix Xe is formed, as shown in Equation (11):
The AAI represents the worst evaluation object, while the AI possesses the best characteristics. The mathematical definitions of AAI and AI are provided through Equation (12):
Step 2: Normalization of Xe is carried out using Equation (13), resulting in the matrix , which is suitable for the MARCOS method.
where is an element of matrix Z, and and are elements in the augmented matrix Xe.
Step 3: Apply the weight calculation results to the elements in the matrix Z, performing weight processing to obtain a weighted normalized matrix . The calculation formula is as follows:
Step 4: Apply Equation (15) to calculate the utility ki of the evaluation objects. Here, represents the utility related to the ideal solution and is the utility related to the anti-ideal solution.
where represents the sum of the elements of the weighted normalized matrix V,.
Step 5: Determine the comprehensive score of the evaluation objects based on the utility function . In the context of this study, this comprehensive score is denoted as CPI. The utility function is the compromise of the observed evaluation object in relation to the ideal and anti-ideal solution. The greater the value of , the better. The formula is as follows:
where represents the level of common prosperity of the i-th evaluation object and represents the utility function in relation to the anti-ideal solution, while represents the utility function in relation to the ideal solution.
3.3. Coupling Coordination Degree Model
The CCD characterizes the level of interaction, coordination, and mutual enhancement between systems, reflecting the trend of various subsystems evolving from disorder and lack of coordination towards a state of orderly and harmonious coordination [53]. In this study, the DFII from Peking University and the CPI calculated through the SWARA-MEREC-MARCOS model are employed to represent the digital financial inclusion and common prosperity subsystems, respectively. Then, the coupling degree is used to measure the intensity of their mutual influence and interaction. Given the limitations of traditional models in capturing the full utility of the coupling degree, this paper introduces an improved CCD model for calculating the coupling degree [54]. The formula for calculating this index is as follows:
where DFII represents the level of digital financial inclusion of the evaluation object, CPI represents the degree of common prosperity achieved by the evaluation object, and C represents the coupling degree, with C ∈ [0,1]. A higher value of C indicates a greater degree of interconnection between the systems. The coupling degree only reflects the level of correlation between the two systems and does not reflect their actual development conditions [53]. For example, it is possible to have a situation where both systems have low values, but a high coupling degree, yet the significance of a high coupling value differs from a high-level coupling. Therefore, we use CCD to measure the level of coordinated development between digital financial inclusion and common prosperity. The calculation formula is as follows:
where H represents the CCD, H ∈ [0,1]; the closer H is to 1, the better the coupling coordination level. T is the coordination index, and and represent the importance of the two subsystems, respectively. Typically, and [55,56].
3.4. Spatial Network of Coupling Coordination between Digital Financial Inclusion and Common Prosperity
3.4.1. Construction of Spatial Connection Network
The gravity model, originally derived from the field of physics, can be transformed into a powerful tool for analyzing and predicting spatial attributes and interactions in the social sciences by appropriately adjusting the parameters and definitions of its components [55]. Extensive research has applied this model to studies of spatial layout and interactions (such as tourism, trade, population migration, etc.) [56]. The essence of spatial interaction reflected by the gravity model is the application of the concept of attraction between entities to the interactions between cities and regions, indicating that larger cities or those closer in proximity exert stronger mutual influences. This study improves the traditional gravity model to focus specifically on the spatial connection between digital financial inclusion and common prosperity in the YRD.
The improved model is presented in Formulas (19) and (20), where represents the spatial connection strength between cities i and j. The gravitational constant reflects the rate of contribution of city i towards the coupling coordination between i and j. and represent the year-end permanent populations of the respective cities, and and represent their Gross Domestic Product. and measure the coupling coordination degree between digital financial inclusion and common prosperity in the respective cities. The geographical distance between cities is denoted by . and represent the per capita GDP. is the economic distance between and , calculated based on geographical distance and per capita GDP. denotes the potential for spatial connections of i, the sum of a city‘s spatial connections with all cities within the study area, with higher values indicating tighter coupling and coordination of spatial connections with other cities. represents the degree of spatial connection affiliation of i, which is the proportion of the coupling and coordination spatial connection between i and a certain city in its spatial connection potential, reflecting the main direction of the city’s coupling and coordination spatial connection.
3.4.2. Spatial Network Analysis
According to the calculation results from Equation (19) in the gravity model, the gravity matrix of the digital financial inclusion and common prosperity coupling coordination network in the YRD can be obtained. In the matrix, the average value of each row is set as the threshold, values above this threshold are marked as 1, and those below as 0, thus producing a binarized matrix or spatial network matrix. This paper employs social network analysis methods to study this spatial network matrix. The social network analysis primarily involves calculating metrics such as network density, degree centrality, closeness centrality, and betweenness centrality, with their formulas provided below [57]:
D represents network density, M represents the number of edges in the network, and N denotes the number of city nodes in the network; represents degree centrality and indicates the number of direct connections a city has with other cities; stands for closeness centrality and is the shortest distance from i to j; denotes betweenness centrality, represents the number of connections through in all the paths from to , and denotes the total number of connections from to .
This study utilizes professional social network analysis tools such as Ucinet and NetworkX to calculate the above metrics and analyzes the spatial connection network from the following four aspects:
(1) Overall network characteristics [11]. This analysis aims to understand the breadth and density of the spatial connection network by calculating its global characteristics.
(2) Network centrality [11]. This analysis focuses on the importance and influence of certain nodes within the network, aiming to identify key participants or hubs within the network.
(3) Core-periphery structure [57]. In this structure, the network is divided into a highly interconnected core area and a peripheral area with fewer connections to the core. Core nodes are typically the most active or influential parts of the network, while peripheral nodes participate less. This analysis is designed to help understand the network’s hierarchy and power structure.
(4) Cohesive subgroups [57]. This analysis aims to identify tightly connected or highly interactive node groups within the network through clusters, factions, etc., revealing community structures within the network, which helps us to understand the patterns of information or behavior flow within the network.
4. Results
4.1. Evolution of Coupling Coordination
In this study, the CPI was calculated using the innovative SWARA-MEREC-MARCOS method. This approach utilized both SWARA and MEREC to derive subjective and objective weights for the evaluation indicators of common prosperity, respectively. These weights were then integrated to obtain comprehensive weights, with the calculation results presented in Table 1. The CPI was subsequently computed by combining comprehensive weights with the MARCOS method. A comparison of the method proposed in this paper with Entropy-TOPSIS [23], PCA-TOPSIS [24], and GRA-TOPSIS [25] revealed a high degree of consistency in the ranking outcomes, alongside superior evaluation differentiation. This confirms the efficacy and stability of the proposed method. Based on the CPI results and the PKU-DFIIC, the coupling and coupling coordination degrees were determined using a coupling coordination model. The outcomes for all indices are depicted in Figure 4.
Overall, based on the data presented in Figure 4, the YRD urban agglomeration has shown a growth trend in the DFII, the CPI, and the coupling coordination degree of these two during the study period. This phenomenon indicates that digital financial inclusion and common prosperity are in a state of coordinated development. However, the coupling degree shows a downward trend within the range from 0.98 to 0.89, suggesting that the interaction strength between digital financial inclusion and common prosperity is weakening. Despite the decline in the coupling degree, it remains within a highly coupled range, indicating that the degree of mutual influence between the two is still significant.
Specifically, as depicted in Figure 4a, the distribution range of the DFII spans from 0.04 to 0.36, suggesting that the overall level has yet to achieve a higher standard. Notably, in Shanghai and key cities of the Jiangsu and Zhejiang provinces, such as Hangzhou and Nanjing, the pace of digital financial inclusion development is relatively rapid. In contrast, cities in Anhui Province, exemplified by Hefei, exhibit slower progress. As indicated in Figure 4b, the CPI of cities predominantly varies between 0.2 and 0.8, with Zhejiang Province emerging as a leader in common prosperity development. In 2021, the CPI values for cities in this province generally surpassed 0.6, whereas cities in Anhui Province remained behind. Analysis of Figure 4c reveals that cities within Anhui Province experience a lesser reduction in the coupling degree between digital financial inclusion and common prosperity, unlike the more pronounced decreases observed in Jiangsu, Zhejiang, and Shanghai. This suggests that the level of common prosperity in Anhui Province is highly reliant on advances in digital financial inclusion. Figure 4d illustrates that the overall interaction between the cities’ DFII and CPI demonstrates weak to moderate coordination, with the temporal and spatial evolution patterns of the Coupling Coordination Degree and the CPI exhibiting a high degree of consistency.
4.2. Spatial Connection Patterns of Coupling Coordination Degree
This section delves into the spatial connection patterns of the coupling coordination degree between digital financial inclusion and common prosperity within the YRD urban agglomeration. To quantify the spatial connection intensity between cities, their spatial connection affiliation degree, and their potential value, a modified gravity model was applied. The city with the highest spatial connection affiliation degree was designated as having the primary connection direction. The spatial network’s core–periphery structure was scrutinized using Ucinet, whereas GIS software facilitated the visualization of the spatial connections concerning digital financial inclusion and common prosperity coupling coordination in the YRD, as illustrated in Figure 5 and Figure 6.
4.2.1. Spatial Connection Directions
In Figure 5, we observe the following: (1) The direction of spatial connection for coupling coordination within the YRD urban agglomeration has remained stable, characterized by geographical proximity. In 2011, nearly 80% of the cities selected their neighboring cities as spatial ties for coupling coordination. By 2021, a significant shift occurred, with Nanjing becoming the preferred location for all cities in Anhui Province, accompanied by a slight increase in Shanghai’s spatial influence and a decrease in the influence of Suzhou and Wuxi. (2) Regarding the development of coupling coordination between digital financial inclusion and common prosperity, the spatial attractiveness of megacities exhibits limitations. Despite Shanghai’s advanced economic development level within the YRD, it has not emerged as the preferred spatial connection for most cities. This may be attributed to various factors, including disparities in development levels, preferences in resource allocation, policy and strategic directions, and the extensive connectivity facilitated by infrastructure development. (3) Transportation infrastructure has played a crucial role in enhancing spatial connections. With the continuous expansion of China’s highways and high-speed rail networks, there have been significant improvements in the transportation network’s degree and the perfection of the transportation system. These advancements have bolstered cities’ traffic advantages and locational strengths, fostering closer connections within and beyond cities. Consequently, the density of spatial connections between cities and their preferred contact cities increased from 0.13–0.50 in 2011 to 0.16–0.62 in 2021. (4) The spatial network of coupling coordination between digital financial inclusion and common prosperity in the YRD is evolving towards an expanded core area and reduced peripheral areas. Transitioning from a periphery-dominated pattern in 2011 to a multi-core structure centered around Shanghai, Nanjing, Suzhou, Wuxi, Changzhou, Hangzhou, and Ningbo by 2021 signifies a considerable strengthening of the network’s core. This evolution reflects the enhanced role of regional economic interconnectivity and core cities in fostering common prosperity and the formation of tighter network connections between core and peripheral cities.
4.2.2. Spatial Connection Intensity and Potential
As indicated by Figure 6, in the study period we saw the spatial connection intensity of the YRD urban agglomeration evolve into a complex, interwoven network structure, with significantly enhanced inter-city connections. Specifically, the 2011 data identified Suzhou, Wuxi, and Shanghai as occupying central roles in terms of spatial connection intensity, whereas cities such as Changzhou, Jiaxing, and Nantong were in secondary central positions, demonstrating relatively weaker connections with other cities. By 2021, while the cities around Taihu Lake continued to maintain central positions in the spatial connection network, Nanjing, Hangzhou, and Ningbo emerged as new sub-central cities. Connections among cities in the Anhui region, however, remained comparatively weak. Moreover, the interconnections between core cities significantly strengthened, thereby amplifying their impact on the development of surrounding cities and enhancing the spatial spillover effect. A statistical analysis of cities’ potential values between 2011 and 2021 revealed that the majority of cities have seen increased potential values, indicating an ongoing enhancement in the influence and attractiveness of cities within the YRD urban agglomeration. Initially, in 2011, Suzhou, Wuxi, Shanghai, Changzhou, and Jiaxing dominated the spatial connections, acting as central transmission hubs in the YRD urban agglomeration’s coupling coordination development. By 2021, cities like Hangzhou, Ningbo, Jinhua, Xuancheng, and Huzhou experienced significant growth in their spatial connection potential. Overall, the spatial connection potential within the YRD urban agglomeration has been continuously rising, thereby forming a stable spatial structure that matches the intensity of spatial connections.
4.3. Spatial Connection Structure of Coupling Coordination Degree
From the perspective of spatial network connection structure, the digital financial inclusion and common prosperity coupling coordination spatial connection network of the YRD urban agglomeration is analyzed in terms of overall network characteristics, network centrality, and cohesive subgroups.
4.3.1. Overall Network Characteristics
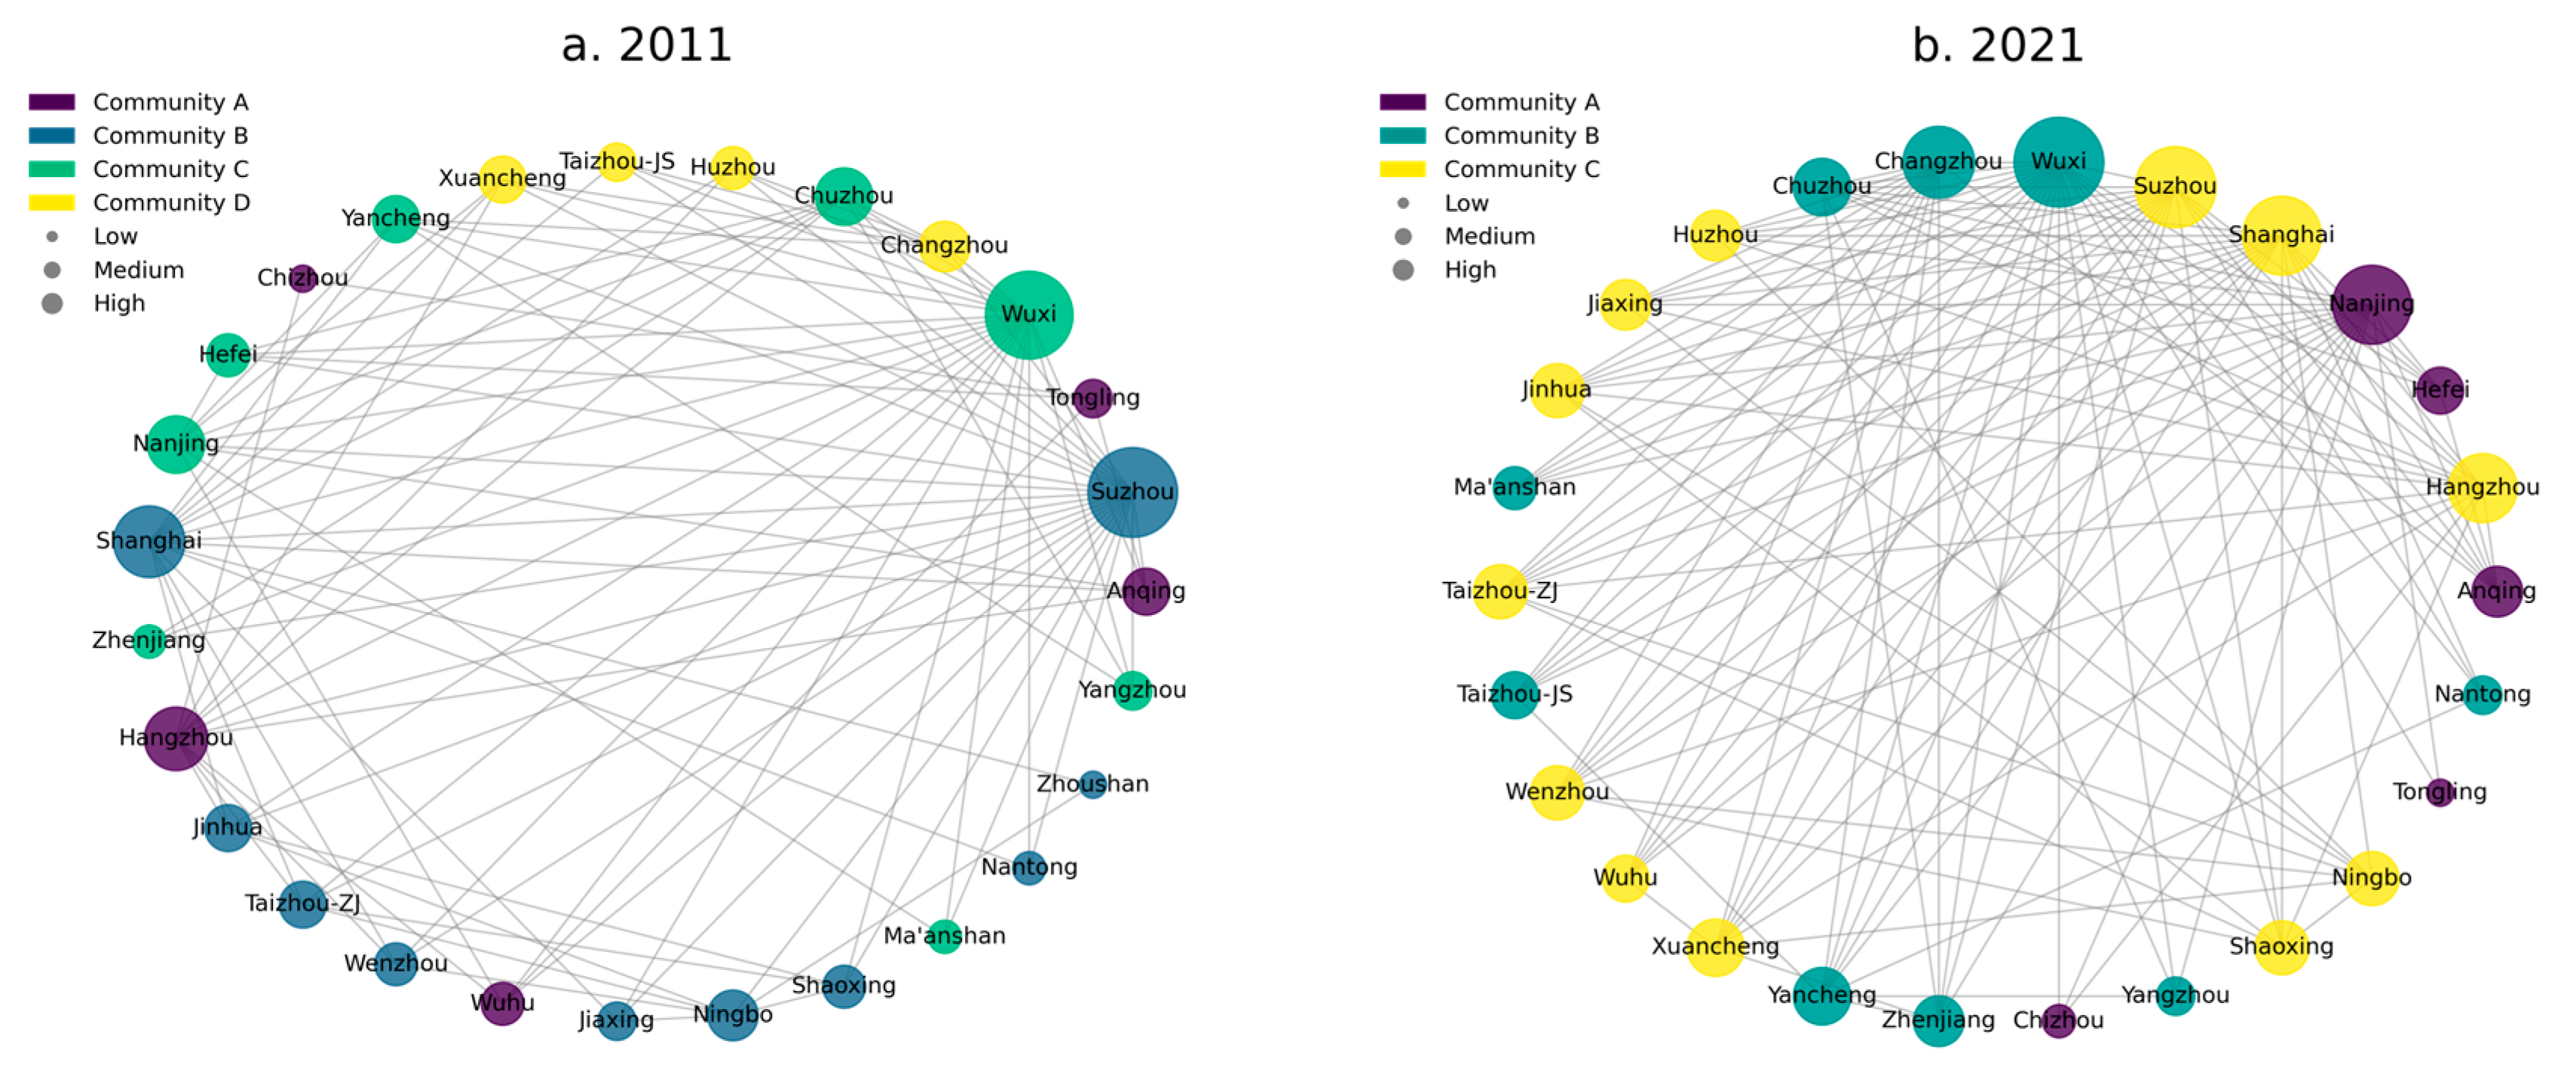
Employing an improved gravity model, we established a spatial network matrix to analyze the interconnections between digital financial inclusion and common prosperity within the YRD urban agglomeration. Utilizing the Python package NetworkX, we segmented this spatial network matrix into communities using the Louvain algorithm [58]. This analysis facilitated the creation of a spatial connection network diagram for digital financial inclusion and common prosperity, as depicted in Figure 7. Analysis of Figure 7 demonstrates that, within the spatial connection network tying digital financial inclusion to common prosperity, no instances of network isolation occurred in either 2011 or 2021. Notably, spatial connections between cities were significantly stronger in 2021 than in 2011. In 2011, the network was mainly divided into four distinct communities. However, due to the progressive enhancement of digital financial inclusion across various cities and the deepening of common prosperity goals, the intercity connections have been steadily fortified. This evolving dynamic culminated in the network’s consolidation into three communities by 2021, highlighting its “small-world” characteristic.
By comparing the overall network characteristics of the spatial connection networks for digital financial inclusion and common prosperity coupling coordination within the YRD urban agglomeration in 2011 and 2021 with those of an equally scaled random network generated by NetworkX (as presented in Table 4), in this study we find that, relative to the random network, the YRD’s network displays higher clustering coefficients and shorter average path lengths. This evidences its pronounced “small-world” characteristics. However, over the past decade, the average clustering coefficient of the YRD urban agglomeration increased marginally from 0.429 to 0.469. This increment suggests that, although the network’s cohesiveness has seen some improvement, the degree of enhancement remains modest, with the overall cohesiveness still at a relatively low level.
From the standpoint of overall network density, the inter-city network density within the YRD urban agglomeration grew from 0.252 to 0.373, indicating a sustained increase in inter-city network density. A network density exceeding 0.350 signifies that the inter-city network has reached structural maturity, reflecting the robustness of network connectivity and the spillover effects within the YRD urban agglomeration concerning digital financial inclusion and common prosperity. Concurrent with the increase in network connections, network efficiency declined from 0.7969 to 0.6708. This decline signals enhanced connectivity among individual networks and a more stable network structure.
4.3.2. Network Centrality Analysis
To delve into the influence of various cities within the spatial network of inclusive finance and common prosperity coupling coordination, in this study, we calculated the degree centrality, closeness centrality, and betweenness centrality of 27 cities, as shown in Table 5.
The analysis of degree centrality between 2011 and 2021 revealed that the YRD urban agglomeration featured 19 and 21 cities, respectively, exhibiting balanced in-degrees and out-degrees. This balance indicates no significant disparity in degree centrality between in-degrees and out-degrees. Specifically, in 2011, cities such as Shanghai, Suzhou, Wuxi, Nanjing, Hangzhou, Changzhou, Ningbo, and Chuzhou had out-degrees that surpassed the average level of urban agglomeration. By 2021, with the exception of Chuzhou, the aforementioned cities maintained out-degrees above the average, with Jinhua and Xuancheng also exhibiting similar traits. This evolution signifies that these cities assumed pivotal roles as spill-over actors within the spatial linkage network. Throughout the period from 2011 to 2021, the majority of cities exhibited out-degrees below the average level while their in-degrees were above average, indicating that these cities primarily functioned as beneficiaries within the network, potentially exerting a ‘siphoning effect’ on resources from other cities.
In analyzing closeness centrality, cities within the YRD urban agglomeration demonstrated an upward trend in both in-degrees and out-degrees, indicative of an accelerated flow of resources and growth in resource elements among the cities. This trend has not only fortified inter-city connections but also significantly propelled the coupled coordination development of inclusive finance and common prosperity. Notably, cities such as Wuxi, Changzhou, Huzhou, Taizhou-JS, Jiaxing, and Chuzhou exhibited higher closeness centrality, underscoring their pivotal roles in the network and their effective contribution to fostering high-quality coupled coordination development. Furthermore, over the past decade, Anhui Province has seen a gradual but significant intensification of its integration with the YRD urban agglomeration, contributing importantly to the region’s long-term balanced development. Despite this integration, the centrality status of these cities within the network has seen minimal change, remaining at a relatively lower level. This observation suggests that Anhui Province harbors the significant potential for further high-quality integration into the YRD’s inclusive finance and common prosperity coupling coordination network.
The analysis of betweenness centrality revealed significant disparities in the network’s betweenness centrality in 2011, characterized by pronounced polarization. By 2021, this polarization had diminished, with more than 60% of cities witnessing a notable increase in their betweenness centrality, contributing to a more equitable network structure. Cities such as Shanghai, Suzhou, Wuxi, and Hangzhou consistently maintained the highest ranks in betweenness centrality, with Nanjing also experiencing a substantial improvement. These cities hold central roles in the network for inclusive finance and common prosperity coupling coordination, significantly influencing other cities and serving as critical intermediaries and conduits for resource exchange. On the other hand, cities including Zhoushan, Tongling, and Chizhou exhibited lower betweenness centrality, indicative of their relative peripheral positions within the network. This status is closely associated with local transportation infrastructure, socioeconomic development capabilities, and other regional factors.
4.3.3. Analysis of Cohesive Subgroup
In this study, we employ NetworkX to perform a cohesive subgroup analysis of the spatial network concerning digital financial inclusion and common prosperity within the YRD urban agglomeration in 2021. We categorize the coupling and coordination spatial relationships of 27 cities into seven sectors, with both the density matrix and the corresponding image matrix presented in Table 6. For the 2021 spatial network, a sector’s density exceeding the overall network density (0.373) indicates a spillover trend, whereas densities below this threshold suggest the absence of such a trend. Accordingly, we use 0.373 as a pivotal threshold to transform the density matrix into the image matrix, assigning a value of 1 to densities above the threshold and a value of 0 to those below.
Table 6 reveals a lack of robust spatial connections, both inter-sectorally between Sectors 1 to 4 and intra-sectorally within these sectors themselves, with neither a significant spatial spillover effect nor a siphon effect observed. Similarly, Sectors 5 to 7, along with their internal connections, display insufficient spatial links. Notably, however, there exists a pronounced spatial connection and significant spatial spillover effect between the Hangzhou-Ningbo Sector (Sector 5) and the Shanghai-Suzhou-Wuxi Sector (Sector 7). The mutual spillover effects between Sectors 5, 6, 7, and Sectors 1, 2, 3, 4 are also considerable, underscoring the pivotal role that cities within Sectors 5, 6, 7 play in fostering the development of digital financial inclusion and common prosperity coupling coordination within the YRD region.
In conclusion, the development of coupling coordination for digital financial inclusion and common prosperity in the YRD region is primarily propelled by three critical sectors: Hangzhou-Ningbo, Nanjing-Changzhou, and Shanghai-Suzhou-Wuxi. These sectors are closely aligned with the integrated urban agglomeration layout of the YRD. Specifically, the Hangzhou-Ningbo Sector merges the urban agglomerations of Hangzhou and Ningbo; the Nanjing-Changzhou Sector incorporates the urban agglomeration of Nanjing along with the Suzhou-Wuxi-Changzhou urban agglomeration, including Changzhou; and the Shanghai-Suzhou-Wuxi Sector unites Shanghai with the Suzhou and Wuxi regions of the Suzhou-Wuxi-Changzhou urban agglomeration. Conversely, the Hefei urban agglomeration has not successfully integrated into the core sectors of this coupling coordination spatial network, signifying that Hefei considerably lags behind other regions in its urban agglomeration in terms of achieving coordinated development in digital financial inclusion and common prosperity.
5. Conclusions, Optimization Objectives and Recommendations
5.1. Conclusions
In this study, we introduce a novel MCDA method that integrates SWARA, MEREC, and MARCOS for calculating the CPI. By employing a coupling coordination model, we conduct an in-depth analysis of the relationship between digital financial inclusion and common prosperity within the YRD urban agglomeration. An improved gravity model and social network analysis are utilized to examine the overall structural characteristics, network centrality features, and clustering characteristics of the YRD urban agglomeration. The main conclusions are as follows:
(1) Despite the growth trends observed in the digital financial inclusion and common prosperity indices, a declining trend in the coupling degree suggests a weakening interaction between these two aspects. Moreover, Anhui’s DFII, CPI, and coupling coordination degree lag behind those of Jiangsu, Zhejiang, and Shanghai, indicating significant regional development imbalances.
(2) Spatial network analysis reveals that the YRD urban agglomeration exhibits “small-world” network characteristics. A slight increase in the network clustering coefficient and continuous growth in inter-city network density highlights the closeness of inter-city connections and the pivotal role of core cities in fostering digital financial inclusion and common prosperity.
(3) In particular, the analysis of the spatial connection structure of coupling coordination discusses the core-periphery structure of the YRD urban agglomeration. It emphasizes the dominant positions of core cities such as Shanghai, Nanjing, and Hangzhou in the network while addressing the development challenges faced by peripheral cities. The transition from four communities in 2011 to three in 2021 reflects enhanced internal integration and coordination within the region.
(4) Further analysis of individual network characteristics and cohesive subgroups underscores the central role of the Hangzhou-Ningbo, Nanjing-Changzhou, and Shanghai-Suzhou-Wuxi sectors in advancing the coupled coordination development of digital financial inclusion and common prosperity in the region. Additionally, the analysis points to Hefei’s relative lag in this process, highlighting the necessity for targeted strategies to promote its development and integration.
5.2. Optimization Objectives
Based on the findings of this study, this paper proposes four specific optimization objectives for the coupled coordination network of digital financial inclusion and common prosperity in the YRD. Firstly, the results indicate a developmental disparity between peripheral and core cities within the network, with significant regional imbalances evident, thus making the coordinated development of all cities within the network the primary optimization goal. Secondly, the role of core cities in driving the development of peripheral cities has been confirmed; how to amplify this driving effect is an urgent optimization target that needs addressing. Thirdly, the YRD urban agglomeration has achieved significant development during the study period, with its potential for growth and strong driving forces well-established; fully unleashing this region’s development potential to further promote digital financial inclusion and common prosperity is the third goal. Fourthly, while the network structure of digital financial inclusion and common prosperity in the YRD was stable during the study period, there is still substantial room for improvement in terms of network density and connectivity. Enhancing the interactivity among cities within the region and strengthening network resilience should be another crucial optimization objective.
5.3. Recommendations
In response to these optimization objectives, this paper proposes the following specific recommendations:
Tailored government support policies to promote regional balanced development. Given the spatial heterogeneity and developmental imbalances among cities, particularly in relatively underdeveloped cities such as Anqing, Chizhou, and Chuzhou, it is necessary to provide necessary resource allocation and fiscal incentives. Specific measures may include enhancing investments in various educational resources to promote educational equity while attracting and cultivating talent for urban development. Furthermore, creating a favorable business environment through tax reductions and subsidy support can aid the development of small and medium-sized enterprises. These initiatives will help improve the common prosperity level of underdeveloped cities and accelerate the development of digital financial services, thereby better integrating these cities into the overall regional economic framework.
Advancing the construction of world-class urban agglomerations. By increasing support for technological innovation and financial assistance in core cities, and building infrastructure and public service platforms in the YRD, cities such as Shanghai, Nanjing, and Hangzhou can be developed into world-class urban agglomerations powered by financial technology and led by innovation. The construction of these urban agglomerations will fully leverage the aggregation advantages of core cities in technology, medical education, industrial economy, capital, and talent, enhancing their radiating effect and providing resource support for the development of digital financial inclusion and the achievement of common prosperity in surrounding cities.
Unleashing the development potential of the YRD urban agglomeration. By scientifically planning the industrial layout of the YRD region, promoting the industrial upgrading and modernization of the entire city group, and creating better employment and entrepreneurial environments, the development potential of the YRD urban agglomeration can be realized. At the same time, by promoting digital financial products and services targeted at small and medium-sized enterprises and rural areas to support the financial needs of socially disadvantaged groups, a fair financial environment can be created while expanding the coverage of digital financial inclusion. Additionally, by implementing a national financial education plan, the financial literacy of the public can be improved, ensuring the widespread and safe use of digital financial services, and inspiring the public to make reasonable use of inclusive financial services to promote the economic welfare of individuals and families.
Enhancing the transportation infrastructure and digital interconnectivity of the YRD urban agglomeration, improving network density, connectivity, and network resilience. Firstly, by building more efficient road, rail, and air connections, the economic and geographical distances between cities can be reduced, thereby enhancing inter-city economic cooperation and cultural exchange, and promoting the free flow of talent, capital, information, and other resources. In addition, by increasing investment in key digital infrastructure, the digital interconnectivity and accessibility between cities can be enhanced. This includes improving internet bandwidth, strengthening network security measures, and developing digital platforms that support seamless interaction, making it easier for cities in the YRD to share information, access financial services, and participate in the digital economy. These measures will ensure that all cities, especially remote and slower-developing areas, can effectively access and utilize modern digital financial tools, thereby enhancing financial inclusivity.
By implementing these measures, the YRD urban agglomeration will not only achieve tighter physical and digital integration but also foster deeper economic and social integration, providing equal development opportunities for all cities in the region and jointly promoting the coordinated development of digital financial inclusion and common prosperity in the area. Additionally, this paper will also provide some insights into the development of other urban agglomerations in China.
Author Contributions
Methodology, F.Z.; Software, F.Z.; Data curation, F.Z.; Writing—original draft, F.Z.; Writing—review & editing, H.S.; Supervision, H.S.; Project administration, H.S. All authors have read and agreed to the published version of the manuscript.
Funding
This research was funded by the Yiwu Social Science Federation (Grant No. 90082), and the Institute for Common Prosperity Research at Jiangsu University (Grant No. GFYB005). The APC was funded by the Yiwu Social Science Federation (Grant No. 90082).
Data Availability Statement
The data presented in this study are available on request from the corresponding author.
Conflicts of Interest
The authors declare no conflict of interest.
References
- Wang, F.; Zhang, X.; Ye, C.; Cai, Q. The Household Multidimensional Poverty Reduction Effects of Digital Financial Inclusion: A Financial Environment Perspective. Soc. Indic. Res. 2024, 172, 313–345. [Google Scholar] [CrossRef]
- Zhang, C.; Zhu, Y.; Zhang, L. Effect of digital inclusive finance on common prosperity and the underlying mechanisms. Int. Rev. Financ. Anal. 2024, 91, 102940. [Google Scholar] [CrossRef]
- Zhang, M.; Zhu, T.; Zenghui, H.; Wan, P. A study of the promotion mechanism of digital inclusive finance for the common prosperity of Chinese rural households. Front. Earth Sci. 2024, 12, 1301632. [Google Scholar] [CrossRef]
- Zhang, L.; Chen, J.; Liu, Z.; Hao, Z. Digital inclusive finance, financing constraints, and technological innovation of SMEs—Differences in the effects of financial regulation and government subsidies. Sustainability 2023, 15, 7144. [Google Scholar] [CrossRef]
- Chen, Y.; Jiang, S. Urban Agglomeration, Urban System, and Chengshiqun: Different Concepts. Urban Dev. Stud. 2017, 12, 8–15. [Google Scholar]
- Zhong, X.; Duan, Z.; Liu, C.; Chen, W. Research on the coupling mechanism and influencing factors of digital economy and green technology innovation in Chinese urban agglomerations. Sci. Rep. 2024, 14, 5150. [Google Scholar] [CrossRef]
- Wang, B.; Zhu, J.; Ma, Y.; Tao, X.; Li, X. The coupling coordination and spatial effect of eco-environmental governance efficiency and green innovation in China. Technol. Anal. Strateg. Manag. 2023, 1–13. [Google Scholar] [CrossRef]
- Ma, G.; Hu, J.; Zhang, R. Spatial-temporal distribution and coupling relationship of high-speed railway and economic networks in Metropolitan Areas of China. Land 2023, 12, 1193. [Google Scholar] [CrossRef]
- Guan, J.; Zuo, K.; Chen, K.; Yam, R.C. Does country-level R&D efficiency benefit from the collaboration network structure? Res. Policy 2016, 45, 770–784. [Google Scholar]
- Fan, F.; Lian, H.; Wang, S. Can regional collaborative innovation improve innovation efficiency? An empirical study of Chinese cities. Growth Change 2020, 51, 440–463. [Google Scholar] [CrossRef]
- Li, J.; Ye, S.; Wang, S. Spatial Network Analysis on the Coupling Coordination of Digital Finance and Technological Innovation. Sustainability 2023, 15, 6354. [Google Scholar] [CrossRef]
- Jiang, W.; Hu, Y.; Cao, H. Does digital financial inclusion increase the household consumption? Evidence from China. J. Knowl. Econ. 2024, 1–32. [Google Scholar] [CrossRef]
- Lin, B.; Xu, C. Digital inclusive finance and corporate environmental performance: Insights from Chinese micro, small-and medium-sized manufacturing enterprises. In Borsa Istanbul Review; Elsevier: Amsterdam, The Netherlands, 2024. [Google Scholar]
- Sun, J.; Zhang, J. Digital financial inclusion and innovation of MSMEs. Sustainability 2024, 16, 1404. [Google Scholar] [CrossRef]
- Jiao, Y.; Wang, G.; Li, C.; Pan, J. Digital inclusive finance, factor flow, and industrial structure upgrading: Evidence from the Yellow River Basin. Financ. Res. Lett. 2024, 62, 105141. [Google Scholar] [CrossRef]
- Yang, Y.Y.; Wang, M.J. Common prosperity: Evolution course, stage target, and evaluation system. Jianghai Acad. J. 2021, 5, 84–89. [Google Scholar]
- Jiang, Y.M.; Dou, X.L. Achieving solid progress in establishing an index system for common prosperity: Theoretical logic & preliminary design. Southeast Acad. Res. 2022, 1, 36–44+246. [Google Scholar]
- Ma, X.F.; Zhang, R.; Ruan, Y.F. Evaluation of common prosperity level and regional difference based on the background of green development. Sustainability 2022, 14, 15863. [Google Scholar] [CrossRef]
- Zhao, X.C.; Long, L.C.; Yin, S. Regional common prosperity level and its spatial relationship with carbon emission intensity in China. Sci. Rep. 2023, 13, 17035. [Google Scholar] [CrossRef]
- Liu, Y.; Dong, X.; Dong, K. Pathway to prosperity? The impact of low-carbon energy transition on China’s common prosperity. Energy Econ. 2023, 124, 106819. [Google Scholar] [CrossRef]
- Liu, Y.; Dong, K.Y.; Wang, J.D.; Taghizadeh-Hesary, F. Towards sustainable development goals: Does common prosperity contradict carbon reduction? Econ. Anal. Policy 2023, 79, 70–88. [Google Scholar] [CrossRef]
- Xie, T.C.; Zhang, Y.; Song, X.Y. Research on the spatiotemporal evolution and influencing factors of common prosperity in China. Environ. Dev. Sustain. 2024, 26, 1851–1877. [Google Scholar] [CrossRef]
- Cheng, L.; Yang, L.H.; Li, X.; Xu, S.; Cao, Y. Research on the evaluation and configuration path of China’s rural common prosperity-NCA and fsQCA based on provincial panel data. Heliyon 2024, 10, e23888. [Google Scholar] [CrossRef] [PubMed]
- Xu, B.K.; Liu, L.; Sun, Y.M. The spatio-temporal pattern of regional coordinated development in the common prosperity demonstration zone-Evidence from Zhejiang Province. Sustainability 2023, 15, 2939. [Google Scholar] [CrossRef]
- Li, R.S.; Hu, Y.R.; Liu, H.J. Portrait of China’s common prosperity level based on GRA-TOPSIS and deep learning. J. Intell. Fuzzy Syst. 2023, 45, 1923–1937. [Google Scholar] [CrossRef]
- Ge, H.; Tang, L.; Zhou, X.; Tang, D.; Boamah, V. Research on the effect of rural inclusive financial ecological environment on rural household income in China. Int. J. Environ. Res. Public Health 2022, 19, 2486. [Google Scholar] [CrossRef] [PubMed]
- Fang, X. Can digital finance promote individuals’ charitable giving? Empirical evidence from China. Comput. Hum. Behav. 2023, 145, 107768. [Google Scholar] [CrossRef]
- Zhao, T.T.; Jiao, F.Y. Does digital financial inclusion promote common prosperity? The role of regional innovation. In Electronic Commerce Research; Springer: Berlin/Heidelberg, Germany, 2024. [Google Scholar]
- Shi, Y.; Cheng, Q.; Wu, Y.; Lin, Q.; Xu, A.; Zheng, Q. Promoting or inhibiting? Digital inclusive finance and cultural consumption of rural residents. Sustainability 2023, 15, 2719. [Google Scholar] [CrossRef]
- Von Bertalanffy, L. The history and status of general systems theory. Acad. Manag. J. 1972, 15, 407–426. [Google Scholar] [CrossRef]
- Singh, A.; Rani, I. Potential Impact of Metaverse-Based Banking on Employment in the Banking Sector in India. In Islamic Finance: New Trends in Law and Regulation; Springer: Berlin/Heidelberg, Germany, 2024; pp. 103–115. [Google Scholar]
- Ololade, Y.J. Conceptualizing Fintech Innovations and Financial Inclusion: Comparative Analysis of African and US Initiatives. Financ. Account. Res. J. 2024, 6, 546–555. [Google Scholar] [CrossRef]
- Abakare, C.; Jeko, V.O. The Ethics of Artificial Intelligence as the Epistemology of Information-Based Technology Examined in Light of Banking Industry. IGWEBUIKE Afr. J. Arts Humanit. 2024, 10, 38–62. [Google Scholar]
- Hua, C.; Zhang, Z.; Miao, J.; Han, J.; Zhu, Z. Spatial coordination and industrial pollution of urban agglomerations: Evidence from the Yellow River Basin in China. Expert Syst. 2024, e13548. [Google Scholar] [CrossRef]
- Liu, J.; Meng, H.; Xu, H.; Chen, J. Economic–environmental coordination and influencing factors under dual-carbon goal: A spatial empirical evidence from China’s transport sector. Environment. Dev. Sustain. 2024, 1–39. [Google Scholar] [CrossRef]
- Sun, J.; Zhai, N.; Mu, H.; Miao, J.; Li, W.; Li, M. Assessment of urban resilience and subsystem coupling coordination in the Beijing-Tianjin-Hebei urban agglomeration. Sustain. Cities Soc. 2024, 100, 105058. [Google Scholar] [CrossRef]
- An, C.; He, X.; Zhang, L. The coordinated impacts of agricultural insurance and digital financial inclusion on agricultural output: Evidence from China. Heliyon 2023, 9, e13546. [Google Scholar] [CrossRef]
- Sun, Z.; Cao, C.; He, Z.; Feng, C. Examining the coupling coordination relationship between digital inclusive finance and technological innovation from a spatial spillover perspective: Evidence from China. Emerg. Mark. Financ. Trade 2023, 59, 1219–1231. [Google Scholar] [CrossRef]
- Zhang, T.T.; Wang, W.X.; Li, C.Y.; Wang, X.F. The role of innovation and entrepreneurship in promoting common prosperity in China: Empirical evidence from a two-way fixed effects model. PLoS ONE 2023, 18, e0295752. [Google Scholar] [CrossRef]
- Lei, X.; Chen, X.; Xu, L.; Qiu, R.; Zhang, B. Carbon reduction effects of digital financial inclusion: Evidence from the county-scale in China. J. Clean. Prod. 2024, 451, 142098. [Google Scholar] [CrossRef]
- Shen, X. The Impact of Digital Financial Inclusion on Green Innovation in the Yangtze River Delta. Highlights Bus. Econ. Manag. 2023, 23, 196–204. [Google Scholar] [CrossRef]
- Liu, P.L.; Qian, T.; Huang, X.H.; Dong, X.B. The connotation, realization paths, and measurement method of common prosperity for all. J. Manag. World 2021, 37, 117–129. [Google Scholar]
- Li, S. China goals and paths of common prosperity. Econ. Res. J. 2021, 56, 4–13. [Google Scholar]
- Li, C.; He, Y.X.; Luo, Z.J. Distribution dynamics, regional differences, and convergence of common affluence level. Stat. Decis. 2023, 39, 68–73. [Google Scholar]
- Chen, L.J.; Yu, J.X.; Xu, Y.N. Construction of the Common Prosperity Index Model. Gov. Stud. 2021, 37, 5. [Google Scholar]
- Almakayeel, N. Evaluating and ranking SCPMS enablers using ISM and SWARA. Appl. Sci. 2023, 13, 5791. [Google Scholar] [CrossRef]
- Keshavarz-Ghorabaee, M.; Amiri, M.; Zavadskas, E.K.; Turskis, Z.; Antucheviciene, J. Determination of objective weights using a new method based on the removal effects of criteria (MEREC). Symmetry 2021, 13, 525. [Google Scholar] [CrossRef]
- Stević, Ž.; Pamučar, D.; Puška, A.; Chatterjee, P. Sustainable supplier selection in healthcare industries using a new MCDM method: Measurement of alternatives and ranking according to compromise solution (MARCOS). Comput. Ind. Eng. 2020, 140, 106231. [Google Scholar] [CrossRef]
- Pang, Q.; Wang, H.; Xu, Z. Probabilistic linguistic term sets in multi-attribute group decision making. Inf. Sci. 2016, 369, 128–143. [Google Scholar] [CrossRef]
- Stanujkic, D.; Karabasevic, D.; Zavadskas, E.K. A framework for the selection of a packaging design based on the SWARA method. Eng. Econ. 2015, 26, 181–187. [Google Scholar] [CrossRef]
- Geng, X.L.; Zhou, Q.C. Multi criteria decision making method based on probabilistic language BWM and PROMETHEE II. Oper. Res. Manag. Sci. 2020, 29, 124–129. [Google Scholar]
- Demir, G.; Riaz, M.; Almalki, Y. Multi-criteria decision making in evaluation of open government data indicators: An application in G20 countries. AIMS Math. 2023, 8, 18408–18434. [Google Scholar] [CrossRef]
- Tang, F.; Wang, L.; Guo, Y.; Fu, M.; Huang, N.; Duan, W.; Luo, M.; Zhang, J.; Li, W.; Song, W. Spatio-temporal variation and coupling coordination relationship between urbanisation and habitat quality in the Grand Canal, China. Land Use Policy 2022, 117, 106119. [Google Scholar] [CrossRef]
- Wang, S.J.; Kong, W.; Ren, L.; Zhi, D.D.; Dai, B.T. Research on misuses and modification of coupling coordination degree model in China. J. Nat. Resour. 2021, 36, 793–810. [Google Scholar] [CrossRef]
- Chai, D.; Du, J.; Yu, Z.; Zhang, D. City network mining in China’s Yangtze River Economic Belt based on “two-way time distance” modified gravity model and social network analysis. Front. Phys. 2022, 10, 1018993. [Google Scholar] [CrossRef]
- Chen, L.; Xiangmu, J. Measurement of spatial interaction between central towns based on the gravity model. Sci. Geogr. Sin. 2016, 36, 724–732. [Google Scholar]
- Chen, X.; Di, Q.; Jia, W.; Hou, Z. Spatial correlation network of pollution and carbon emission reductions coupled with high-quality economic development in three Chinese urban agglomerations. Sustain. Cities Soc. 2023, 94, 104552. [Google Scholar] [CrossRef]
- Traag, V.A.; Waltman, L.; Van Eck, N.J. From Louvain to Leiden: Guaranteeing well-connected communities. Sci. Rep. 2019, 9, 5233. [Google Scholar] [CrossRef]
Figure 1.
Research framework.

Figure 2.
The coupling coordination mechanism between digital financial inclusion and common prosperity.
Figure 2.
The coupling coordination mechanism between digital financial inclusion and common prosperity.

Figure 3.
Location of the study area.

Figure 4.
Spatiotemporal evolution of digital financial inclusion, common prosperity, coupling degree, and coupling coordination degree.
Figure 4.
Spatiotemporal evolution of digital financial inclusion, common prosperity, coupling degree, and coupling coordination degree.

Figure 5.
Spatial connection direction of digital financial inclusion and common prosperity in YRD urban agglomeration from 2011 to 2021.
Figure 5.
Spatial connection direction of digital financial inclusion and common prosperity in YRD urban agglomeration from 2011 to 2021.

Figure 6.
Spatial connection intensity and potential of digital financial inclusion and common prosperity in the YRD urban agglomeration from 2011 to 2021.
Figure 6.
Spatial connection intensity and potential of digital financial inclusion and common prosperity in the YRD urban agglomeration from 2011 to 2021.

Figure 7.
Evolution of the spatial connection network for digital financial inclusion and common prosperity.
Figure 7.
Evolution of the spatial connection network for digital financial inclusion and common prosperity.


Table 1.
Evaluation index system for common prosperity.
| Target Layer | Criterion Layer | Index Layer | Property | |||
|---|---|---|---|---|---|---|
| Shareability | Universal Sharing | Per Capita Gross Regional Product | + | 0.1074 | 0.0455 | 0.1802 |
| General Budgetary Expenditure of Local Finance | + | 0.0243 | 0.0198 | 0.0178 | ||
| Rural Residents’ Per Capita Disposable Income | + | 0.0977 | 0.0399 | 0.1436 | ||
| Rural Residents’ Per Capita Consumption Expenditure | + | 0.0888 | 0.0372 | 0.1215 | ||
| Urban Residents’ Per Capita Disposable Income | + | 0.0698 | 0.0265 | 0.0681 | ||
| Urban Residents’ Per Capita Consumption Expenditure | + | 0.0635 | 0.0245 | 0.0572 | ||
| Public Safety Expenditure/General Budgetary Expenditure of Local Finance | + | 0.0023 | 0.0490 | 0.0041 | ||
| Gradual Sharing | Urbanization Rate | + | 0.0010 | 0.0176 | 0.0007 | |
| Urban–Rural Income Ratio | − | 0.1397 | 0.0134 | 0.0690 | ||
| Average Wage of Employees | + | 0.0488 | 0.0228 | 0.0410 | ||
| Engel’s Coefficient | − | 0.0201 | 0.0130 | 0.0096 | ||
| Gini Coefficient | − | 0.1536 | 0.0065 | 0.0366 | ||
| Development | Cultural Education | Science and Education Expenditure/GDP | + | 0.0027 | 0.0210 | 0.0021 |
| Student–Teacher Ratio in Primary and Secondary Education | − | 0.0036 | 0.0090 | 0.0012 | ||
| Per Capita Education Expenditure | + | 0.0056 | 0.0289 | 0.0059 | ||
| Per Capita Public Library Book Holdings | + | 0.0008 | 0.0580 | 0.0017 | ||
| Healthcare | Per Capita Healthcare Facility Beds | + | 0.0043 | 0.0186 | 0.0029 | |
| Per Capita Practicing Physicians or Assistants | + | 0.0073 | 0.0298 | 0.0080 | ||
| Infrastructure | Per Capita Public Bus Quantity | + | 0.0015 | 0.0476 | 0.0027 | |
| Social Security | Urban and Rural Residents’ Minimum Living Standard | + | 0.0132 | 0.0072 | 0.0035 | |
| Proportion of Urban Workers Covered by Basic Pension Insurance | + | 0.0349 | 0.0472 | 0.0607 | ||
| Sustainability | Openness to the World | Total Import and Export Volume/GDP | + | 0.0221 | 0.0637 | 0.0519 |
| Technological Innovation | R&D Internal Funding Intensity | + | 0.0109 | 0.0492 | 0.0197 | |
| Per Capita Patent Grants | + | 0.0030 | 0.1129 | 0.0124 | ||
| Environmental Ecology | Carbon Emission Intensity | − | 0.0087 | 0.0624 | 0.0200 | |
| Harmless Treatment Rate of Domestic Waste | + | 0.0120 | 0.0426 | 0.0188 | ||
| Urban Built-Up Area Green Coverage Rate | + | 0.0019 | 0.0215 | 0.0015 | ||
| Per Capita Park and Green Space Area | + | 0.0021 | 0.0236 | 0.0018 | ||
| Quality of Development | Society-Wide Labor Productivity | + | 0.0179 | 0.0225 | 0.0148 | |
| Year-End Urban Registered Unemployment Rate | − | 0.0306 | 0.0188 | 0.0212 |
Table 2.
Granularity of PLTs in SWARA.
| Granularity | Meaning | Note: in this study, granularity is a continuous variable, and the expert panel may use any value within the range as the evaluation granularity. |
| 0.0 | Cj is equally important as Cj-1 | |
| 0.2 | Cj is slightly less important than Cj-1 | |
| 0.4 | Cj is clearly less important than Cj-1 | |
| 0.6 | Cj is strongly less important than Cj-1 | |
| 0.8 | Cj is extremely less important than Cj-1 | |
| 1.0 | Cj is absolutely less important than Cj-1 |
Table 3.
Classification of coupling degree and coupling coordination degree.
| C | Classification | H | Classification |
|---|---|---|---|
| 0 < C < 0.3 | Weak coupling | 0 < H < 0.4 | Weak coordination |
| 0.3 < C < 0.7 | Medium coupling | 0.4 < H < 0.6 | Moderate coordination |
| 0.7 < C < 1 | Strong coupling | 0.6 < H < 0.8 | Strong coordination |
| 0.8 < H < 1 | Extremely coordination |
Table 4.
Overall network structural characteristics of the spatial connection between digital financial inclusion and common prosperity.
Table 4.
Overall network structural characteristics of the spatial connection between digital financial inclusion and common prosperity.
| Network Type | Network Efficiency | Network Density | Average Path Length | Average Clustering Coefficient |
|---|---|---|---|---|
| Random Network (27 nodes, connection probability 0.2) | 0.8523 | 0.105 | 1.907 | 0.086 |
| 2011 | 0.7969 | 0.252 | 1.902 | 0.429 |
| 2021 | 0.6708 | 0.373 | 1.640 | 0.469 |
Table 5.
Network centrality of the spatial connection between digital financial inclusion and common prosperity.
Table 5.
Network centrality of the spatial connection between digital financial inclusion and common prosperity.
| City | 2011 | 2021 | ||||||||
|---|---|---|---|---|---|---|---|---|---|---|
| Degree Centrality | Closeness Centrality | Betweenness Centrality | Degree Centrality | Closeness Centrality | Betweenness Centrality | |||||
| Out-Degree | In-Degree | Out-Degree | In-Degree | Out-Degree | In-Degree | Out-Degree | In-Degree | |||
| Anqing | 3 | 6 | 0.52 | 0.565 | 21.812 | 7 | 7 | 0.578 | 0.578 | 2.079 |
| Changzhou | 7 | 7 | 0.542 | 0.531 | 4.579 | 15 | 15 | 0.684 | 0.703 | 30.342 |
| Chizhou | 1 | 2 | 0.283 | 0.4 | 0.81 | 5 | 5 | 0.553 | 0.553 | 0.983 |
| Chuzhou | 7 | 9 | 0.565 | 0.591 | 11.142 | 9 | 9 | 0.605 | 0.605 | 6.754 |
| Hangzhou | 11 | 7 | 0.619 | 0.531 | 29.918 | 14 | 13 | 0.684 | 0.667 | 16.123 |
| Hefei | 5 | 5 | 0.542 | 0.542 | 24.357 | 8 | 8 | 0.591 | 0.591 | 5.232 |
| Huzhou | 5 | 5 | 0.542 | 0.52 | 1.981 | 8 | 8 | 0.591 | 0.591 | 4.307 |
| Jiaxing | 4 | 4 | 0.52 | 0.51 | 0.829 | 8 | 8 | 0.591 | 0.591 | 2.532 |
| Jinhua | 6 | 6 | 0.553 | 0.531 | 3.737 | 10 | 10 | 0.619 | 0.619 | 7.698 |
| Ma’anshan | 3 | 3 | 0.5 | 0.491 | 0.095 | 5 | 5 | 0.553 | 0.553 | 1.279 |
| Nanjing | 9 | 8 | 0.578 | 0.565 | 12.209 | 17 | 17 | 0.722 | 0.743 | 51.992 |
| Nantong | 3 | 3 | 0.51 | 0.5 | 0.095 | 5 | 5 | 0.553 | 0.553 | 0.661 |
| Ningbo | 7 | 7 | 0.553 | 0.542 | 16.297 | 10 | 10 | 0.619 | 0.619 | 5.318 |
| Shanghai | 14 | 13 | 0.667 | 0.619 | 64.67 | 20 | 19 | 0.813 | 0.788 | 100.95 |
| Shaoxing | 5 | 5 | 0.531 | 0.52 | 0.829 | 8 | 8 | 0.591 | 0.591 | 1.277 |
| Suzhou | 22 | 22 | 0.867 | 0.839 | 204.851 | 22 | 22 | 0.839 | 0.867 | 83.675 |
| Taizhou-ZJ | 6 | 6 | 0.553 | 0.531 | 3.737 | 8 | 9 | 0.591 | 0.605 | 10.198 |
| Taizhou-JS | 4 | 4 | 0.52 | 0.51 | 0.631 | 6 | 6 | 0.565 | 0.565 | 1.279 |
| Tongling | 4 | 4 | 0.388 | 0.406 | 30.708 | 4 | 7 | 0.531 | 0.578 | 0.841 |
| Wenzhou | 5 | 5 | 0.542 | 0.52 | 2.487 | 8 | 8 | 0.591 | 0.591 | 3.698 |
| Wuxi | 21 | 21 | 0.839 | 0.813 | 168.21 | 23 | 23 | 0.867 | 0.897 | 88.816 |
| Wuhu | 4 | 5 | 0.531 | 0.542 | 20.548 | 7 | 6 | 0.578 | 0.565 | 1.779 |
| Xuancheng | 6 | 6 | 0.553 | 0.531 | 3.815 | 10 | 10 | 0.619 | 0.619 | 9.373 |
| Yancheng | 6 | 6 | 0.542 | 0.531 | 3.964 | 9 | 9 | 0.605 | 0.605 | 8.554 |
| Yangzhou | 4 | 3 | 0.51 | 0.491 | 0.262 | 6 | 6 | 0.553 | 0.553 | 1.057 |
| Zhenjiang | 3 | 3 | 0.5 | 0.491 | 0.095 | 8 | 8 | 0.578 | 0.578 | 2.202 |
| Zhoushan | 2 | 2 | 0.426 | 0.406 | 0.333 | 2 | 1 | 0.5 | 0.448 | 0 |
Table 6.
Density and image matrices for subgroups within the YRD urban agglomeration, 2021.
| Matrix | Sector | Sector 1 | Sector 2 | Sector 3 | Sector 4 | Sector 5 | Sector 6 | Sector 7 |
|---|---|---|---|---|---|---|---|---|
| Density Matrix | Sector 1 | 0.036 | 0.188 | 0.036 | 0.167 | 0.875 | 0.938 | 1 |
| Sector 2 | 0.25 | 0 | 0 | 0 | 0.5 | 0 | 0.667 | |
| Sector 3 | 0.036 | 0 | 0.167 | 0.238 | 0.071 | 0.929 | 0.952 | |
| Sector 4 | 0.167 | 0 | 0.238 | 0 | 0 | 0.5 | 0.778 | |
| Sector 5 | 0.875 | 0.5 | 0.143 | 0 | 0 | 0 | 1 | |
| Sector 6 | 0.938 | 0 | 0.929 | 0.5 | 0 | 0 | 0.167 | |
| Sector 7 | 1 | 0.667 | 1 | 0.778 | 1 | 0.167 | 0.333 | |
| Image Matrix | Sector 1 | 0 | 0 | 0 | 0 | 1 | 1 | 1 |
| Sector 2 | 0 | 0 | 0 | 0 | 1 | 0 | 1 | |
| Sector 3 | 0 | 0 | 0 | 0 | 0 | 1 | 1 | |
| Sector 4 | 0 | 0 | 0 | 0 | 0 | 1 | 1 | |
| Sector 5 | 1 | 1 | 0 | 0 | 0 | 0 | 1 | |
| Sector 6 | 1 | 0 | 1 | 1 | 0 | 0 | 0 | |
| Sector 7 | 1 | 1 | 1 | 1 | 1 | 0 | 0 |
Note: 1. R2 = 0.659 > 0.5; 2. Sector 1 includes Anqing, Jiaxing, Chizhou, Taizhou-ZJ, Wenzhou, Jinhua, Huzhou, and Xuancheng. Sector 2 comprises Shaoxing and Zhoushan. Sector 3 is made up of Hefei, Tongling, Taizhou-JS, Wuhu, Yancheng, Chuzhou, and Ma’anshan. Sector 4 consists of Nantong, Zhenjiang, and Yangzhou. Sector 5 includes Hangzhou and Ningbo. Sector 6 comprises Nanjing and Changzhou. Sector 7 includes Shanghai, Suzhou, and Wuxi.
Disclaimer/Publisher’s Note: The statements, opinions and data contained in all publications are solely those of the individual author(s) and contributor(s) and not of MDPI and/or the editor(s). MDPI and/or the editor(s) disclaim responsibility for any injury to people or property resulting from any ideas, methods, instructions or products referred to in the content. |
© 2024 by the authors. Licensee MDPI, Basel, Switzerland. This article is an open access article distributed under the terms and conditions of the Creative Commons Attribution (CC BY) license (https://creativecommons.org/licenses/by/4.0/).
Share and Cite
MDPI and ACS Style
Zeng, F.; Sun, H. Spatial Network Analysis of Coupling Coordination between Digital Financial Inclusion and Common Prosperity in the Yangtze River Delta Urban Agglomeration. Mathematics 2024, 12, 1285. https://doi.org/10.3390/math12091285
AMA Style
Zeng F, Sun H. Spatial Network Analysis of Coupling Coordination between Digital Financial Inclusion and Common Prosperity in the Yangtze River Delta Urban Agglomeration. Mathematics. 2024; 12(9):1285. https://doi.org/10.3390/math12091285
Chicago/Turabian StyleZeng, Fanlong, and Huaping Sun. 2024. "Spatial Network Analysis of Coupling Coordination between Digital Financial Inclusion and Common Prosperity in the Yangtze River Delta Urban Agglomeration" Mathematics 12, no. 9: 1285. https://doi.org/10.3390/math12091285
Note that from the first issue of 2016, this journal uses article numbers instead of page numbers. See further details here.