Corporate Performance and Economic Convergence between Europe and the US: A Cluster Analysis Along Industry Lines


1
Williams School of Business, Bishop’s University, Sherbrooke, QC J1M1Z7, Canada
2
Faculty of Business and Administration, University of Bucharest, 030018 Bucharest, Romania
*
Author to whom correspondence should be addressed.
Mathematics 2020, 8(3), 451; https://doi.org/10.3390/math8030451
Submission received: 20 February 2020
/
Revised: 6 March 2020
/
Accepted: 11 March 2020
/
Published: 20 March 2020
(This article belongs to the Special Issue Applied Data Analytics)
Abstract
:We investigate the extent to which the United States and the countries of Europe have achieved economic convergence of their corporate sector. We define convergence as the homogenization of economic performance, institutional arrangements, and market valuation taking place at the meso-economic level. We perform a cluster analysis along industry lines and find that industries and corporations on both continents cluster in four groups, based on six variables measuring operating performance, ownership, and market valuation. The clusters resulted from the US data are more unstable than those resulted from European data. We are also able to pair a handful of highly similar clusters between the US and European data. These findings suggest a complex dynamic. It seems that the US corporate sector is more homogeneous than the European one. Moreover, some degree of convergence between the European Union and the United States appears to have already occurred.
1. Introduction
Corporate performance and corporate governance convergence has been studied from a multitude of angles. Most research has primarily focused on the nature and functioning of institutional arrangements [1,2,3,4], and on the relationship between economic efficiency and institutional arrangements [5,6,7,8].
We set out to assess the degree of corporate performance and corporate governance convergence within the US, within Europe, and between the US and Europe. First, we try to elucidate the concept of integration and convergence in order to obtain meaningful, testable hypotheses; and propose a novel approach to examining the phenomenon. In the context of the current research, we define economic integration and convergence as a phenomenon occurring at the so-called ”meso-economic” level [9]; that is, we interpret it as the emerging tendency of corporations on both continents to achieve similar economic linkages, similar levels of operating performance, ownership characteristics, and valuation; all this along industry lines. Instead of focusing on describing institutional arrangements and their relationship to individual metrics of corporate performance, we use clustering analysis to assess the overall complexity and structural similarity of six metrics of operating performance and valuation across various industries.
The research proposed here goes beyond the reductionist approach encountered in the literature so far. It amounts to more than the usual testing of the linear relationships among a group of variables, while holding everything else constant. It focuses on emergent properties associated with convergence, including but not limited to structure similarity and homogeneity.
We analyze two current data sets, consisting of a small number of measures of corporate performance, gathered from both operating and market data. The data set pertains to publicly held American and European corporations. Our clustering analysis is industry driven, spanning 94 different industries. The six variables used in this analysis are: (1) total debt ratio, showing the proportion of debt used by corporations to finance their total assets; (2) proportion of inside ownership, showing the degree of ownership concentration; (3) average tax rate, showing how much tax corporations pay; (4) earnings before interest, tax, depreciation, and amortization to sales ratio (EBITDA/S henceforth), which is a measure of operating performance; (5) price-earnings ratio (P/E henceforth), which is a measure of relative market valuation; and (6) price to sales ratio (P/S henceforth), yet another measure of relative market valuation.
We contend that highly unstable clusters (as evidenced by the bootstrapping procedure) would represent an indication of a high degree of homogeneity and structure similarity. We interpret the homogeneity and similarity of cluster structure as evidence of convergence within each subset. In addition, we also want to assess the degree of homogeneity and similarity between US and European data, and we set out to identify and pair highly similar clusters between US data and European data. The number of cluster pairs showing high similarity would give us an indication of the degree of convergence between US and Europe.
We find four clusters in each data subset, but the clusters obtained from US data are relatively unstable. We pair the clusters in order to find similarities, and conclude that three of the nine possible pairs are similar. This seems to suggest that while Europe and the Unites States are still apart on some level, de facto convergence is already occurring on another level, probably driven by large corporate players that straddle national borders, and arbitrage prices and regulations.
Convergence is indeed a process that occurs over very long periods and can be best observed on historic timescales. Here, we do not attempt to evaluate the progression of this phenomenon through time; rather we take a snapshot to investigate the nature and degree of convergence at a given moment in time. In other words, we do not focus on how the process changes, merely on where the process is at right now.
The paper is organized as follows: next section is devoted to presenting some background on economic integration, emerging institutional convergence, and cluster analysis. The third section describes the data and the methodology, while section four presents the results. The last section concludes and outlines directions for further research.
2. Literature Review and Significance of Research
There is little doubt that the world economy today is experiencing a period of unprecedented globalization. Without dwelling too much on the semantics of the term, we expect that globalization entails economic integration and institutional convergence, impacting manufacturing, trade, financial markets, corporate performance, and corporate governance, among others. There is a complex, yet robust relationship between economic growth and globalization [10]; and between globalization and the institutional framework of corporate finance and governance [11]. The post-World War II era witnessed a long period of relative prosperity and economic growth, boosted by the fall of communism in the late 1980s. Notwithstanding the oil crisis of the 1970s, the stock market crash of 1987, the Asian currency crisis of the late 1990s, the dot.com bubble of 2000, and the sub-prime meltdown of 2007, the world economy has generally been on an ascending path.
Many disparities in economic development among all countries have arguably subsided to a certain degree, and there are good reasons to believe that the industrialized countries of Europe and the United States are more advanced than any other countries on the path to economic integration and convergence. The United States and Europe share a common cultural heritage and have adopted a very similar industrialization model. The rise of the European Union coupled with the relative decline of the economic influence of the United States have set the stage for a deeper form of convergence, manifested at the corporate level.
The impetus of earlier research on economic integration and convergence has been the equalization of the various levels of national income and economic development. The liberalization of trade, capital flows, and labor, coupled with the spread of knowledge and technological change has been responsible for closing the economic development gap among various countries [12,13,14,15].
As time went on, the prevailing research interest shifted to a deeper level of analysis, assessing integration and convergence through the lens of institutional arrangements, corporate performance and corporate governance. Most of the scrutiny has been directed towards the United States, Europe, and Japan, primarily because they represent countries with a high level of economic development, but also because data on developed countries are more readily available. These considerations aside, there is little doubt that the United States and Europe share social, cultural, and economic common traits that make them prime candidates for the analysis of economic integration and convergence.
Some authors take note of the social and cultural differences among European countries and the United States [2,16,17,18], but consider that the various institutional corporate governance frameworks in Germany, Japan, and the US are converging. This process appears to be driven by global competitive pressures, the emergence of the knowledge economy, and the spread of shareholder capitalism. Large corporations have become global players who arbitrage regulation and fiscal policies to the point of compelling various national jurisdictions to harmonize their institutional frameworks. Financial capital is raised where costs are lower and invested where returns are higher. The separation between ownership and control, coupled with a harmonization of corporate practices leads to a relative equalization of operating and economic performance.
On the other hand, other authors contend that convergence is only apparent, and important differences remain even among developed countries [4,6,7,19,20]. Although the institutional framework of corporate finance and corporate governance is converging de jure, institutional and corporate practices remain de facto far apart. The level of protection given to different classes of stakeholders varies with the legal system, and even with the nature of the cultural heritage [21]. There are also marked differences in the cost of capital and the return on investment. On paper, corporate governance appears to become harmonized, but corporate performance remains dependent on the dominant institutional practice. When it comes to operating and economic performance, there is still a significant gap to be acknowledged.
The significant body of research on economic integration and convergence at the meso-economic level reveals a very complex picture. Several institutional and corporate practices and economic outcomes tend to become more similar, but there are areas where both institutional differences and economic outcomes tend to remain different, and in some instances even to move apart. It is tempting to deconstruct or slice the issue into simpler, more convenient questions in order to yield testable predictions. Nevertheless, interpretation remains a challenge when trying to fit the empirical results of various econometric tests into a single aggregate picture.
Here, we strive to use a methodology that avoids deconstructing the economic phenomenon into simpler parts. We employ clustering analysis in order to capture a global view of the overall issue by focusing, not on individual relationships, but on the overall structure of economic performance and governance at the corporate level, across various industries.
3. Data and Method
As mentioned earlier, we contend that economic integration and convergence of Europe and the United States should produce a homogeneous distribution of operating, corporate governance, and economic outcomes along industries lines. We should be able to observe a similar industry clustering based on performance and corporate governance metrics.
3.1. Data
Our data consists of two sub-sets of industry statistics, one for American and the other for European corporations. The operating and market data we use here is relatively recent (2016) and consists of six variables distributed across 94 industries. We have collected observations on total debt ratio; proportion of inside ownership; average tax rate; earnings before interest, tax, depreciation and amortization to sales ratio (EBITDA/S); price–earnings ratio (P/E); and price to sales ratio (P/S). The proportion of inside ownership is a metric of corporate governance, the total debt ratio, the average tax rate, and EBITDA to sales are metrics of operating performance, while the price-earnings ratio (P/E) and the price to sales ratio (P/S) are metrics of relative market valuation. These variables are routinely used in research in investments, corporate finance, and economics. There are many other metrics of performance that correlate very well with the ones used here. Including additional variables would be redundant and would render our cluster analysis less tractable.
The source of data are the cross-sectional series of industry and corporate finance indicators compiled yearly by Aswath Damodaran [22] from Bloomberg, Morningstar, Capital IQ, and Compustat. There were no missing data, and the descriptive statistics attached to our datasets are included as supplementary material.
3.2. Method
Our research employs cluster analysis, a statistical tool aimed at identifying groups within a larger dataset. The groups are made of individual observations with a high degree of similarity, according to a predefined criterion. There is a significant body of literature written on both the theoretical foundations and empirical applications of this method, including concrete guidance regarding the main steps to be followed when reporting the results [23].
We measured cluster tendency, identified the appropriate clustering algorithm, and assessed the stability of the clusters according to the recommendations of the econometric literature. To accomplish our goal, we used the open source software R, version 3.6.1. R provides several packages that cover a variety of methods and tools: in this paper, we use the clustertend package to assess the cluster tendency in data, the fpc package for flexible clustering methods and cluster validation, and clValid package for statistical validation of clustering results [24]. The package clValid is a particularly valuable toolkit for conducting a preliminary analysis of the tendency of data to cluster; the identification of the appropriate clustering method; and the stability of results.
In principle, clustering analysis can deal with any number of variables, ranging from one to many. We have strived to strike the right balance in choosing only six. We aim to capture the phenomenon under investigation from a complex, multi-faceted perspective and using only one variable would have made our industry analysis too narrowly focused. On the other hand, using too many variables would have diluted the significance of our results and made comparisons between groups problematic. In the end, we sampled what we believe are among the most representative metrics of operating performance, ownership, and market valuation. These metrics are routinely used in finance and economics analysis.
Our reliance on a relatively small number of metrics is in the spirit of previous research upholding the notion that parsimony is a virtue rather than a disadvantage. In [25], it is shown that while corporate governance can be described with a multitude of metrics, a mere handful of them are enough to capture the most important characteristics of the process.
3.2.1. Cluster Tendency
The first step in our analysis is the evaluation of cluster tendency. This is necessary because any data set, even purely random data, has an immanent propensity towards clustering. The problem becomes more acute with the increase in the size of the sample, when all models will tend to become asymptotically stable [26]. We use the clustertend package in order to calculate the Hopkins statistic, which measures the probability that a data set is randomly generated.
The Hopkins statistic [27] is obtained with the function hopkins(). Values significantly different from the 0.5 threshold (either below or above) are indicative of a very strong clustering tendency, and values closer to 0.5 show a very week clustering tendency. The null hypothesis is that the data is uniformly distributed, in which case no meaningful clusters are to be found. The alternative proposes that the data is not uniformly distributed and can be grouped in meaningful clusters. If the value of the calculated Hopkins statistic is significantly below or above 0.5, we reject the null hypothesis. Otherwise, we conclude that there are no meaningful clusters in the dataset. The results of this measurement are reported in Section 4.
3.2.2. Clustering Method
We choose among three alternative methods: hierarchical clustering, k means clustering, and partition around medoids. We use the clValid package to calculate, plot, and interpret three metrics that are specific to internal validation: the connectivity, silhouette width, and Dunn indexes.
The connectivity index captures the extent to which observations are close together and it is also a measure of connectedness [28]. The two other features of interest, compactness and separability, measure cluster homogeneity, and the degree of separation between clusters. They evaluate two opposite tendencies in the data, are nonlinearly combined, and generate the silhouette width and the Dunn index [29,30]. The silhouette width index requires assessing the confidence level when assigning observations to a particular cluster. This measure of confidence is expressed as a number ranging from −1 (for poorly assigned observations) to +1 (for correctly assigned, or well-clustered observations). The silhouette width index is calculated as the average of these degrees of confidence over the entire set of observations. Finding the appropriate clustering method and the right number of clusters requires the maximization of this index.
According to clValid documentation, stability validation is another recommended procedure for deciding the clustering method and the number of clusters. This procedure is built on four stability metrics: the average proportion of non-overlap (APN), the average distance (AD), the average distance between means (ADM), and the figure of merit (FOM) [24,31,32]. Stability validation entails a comparison between the initial clusters (based on the entire dataset) and subsequent clusters obtained after removing one and only one column at a time. The values of the four stability metrics described above decrease with the increase in the fitness of the clustering method. The results of stability validation are presented in Section 4.
3.2.3. Cluster Stability
The reproducibility of clustering [33] is based on the notion that a good algorithm will produce clusters that will not vary significantly with the sample [34]. Several functions in clValid and fpc, mostly the clusterboot() function, provide the bootstrapping procedure for estimating the Jaccard coefficient of similarity/stability, based on re-sampling with replacement from the original dataset.
The Jaccard coefficient of similarity/stability is calculated as the ratio of the total number of elements in the intersection of two data sets to the total number of elements in their reunion. We proceed by re-sampling each original cluster, and we calculate the Jaccard coefficient to determine the degree of similarity between the original clusters and their re-sampled variants. If the value of the Jaccard coefficient is less than 0.5, the cluster is dissolved. A cluster that is dissolved too often is indicative of random noise.
This procedure is iterated in the process of bootstrapping validation. In the last step, we calculate an overall Jaccard coefficient as the average of all Jaccard coefficients obtained from the all previous iterations. For an overall Jaccard coefficient of 0.6 and below, the clusters are deemed unstable. A value between 0.6 and 0.75 indicates stability, but also uncertainty regarding how observations should be grouped together. A Jaccard bootstrapping coefficient around 0.85 and above indicates that the clusters are stable [35]. The results of this final stage are presented in Section 4.
4. Results
Table 1 shows the values of the Hopkins statistic for both data sets. Since the calculated values are lower than 0.5, we conclude our data has a natural tendency to cluster. However, judging by the difference in the Hopkins statistic, it appears that the clustering tendency in the European data set (E-data henceforth) looks somewhat more pronounced than that in the US data set (US-data henceforth).
Subsequently, we use the function cvValid() to choose the most appropriate clustering method and the optimal number of clusters. One of the advantages of this function is that it can address multiple validation methods in one single application. In our case, we use internal and stability validation; the third method, biological validation, is not suitable for the data at hand. Table 2 and Table 3 present the ranking of the recommended options according to the connectivity, Dunn, and respectively silhouette indexes.
Figure 1 presents the connectivity indexes for all three methods, and for a number of clusters varying between 4 and 11. As it can be easily observed, in the case of E-data, the minimum value of the index is reached for hierarchical clustering with four clusters. The Dunn index is also maximized in the case of hierarchical clustering with four clusters. The silhouette width, however, shows preference for hierarchical clustering with five clusters.
In the same vein, in the case of US-data, Figure 2 shows that the connectivity index and the silhouette width index suggest hierarchical clustering with four clusters, while the Dunn index recommends hierarchical clustering with five clusters.
The stability measures used to find the preferred clustering method and the number of clusters, include APN, AD, ADM, and FOM. Table 4 and Table 5 present the recommendation derived after attempting to maximize each one of them.
However, as already discussed earlier, stability validation requires a preliminary check of the correlation between our dependent variables. The correlation matrix (calculated, but not reported here) shows the highest pairwise correlation at nearly 0.57, in the case of EBITDA/S and P/S. Other pairs of variables are weakly correlated; for example, EBITDA/S and debt ratio show a coefficient of only 0.0043. As a consequence, one would need to cross-validate these preliminary findings using the bootstrapping algorithm, as explained next.
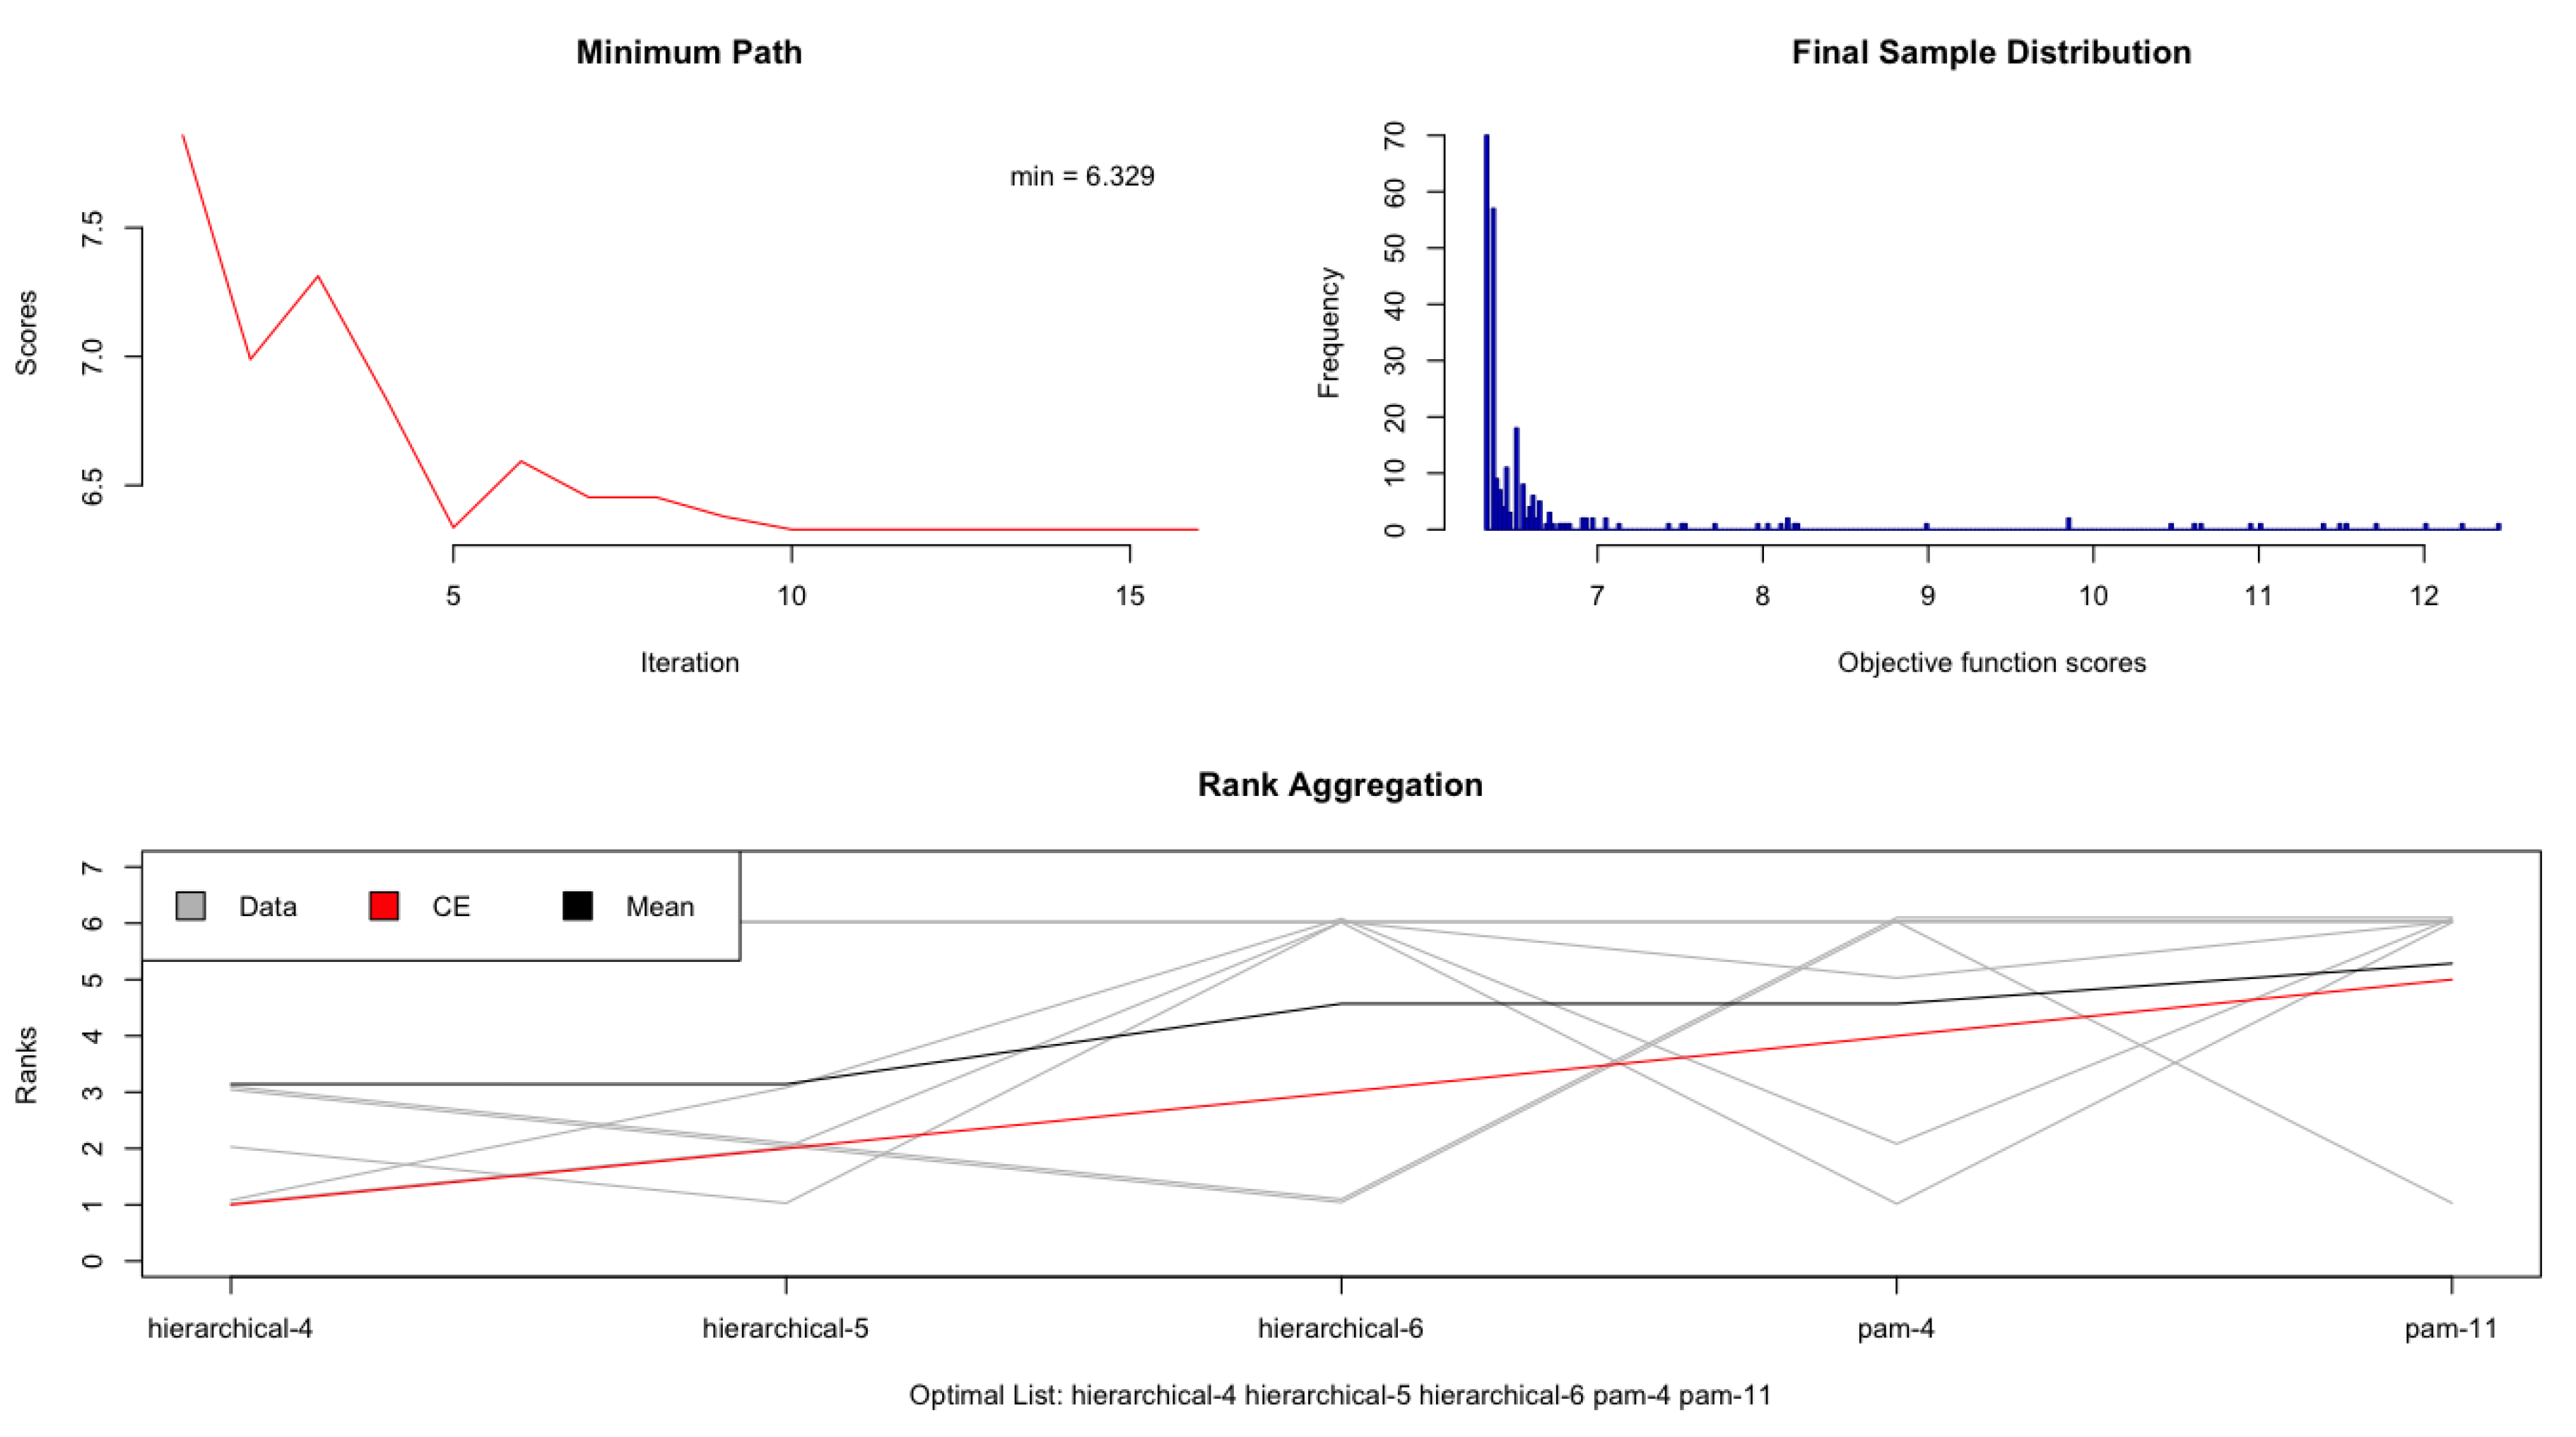
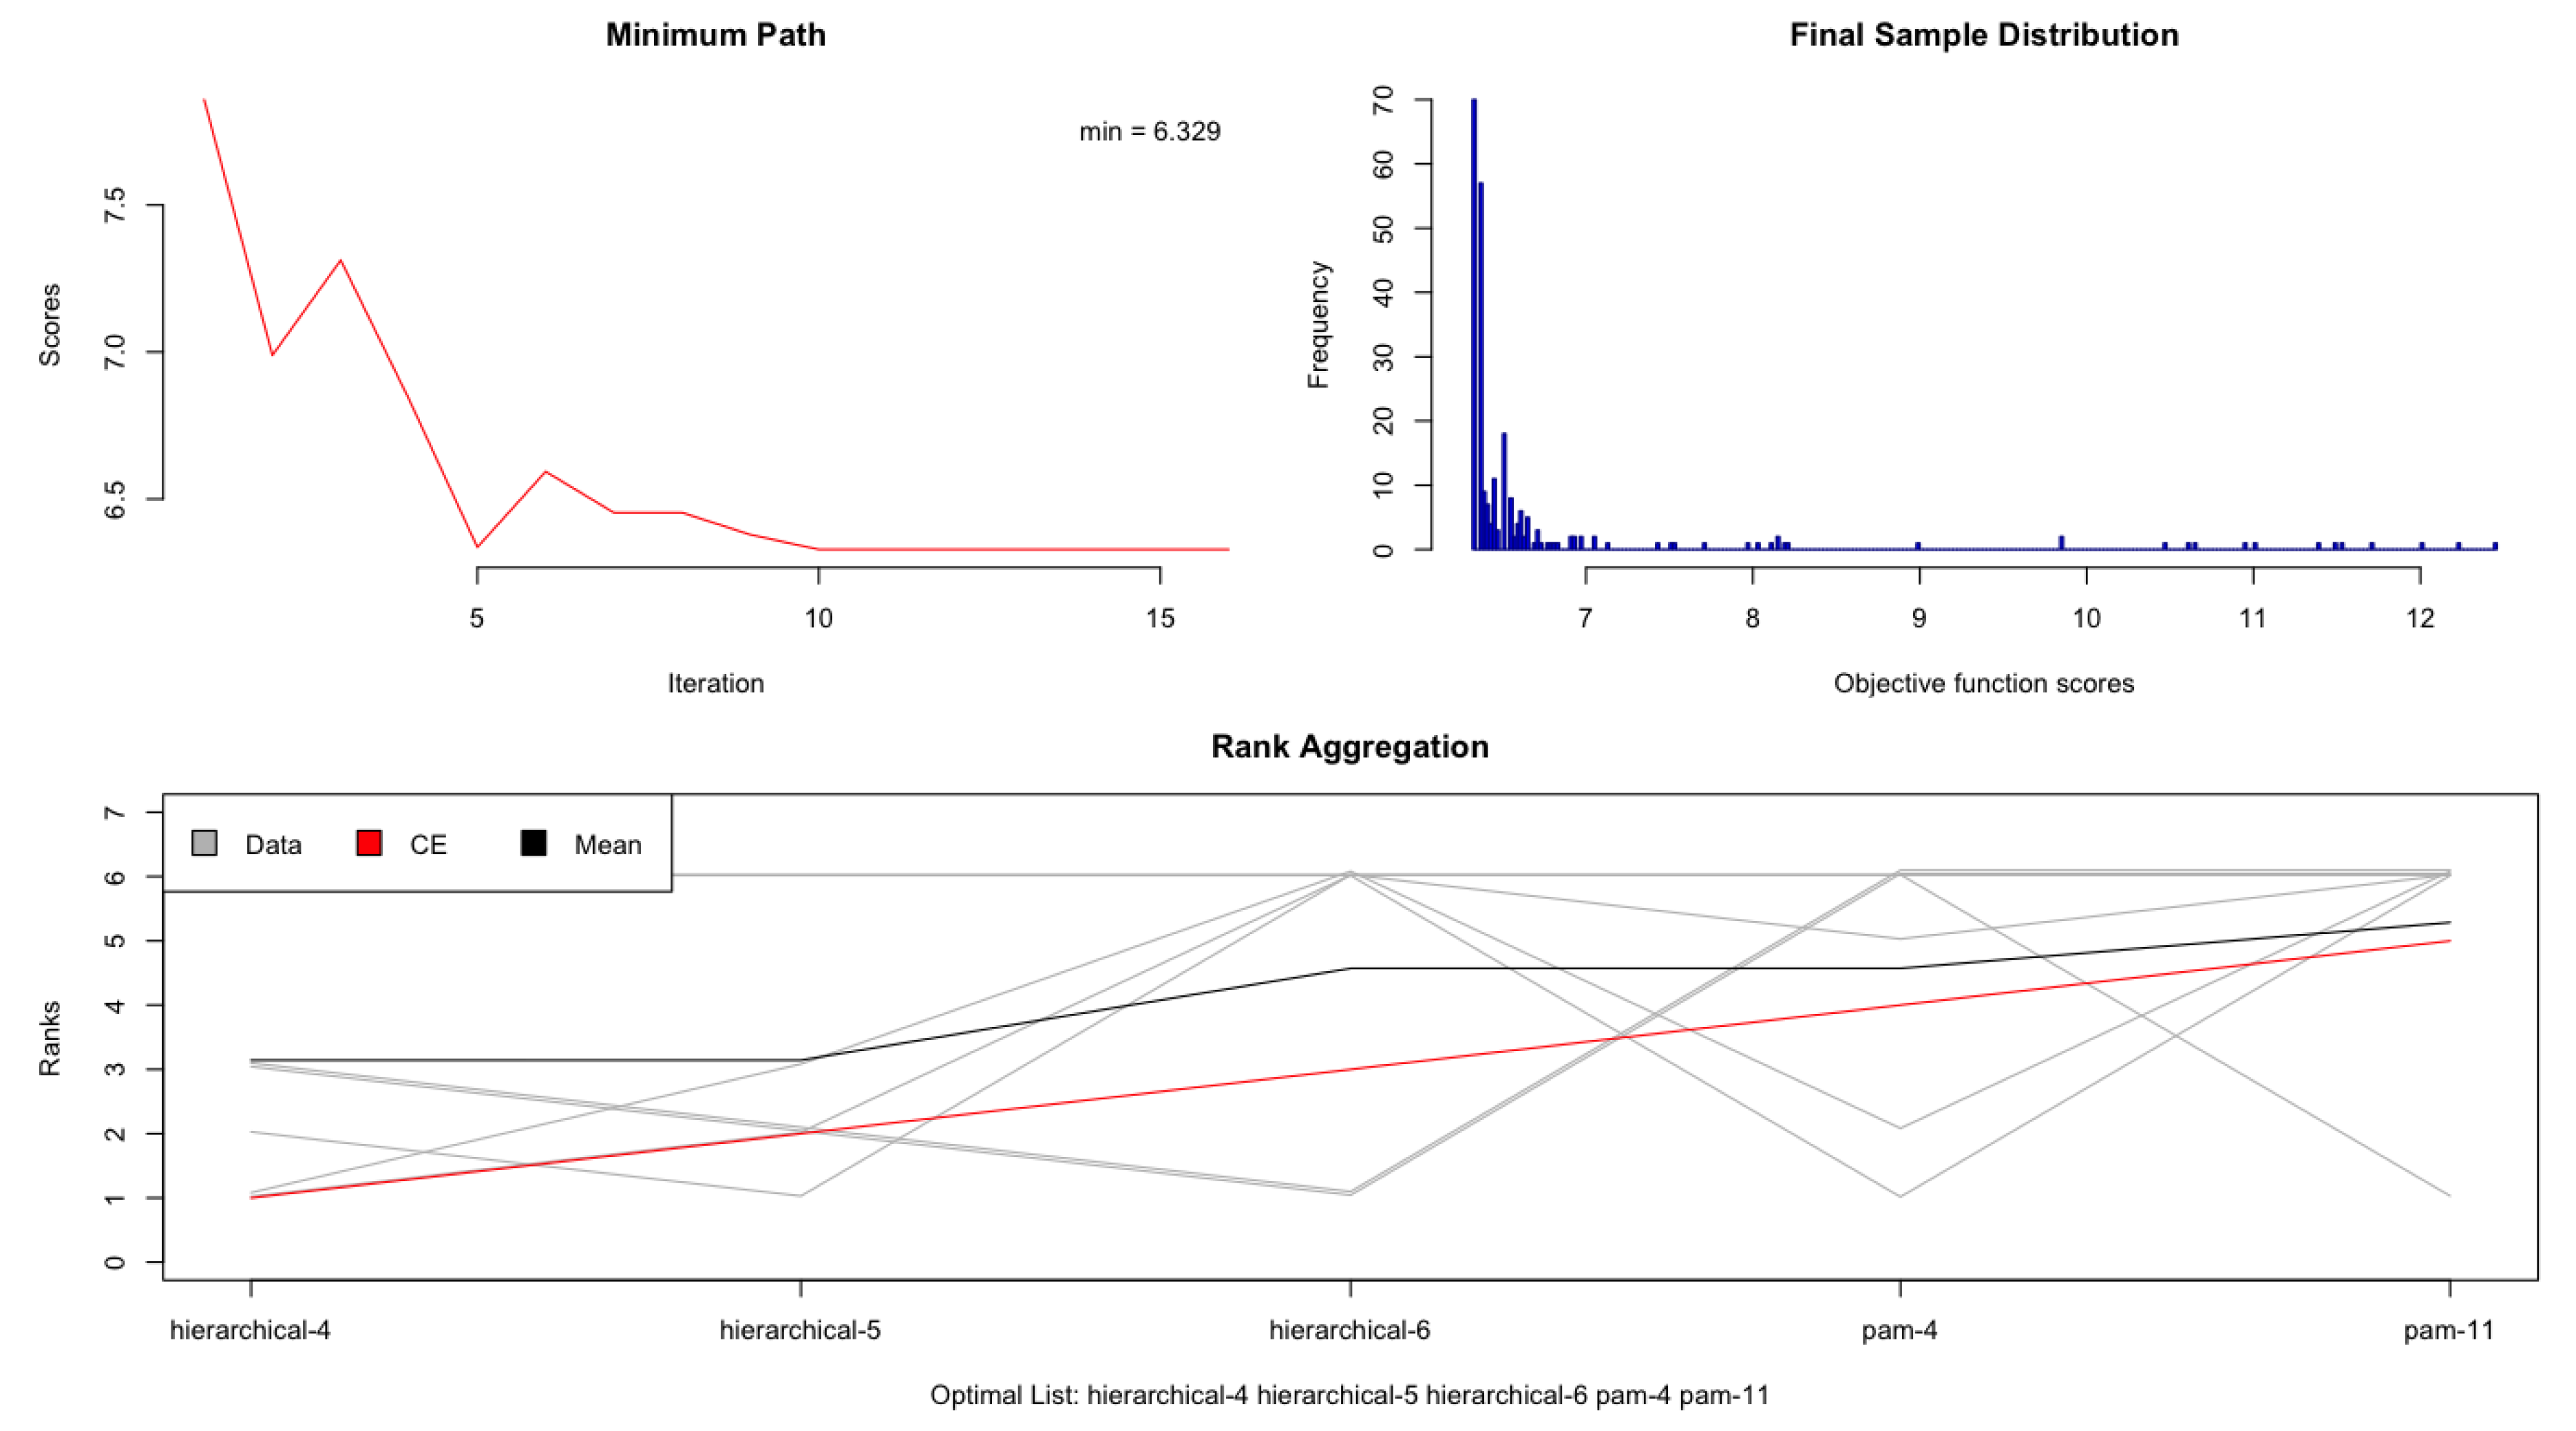
Table 2, Table 3, Table 4 and Table 5 suggest that it is difficult to infer the best algorithm following the two validation approaches described and used here. Fortunately, the RankAggreg package compiles a so-called optimal list, showing hierarchical clustering with 4 clusters, followed by hierarchical clustering with 5 clusters, hierarchical clustering with 6 clusters and two partitions around medoids, with 4 and 11 groups respectively in the case of E-data (Table 6). In case of the US-data (Table 7), the optimal list finds hierarchical clustering with 4 clusters, hierarchical clustering with 5 clusters, k-means clustering with 4 clusters, k-means clustering with 5 clusters and partition around medoids with 4 clusters. We conclude that hierarchical clustering is the most appropriate method, and 4 clusters seem to be optimal for both datasets.
We proceed to scale the original data by dividing the average tendency of each variable by its standard deviation. Then, we assess the similarity among observations using the Euclidean distance by calculating the shortest distance between two points in Euclidean spaces. The Ward linkage is implemented in an attempt to reduce the variance within each cluster, a procedure that allows us to assess the degree of industry homogeneity.
The graphical representation of the results of this selection procedure is shown in Figure 5 and Figure 6.
The 94 industries are more or less evenly distributed among the first three groups in both data sets. The fourth group is an outlier in both cases and we will continue to concentrate only on the first three. At first glance, the results are consistent with previous research. European corporations tend to carry more debt on average, although the difference appears smaller than suggested by previous findings. Yet again, there are almost two decades separating the data used in this research from the earlier data surveyed by [2,3,8,16,20].
This smaller than expected difference might already represent evidence of convergence in operating performance. On average, insiders hold a larger stake in European corporations, and ownership is more concentrated (the result is not reported here, as we do not focus on ownership concentration). US corporations report a higher income before interest and tax, but they are taxed less than their European counterparts.
The most dramatic differences are in terms of valuation, where US corporations trade at significantly higher earnings multiples (P/E) and command a higher P/S ratio. Overall, European corporations show lower valuations and a somewhat weaker operating performance. Perhaps the most dramatic difference pertains to market expectations. Investors appear more prudent towards European stocks, and more optimistic towards American stocks.
It still remains to be seen if the clustering result obtained here is proving stable and if there are other structural similarities between the two data sets beyond the optimal number of clusters. Both aspects would provide insights into the degree of economic and institutional convergence among European and American corporations.
The clusterboot() algorithm applied in the last step of our analysis provides this critical information. We run a sequence of 100, 1,000 and 10,000 resampling iterations. Table 8 shows that, despite the theoretically well-grounded selection of the clustering method and number of clusters, the clusters resulted from US-data are relatively unstable. Those derived from the E-data appear more stable, except for cluster 4, which includes only one industry. There remains a moderate level of uncertainty regarding the industry composition of each cluster. It is not surprising to find a modicum of cluster stability in the E-data set, and a relative lack of stability in the US-data set. This finding points towards a difference in market structure and dynamic between Europe and the United States.
The United States arguably represents a more integrated and flexible market, where competitive pressures and more uniform regulation lead to a higher degree of homogeneity among corporate players. The countries of the European Union, with their different cultures and languages, have worked hard to harmonize regulation and integrate their markets, but are still apart. Notwithstanding the liberalization of trade, capital flows, and labor movement, the adoption of common institutions and the adoption of a common currency, there remain important differences. The single European market looks more like a two-tier market, in which corporate operating performance, inside ownership, and market valuation appear segmented on several levels.
It is not clear, however, if this segmentation occurs along specific industries and across national borders, or if takes place across industries and along national borders. We tend to believe that a little bit of both might hold true. While larger multinational corporations can straddle national borders, relatively smaller corporations have a shorter reach and are sometimes constrained and contained by local regulation and local markets. National borders are seamless only for large corporate players who hold significant bargaining power and can easily arbitrage prices and regulations. Smaller firms probably find national borders to be very real.
Therefore, it is not enough to evaluate clustering tendencies in each data set. We would like to know how the two set of clusters compare. More similar clustering would indicate a greater degree of convergence between Europe and the United States. We already know there is some degree of dissimilarity because the clusters obtained from the US data appear less stable.
Next, we proceed with estimating a measure of dissimilarity between the two sets of clusters. We pair the groups in Table 6 and Table 7 between Europe and the United States, but for obvious reasons we discard the fourth group in each dataset. Thus, we obtain nine pairs of groups. For each pair, and each of the six variables—debt ratio, inside ownership, average tax rate, EBITDA/S, P/E, and, P/S—we subtract the values of the US-data from those of the E-data. We square the differences obtained in the previous step, aggregate them, and divide the total by 1000 to obtain a standardized index (score) that would allow the ranking of pairs in the decreasing order of their similarity. The ranking is obviously ordinal. A smaller dissimilarity score indicates pairs that are more similar. We also determine the number of industries that each pair of groups have in common, as shown in Table 9.
A cursory inspection suggests that pairs with a low dissimilarity score (i.e., groups that are similar) also have a higher number of industries in common. The results of the Wilcoxon signed-rank test (W-statistic = 0) suggest that indeed, the two treatments are different; more similarities between groups are associated with more industries in common.
The Mann–Whitney U test yields very similar results. Of the nine possible pairs, we keep the first three, that is, E2-US3, E3-US2, and E1-US1 and conclude they are the best matched. These are the pairs with the smallest overall differences in the six metrics used by our clustering analysis. Whether the best match also represents a good match is a different question altogether.
5. Discussions
When it comes to complex economic phenomena, the main challenge is to describe in a clear and concise manner what might be going on. One has to resort to conventions, omissions, and simplifications that sacrifice detail and accuracy for the sake of meaning. The situation at hand is no exception. The question of whether the operating performance and the governance of corporations in the United States and Europe converge along industry lines reflects a complex dynamic that does not result in dichotomous outcomes. One cannot answer with a simple yes or no; rather, we deal with an entire spectrum of convergence [36].
The data suggests that there remain important differences in corporate operating performance, ownership, and valuation within the European Union, on the one hand; and between the United States and Europe, on the other hand.
The United States arguably has a more homogeneous and well-integrated economy in which corporations and industries do not have to contend with national borders and multiple jurisdictions and regulations. The clustering of industries along the six metrics used here appears unstable for the simple reason that unhinged competitive pressures never stop reshaping the configuration of the corporate landscape. In the United States, integration proceeds unhindered on a continental scale.
Europe, on the other hand, continues to represent a mosaic of markets segmented along national borders, and arguably along industries. The European Union represents an unprecedented exercise in political and social engineering, yet it has managed to produce a lesser degree of economic integration than that observed in the United States. The ambitious drive towards a single European market has no doubt exceeded many expectations and represents a success in its own right; but it has stopped short of generating a comparable degree of economic cohesion and homogeneity.
There are 27 nations with different levels of economic development, different regulation, different economic policies, and a different dynamic of the corporate sector. Most likely, it was never intended that Europe would one day function just like the United States (not the mention the few European nations that are still outside the EU).
Evidence from large social networks show that logistic and regulatory constraints influence the behavior of the system. In general, all complex networks have a tendency to cluster and form layers of complexity, but the patterns of segmentation and layering are sensitive to a multitude of constraints that determine the nature of the interaction among the agents within the network [37]. It is quite possible that differences in regulatory and border constraints between the United States and Europe have produced a different pattern of layering and segmentation in their corporate networks and alongside industry lines.
A different type of constraint is represented by technology. Although globalization has resulted in the adoption of more or less comparable technologies, there are subtle differences in the way these are handled and implemented locally. For example, the United States and Europe have chosen a different solution for the allocation and implementation of broadband wireless access network [38]. At face value, this might appear innocuous, but it might nevertheless generate structural implications that are difficult to ascertain and investigate. In this case, and most likely in other instances where different technology standards have been adopted, economic and political interests might have well been behind the drive to nudge the segmentation and layering of the corporate landscape. Technical standards have been used for a long time as a substitute for more explicit protectionist policies. Whether a political agenda is present or not, technology always plays a major role in the shaping of competition among corporations and the segmenting of markets.
Nonetheless, the discussion of the extant dissimilarities highlighted by our analysis needs to be qualified. There are differences in clustering stability, but we have been able to match three pairs. There are three groups with comparable economic performance, ownership, and valuation, sharing in common a relatively high number of industries.
This finding seems to suggest that convergence, as defined earlier is, probably occurring in some areas. There are large corporations and industries spanning both continents (and possibly more than two), straddling national borders, and arbitraging regulations and markets. We probably witness a two-tier market dynamic, in which integration and convergence between the United States and Europe has already occurred on the ‘upper’ level; and in which the two economic super-entities are still apart, and arguably diverging, on the ‘lower’ level. Future research might have to look within each industry, and differentiate between small and large corporations. There is already evidence showing that indeed large, multinational enterprises are part of a distinct complex network of global corporate control, boasting a different dynamic from that of small and medium companies. In a seminal paper published in 2011, a group of researchers painstakingly mapped the network structure of transnational corporate control [39], revealing that ownership schemes transcend national borders and industries. This finding is consistent with the results presented here, and lends credibility to our conclusions pertaining to the multi-layering of the corporate network. Another direction for further research would have to investigate the differential impact of technological change on the layering and segmentation of the corporate network.
6. Conclusions
We set out to investigate the extent to which the corporate sector in the United States and the countries of Europe have achieved economic integration and convergence. We define convergence as the homogenization of economic performance, institutional arrangements, and market valuation along industry lines.
Economic integration and institutional convergence has been a favored research topic among economists and scholars interested in corporate governance. Our analysis departs from the traditional approach focused on the evaluation of linear relationships among a handful of performance metrics. We adopt a line of inquiry focused on the deeper structure of the phenomenon with the understanding that we are dealing with complex corporate networks, layered and segmented alongside—and sometimes across—industry boundaries.
We perform an industry driven cluster analysis and find that industries and corporations on both continents cluster in four groups, based on six variables measuring operating performance, ownership, and market valuation. We discard the fourth group in either case, because it appears to be an outlier. We rank and match the remaining three groups based on the magnitude of the differences in the six metrics under consideration and based on the number of industries shared in common. With three groups on each side we generate nine pairs of various levels of homogeneity. We are able to match three pairs that appear to have a low degree of dissimilarity. The clusters from the American dataset are unstable. The European data set generates clusters that are appear more stable, but with some measure of uncertainty.
Cluster analysis is an investigative approach akin to unsupervised learning. One can glean the complex structure of the phenomenon under research, but there are limits to the extent to which one can understand in detail what is really going on. There is a trade-off between accuracy and meaning. One has to be aware that beyond the technical interpretation of the methodology, most of the economic interpretation is somewhat speculative. In this research, however, we find strong circumstantial evidence of a well-integrated American economy, and a multi-national Europe still struggling with disparities. In spite of relentlessly moving towards a European single market over the last five decades, the various countries of the European Union still appear more like a mosaic than a melting pot.
This conclusion relies on the results presented earlier. We interpret the relative lack of stability in clusters as evidence of a greater homogeneity (economic integration and convergence) in the case of the United States; and the more stable clusters as evidence of lesser homogeneity (economic integration and convergence) in the case of European data. We interpret the number of pairs of matched clusters between the US data and European data as evidence of the degree of convergence attained between the US and Europe. There is no other interpretation that seems to make sense.
Whether the United States and the countries of Europe have achieved convergence is definitely not a question that can be answered with a simple yes or no. There are large corporations moving seamlessly about the regulatory labyrinth and the financial markets of both continents. For these firms, national borders are mere markers signaling arbitrage opportunities. Other firms, however, might be constrained by national and regulatory boundaries and operate in a well-delineated perimeter. Integration and convergence, to the extent to which it occurs, has left behind a clear segmentation within the European Union, and another one between the European Union and the United States.
There is little doubt that regulatory differences and national boundaries influence the manner in which layering and segmentation occurs in the corporate sector alongside and across industry lines. The adoption of different technological standards is another factor to take in consideration. In the past, these have been successfully used as a substitute for a more militant protectionist approach. Whether driven by political agendas, or natural factors, technology has always played a major role in reshuffling and reshaping competition in the corporate sector, and across various markets. The methodology used in this paper considers the overall economic outcome and is not able to differentiate among its determinants. Any future in-depth investigation of economic integration would have to take regulation, technology and size into consideration. This is a formidable task in itself, because the detailed structure of layering and segmentation in the corporate network cannot be captured by a handful of traditional metrics.
While very challenging to implement, this type of analysis has been attempted before. The 2011 research mentioned earlier used a state-of-the-art methodology in order to determine the connections and ramifications of the network of global corporate control. We are very encouraged by the findings of this paper because it is consistent with our own findings and conclusions and because it might provide the methodological basis for tackling subsequent investigations of complex corporate networks. Further research would also need to investigate how clustering evolves with time, a question that has not been addressed here. This issue is most likely linked with that of clustering stability over the long run. We hope that in the future, our conclusions will be validated and corroborated through alternative methodologies.
Supplementary Materials
The following are available online at https://www.mdpi.com/2227-7390/8/3/451/s1.
Author Contributions
Conceptualization, E.D. and C.V.; Methodology, E.D.; Software, E.D.; Investigation, C.V.; Data curation, C.V.; Writing—original draft preparation, E.D. and C.V.; Writing—review and editing, C.V. All authors have read and agreed to the published version of the manuscript.
Funding
This work was supported in part by a publication grant from Bishop’s University.
Conflicts of Interest
The authors declare no conflict of interest.
References
- Aoki, M. The Contingent Governance of Teams: Analysis of Institutional Complementarity. Int. Econ. Rev. 1994, 35, 657. [Google Scholar] [CrossRef]
- Shleifer, A.; Vishny, R.W. A Survey of Corporate Governance. J. Finance 1997, 52, 737–783. [Google Scholar] [CrossRef]
- La Porta, R.; Lopez-de-Silanes, F.; Shleifer, A.; Vishny, R.W. Law and Finance. J. Polit. Econ. 1998, 106, 1113–1155. [Google Scholar] [CrossRef]
- Fohlin, C. Financial Systems. In Handbook of Cliometrics; Springer: Berlin/Heidelberg, Germany, 2016; pp. 393–430. ISBN 978-3-642-40405-4. [Google Scholar]
- Blass, A.; Yafeh, Y. Vagabond shoes longing to stray: Why foreign firms list in the United States. J. Bank. Finance 2001, 25, 555–572. [Google Scholar] [CrossRef]
- Gugler, K.; Mueller, D.C.; Burcin Yurtoglu, B. The Impact of Corporate Governance on Investment Returns in Developed and Developing Countries. Econ. J. 2003, 113, F511–F539. [Google Scholar] [CrossRef] [Green Version]
- Pagano, M.; Volpin, P.F. The Political Economy of Corporate Governance. Am. Econ. Rev. 2005, 95, 1005–1030. [Google Scholar] [CrossRef]
- La Porta, R.; Lopez-De-Silanes, F.; Shleifer, A.; Vishny, R.W. Legal Determinants of External Finance. J. Finance 1997, 52, 1131–1150. [Google Scholar] [CrossRef]
- Elsner, W. The process and a simple logic of ‘meso’. Emergence and the co-evolution of institutions and group size. J. Evol. Econ. 2010, 20, 445–477. [Google Scholar] [CrossRef]
- Williamson, J.G. Globalization, Convergence, and History. J. Econ. Hist. 1996, 56, 277–306. [Google Scholar] [CrossRef] [Green Version]
- Khanna, T.; Kogan, J.; Palepu, K. Globalization and Similarities in Corporate Governance: A Cross-Country Analysis. Rev. Econ. Stat. 2006, 88, 69–90. [Google Scholar]
- Ben-David, D. Equalizing Exchange: Trade Liberalization and Income Convergence. Q. J. Econ. 1993, 108, 653–679. [Google Scholar] [CrossRef]
- Solow, R.M. A Contribution to the Theory of Economic Growth. Q. J. Econ. 1956, 70, 65. [Google Scholar] [CrossRef]
- Baumol, W.J. Productivity Growth, Convergence, and Welfare: What the Long-Run Data Show. Am. Econ. Rev. 1986, 76, 1072–1085. [Google Scholar]
- Romer, P.M. Increasing Returns and Long-Run Growth. J. Polit. Econ. 1986, 94, 1002–1037. [Google Scholar] [CrossRef] [Green Version]
- Bradley, M.H.; Schipani, C.A.; Sundaram, A.K.; Walsh, J.P. The Purposes and Accountability of the Corporation in Contemporary Society: Corporate Governance at a Crossroads. SSRN Electron. J. 2000. [Google Scholar] [CrossRef] [Green Version]
- Raghuram, R.G.; Zingales, L. The Governance of the New Enterprise. In Corporate Governance, Theoretical and Empirical Perspectives; Cambridge University Press: Cambridge, UK, 2000; pp. 201–226. ISBN 0-521-78164-7. [Google Scholar]
- Hansmann, H.; Kraakman, R. The End of History for Corporate Law. Georgetown Law J. 2001, 89, 439–468. [Google Scholar]
- La Porta, R.; Lopez-De-Silanes, F.; Shleifer, A.; Vishny, R. Investor Protection and Corporate Valuation. J. Finance 2002, 57, 1147–1170. [Google Scholar] [CrossRef]
- Denis, D.K.; McConnell, J.J. International Corporate Governance. J. Financ. Quant. Anal. 2003, 38, 1. [Google Scholar] [CrossRef]
- Stulz, R.M.; Williamson, R. Culture, openness, and finance. J. Financ. Econ. 2003, 70, 313–349. [Google Scholar] [CrossRef] [Green Version]
- Damodaran, A. Various Industry and Corporate Finance Statistics Compiled from Bloomberg, Morningstar, Capital IQ and Compustat. 2017. Available online: http://pages.stern.nyu.edu/~adamodar/ (accessed on 20 December 2017).
- Clatworthy, J.; Buick, D.; Hankins, M.; Weinman, J.; Horne, R. The use and reporting of cluster analysis in health psychology: A review. Br. J. Health Psychol. 2005, 10, 329–358. [Google Scholar] [CrossRef]
- Brock, G.; Pihur, V.; Datta, S.; Datta, S. clValid: An R Package for Cluster Validation. J. Stat. Softw. 2008, 25. [Google Scholar] [CrossRef] [Green Version]
- Bebchuk, L.A.; Cohen, A.; Ferrell, A. What Matters in Corporate Governance? Rev. Financ. Stud. 2009, 22, 783–827. [Google Scholar] [CrossRef] [Green Version]
- Shamir, O.; Tishby, N. Cluster Stability for Finite Samples. In Proceedings of the Twenty-First Annual Conference on Neural Information Processing Systems; NIPS Proceedings: Vancouver, BC, Canada, 2007; pp. 1297–1304. [Google Scholar]
- Banerjee, A.; Dave, R.N. Validating clusters using the Hopkins statistic. In Proceedings of the 2004 IEEE International Conference on Fuzzy Systems (IEEE Cat. No.04CH37542); IEEE: Budapest, Hungary, 2004; Volume 1, pp. 149–153. [Google Scholar]
- Handl, J.; Knowles, J.; Kell, D.B. Computational cluster validation in post-genomic data analysis. Bioinformatics 2005, 21, 3201–3212. [Google Scholar] [CrossRef] [PubMed] [Green Version]
- Rousseeuw, P.J. Silhouettes: A graphical aid to the interpretation and validation of cluster analysis. J. Comput. Appl. Math. 1987, 20, 53–65. [Google Scholar] [CrossRef] [Green Version]
- Dunn, J.C. Well separated clusters and fuzzy partitions. J. Cybern. 1974, 4, 95104. [Google Scholar] [CrossRef]
- Datta, S.; Datta, S. Comparisons and validation of statistical clustering techniques for microarray gene expression data. Bioinformatics 2003, 19, 459–466. [Google Scholar] [CrossRef]
- Yeung, K.Y.; Haynor, D.R.; Ruzzo, W.L. Validating clustering for gene expression data. Bioinformatics 2001, 17, 309–318. [Google Scholar] [CrossRef]
- Lange, T.; Roth, V.; Braun, M.L.; Buhmann, J.M. Stability-Based Validation of Clustering Solutions. Neural Comput. 2004, 16, 1299–1323. [Google Scholar] [CrossRef]
- Ben-David, S.; von Luxburg, U.; Pal, D. A Sober Look at Clustering Stability. In Lecture Notes in Computer Science, (Conference proceedings: Learning Theory, 19th Annual Conference on Learning Theory); COLT: Pittsburgh, PA, USA, 2006; pp. 5–19. ISBN 978-3-540-35296-9. [Google Scholar]
- Zumel, N.; Mount, J. Practical Data Science with R; Manning Publications Co: Shelter Island, NY, USA, 2014; ISBN 978-1-61729-156-2. [Google Scholar]
- Castellacci, F.; Los, B.; de Vries, G.J. Sectoral productivity trends: Convergence islands in oceans of non-convergence. J. Evol. Econ. 2014, 24, 983–1007. [Google Scholar] [CrossRef]
- Thai, M.T.; Wu, W.; Xiong, H. (Eds.) Big Data in Complex and Social Networks; CRC Press: Boca Raton, FL, USA, 2016. [Google Scholar]
- Singhal, C.; De, S. (Eds.) Resource Allocation in Next-Generation Broadband Wireless Access Networks; IGI Global: Hershey, PA, USA, 2017. [Google Scholar]
- Vitali, S.; Glattfelder, J.B.; Battiston, S. The Network of Global Corporate Control. PLoS ONE 2011, 6, e25995. [Google Scholar] [CrossRef]
Figure 1.
Plots of the connectivity, Dunn index, and silhouette width (Europe).

Figure 2.
Plots of the connectivity, Dunn index, and silhouette width (US).

Figure 3.
Result of the stability validation for Europe dataset.

Figure 4.
Result of the stability validation for US dataset.

Figure 5.
Rank aggregation used to derive the optimal list of methods and number of clusters (Europe).
Figure 5.
Rank aggregation used to derive the optimal list of methods and number of clusters (Europe).

Figure 6.
Rank aggregation used to derive the optimal list of methods and number of clusters (US).


Table 1.
Estimated Hopkins statistic for Europe and US.
| Data | Europe | US |
|---|---|---|
| Hopkins statistic | 0.163 | 0.216 |
Table 2.
Rank of recommended internal validation clustering methods (Europe).
| Measure | Rank 1 | Rank 2 | Rank 3 |
| Connectivity | Hierarchical-4 | Pam-4 | Hierarchical-5 |
| Dunn | Hierarchical-4 | Hierarchical-5 | Hierarchical-8 |
| Silhouette | Hierarchical-5 | Hierarchical-4 | Kmeans-4 |
Table 3.
Rank of recommended internal validation clustering methods (US).
| Measure | Rank 1 | Rank 2 | Rank 3 |
|---|---|---|---|
| Connectivity | Hierarchical-4 | Kmeans-4 | Pam-4 |
| Dunn | Hierarchical-5 | Hierarchical-6 | Kmeans-5 |
| Silhouette | Hierarchical-4 | Kmeans-4 | Pam-4 |
Table 4.
Ranking of recommended clustering methods in stability validation (Europe).
| Measure | Rank 1 | Rank 2 | Rank 3 |
| APN | Hierarchical-6 | Hierarchical-5 | Hierarchical-4 |
| AD | Pam-11 | Pam-10 | Kmeans-11 |
| ADM | Hierarchical-6 | Hierarchical-5 | Hierarchical-4 |
| FOM | Pam-4 | Pam-7 | Pam-5 |
Table 5.
Ranking of recommended clustering methods in stability validation (US).
| Measure | Rank 1 | Rank 2 | Rank 3 |
| APN | Hierarchical-4 | Kmeans-4 | Hierarchical-8 |
| AD | Pam-11 | Pam-10 | Kmeans-11 |
| ADM | Kmeans-5 | Hierarchical-6 | Pam-8 |
| FOM | Hierarchical-5 | Pam-7 | Pam-8 |
Table 6.
Europe-data clusters.
| Groups | Debt Ratio | Insider Holdings | Average Tax Rate | EBITDA to Sales | PE | P/Sales | Proportion |
|---|---|---|---|---|---|---|---|
| E3 | 0.48 | 0.15 | 0.18 | 0.10 | 29.96 | 0.92 | 0.35 |
| E1 | 0.22 | 0.25 | 0.15 | 0.13 | 54.40 | 1.31 | 0.32 |
| E2 | 0.30 | 0.14 | 0.09 | 0.24 | 65.61 | 2.69 | 0.32 |
| E4 | 0.33 | 0.20 | 0.13 | 0.11 | 5345.2 | 0.75 | 0.01 |
Table 7.
US-data clusters.
| Groups | Debt Ratio | Insider Holdings | Average Tax Rate | EBITDA to Sales | PE | P/Sales | Proportion |
|---|---|---|---|---|---|---|---|
| US1 | 0.25 | 0.15 | 0.10 | 0.14 | 46.69 | 1.37 | 0.38 |
| US2 | 0.42 | 0.13 | 0.19 | 0.13 | 44.83 | 1.31 | 0.31 |
| US3 | 0.26 | 0.17 | 0.08 | 0.29 | 100.79 | 3.72 | 0.30 |
| US4 | 0.26 | 0.12 | 0.16 | 0.20 | 2725.1 | 2.27 | 0.01 |
Table 8.
Clusterwise means of the bootstrapping procedure for Europe and the US for 100, 1000, and 10,000 resampling, rounded to four digits.
Table 8.
Clusterwise means of the bootstrapping procedure for Europe and the US for 100, 1000, and 10,000 resampling, rounded to four digits.
| Clusterwise Means | Number of Resampling | Cluster 1 | Cluster 2 | Cluster 3 | Cluster 4 |
|---|---|---|---|---|---|
| Europe data | 100 | 0.7153 | 0.6794 | 0.6450 | 0.5086 |
| 1,000 | 0.7406 | 0.6875 | 0.6951 | 0.4646 | |
| 10,000 | 0.7434 | 0.6966 | 0.6955 | 0.4814 | |
| Decision | - | Stable with uncertainty | Stable with uncertainty | Stable with uncertainty | Unstable |
| US data | 100 | 0.5347 | 0.5751 | 0.5582 | 0.5335 |
| 1,000 | 0.5452 | 0.5754 | 0.5460 | 0.4670 | |
| 10,000 | 0.5425 | 0.5700 | 0.5572 | 0.4758 | |
| Decision | - | Unstable | Unstable | Unstable | Unstable |
Table 9.
Ranking of the estimated degree of similarity between pair of groups. The dissimilarity score is calculated by aggregating the six standardized differences between the levels of the same variable for each pair of two groups, and dividing the sum by 1000. A smaller value of the dissimilarity score denotes groups that are more similar. The average number of industries per pair is the simple average of the number of industries in each pair of groups.
| Pairs of Groups | Dissimilarity Score | Average Number of Industries per Pair | Number of Common Industries per Pair |
|---|---|---|---|
| E2-US3 | 2.99 | 29 | 18 |
| E3-US2 | 2.99 | 30.5 | 17 |
| E1-US1 | 7.43 | 34.5 | 17 |
| E1-US2 | 11.69 | 30.5 | 6 |
| E3-US1 | 18.04 | 34.5 | 9 |
| E1-US3 | 19.47 | 30 | 4 |
| E2-US1 | 24.05 | 33.5 | 9 |
| E2-US2 | 24,05 | 29.5 | 3 |
| E3-US3 | 37,82 | 30 | 5 |
© 2020 by the authors. Licensee MDPI, Basel, Switzerland. This article is an open access article distributed under the terms and conditions of the Creative Commons Attribution (CC BY) license (http://creativecommons.org/licenses/by/4.0/).
Share and Cite
MDPI and ACS Style
Vâlsan, C.; Druică, E. Corporate Performance and Economic Convergence between Europe and the US: A Cluster Analysis Along Industry Lines. Mathematics 2020, 8, 451. https://doi.org/10.3390/math8030451
AMA Style
Vâlsan C, Druică E. Corporate Performance and Economic Convergence between Europe and the US: A Cluster Analysis Along Industry Lines. Mathematics. 2020; 8(3):451. https://doi.org/10.3390/math8030451
Chicago/Turabian StyleVâlsan, Călin, and Elena Druică. 2020. "Corporate Performance and Economic Convergence between Europe and the US: A Cluster Analysis Along Industry Lines" Mathematics 8, no. 3: 451. https://doi.org/10.3390/math8030451
Note that from the first issue of 2016, this journal uses article numbers instead of page numbers. See further details here.