Article

A Metaheuristic Algorithm for Flexible Energy Storage Management in Residential Electricity Distribution Grids

Power Engineering Department, Gheorghe Asachi Technical University of Iasi, 700050 Iasi, Romania
*
Author to whom correspondence should be addressed.
Mathematics 2021, 9(19), 2375; https://doi.org/10.3390/math9192375
Submission received: 2 September 2021 / Revised: 17 September 2021 / Accepted: 23 September 2021 / Published: 24 September 2021
(This article belongs to the Special Issue Metaheuristic Algorithms)

Abstract

:
The global climate change mitigation efforts have increased the efforts of national governments to incentivize local households in adopting PV panels for local electricity generation. Since PV generation is available during the daytime, at off-peak hours, the optimal management of such installations often considers local storage that can defer the use of local generation to a later time. The energy stored in batteries located in optimal places in the network can be used by the utility to improve the operation conditions in the network. This paper proposes a metaheuristic approach based on a genetic algorithm that considers three different scenarios of using energy storage for reducing the energy losses in the network. Two cases considers the battery placement and operation under the direct control of the network operator, with single and multiple bus and phase placement locations. Here, the aim was to maximize the benefit for the whole network. The third case considers selfish prosumer battery management, where the storage owner uses the batteries only for their own benefit. The optimal design of the genetic algorithm and of the solution encoding allows for a comparative study of the results, highlighting the important strengths and weaknesses of each scenario. A case study is performed in a real distribution system.

1. Introduction

The transition from the old vertically integrated, government-owned electricity trading model to the deregulated market has brought in many parts of the world the supply–demand balance as the main factor in establishing the price for electricity sold to the end consumers. On the wholesale market, which determines the prices offered by the suppliers to their clients, the short-term trading price can vary significantly between minimal values in off-peak intervals and maximal prices in high demand hours, which usually coincide with the peak demand hours of residential demand and network loading. In Romania, this market behavior is more significant, since more than half of the electricity is traded daily in the day-ahead market, for example, for 10 August 2021, there was a price variation from 77 EUR/MWh at 04.00 to 212 EUR/MWh at 21.00 [1].
On the other hand, in the last few decades, the developed countries have seen a shift in consumption from heavy industrial branches to an energy-efficient knowledge-based economy and a steady increase in the residential electricity demand [2]. At the same time, the growing concerns related to global warming have prompted international organizations and national governments to take concrete actions regarding the reduction in fossil fuel consumption and growth incentivization of the renewable electricity generation sector. The latest revision of the EU climate targets specify raising the share of renewable energy to 40% of the total electricity consumption by 2030 and reducing the GHG emissions by 55% by 2030, from the 1990 levels, with the aim of eliminating them by 2050 [3]. For the final consumers, these ambitious goals translate into the proliferation of small-scale clean electricity generation, especially in the residential sector. National governments are currently offering incentive packages to encourage individual residences to become prosumers, entities that consume and produce electricity at the same time [4].
The low-voltage (LV) electricity distribution networks (EDN), where the vast majority of these residential consumers are located, have the distinction that they supply one-phase consumers using a three-phase four-wire main feeder configuration. This generates the problem that, in most cases, the load is unbalanced between the three phases, leading to increased active energy losses and poor voltage quality. The presence of prosumers, which need to inject their unused generation surplus back into the network outside the control of the distribution network operator (DNO) can further impact the secure and efficient operation of the supply infrastructure. It follows that an adequate prosumer surplus management is required for the optimal operation of LV EDNs [5]. One method of achieving this goal is to use storage in the EDN.
It is usually considered that the prosumers generate electricity mainly for their own use, but they have to manage their surplus. If they use PV panels as a means to generate electricity, it is often the case that the hours that generation occurs do not coincide with the hours of maximum consumer and EDN load. In this case, the surplus can be injected back into the network or stored for later use.
In Romania, the current regulations issued by the Romanian Energy Regulatory Authority (RERA) specify that prosumers must sell back to the grid all surplus at regulated prices, computed as the average day-ahead market price for the previous year [6]. For 2020, this resulted in an actual price of 40 EUR/MWh, much lower than the day-ahead market price. Thus, storage can be used to replace the expensive energy used in peak demand hours with local generation, eliminating the need to sell back to the grid at low prices. Since storage systems are not yet subsidized, they are accessible for a relatively small number of prosumers. Community storage can also be used [7].
This paper proposes an algorithm for flexible energy storage management in residential low-voltage electricity distribution grids (ESMRG) that considers the optimization of storage placement in the network from the perspectives of prosumer and DNO gain.
The main contributions of the paper are:
  • The conceptualization of the mathematical model for three storage management approaches;
  • The adaptation of the general GA structure using common encoding for the three proposed scenarios;
  • The validation of the proposed algorithm in a case study that uses a real LV EDN from Romania; and
  • Discussions regarding the possible advantages and disadvantages of each storage solution.
The remaining sections of the paper are organized as follows. Section 2 discusses the state-of the art in the problem of storage management in EDNs and the use of metaheuristic methods in this type of optimization; Section 3 presents the adaptation of the basic GA to the problem of storage management as developed by the authors; and Section 4 provides the results of the case study. The paper ends with a discussion and main conclusions.

2. Related Literature

Prosumer surplus management is a key factor for the safe and efficient operation of EDNs. It is of importance for the prosumers who seek to maximize their advantage in terms of energy cost savings, and also for the network operator, who seeks to minimize the potential negative effect of the presence of the prosumers with unpredictable power injections in the grid. The latest research shows the need to better understand the effect of prosumer presence in LV distribution grids and their interaction with the DNO. Such a study was performed in [8] for Denmark and in [9] for the United States. The uncertainty of renewable generation patterns is also a factor requiring attention. In [10], this issue was studied by comparing the efficiency of several short-term forecasting methods. Based on such data, the prosumer–network interaction was modeled in [11] as a profit model of DNO concurrent with a utility model of the PV prosumers, where the operator wants to maximize its profit and the prosumers adjust their energy consumption and sharing according to the feed-in time-varying prices. Energy sharing between prosumers and its advantages and challenges were thoroughly reviewed in [12]. The authors of [13] analyzed the possibility of DNO strategies that use price-based demand side management (DSM) schemes for incentivizing the demand reduction. Another approach, developed in [14], considered the possibility of optimally managing prosumers that are acting independently, only in their self-interest, to maintain the voltage stability in the network within acceptable limits. The uncertainty of PV generation was managed in [10] by using a combination of load profiling and demand response techniques, and in [15] by creating energy hubs of prosumer communities. Prosumer management is more challenging for the network operator in islanded networks, a problem that was approached in [16].
Energy storage is used by prosumers to defer self-generated electricity consumption in order to avoid paying for electricity at high, peak-load tariffs. In [17], the authors analyzed the possibility of coordinating the operation of a PV prosumer with storage battery, with the goal of integrating it into the grid. At the level of an entire building, [18] proposed the management of HVAC systems by prosumers in cooperation with the grid operator and using storage to minimize the energy cost. The study in [19] proposed specific billing mechanisms to encourage selfish prosumers to combine energy exchange between households and to utilize their energy storage systems for minimizing the electricity cost. In [20], the same goal was pursued, but also encouraged the creation of “energy coalitions” between prosumers. Such coalitions can then use storage to participate in the wholesale market [21]. The optimal size of PV and power/energy capacities of the battery were also investigated in [22,23].
The research presented above concentrates on the optimization of prosumer operation and improving their goals. However, a second party directly interested in the behavior of the prosumer is the network operator. The accomplishment of the goals pursued by the prosumer must be correlated with the technical and economic interests of the DNO, which are directly influenced by the presence of the prosumer, as modeled in [24]. The intermittent nature of prosumer generation can negatively influence the energy losses [25] or bus voltage levels [26]. Current research suggests the optimization of the power injected to the grid by prosumers by using storage, resulting in over-voltage [27], generation–demand balance [28], or power loss [29] mitigation.
The latest trends regarding the use of storage for prosumer management is the implementation of community-shared storage, which can reduce the investment costs for prosumers and give network operators supplementary tools for optimizing the state of the distribution network [7,30,31].
Regarding the computational effort, the study carried out in [32] concluded that prosumer scheduling in microgrids is a NP-hard problem, for which optimization algorithms will find approximate solutions. It follows that, if the prosumer management is formulated as an optimization problem, the computational-intensive classical algorithms could be successfully replaced with other methods with marginal performance decrease. The literature survey from above lists several methods used for prosumer management problems: game theory [11,14,19,20], clustering [13], neural networks, random forest [10], mixed integer linear optimization [15,22,31], genetic algorithm [23], linear programming [21], alternating direction method of multipliers [18,30], dynamic programming [24], optimal power flow [26], and the proof-of-stake blockchain trading algorithm [29].
The classic optimization methods rely on deterministic analytical algorithms and converge to the optimal solution [33,34]. However, they are computationally intensive and are not suitable for problems with discrete search spaces. For problems belonging to this category, heuristic algorithms have been proven to be more flexible and efficient, with the drawback of decreased performance when the complexity of the problem increases [35].
Considering the particularities of the problem solved in the paper, a metaheuristic approach was chosen by the authors for implementing the optimization of storage placement in the LV distribution networks. Metaheuristic algorithms such as the genetic algorithm, particle swarm optimization, differential evolution, whale algorithm, and fireworks algorithm are nature-inspired optimization techniques that have proven their performance in problems regarding the optimization of operation conditions in electrical networks. Recently, they have been applied for integrating electric vehicles and distributed generation into smart grids [36], optimal reconfiguration of distribution networks [37], optimal power flow analysis in DC distribution networks [38], reliability improvement [39], and optimal consumption planning [40]. In this paper, a genetic algorithm was used to determine the optimal buses and phases of connection for a fixed number of storage units (batteries) with the aim of reducing the energy losses over a time interval of 24 h. The GA was preferred because, as the following subsection of the paper will describe in detail, it allows for simple and efficient modeling of the mentioned storage use scenarios, which is the same as using the same basic approach in solving three different problems with minimal modifications to a base case. This is an advantage offered by the metaheuristic approach, which retains its simplicity and flexibility with minimal performance cost.
To further develop the research performed in the literature and described above, the study assumed that storage could be installed in the network using two assumptions:
  • In the standard approach, where the individual prosumers acquire storage batteries together with the PV system, and employ them mainly to defer the use of surplus generated during the daytime for the peak load hours, in order to lower their daily costs of electricity.
  • In a novel approach, when the storage system is installed in the network at the initiative of the DNO, with the main aim of improving the operation conditions of the EDN. In this case, storage can be seen as
    individual batteries placed in different locations in the network; and
    a single community storage system [7].
The proposed algorithm investigates the advantages and disadvantages of each of the three proposed approaches, in terms of reducing the active energy losses in the EDN over a time interval of 24 h.

3. Materials and Methods

The genetic algorithm (GA) is a well-known metaheuristic belonging to the class of population-based evolutionary algorithms. Like many metaheuristics, it is inspired from natural behaviors and patterns, in this case the Darwinian natural selection. The algorithm mimics the continuous adaptation of a species to its environment by means of the ‘survival of the fittest’ principle. In the natural world, populations of variable sizes survive by reproduction and adaptation, with the most powerful or intelligent individuals being favored to pass their strong genes on to the next generation. The GA uses a mathematical representation of this process, and its application in solving NP-hard problems has been successful in a multitude of research and industry fields such as scheduling, multimedia content processing, network optimization, engineering, data mining, IoT, and blockchain [41,42,43].
The authors chose the GA to implement the energy storage management in residential electricity distribution grid (ESMRG) algorithm because of its specific technique of manipulating the elements of an individual from the population to obtain the optimal solution. The following subsections describe the basic structure of the GA and the implementation chosen by the authors for the ESMRG algorithm.

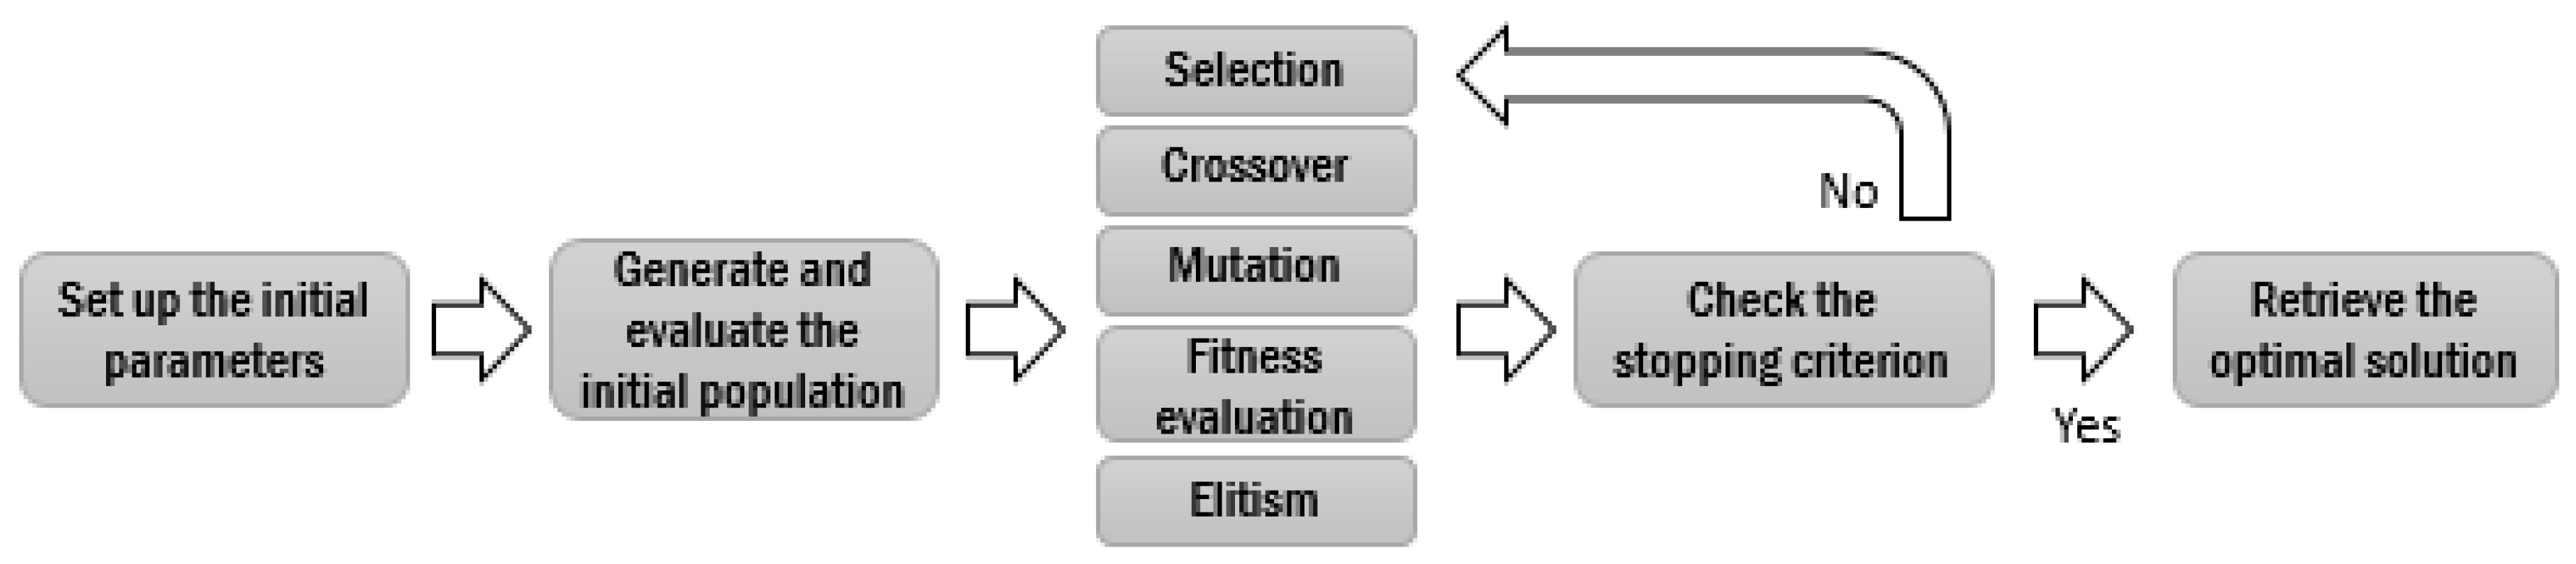
3.1. The Genetic Algorithm

The mathematical model of the GA considers a (usually) fixed size population where each member is hierarchized by using a numerical value called ‘fitness function’, which measures the performance in solving an optimization problem. Each member from the population is called a ‘chromosome’, and its elements are ‘genes’. The genes encode the parameters of a solution and each of them constitutes a search direction (dimension) for the algorithm. Thus, the GA can be considered as a parallel search algorithm.
Based on the values of their fitness functions, the chromosomes from the initial population are subjected to an iterative process in which their genetic structure is subjected to change through crossover (reproduction, gene exchange from parents to siblings) and mutation (random small changes in gene values). In each iteration (‘generation’), the chromosomes that are favored for reproduction are chosen using a selection procedure.
The literature lists various procedures for the selection and crossover operators [44] that must be chosen according to the specificities of the solved problem. To improve convergence, elitism techniques can be used to propagate the best-known solution from the current generation to the next. The basic flowchart of the GA is presented in Figure 1.

3.2. The Energy Storage Management Problem

The problem studied in the paper can be formulated as follows: given a low-voltage residential electricity distribution network in which a number of prosumers are active and can generate a surplus of electricity that otherwise would be injected back in the grid, find the optimal position of a number of storage devices (batteries) of known, fixed capacity, so that the active energy losses resulting from the operation of the network over a given time interval will be minimized.
The implementation chosen by the authors considered the following assumptions:
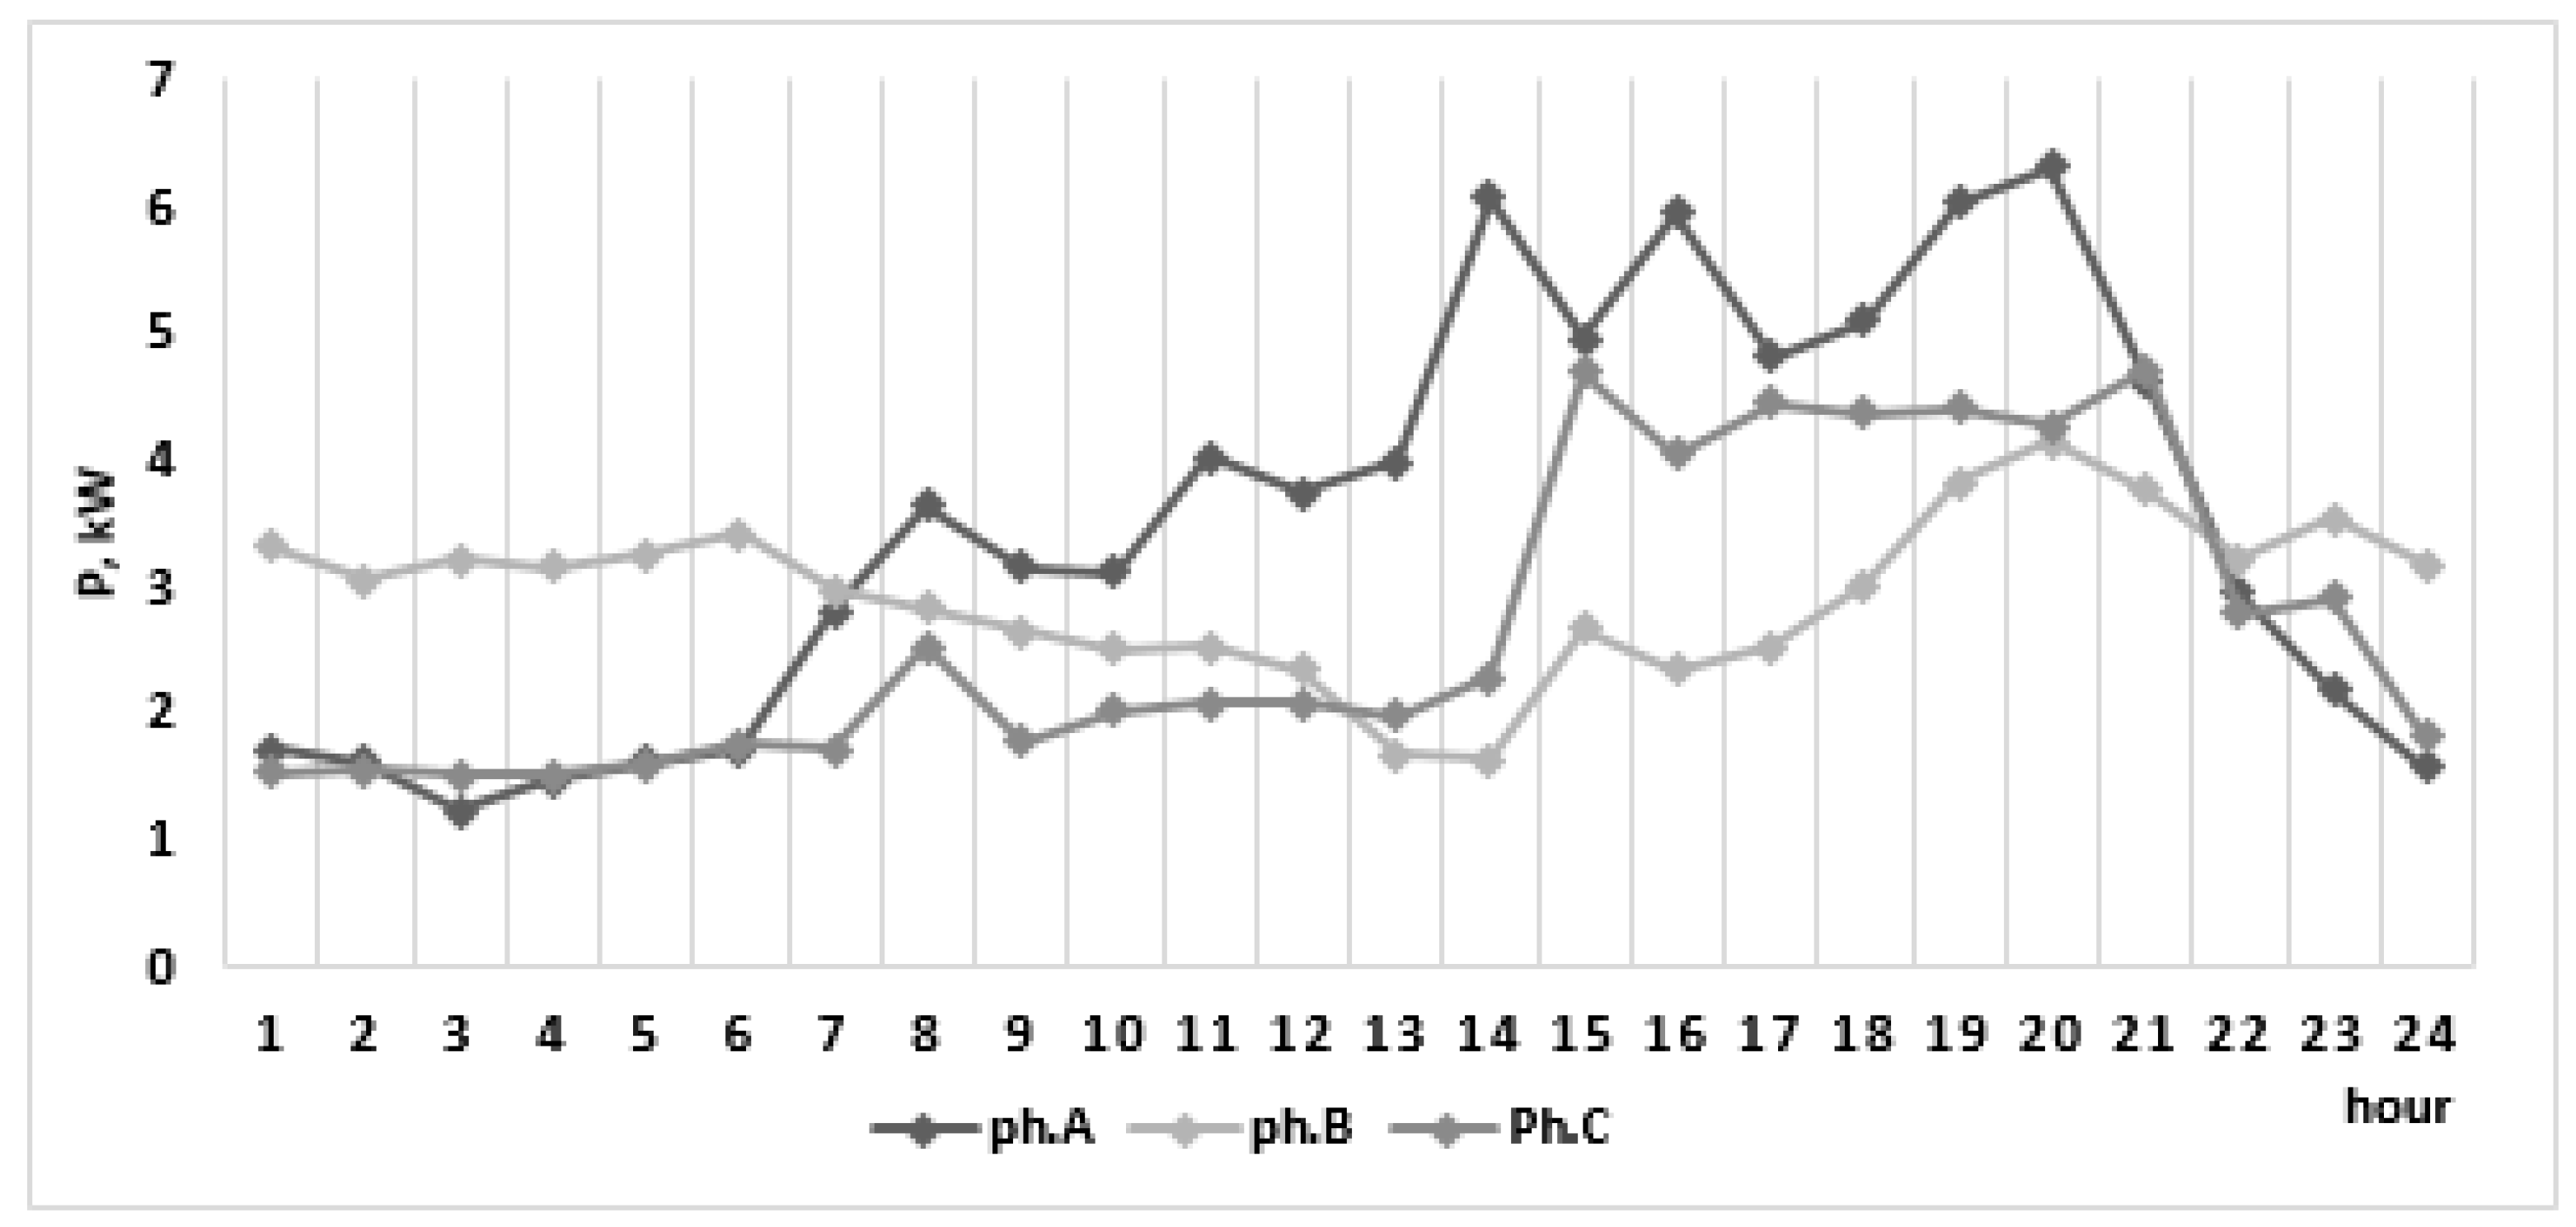
  • the LV network is operated in a three-phase, four-wire configuration and supplies one-phase residential consumers;
  • the demand pattern is unbalanced in space due to the uneven distribution of the consumers (as number and power demand, as connection on the phases), and unbalanced in time because of the normal demand variation of each consumer;
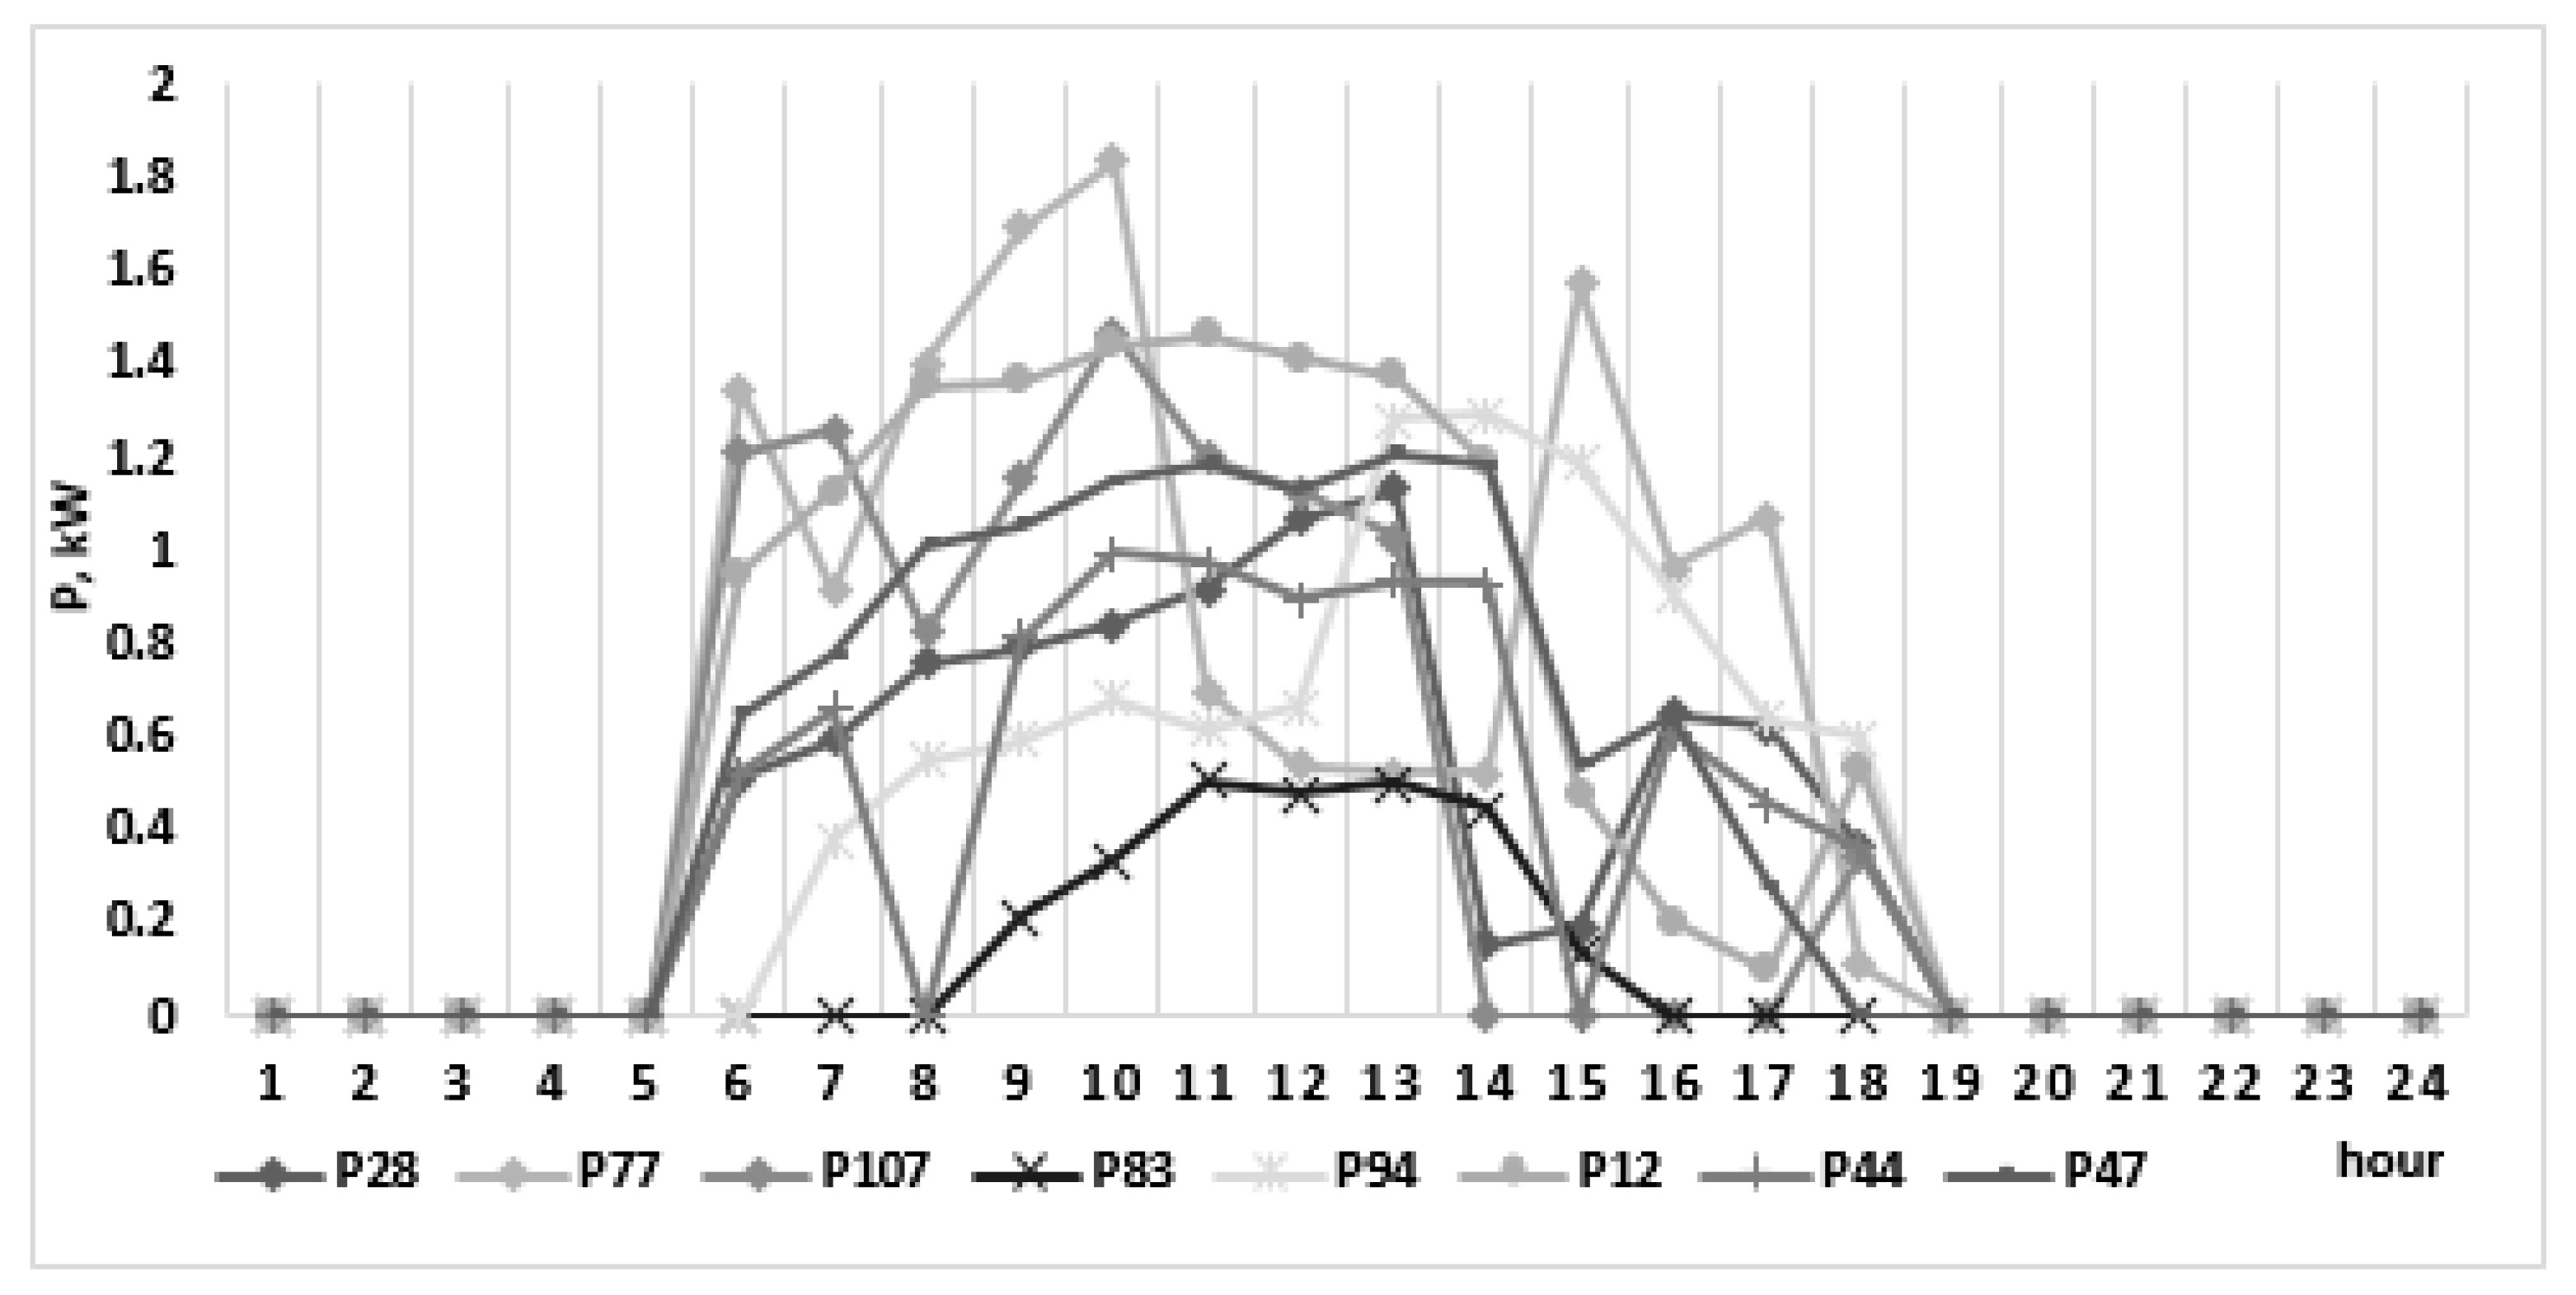
  • the prosumers connected in the network use PV panels for generating electricity, primarily for their own consumption;
  • to avoid injecting the prosumer surplus back into the grid, a number of equal capacity storage batteries will be placed in the network; and
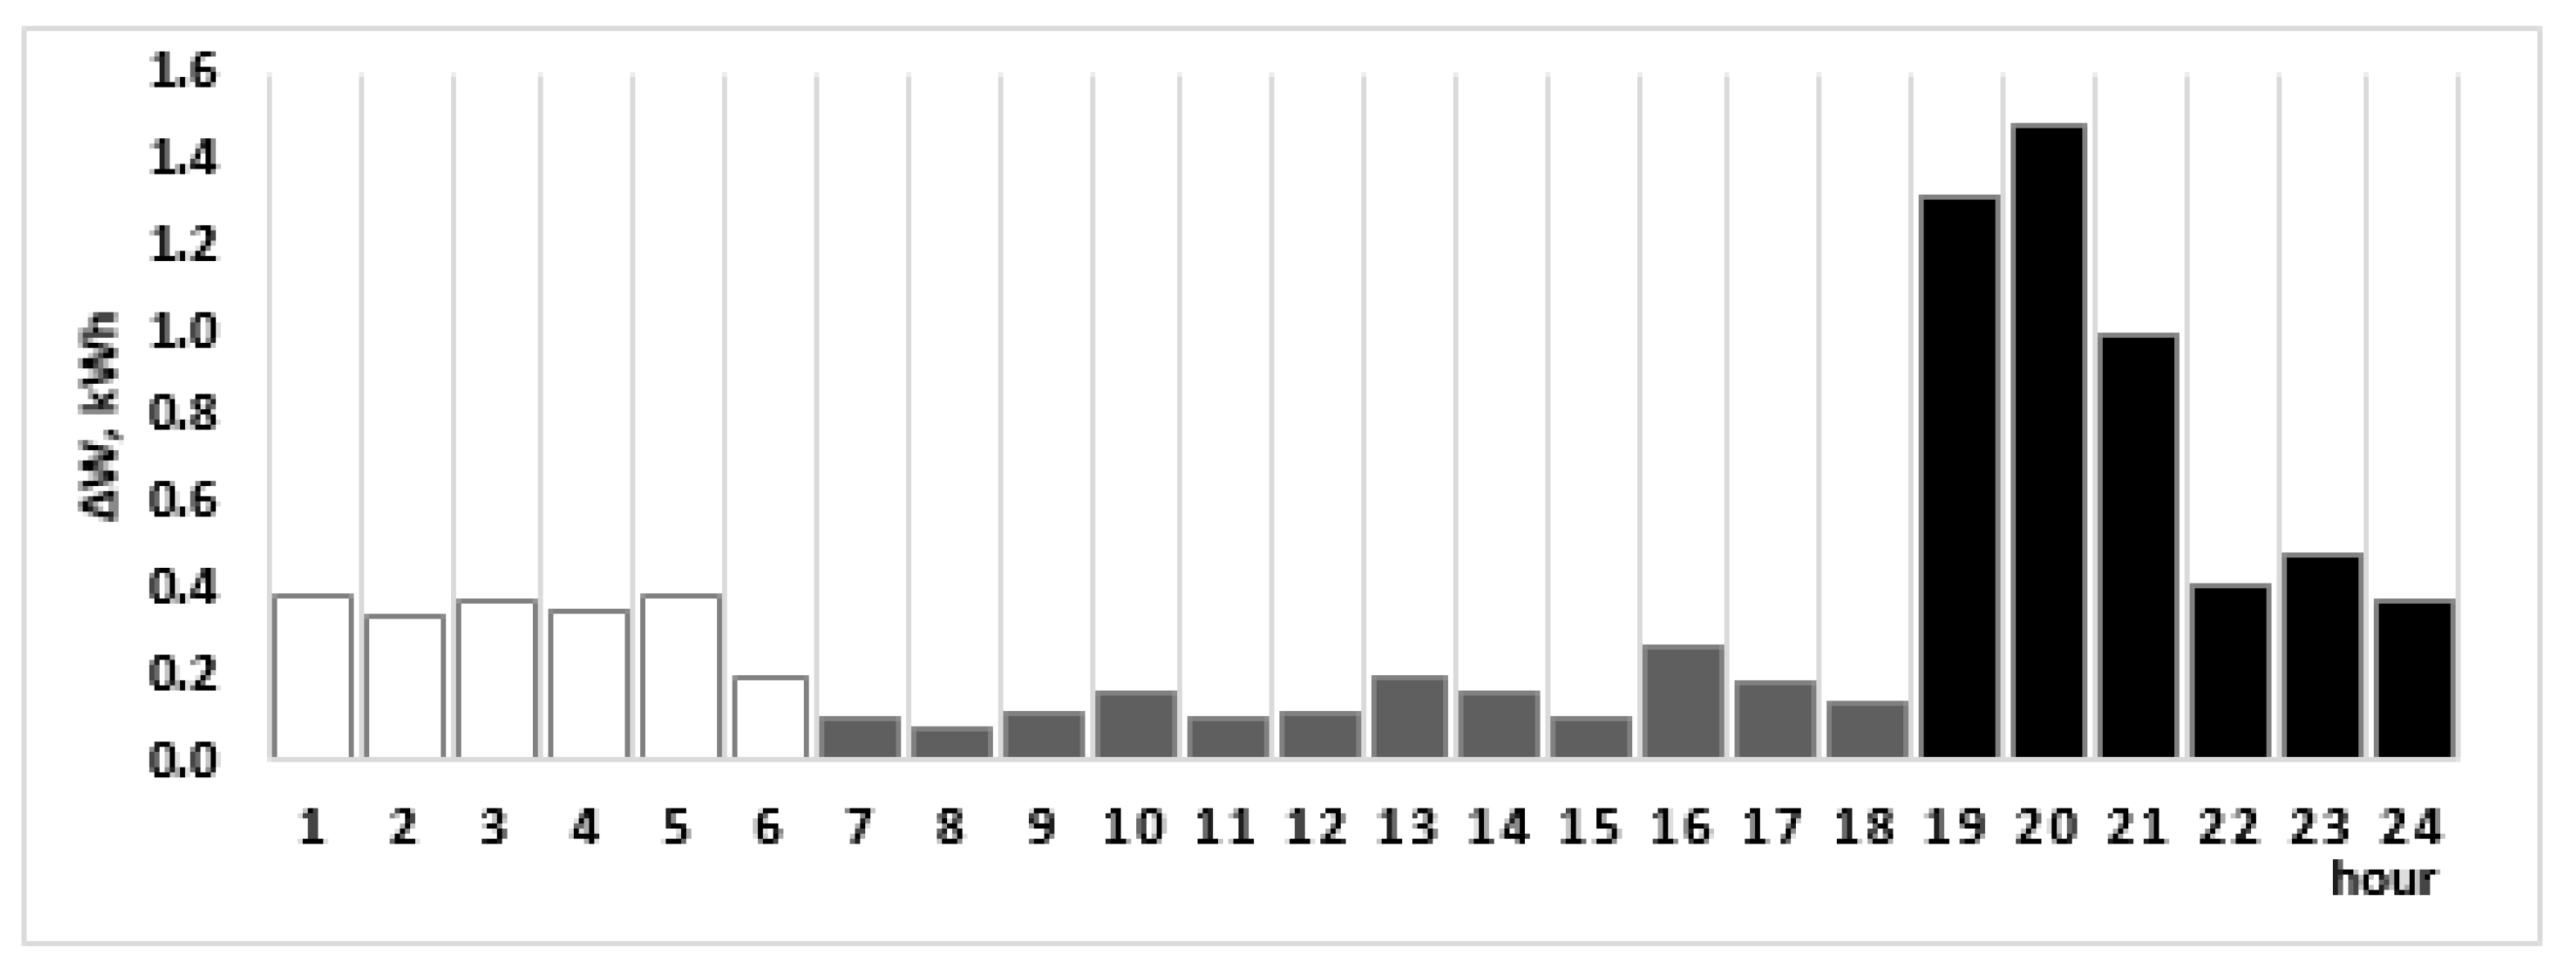
  • the optimal placement of the batteries is performed so that the energy loses computed in the network for a time interval of 24 h, with the bus loads affected by the charge and discharge of the stored energy, will be minimized.
In the literature, surplus management is performed centered on maximizing the wellbeing of the prosumers. One of the main contributions proposed in the paper is the consideration of DNO priorities in the optimization of storage management.
Storage equipment is mainly installed in the network by the prosumers, together with the PV system, and used to defer the consumption of the surplus at peak hours. In this way, the prosumer will contribute to reducing the peak load in the EDN, and replace the expensive electricity bought from the grid with the stored surplus, at no immediate cost. In this case, the batteries are managed by the prosumer using their own home energy management system and the benefits for the DNO are minimal and indirect, often in the form of lower loss due to unoptimized power flow reduction in prosumer buses. In this scenario, the main beneficiary is the prosumer.
In contrast, this paper investigates the benefits that can arise for the DNO if the storage system is developed independently from the prosumers. One way to achieve this goal is the use of a community storage system [7,30], in which a limited number of batteries is used across the entire network, charged during night time, at low-cost tariff, and discharged when needed. In this case, through optimal placement and sizing, the DNO can derive improved benefits in terms of loss reduction. The paper proposes a new hybrid approach that capitalizes on the advantages of both sides. Considering a fixed number of one-phase storage batteries managed by the DNO, with a nominal storage capacity compatible with equipment used generally by individual prosumers, the ESMRG algorithm needs to find the optimal placement of storage to buses and connection phase (a, b, or c), with the goal of minimizing the active energy losses. The storage can be installed at a single bus or at independent buses for each battery. The first case can be considered as a low-investment case, since all the batteries are grouped, and the second is the high-optimality case, with the best potential of reducing the energy losses. In both cases, it is considered that the initial investment and the management for the batteries is governed by the DNO, which will choose the bus(es) and connection phase for each battery. The efficiency of the two approaches was compared with the case when the storage management is performed by the prosumers, and the connection phase of the battery is limited by the prosumer connection phase and bus.
The optimization problem can be formulated mathematically as find the bus and phase connection for each storage system, s = 1, …, NSS:
[ { b 1 , p h 1 } , { b 2 , p h 2 } , .... , { b N S S , p h N S S } ]
Therefore, the following objective function will be minimized:
min ( F ) = min ( Δ W t o t ) = h = 1 H b = 1 N B Δ P h b Δ t h
where ΔWtot represents the total energy losses, and ΔPhb are the hourly active power losses for each branch b = 1, …, NB, computed as:
b = 1 N B Δ P h b = b = 1 N B [ R b ( I h b ) 2 + K h b ]
where Rb is the branch resistance; Ihb is the branch current flow on branch b at hour h; and Khb is the loss increase factor accounting for the supplementary current flow on the neutral wire due to the phase load unbalance on branch b at hour h [45].
The formulations in Equations (1)–(3) are subjected to a set of technical restrictions:
  • The voltage magnitude Uhn must not exceed the allowable upper and lower limits in each bus n = 1, …, NN and in each hour h in the interval of analysis h = 1, …, H:
    U min n U h n U max n
  • The current flow Ihb must be lower than the allowable ampacity (Imax) on all branches from the EDN, b = 1, …, NB and in each hour h in the interval of analysis h = 1, …, H:
    I h b I max b
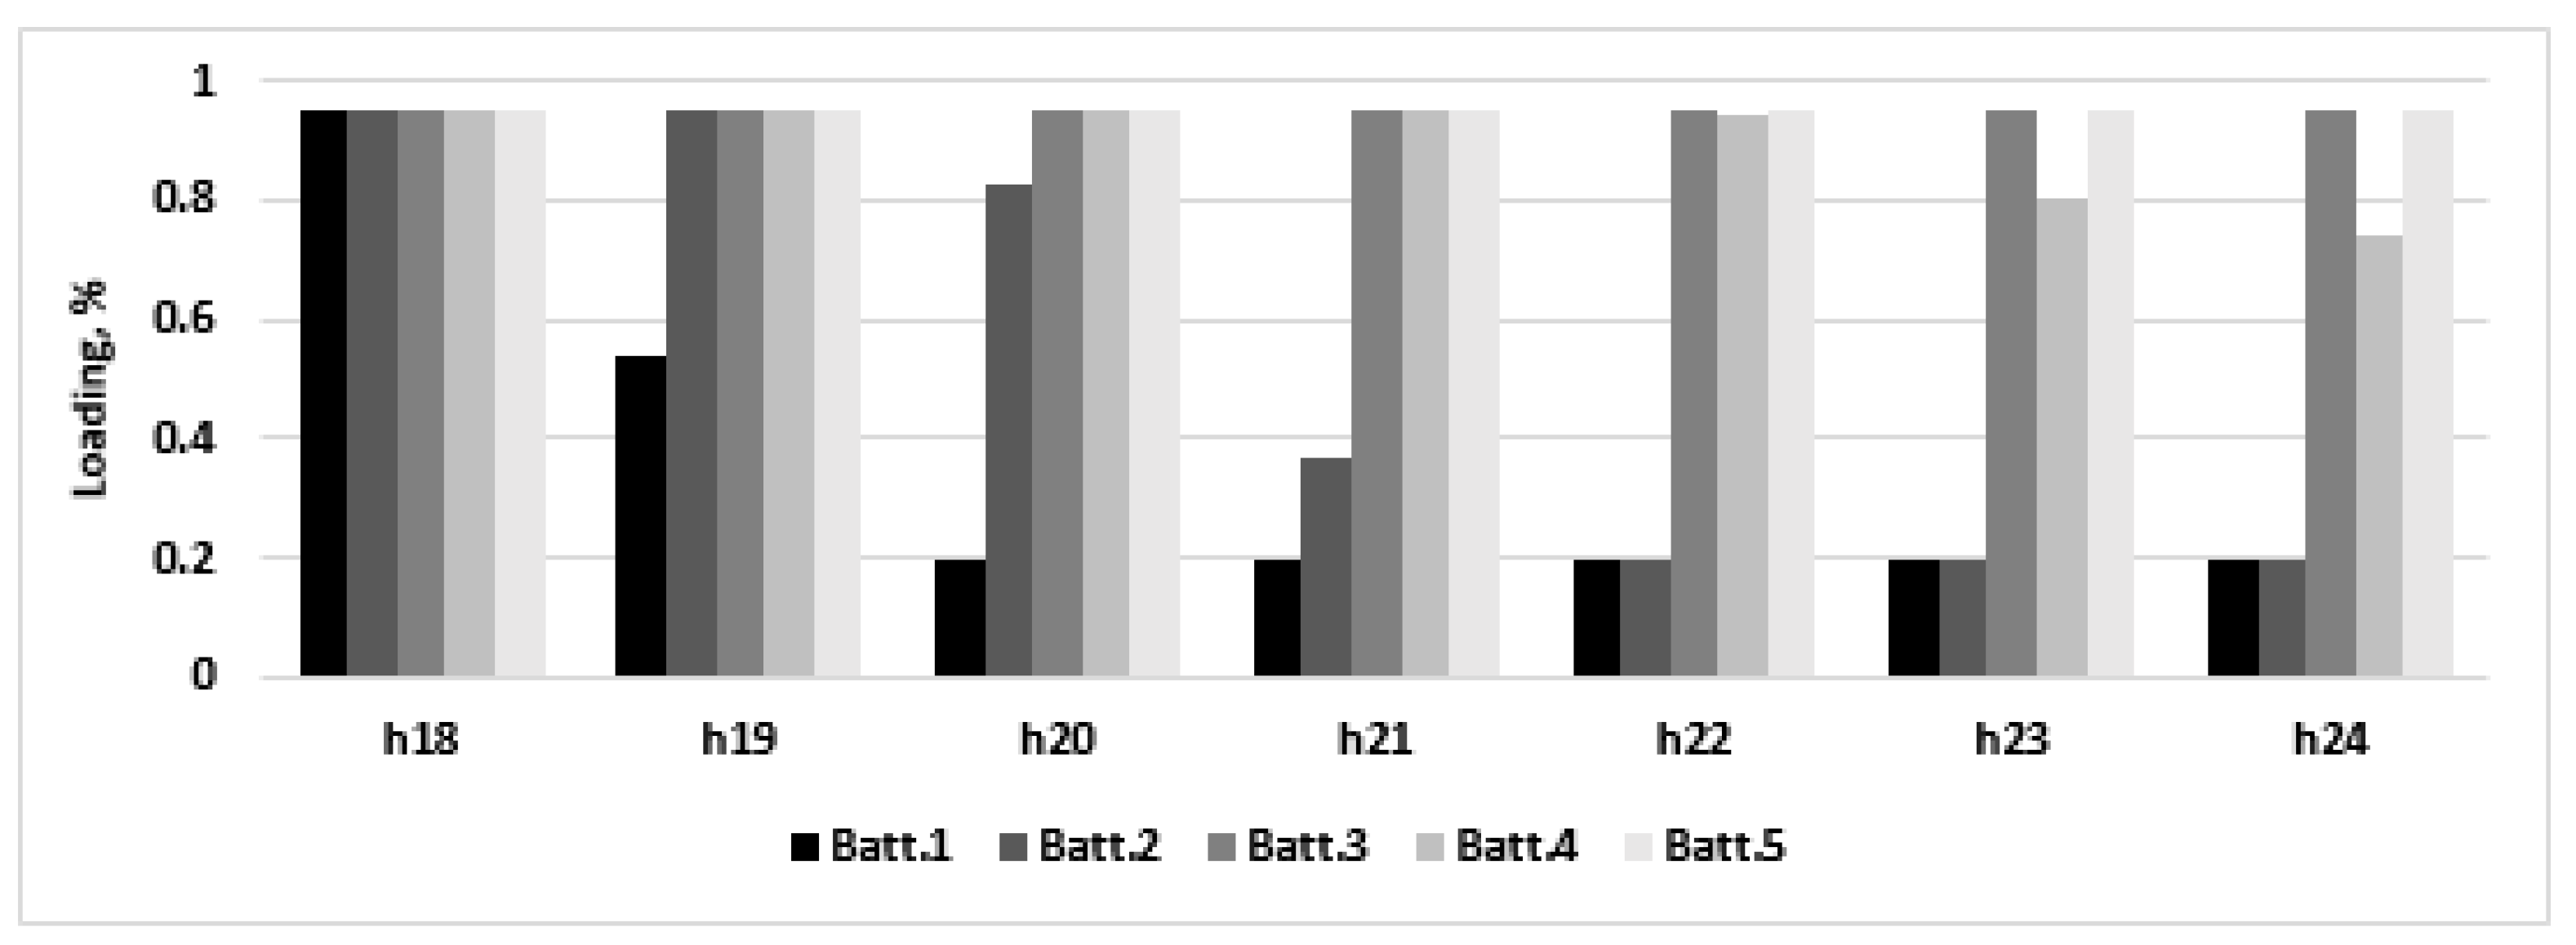
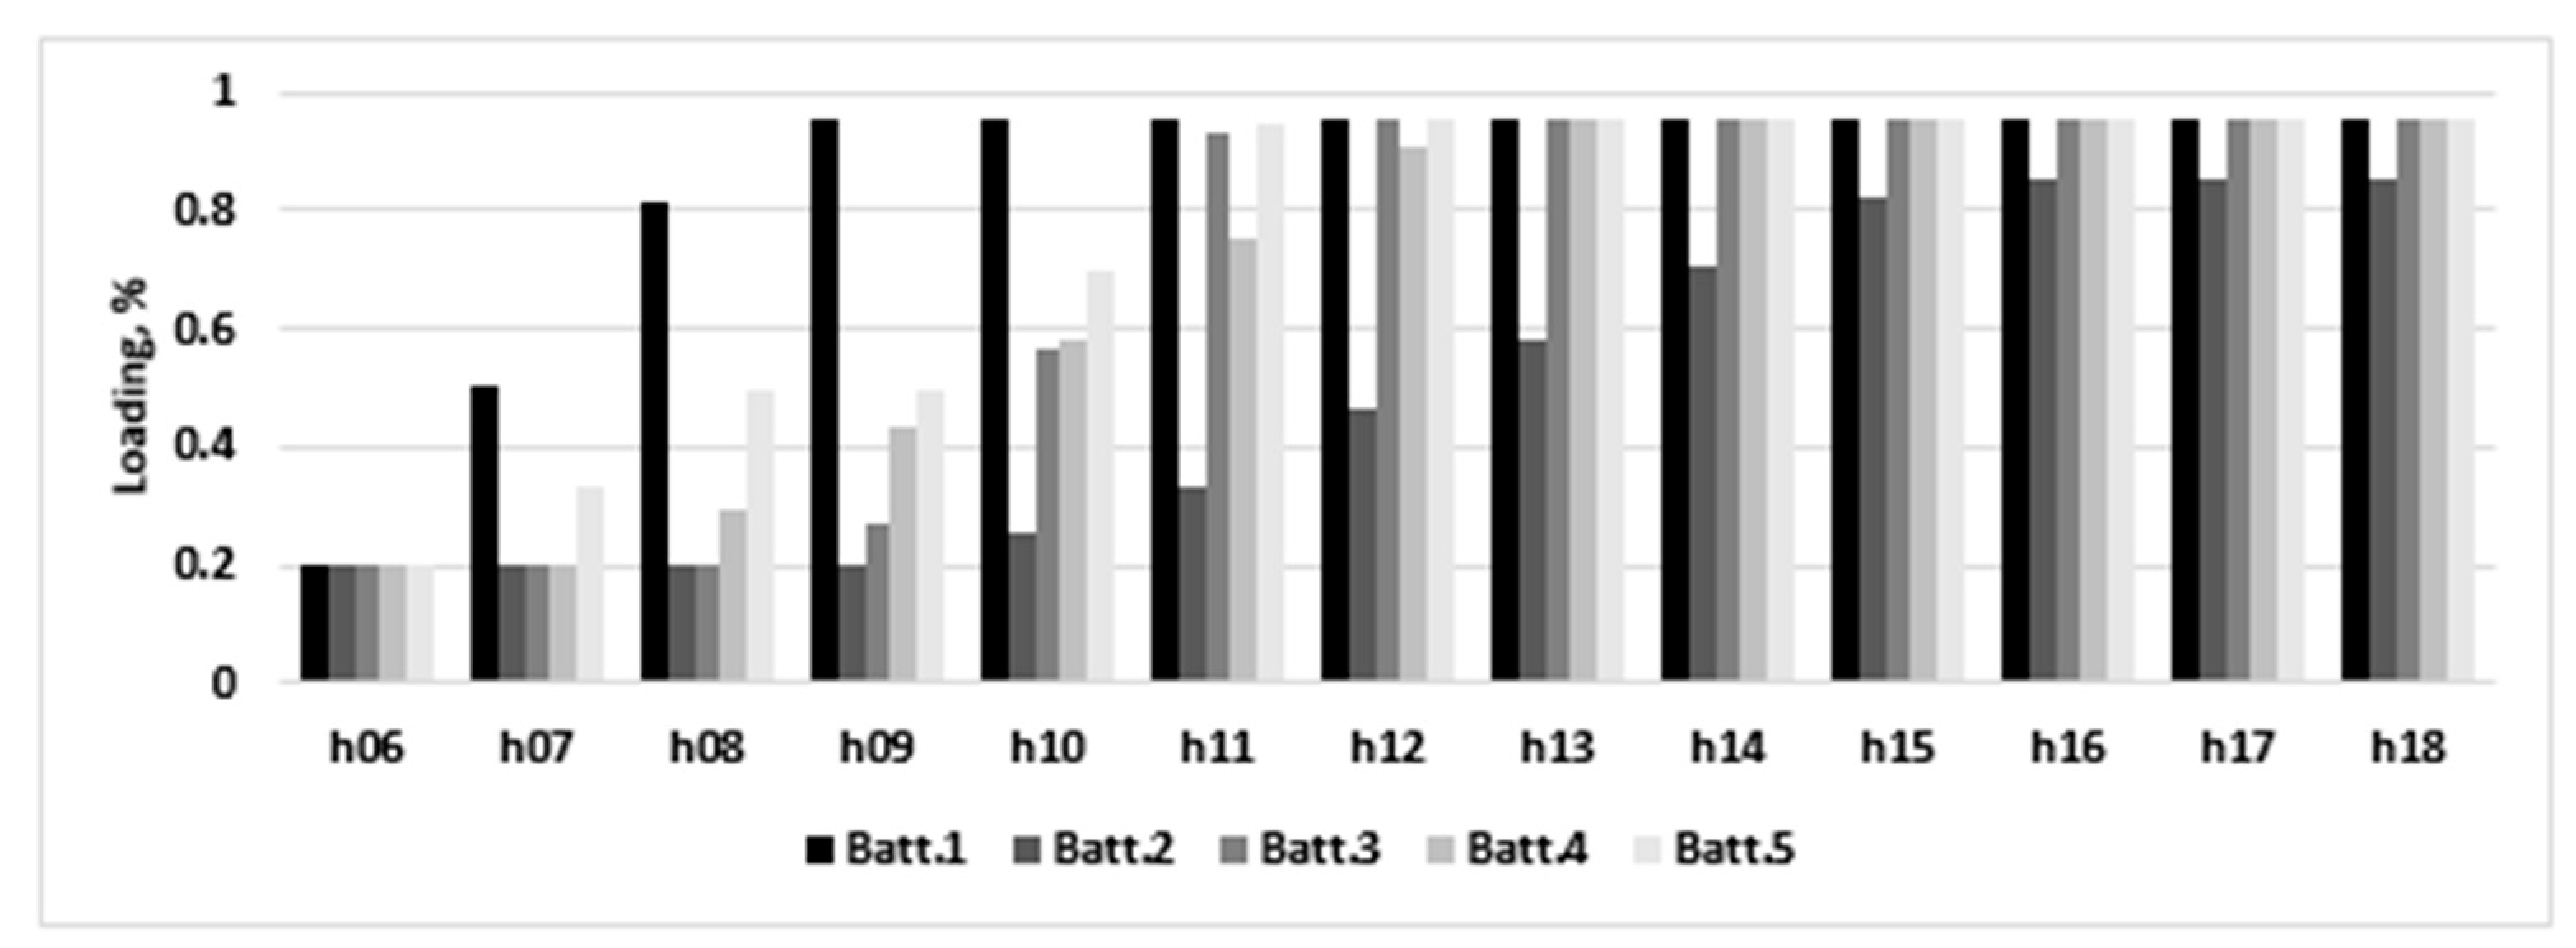
  • The state of charge (SOC) limits for the storage batteries should not exceed the technical limits for all the batteries s = 1, …, NSS, in each hour h in the interval of analysis h = 1, …, H:
    S O C min S O C h s S O C max

3.3. The Adaptation of the Genetic Algorithm for the Storage Management Problem

As stated in Section 3.2, the goal of the ESMRG algorithm is to find the optimal bus and phase of connection for a given number of storage devices with the aim of minimizing the active energy losses. For that purpose, the structure of the chromosome was chosen in such a way as to encode in a straightforward manner the principle illustrated by Expression (1). Thus, the individuals used by the GA use the structure from Figure 2. The chromosome is divided in two parts of equal length. The first part encodes the buses, while the analogue elements from the second part specify the phases of connection for each battery installed in the EDN. The chromosome from Figure 2 can be decrypted as follows: there are NSS batteries in the network; a battery will be placed in bus 14, in phase a; and another in bus 38, in phase c.
This structure can be adapted to describe all three scenarios compared in the study. The following assumptions and constraints must be considered:
  • For DNO priority:
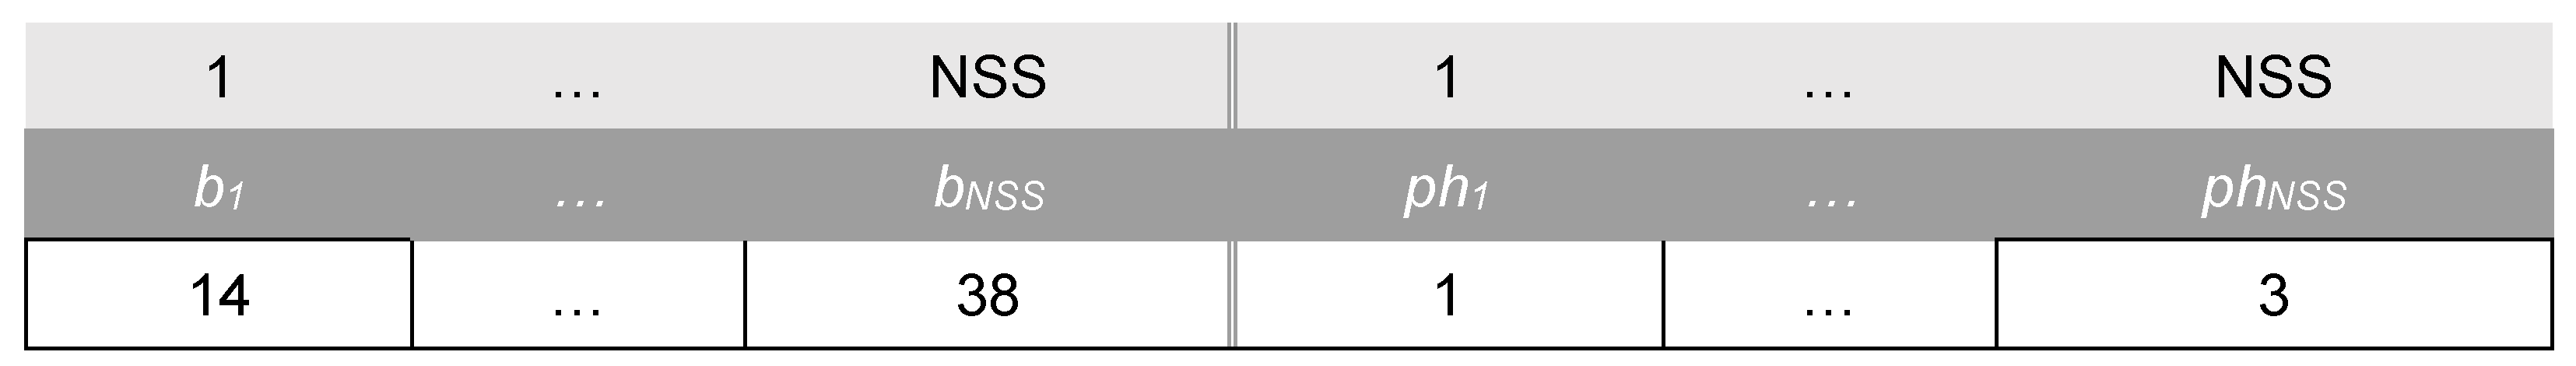
    Scenario 1 (all the batteries should be installed at the same bus): All the values from b1 to bNSS must be positive integers and equal, in the range (1, NN) (the total number of buses in the EDN); the values from ph1 to phNSS can have the value 1, 2, or 3, denoting the phases a, b, or c:
    S C 1 : { b i , b [ 1 , N N ] , b 1 = = b N S S p h i , p h i [ 1 , 3 ]
    Scenario 2 (the batteries can be installed at different buses and phases): All the values from b1 to bNSS must be positive integers, in the range (1, NN); the values from ph1 to phNSS can have the value 1, 2, or 3, denoting the phases a, b, or c.
    S C 2 : { b i , b [ 1 , N N ] p h i , p h i [ 1 , 3 ]
  • For prosumer priority:
    Scenario 3: (batteries installed at prosumer residences): All the values from b1 to bNSS must be positive integers, denoting prosumer codes (because more than one prosumer can be located at a given bus), for prosumers that have surplus, a small subset of the entire bus range; the values from ph1 to phNSS can be 1, 2 or 3, depending on the phase of connection used by the prosumer PS chosen for storage installation.
    S C 3 : { b i , b [ P S 1 , , P S N P S ] , p h i , p h i [ 1 , 3 ] , p h i t a k e n f r o m P S ( b i )
This approach shows the flexibility of the GA chromosome structure, which allows for the simultaneous encoding of three problems with distinctive limitations inside the same algorithm.
The computation of the energy losses, which is the objective function of the problem, is part of the fitness function calculation for the GA. The standard tool used for this purpose is a classical load flow calculation, which would be the same regardless of the algorithm, classic or metaheuristic, used to find the optimal solution. The load flow method used in the paper is described by Equations (1)–(6). The GA is simply a mechanism of generating possible solutions encoded as vectors, employing a specific methodology. In this regard, any metaheuristic could be used in the same manner. However, the GA was chosen by the authors over other metaheuristics because, as Equations (7)–(9) show, all the elements from a solution are integer numbers, bounded in specified intervals. This is the ideal case for the crossover and mutation procedures used by the GA. At the same time, the integer encoding would create validation problems for other methods such as the well-known particle swarm optimization, fireworks algorithm, honey bees mating algorithm, etc. that use multiplication with random sub-unit numbers to change the values of individual elements from a solution. The GA eliminates the need to perform additional computation steps.
The literature offers multiple variants for the genetic operators (selection, crossover, mutation). Based on preliminary testing, the tournament selection method was used for GA selection, and the uniform crossover was preferred for the reproduction step. To observe the limitations (7)–(9), the crossover operator has been modified. The uniform crossover was applied on the second half of the chromosome, where the phases are encoded. Then, based on the result and scenario, one of the following procedures was used:
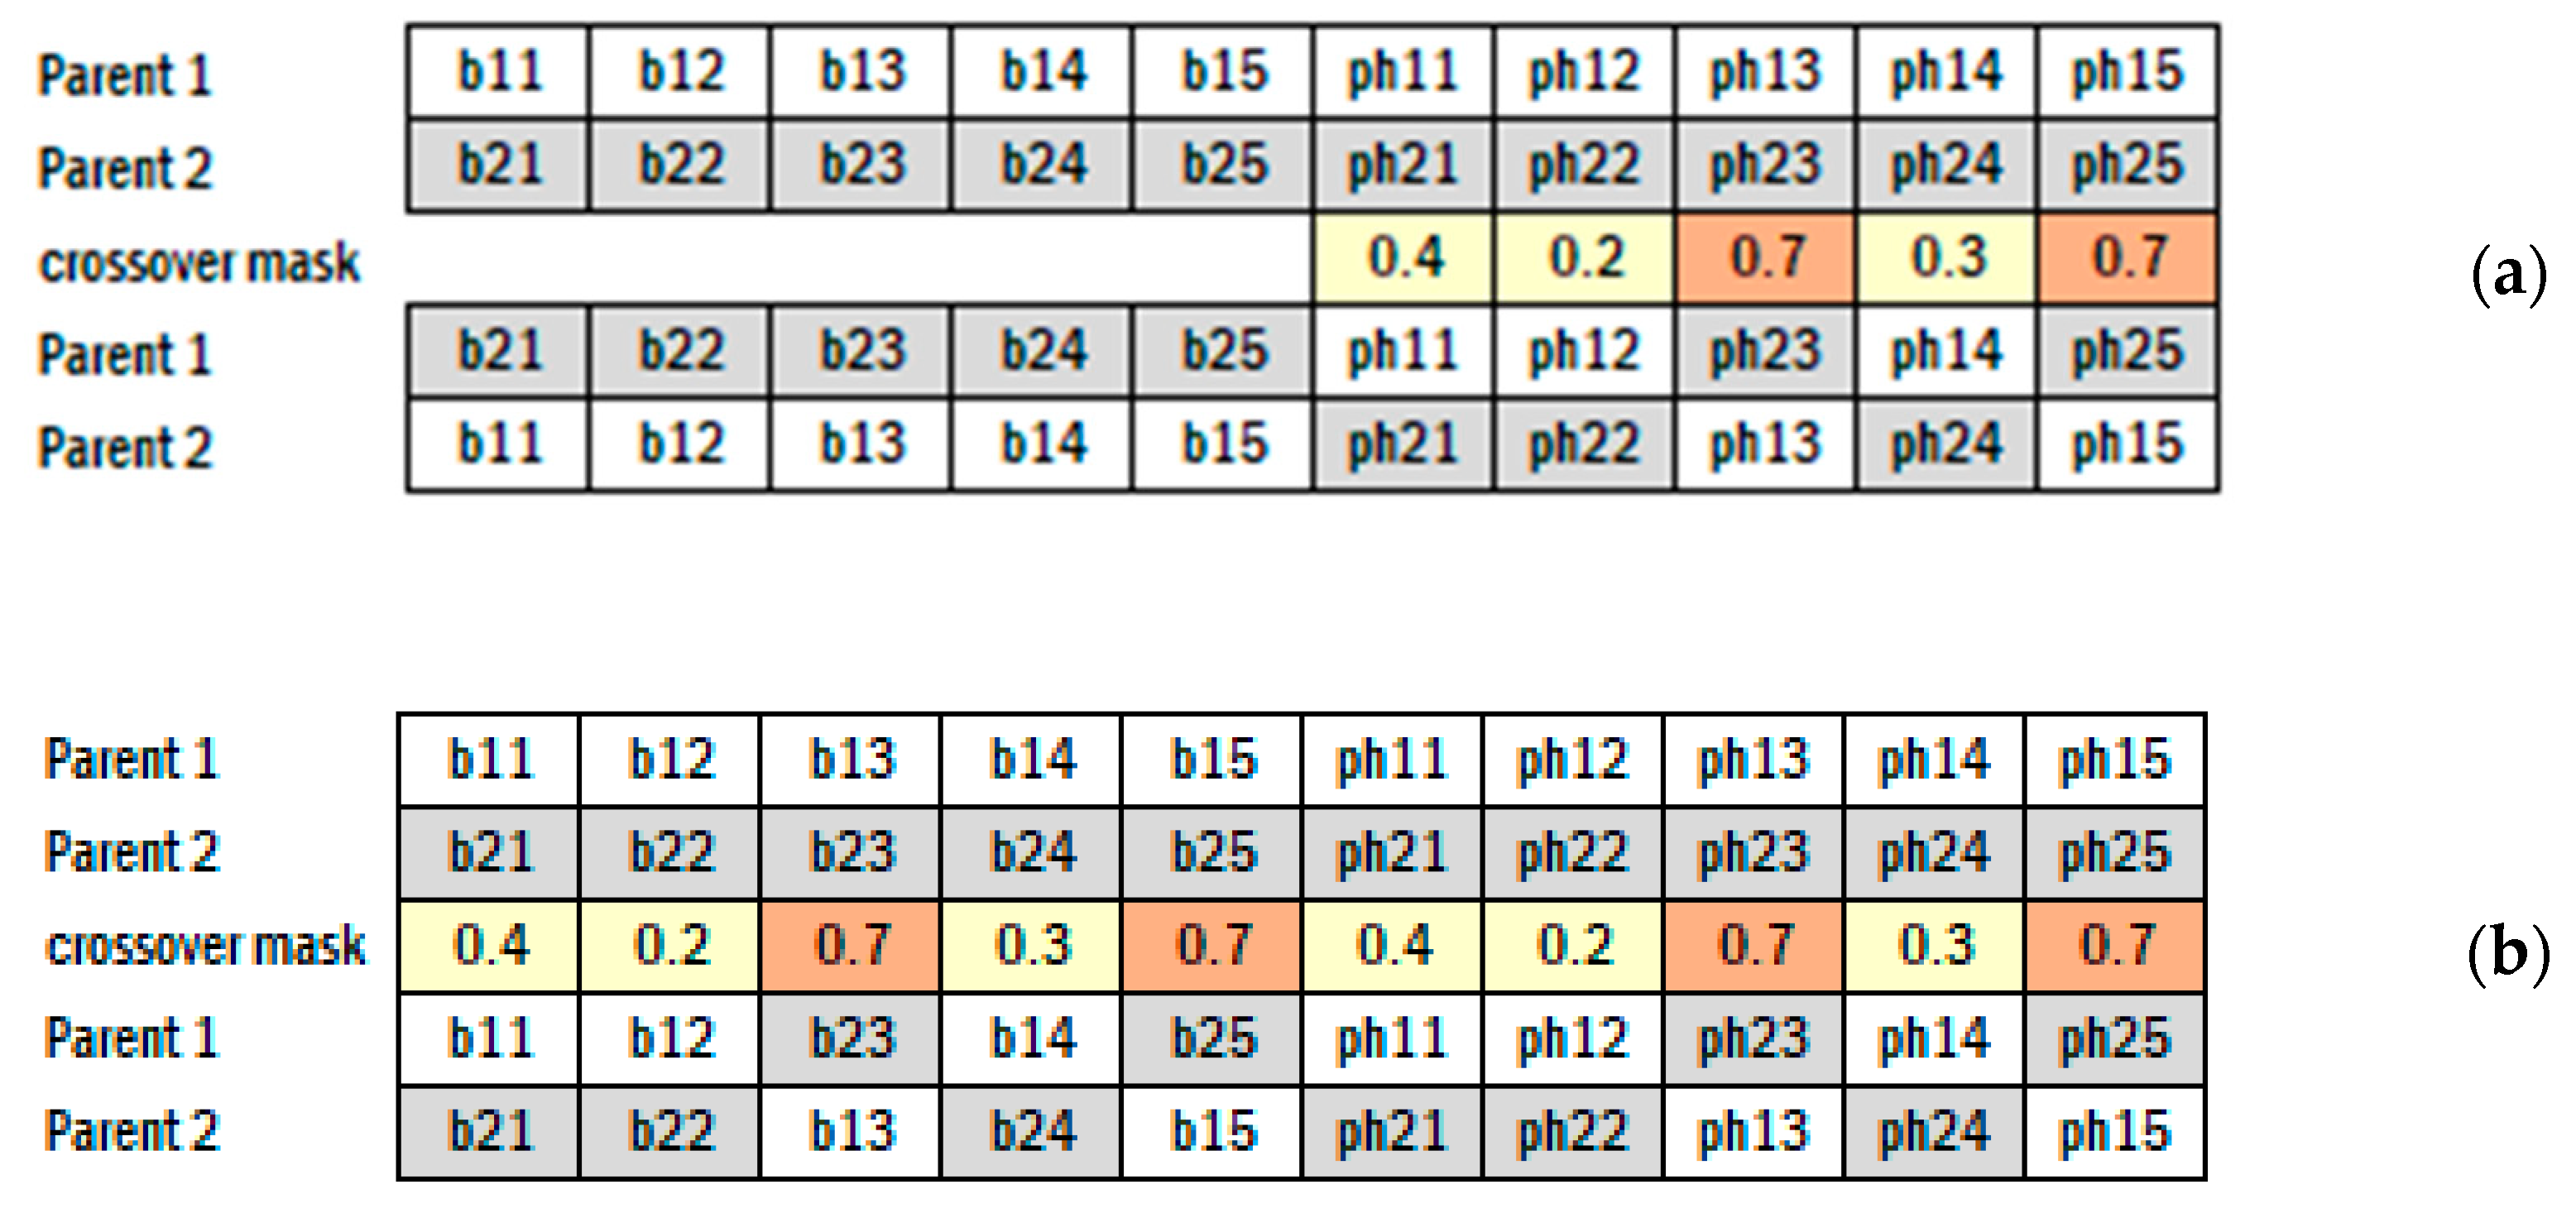
  • For Scenario 1: the connection buses for the offspring chromosomes, which must be the same for all the batteries, were chosen with random probability from the buses used by the parent chromosomes (as in Figure 3a); and
  • For Scenarios 2 and 3, the crossover for buses was applied using the same random mask as for the phases (as in Figure 3b).
The mutation was performed by randomly selecting and altering a gene on the entire length on the chromosome, but particularized for each scenario:
  • For Scenario 1: a phase gene can be mutated to any value 1, 2, or 3; but if a bus gene is selected from the mutation, then the entire first half of the chromosome is also mutated;
  • For Scenario 2: any phase gene can be randomly mutated to any value 1, 2, or 3, and any bus gene can be mutated to any value describing a valid bus number; and
  • For Scenario 3: the mutation is first performed on the buses by randomly replacing a prosumer with another from the available pool; then, its corresponding phase is replaced accordingly in the second half of the chromosome.
These assumptions ensure that for each scenario, its constraints are always fulfilled and that the chromosomes resulting from crossover and mutations are always valid, reducing the computational effort and the number of solutions evaluated by the algorithm, thus increasing the speed of convergence toward the optimal solution. Using a more randomized scheme for updating the chromosome would require complex validation procedures, built separately for each scenario. In contrast, the GA eliminates the need for this step.

4. Results

The ESMRG algorithm was tested on a real LV EDN from northern Romania for which consumption data were measured for an interval of 24 h using the local Smart Metering infrastructure. The general data for this network and its one-line diagram are provided in Figure 4 and Table 1.
In the network, there are eight active prosumer buses depicted in black in Figure 4 that use PV panels and generate electricity during daytime in the 06:00–18:00 h interval. The electricity not used for local consumption constitutes the surplus that can be injected back in the grid or stored in batteries for later use, if storage capabilities exist. This surplus is represented, for each prosumer, in Figure 5.
On the other hand, the charge and discharge of the batteries influence the power demand from the grid at the buses where the batteries are located. For reference, the aggregated hourly consumption in each phase is presented in Figure 6, which shows that the load is highly unbalanced, with phase b having the lowest loading. With an optimal placement, the batteries can be used to balance the load and reduce the active energy losses in the network.

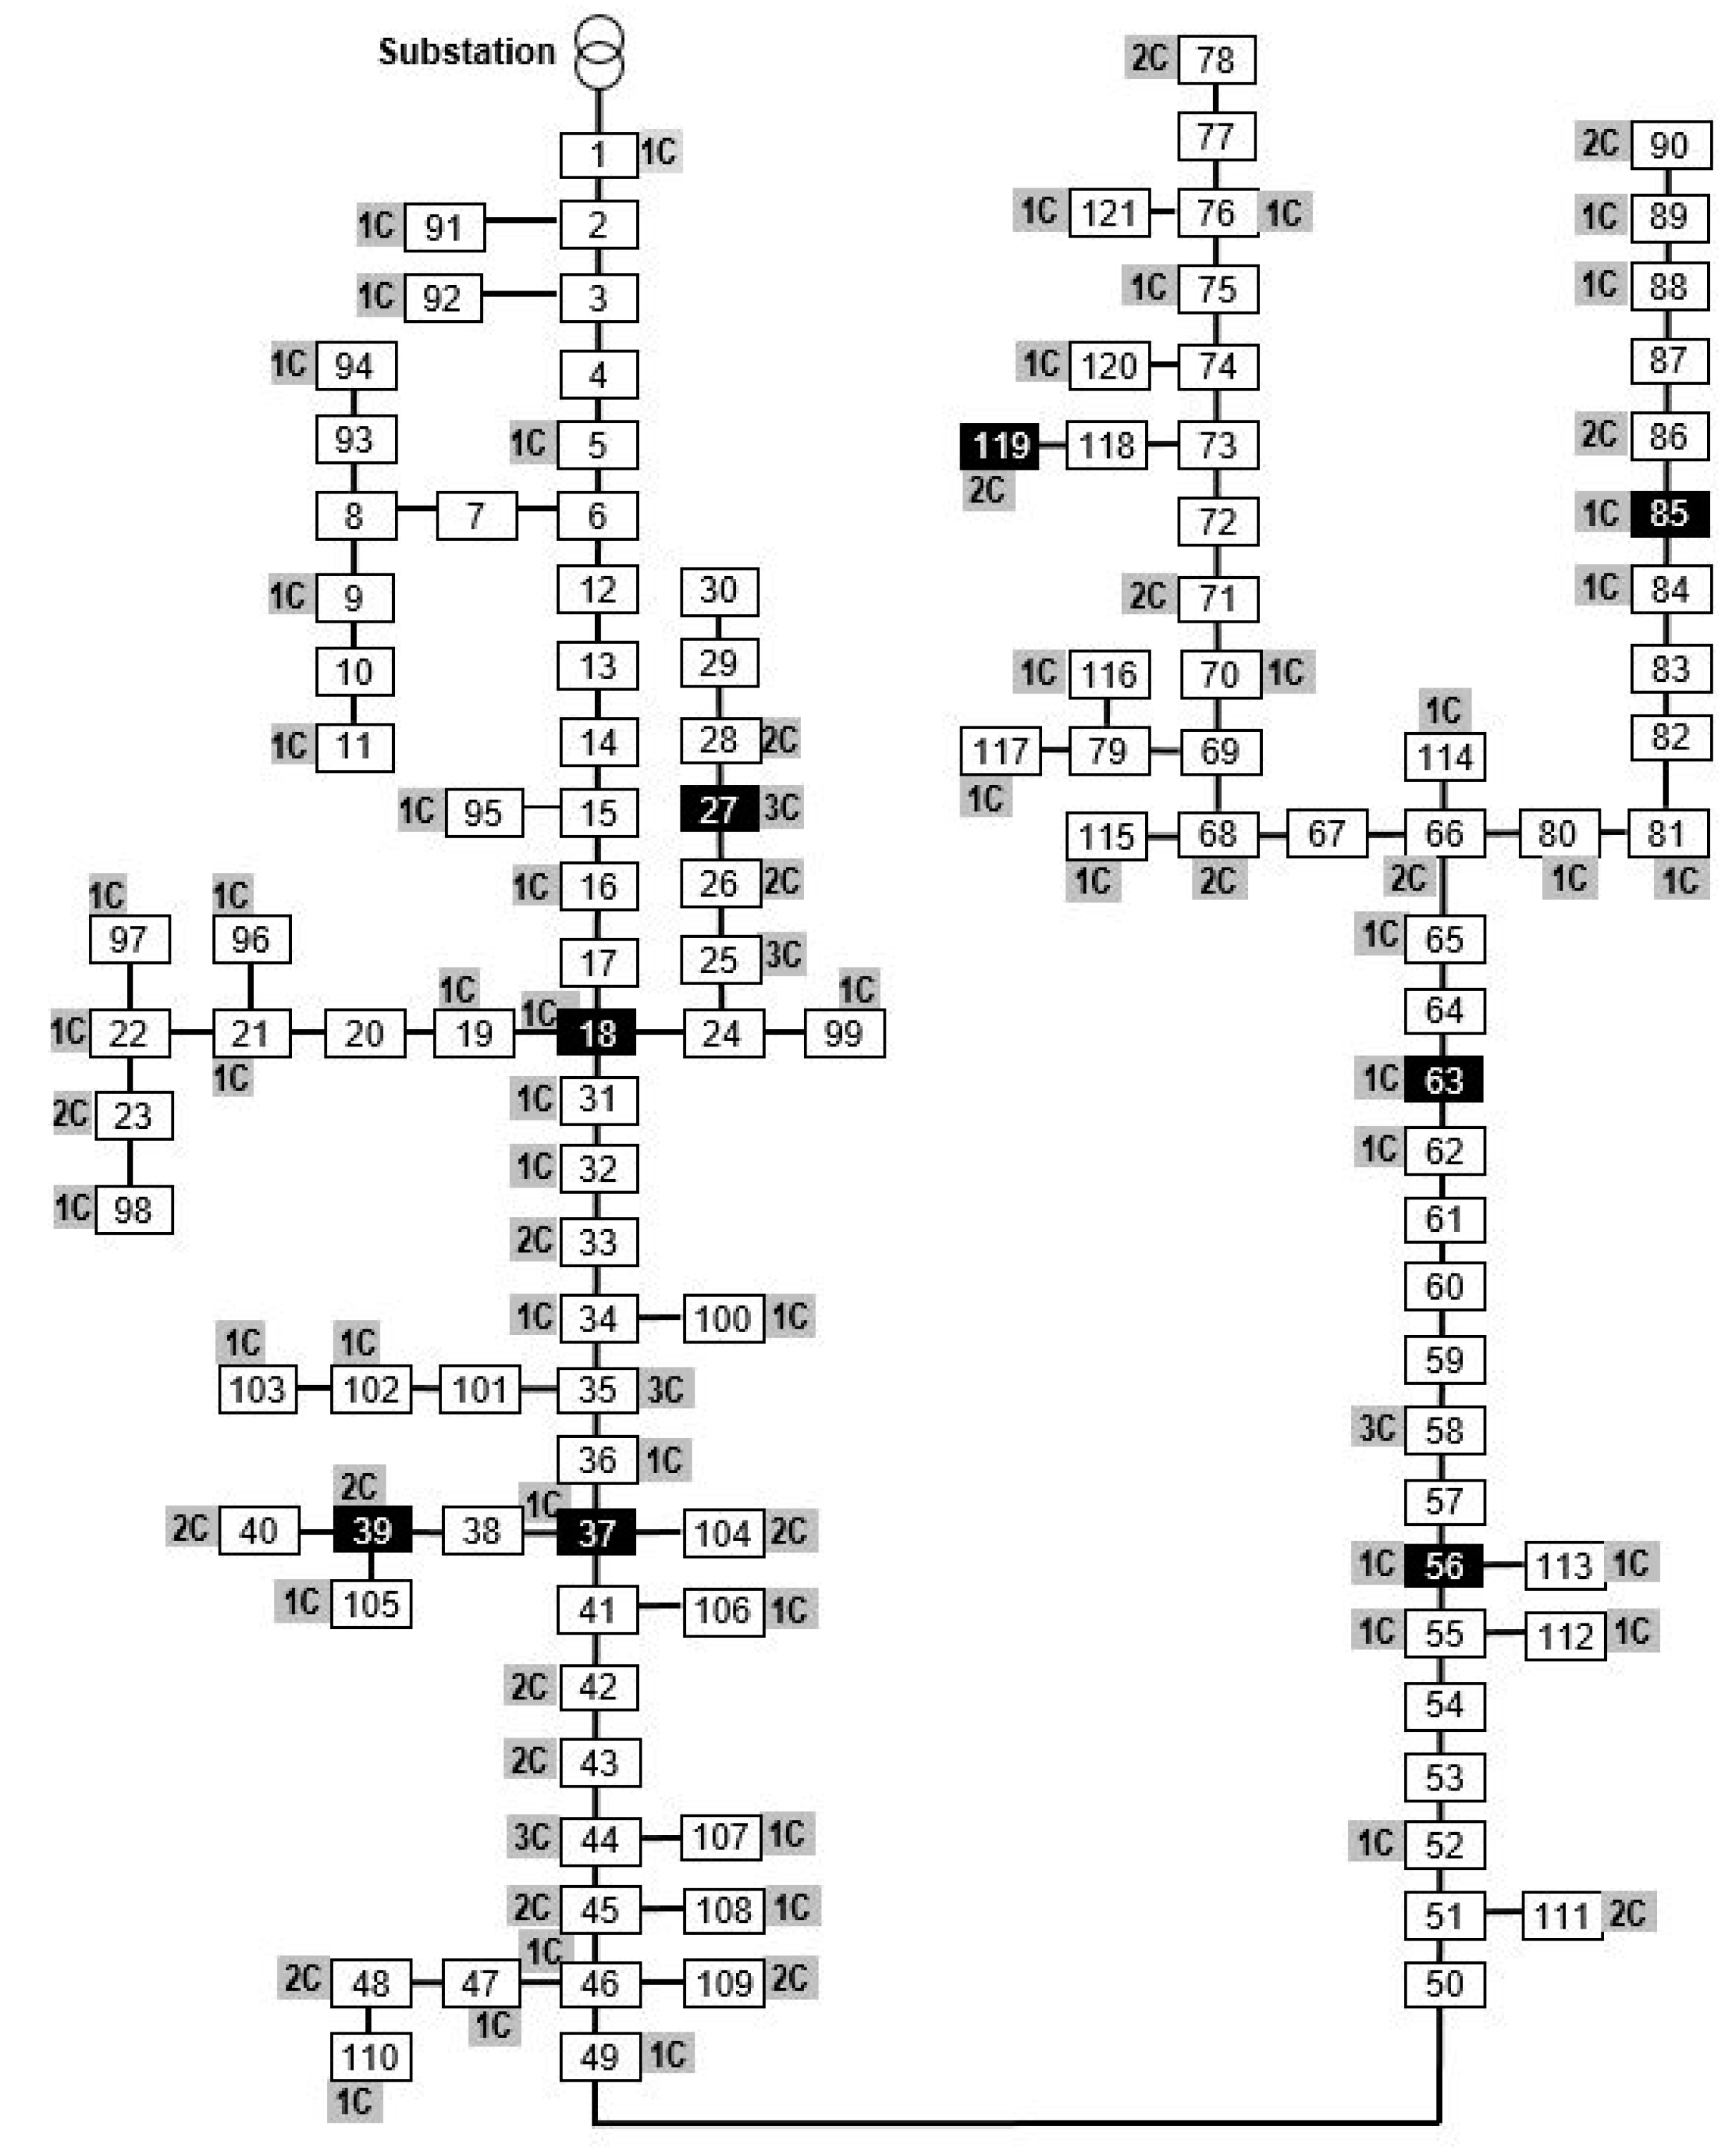
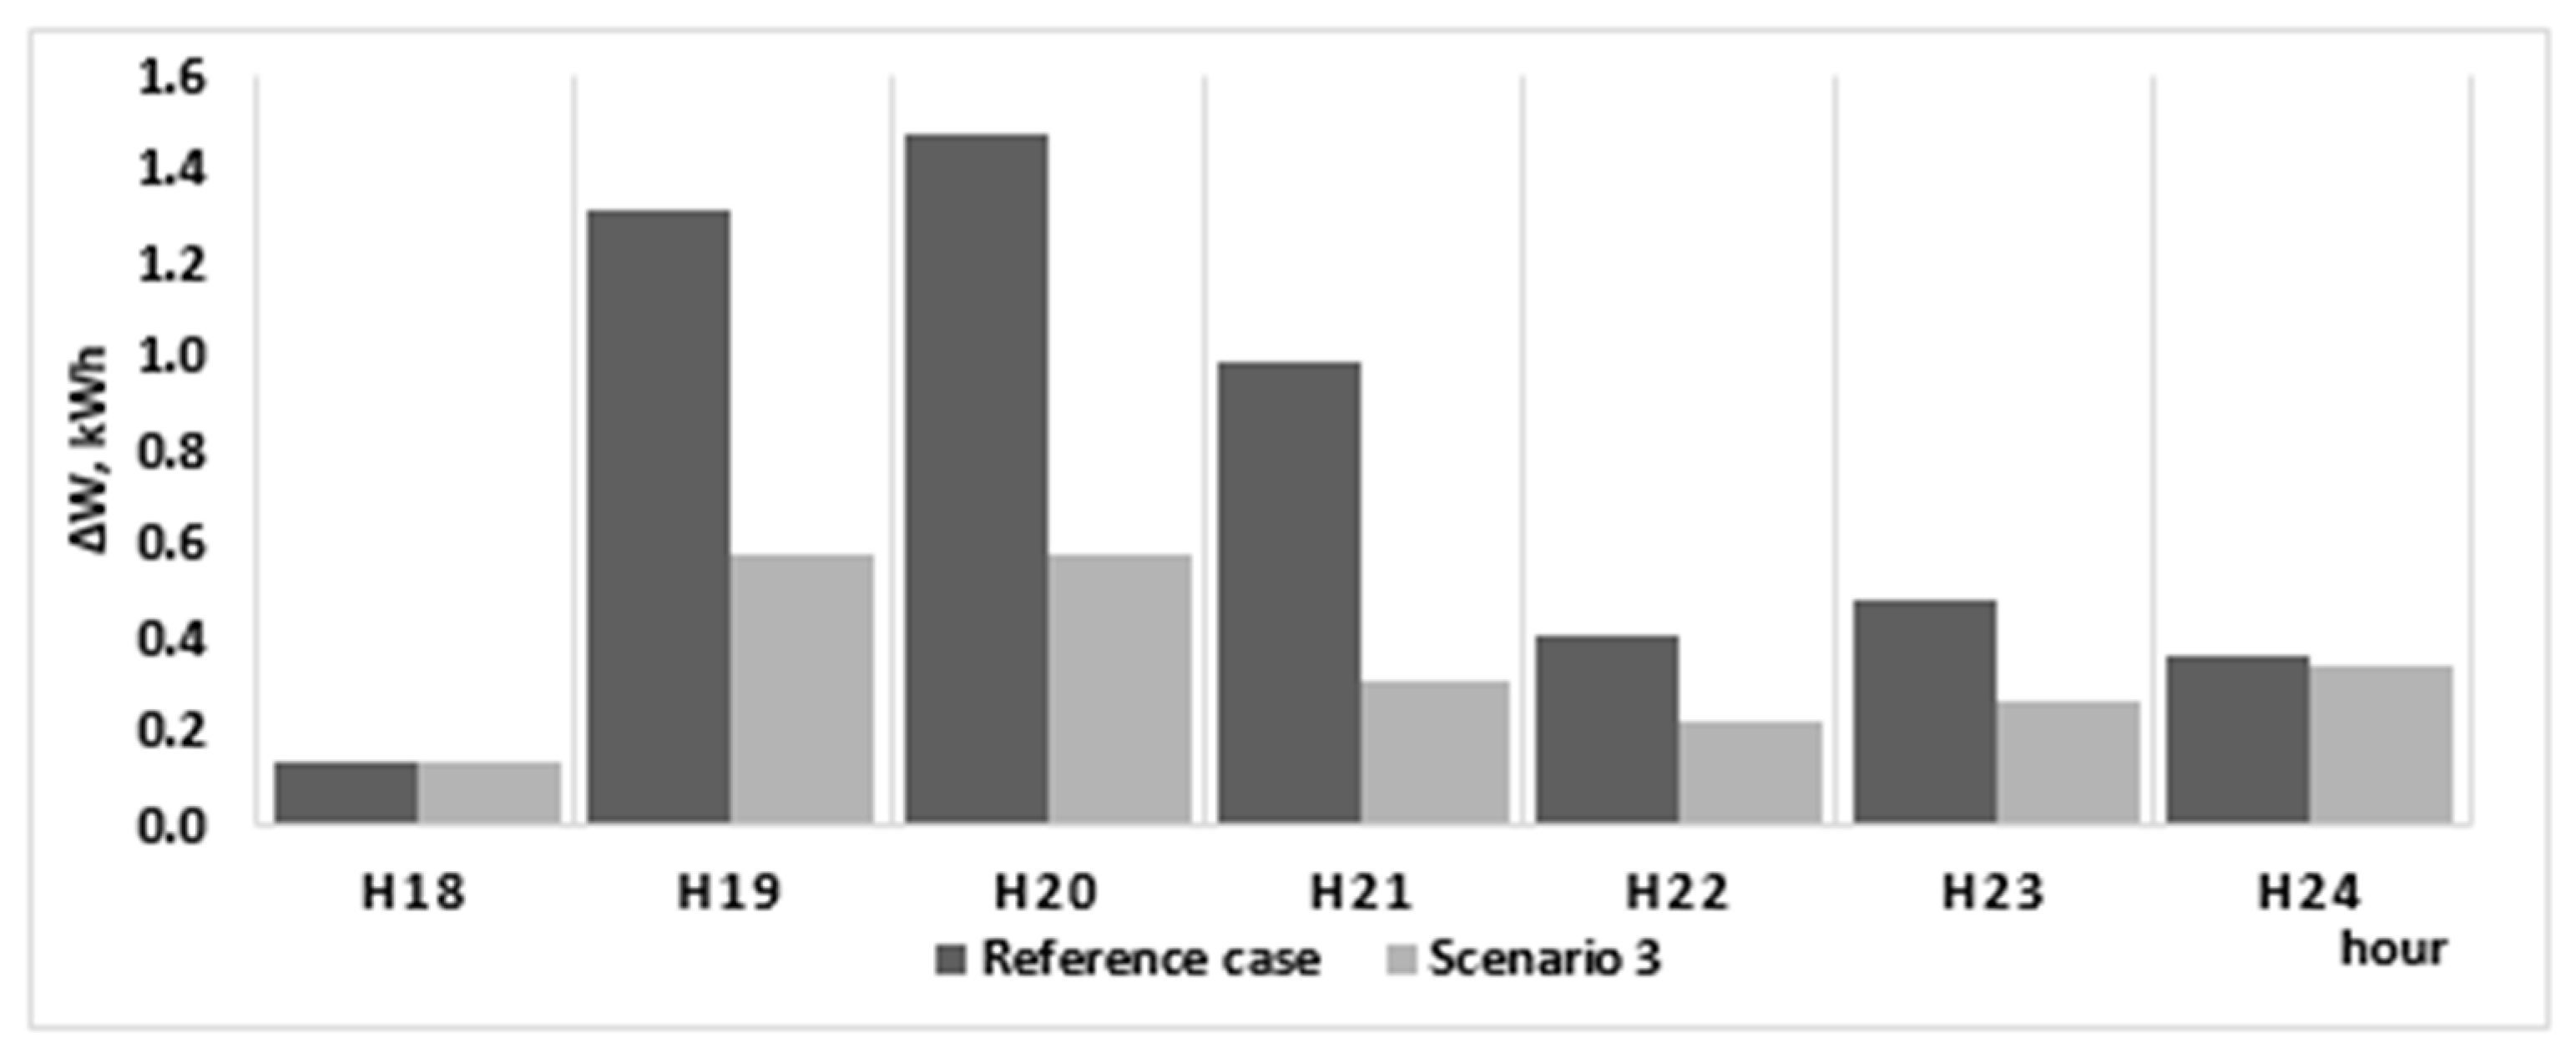
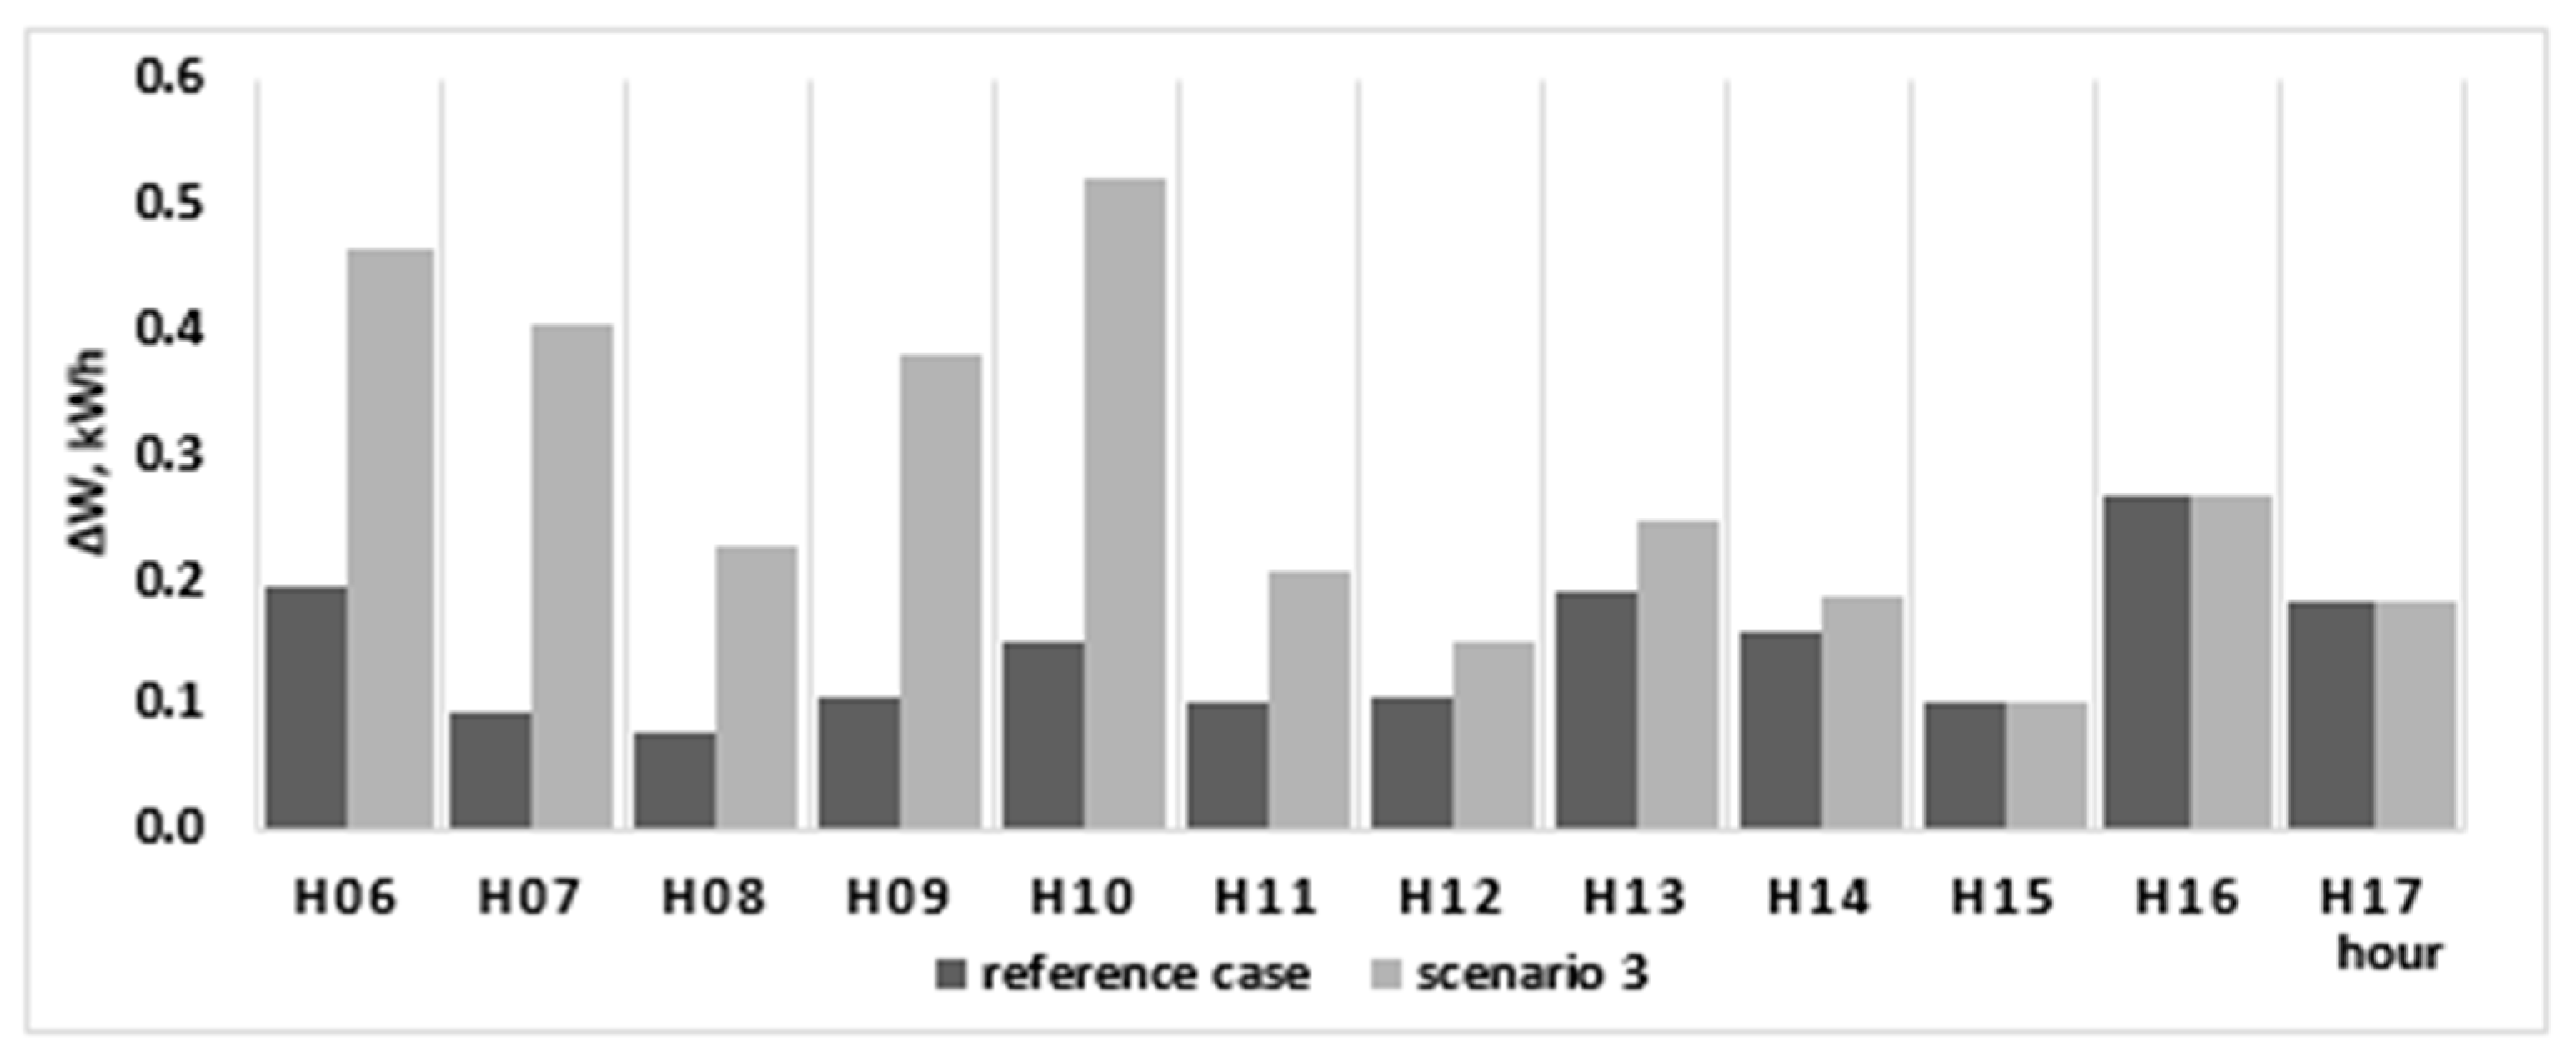
4.1. The Reference Case

The presence of storage in the network has the potential to reduce the energy losses in several ways. First, in the battery charging phase, the energy stored at the prosumers will not be injected in the network and the power flow on the branches adjacent to the respective bus will not increase. Depending on the operating scenario, the total losses in the network will also be affected (will increase or will decrease, according to the location of the prosumer buses). In the discharging phase, if this operation occurs at peak load, the total load of the network will be reduced, also reducing the energy losses. The loss reduction will depend on the placement of the batteries in the network at specific buses and connection phases. To analyze the effect of each storage placement solution, the losses obtained in each case were compared in this paper with the reference active losses value obtained when the consumption used the pattern from Figure 6 and the entire surplus from Figure 5 was injected back in the grid. In this case, the losses computed by a load flow algorithm amounted to 8.74 kWh in the interval 0:00–24:00, 6.90 kWh in the interval 06:00–24.00 and 5.04 kWh between 18:01–24:00 (Figure 7). These intervals were delimited considering as an initial assumption in the study that the prosumers begin to generate electricity at 06:00 and the batteries will begin to discharge at 18:01.
Starting from this case, the three scenarios were run and the optimal solutions were determined for each case. The algorithm used each time for 100 generations and 100 individuals in the population, with a crossover rate of 0.9 and a mutation rate of 0.1. The solutions are presented in Table 2. The first part of the chromosomes for Scenarios 1 and 2 uses bus codes, while Scenario 3 uses prosumer codes, taken from the input data provided in the Supplementary Materials. The correspondent bus numbers are given for Scenario 3 in round brackets. Furthermore, the losses are given for the entire 24 h period. For Scenarios 1 and 2, it was considered that the batteries were loaded at 95% at the beginning of the interval of analysis. For Scenario 3, the batteries start at the minimum loading limit (20%) and can be charged up to the maximum limit of 95% from the prosumer surplus. The hour at which the batteries begin to discharge is at the beginning of the peak load time from Figure 7 (18:01–19:00). Five batteries with a maximum 4 kWh storage capacity each were considered for placement.

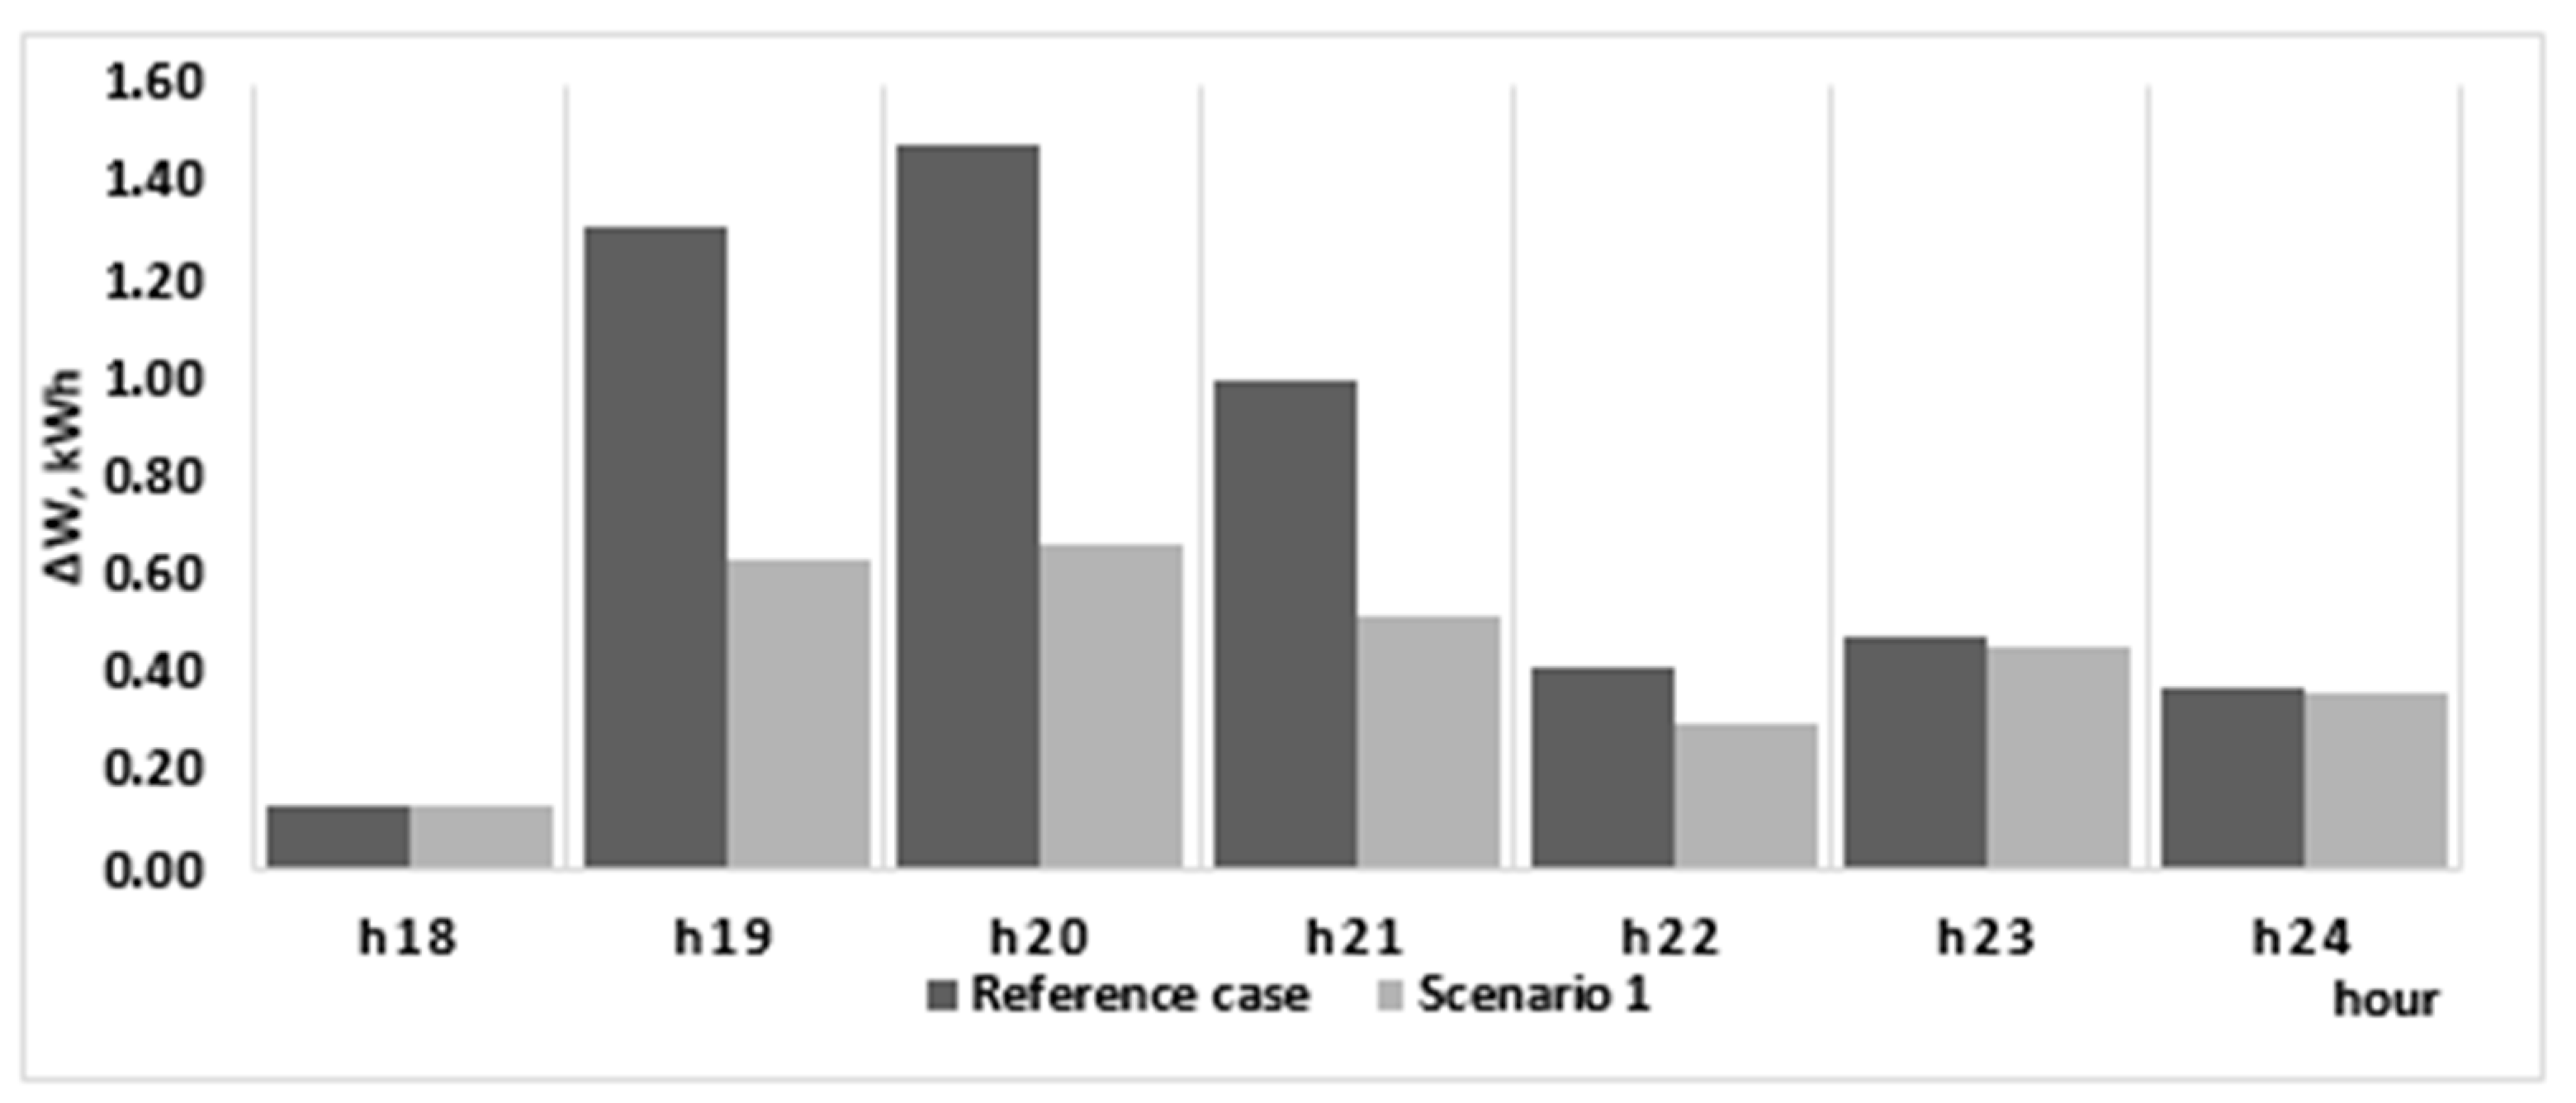
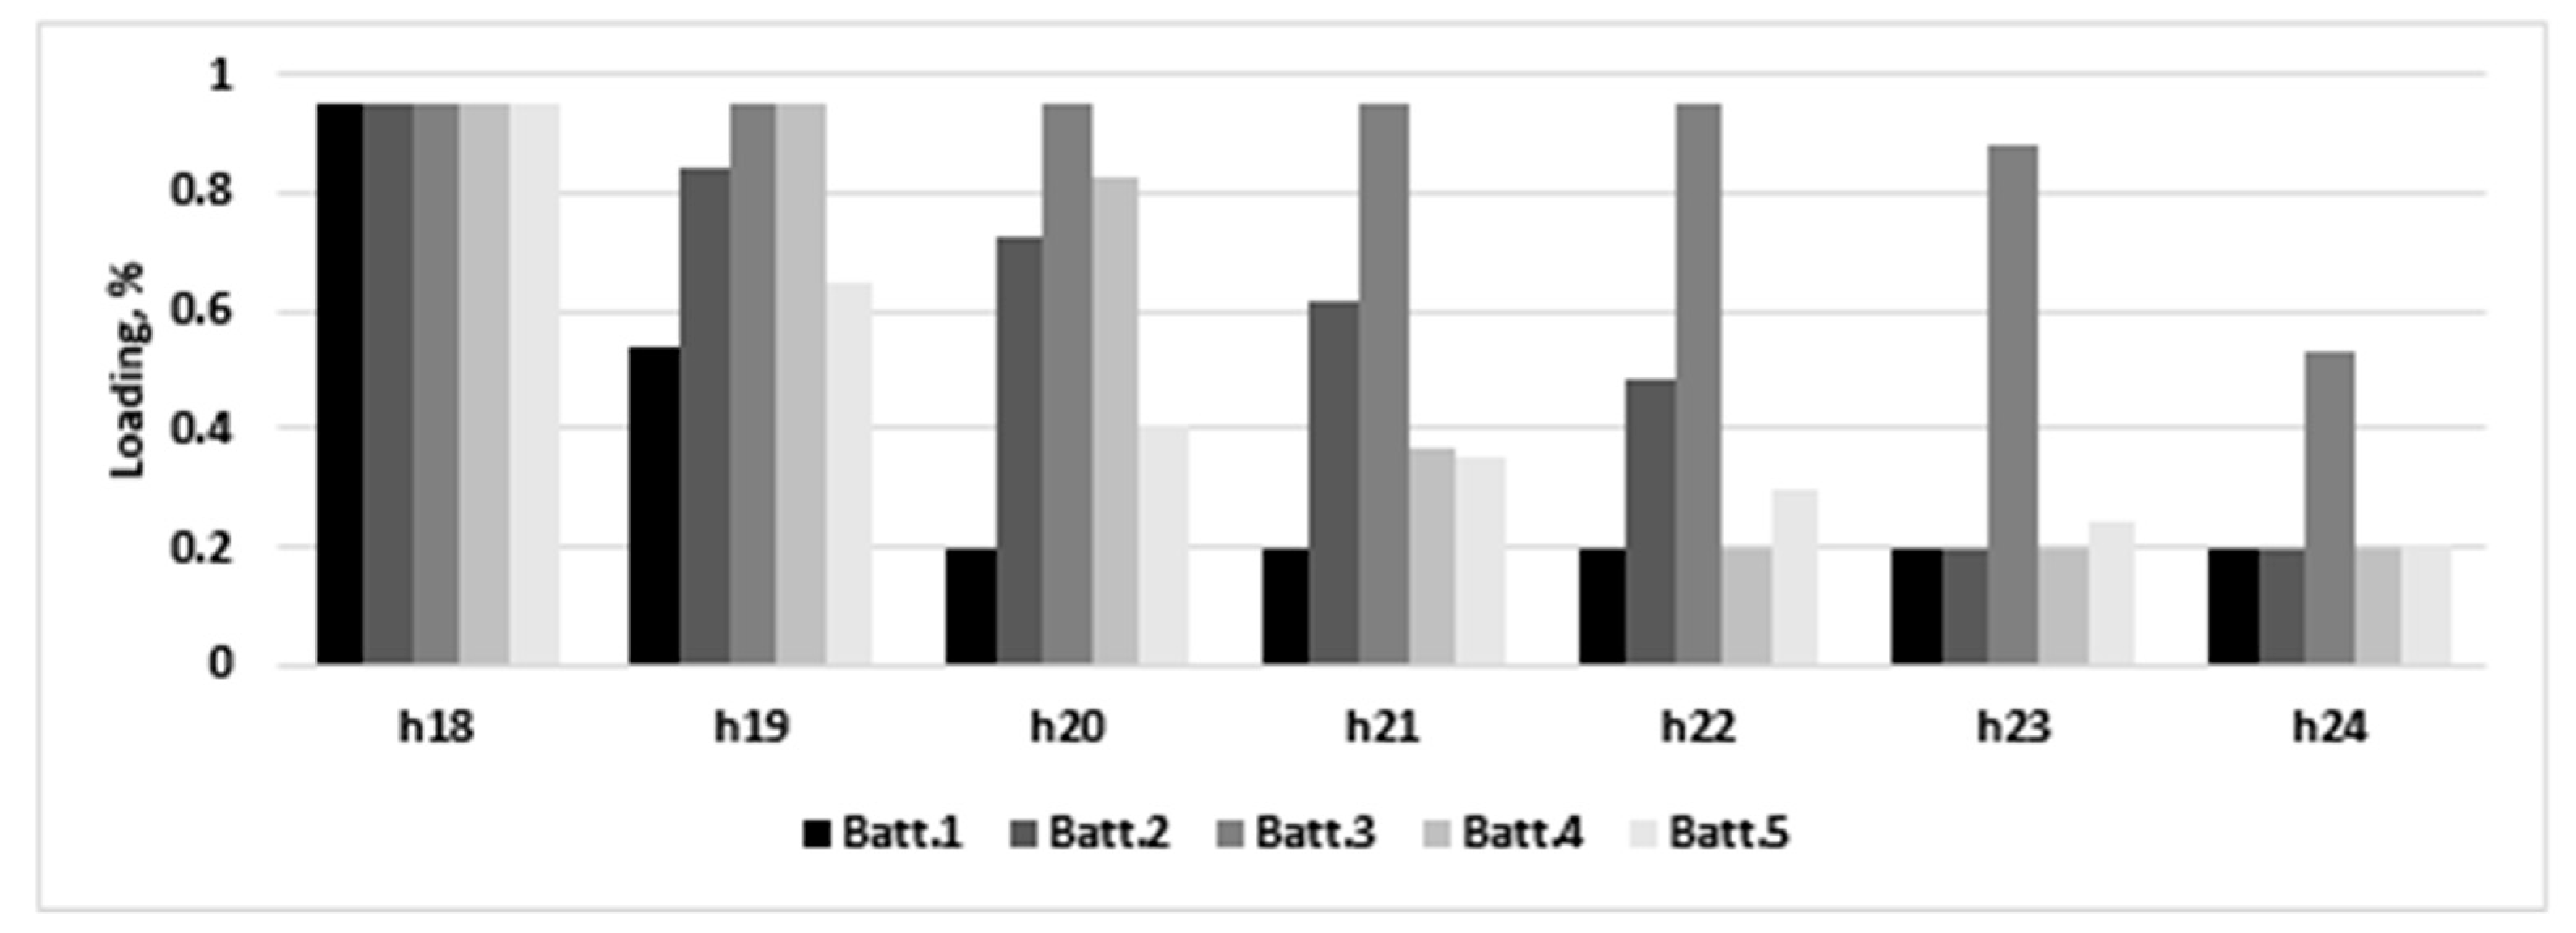
4.2. Scenario 1—Batteries Installed at the Same Bus

For this scenario, an interesting fact occurred. The algorithm chose bus 85 for installation, which is located near the far end of the network and has the highest demand in the interval of discharge 18:01–24:00 (6.81 kWh). For this case, taking into account the imposed min 20%–max 95% charging limits, a maximum of three batteries can be discharged in bus 85, which were placed by the algorithm in phase a, where the entire bus consumption is measured. Two batteries will be discharged down to the lowest limit of 20%; one will be discharged partially, while the remaining two will not be used at all, as presented in Figure 8. For reference purposes, this figure also contains the battery loading level an hour before the discharging begins.
The total hourly load from Figure 6 will change starting from 18:01 only in phase a, resulting in a more balanced operation of the network at peak load hours. Consequently, the energy losses saw an important reduction from 8.74 kWh in the reference case to 6.63 kWh. This reduction of 2.11 kW was concentrated in the (18:01–24:00) interval, as depicted in Figure 9 and was the highest in the peak interval 18.01–20.00 (h19 and h20 from Figure 8).

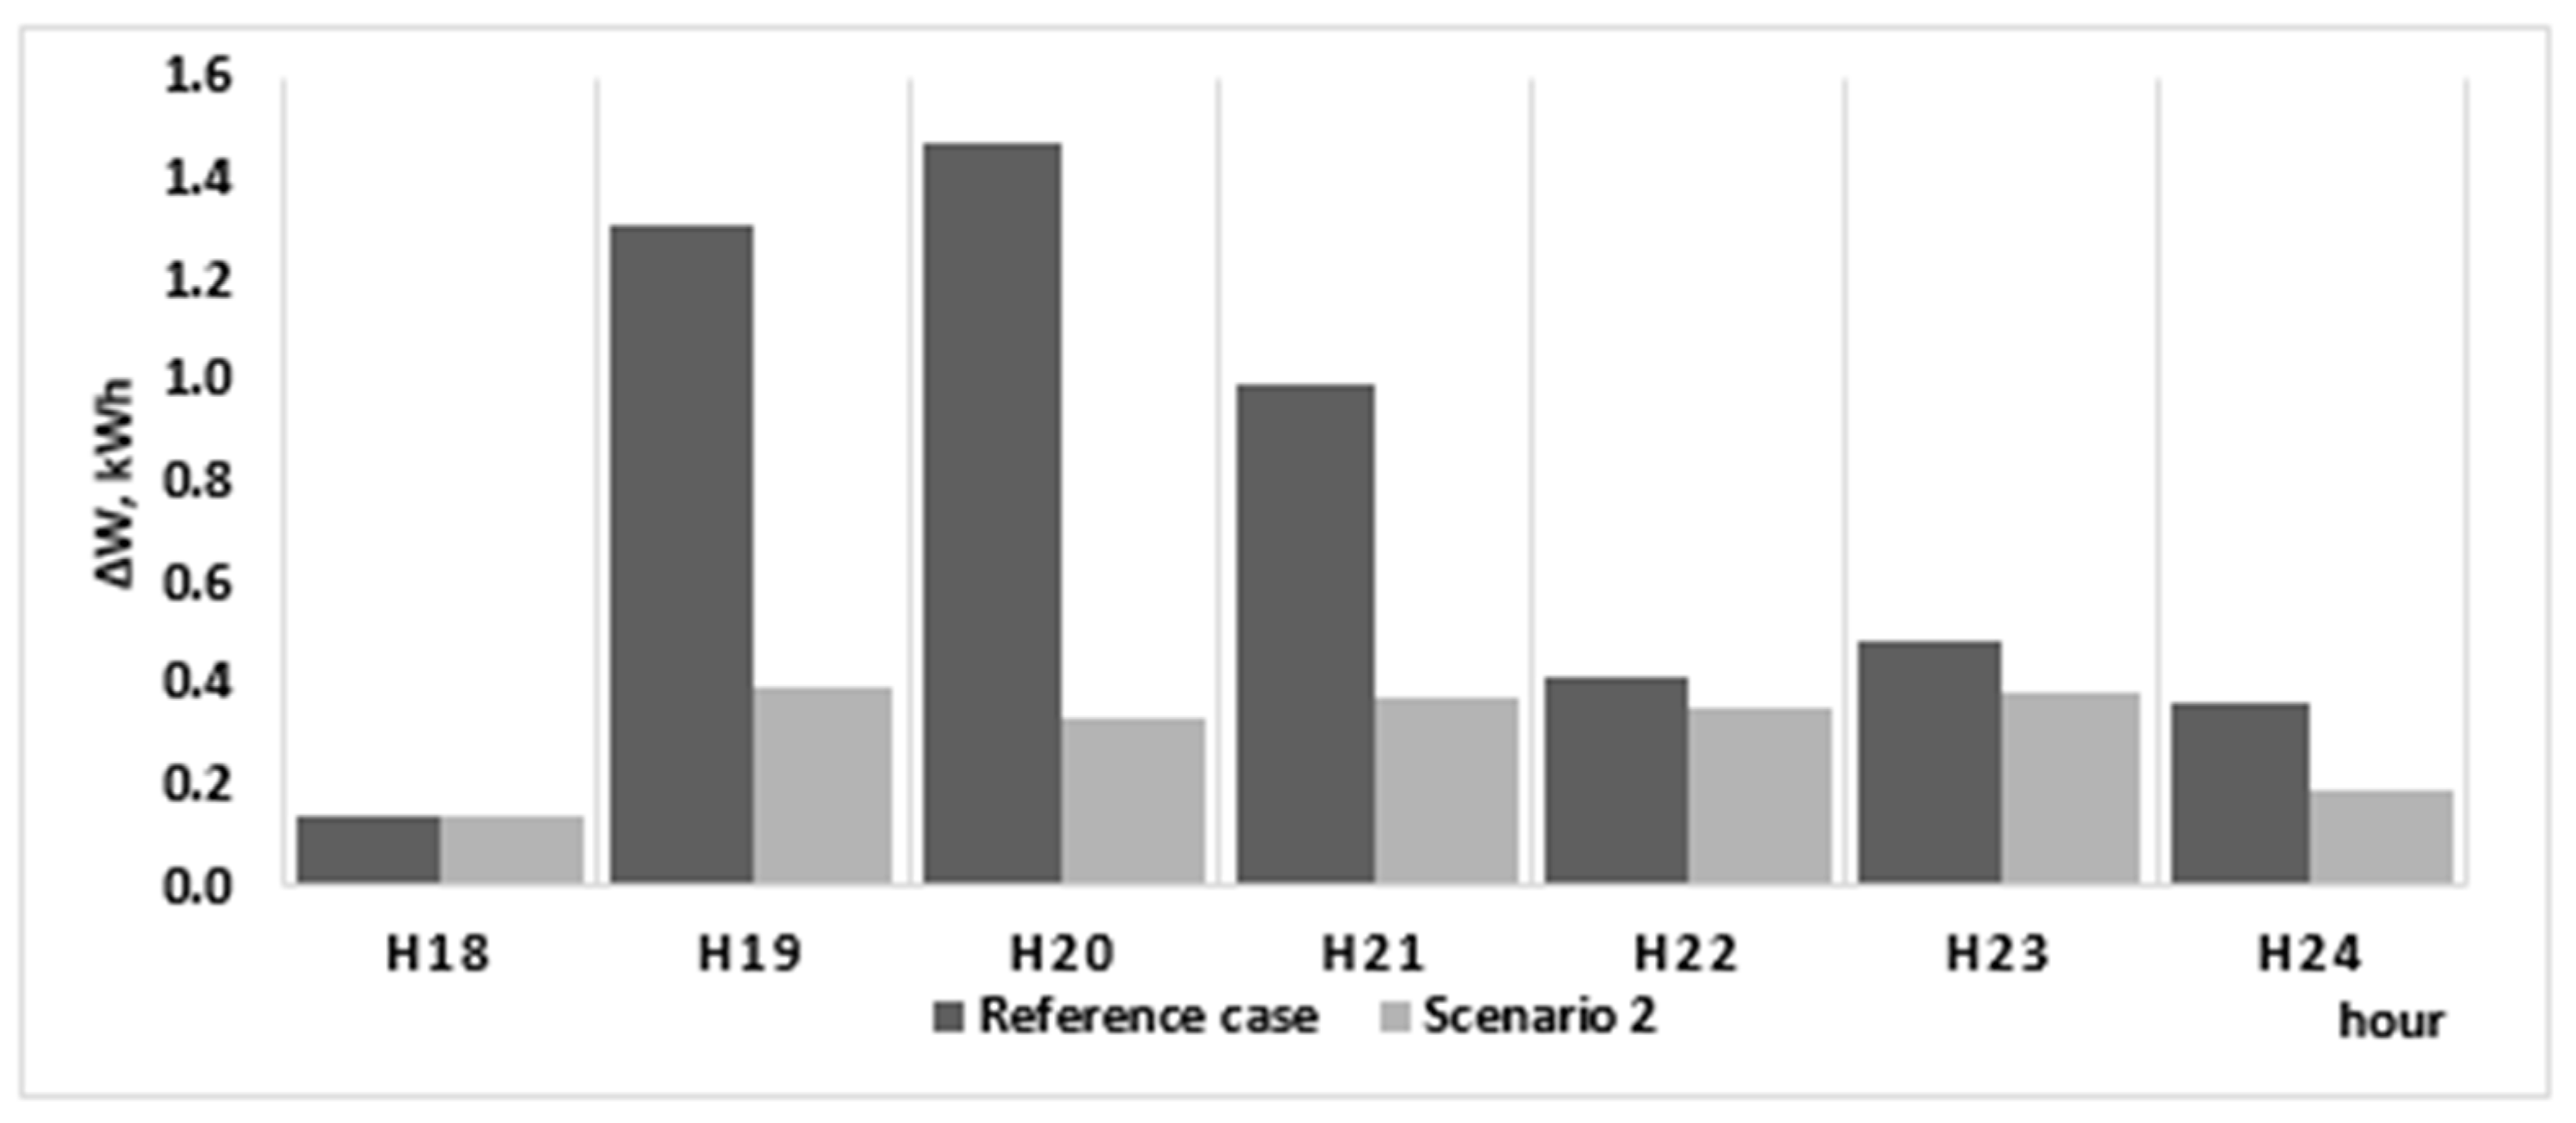
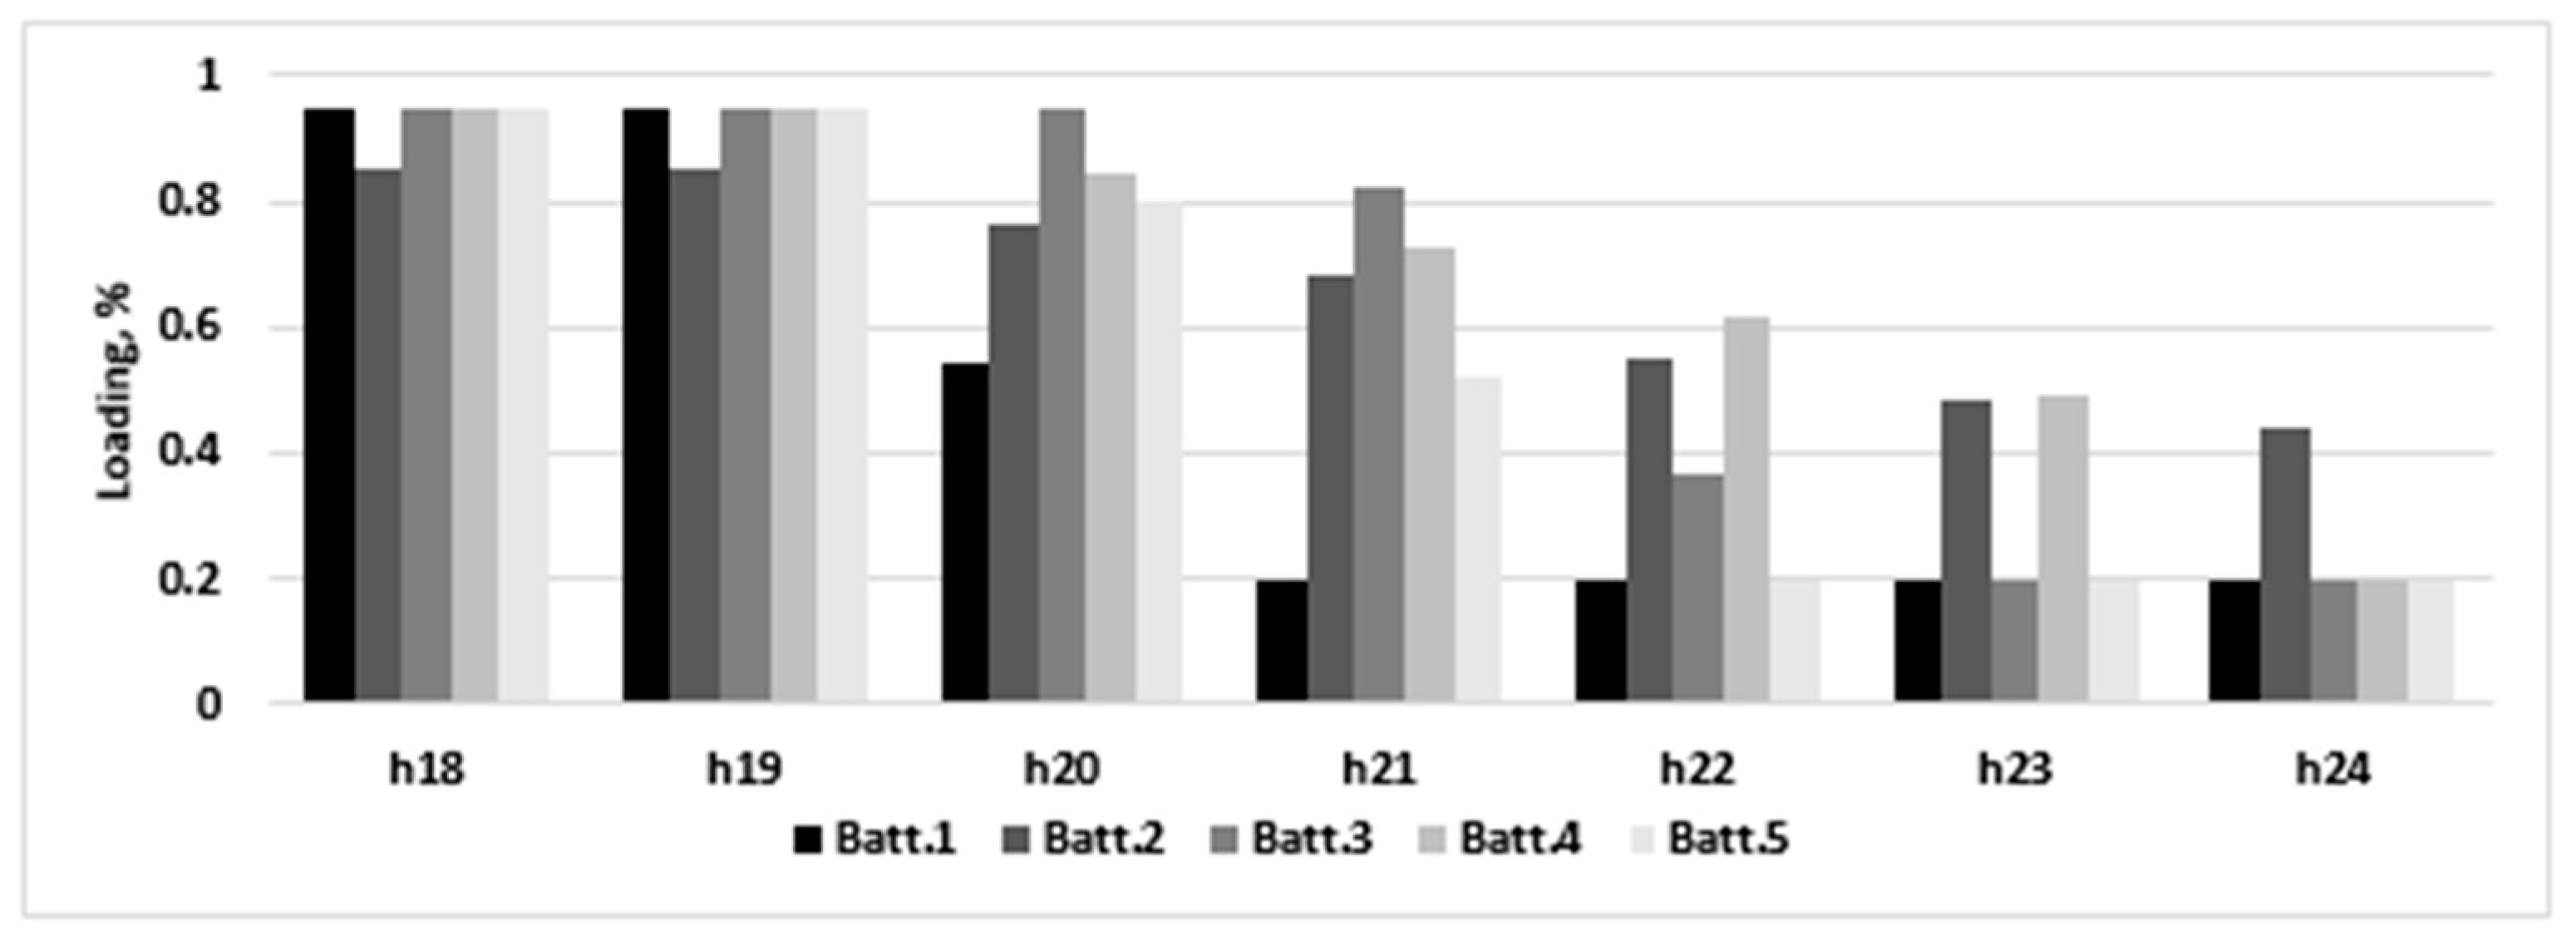
4.3. Scenario 2—Batteries Can Be Installed at Different Buses and Phases

In this case, as Table 2 shows, the algorithm chose three buses for installing the batteries: 85, 56 (in phase a, batteries 1, 4, 5), and 119 (in phase b, batteries 2, 3). All three were prosumer buses, with high load and located near the far end of the network. The batteries all discharged differently. Those located in phase a discharged faster and were almost depleted at the end of the day. The batteries installed in phase b discharged later and slower, according to the load of the bus in the same time interval. This behavior can be seen in Figure 10. Battery 3 retained half of its load due to insufficient consumption in bus 119.
Because of the higher amount of energy used from the batteries, the energy loss reduction was much higher, with the total energy loss in 24 h only being 5.62 kWh, a significant improvement compared to Scenario 1. The loss reduction in the interval 18:01–24:00 is presented in Figure 11, and amounted to 3.02 kWh, the highest value achieved in the three scenarios considered in the paper. By optimally distributing the use of storage on different buses and phases, the effect is maximized.

4.4. Scenario 3—Batteries Can Be Installed Only in Prosumer Buses

This scenario illustrates another set of operating conditions that can occur in the network. The results from Table 2 show that in Scenario 2, the batteries were placed in prosumer buses located at significant distance from the MV/LV substation, while the batteries are considered to be charged. This placement scheme could also be considered as a valid solution for Scenario 3. However, here, the assumption is that the batteries start at the minimum level of charge and are charged during the day by each prosumer using its surplus, and the charging sequence changes the hourly loss profile during the daytime. Thus, the optimal solution changes. The battery discharge pattern is modified as in Figure 12, supplemented with the charge pattern from Figure 13 (hours 06:00–17:59). The corresponding loss patterns in the same intervals are presented in Figure 14 and Figure 15.
As Figure 15 shows, the increase in losses during the charge of the batteries is responsible for the high loss difference from Scenarios 2 and 3. The energy used to charge the batteries would be otherwise injected in the grid, replacing an equivalent supply from the substation. A high quantity of energy imported from the grid, which needs to supply consumption near the far end of the network, is likely to create equivalently high losses, accounting for the increase seen between hours 06:00 and 14:00, as seen in Figure 15. The loss reduction at peak time is of 2.74 kWh, comparable with the values obtained in the previous scenarios, but the increase in the 06:00–17:59 interval was 1.61 kWh.
Another aspect, emphasized by Figure 13, is the fact that if the batteries are managed by the prosumer, they cannot not used to their maximum capacity, depending on their available surplus. This was the case of battery 2, which did not reach the maximum allowed loading of 95%.

5. Discussion

The authors proposed an algorithm capable of managing one-phase storage batteries installed in a three-phase low-voltage distribution network. Three scenarios were considered for optimization, and each of them shows possible situations that can occur in the operation of this type of network and storage, in real conditions.
In Scenario 1, where all the batteries need to be concentrated in one bus, the network operator is able to manage the batteries with minimal cost, but its options can be limited in reducing the energy losses. The electricity consumption was, in this case, lower than the available storage capacity, which is used sub-optimally. Two batteries were installed, but not discharged in the peak load interval. The operator will need to sustain minimal investment costs for storage installation, but will also obtain sub-optimal loss reduction.
Scenario 2 is the optimal case from the technical standpoint, because the loss reduction is maximal. However, the investment cost will increase for the network operator, because it will need to install and remotely mange batteries in three separate locations.
Scenario 3 shows that, even if the management of the batteries is outside the control of the DNO, the presence of storage can still provide energy loss reduction, although it can be significantly lower compared to the previous scenarios.
The genetic algorithm has been proven to be an efficient tool for computing the different formulations of the storage management problem. By properly choosing a chromosome structure that can be adapted to simulate these scenarios, it eliminates the need to build and solve each problem separately and can provide the necessary results for quick and meaningful comparison of the specificities encountered in each analyzed scenario.
Another aspect to be mentioned is the initial assumption for Scenarios 1 and 2, where the batteries were fully loaded at the beginning of the study. In real operation conditions, they would need to be charged at no-load night hours. As the loss profile from Scenario 3 shows, the charge could significantly impact the total daily losses. However, different strategies used for this purpose can result in significant differences (fast charge vs. low charge). A pertinent analysis should also take into account the price of electricity at night time, and the load profile of the network in the charging interval. These problems require an in-depth study and will be addressed in future research derived from this paper.
Other future research includes the possibility of combining storage technologies with reactive power compensation devices and substation transformer tap management, which would allow for further reduction in energy losses and bus voltage level improvement. It is expected that the impact of these measures would provide even more insights regarding the optimal use of storage in low-voltage distribution networks.
The results obtained in the paper show the necessity of the optimal use of storage in low-voltage unbalanced distribution networks. The problem is the cost of the batteries for the network operator, but, given the EU initiatives sustaining renewable electricity generation, it is foreseeable that these costs could be partially mitigated, but this also depends on local energy policies put forward by national governments.

6. Conclusions

The paper takes a new approach in prosumer surplus management, tested on a low-voltage electricity distribution network. Compared with the approach in which storage is owned and managed by the individual prosumers for their own benefit, which is preferred in the literature, the algorithm proposed by the authors considered two supplementary scenarios in which one-phase storage is used by the network manager to reduce the energy losses in three-phase, four-wire feeders. The community storage and the optimal distributed storage case were investigated, highlighting their strengths and weaknesses. Using the flexibility of the genetic algorithm approach, the three scenarios were modeled within the same chromosome structure, making the results easier to compare and evaluate, a feature that is a key factor for industry application.

Supplementary Materials

The following are available online at https://www.mdpi.com/article/10.3390/math9192375/s1, Table S1: the consumer and prosumer data used in the study.

Author Contributions

Conceptualization, M.G., B.-C.N., G.G. and O.I.; Methodology, O.I. and G.G.; Software, M.G., F.S. and O.I.; Validation, B.-C.N.; Formal analysis, M.G.; Data curation, B.-C.N. and F.S.; Writing—original draft preparation, O.I.; Writing—review and editing, B.-C.N. and F.S. All authors have read and agreed to the published version of the manuscript.

Funding

This research and the APC were funded by a publications grant of the “Gheorghe Asachi” Technical University of Iasi; project number GI/P19/2021.

Conflicts of Interest

The authors declare no conflict of interest.

References

  1. OPCOM—the Romanian Gas and Electricity Market Operator. Available online: https://www.opcom.ro/pp/grafice_ip/raportPIPsiVolumTranzactionat.php?lang=en (accessed on 10 August 2021).
  2. Kahouli, B. The causality link between energy electricity consumption, CO2 emissions, R&D stocks and economic growth in Mediterranean countries (MCs). Energy 2018, 145, 388–399. [Google Scholar]
  3. Communication from the Commission to the European Parliament, the Council, the European Economic and Social Committee and the Committee of the Regions ‘Fit for 55’: Delivering the EU’s 2030 Climate Target on the Way to Climate Neutrality COM/2021/550 Final. Available online: https://eur-lex.europa.eu/legal-content/EN/TXT/?uri=CELEX%3A52021DC0550 (accessed on 2 August 2021).
  4. Parag, Y.; Sovacool, B.K. Electricity market design for the prosumer era. Nat. Energy 2016, 1, 1–6. [Google Scholar] [CrossRef]
  5. Bellekom, S.; Arentsen, M.; van Gorkum, K. Prosumption and the distribution and supply of electricity. Energy Sustain. Soc. 2016, 6, 22. [Google Scholar] [CrossRef] [Green Version]
  6. Romanian Energy Regulatory Authority. The 228 Order for the Approval of the Technical Norm Technical Conditions for Connection to the Public Electrical Networks of the Prosumers. Available online: https://www.anre.ro/ro/legislatie/prosumatori (accessed on 2 August 2021).
  7. Van der Stelt, S.; AlSkaif, T.; van Sark, W. Techno-economic analysis of household and community energy storage for residential prosumers with smart appliances. Appl. Energy 2018, 209, 266–276. [Google Scholar] [CrossRef]
  8. Gram-Hanssen, K.; Hansen, A.R.; Mechlenborg, M. Danish PV prosumers’ time-shifting of energy-consuming everyday practices. Sustainability 2020, 12, 4121. [Google Scholar] [CrossRef]
  9. Li, X.; Lim, M.K.; Ni, D.; Zhong, B.; Xiao, Z.; Hao, H. Sustainability or continuous damage: A behavior study of prosumers’ electricity consumption after installing household distributed energy resources. J. Clean. Prod. 2020, 264, 121471. [Google Scholar] [CrossRef]
  10. Ruiz-Abellón, M.C.; Fernández-Jiménez, L.A.; Guillamón, A.; Falces, A.; García-Garre, A.; Gabaldón, A. Integration of demand response and short-term forecasting for the management of prosumers’ demand and generation. Energies 2020, 13, 11. [Google Scholar] [CrossRef] [Green Version]
  11. Liu, N.; Yu, X.; Wang, C.; Wang, J. Energy sharing management for microgrids with PV prosumers: A Stackelberg game approach. IEEE Trans. Ind. Inform. 2017, 13, 1088–1098. [Google Scholar] [CrossRef]
  12. Zafar, R.; Mahmood, A.; Razzaq, S.; Ali, W.; Naeem, U.; Shehzad, K. Prosumer based energy management and sharing in smart grid. Renew. Sustain. Energy Rev. 2018, 82, 1675–1684. [Google Scholar] [CrossRef]
  13. Venizelou, V.; Makrides, G.; Efthymiou, V.; Georghiou, G.E. Methodology for deploying cost-optimum price-based demand side management for residential prosumers. Renew. Energy 2020, 153, 228–240. [Google Scholar] [CrossRef]
  14. Ghosh, A.; Aggarwal, V. Penalty based control mechanism for strategic prosumers in a distribution network. Energies 2020, 13, 452. [Google Scholar] [CrossRef] [Green Version]
  15. Ma, L.; Liu, N.; Zhang, J.; Wang, L. Real-time rolling horizon energy management for the energy-hub-coordinated prosumer community from a cooperative perspective. IEEE Trans. Power Syst. 2018, 34, 1227–1242. [Google Scholar] [CrossRef]
  16. Lim, S.Y.; Lee, T.W. Implementation of prosumer management system for small microGrid. J. Korea Inst. Inf. Electron. Commun. Technol. 2020, 13, 590–596. [Google Scholar]
  17. Barbosa, M.A.; Gül, K.; Bratcu, A.I.; Munteanu, I. Management of a photovoltaic-battery-based microgrid in a prosumer context. In Proceedings of the 6th International Symposium on Electrical and Electronics Engineering (ISEEE), Galati, Romania, 18–20 October 2019; IEEE: New York, NY, USA, 2019. [Google Scholar]
  18. Yang, Q.; Wang, H. Distributed energy trading management for renewable prosumers with HVAC and energy storage. Energy Rep. 2021, 7, 2512–2525. [Google Scholar] [CrossRef]
  19. Pilz, M.; Al-Fagih, L. Selfish energy sharing in prosumer communities: A demand-side management concept. In Proceedings of the IEEE International Conference on Communications, Control, and Computing Technologies for Smart Grids (SmartGridComm), Beijing, China, 21–23 October 2019; IEEE: New York, NY, USA, 2019. [Google Scholar]
  20. Han, L.; Morstyn, T.; McCulloch, M. Incentivizing prosumer coalitions with energy management using cooperative game theory. IEEE Trans. Power Syst. 2018, 34, 303–313. [Google Scholar] [CrossRef]
  21. Dolatabadi, M.; Siano, P. A scalable privacy preserving distributed parallel optimization for a large-scale aggregation of prosumers with residential PV-battery systems. IEEE Access 2020, 8, 210950–210960. [Google Scholar] [CrossRef]
  22. Achiluzzi, E.; Kobikrishna, K.; Sivabalan, A.; Sabillon, C.; Venkatesh, B. Optimal Asset planning for prosumers considering energy storage and photovoltaic (PV) units: A stochastic approach. Energies 2020, 13, 1813. [Google Scholar] [CrossRef] [Green Version]
  23. Korjani, S.; Serpi, A.; Damiano, A. A genetic algorithm approach for sizing integrated PV-BESS systems for prosumers. In Proceedings of the 2nd IEEE International Conference on Industrial Electronics for Sustainable Energy Systems (IESES), Cagliari, Italy, 1–3 September 2020; IEEE: New York, NY, USA, 2020. [Google Scholar]
  24. Guo, Z.; Wei, W.; Chen, L.; Wang, Z.; Catalão, J.P.; Mei, S. Optimal energy management of a residential prosumer: A robust data-driven dynamic programming approach. IEEE Syst. J. 2020, 1–10. [Google Scholar] [CrossRef]
  25. Azim, M.I.; Tushar, W.; Saha, T.K. Investigating the impact of P2P trading on power losses in grid-connected networks with prosumers. Appl. Energy 2020, 263, 114687. [Google Scholar] [CrossRef]
  26. Petrou, K.; Procopiou, A.T.; Gutierrez-Lagos, L.; Liu, M.Z.; Ochoa, L.F.; Langstaff, T.; Theunissen, J. Ensuring distribution network integrity using dynamic operating limits for prosumers. IEEE Trans. Smart Grid. 2021, 12, 3877–3888. [Google Scholar] [CrossRef]
  27. Nousdilis, A.I.; Christoforidis, G.C.; Papagiannis, G.K. Active power management in low voltage networks with high photovoltaics penetration based on prosumers’ self-consumption. Appl. Energy 2018, 229, 614–624. [Google Scholar] [CrossRef]
  28. Qi, M.; Yang, H.; Wang, D.; Luo, Y.; Zhang, S.; Liao, S. Prosumers peer-to-peer transaction decision considering network constraints. In Proceedings of the IEEE 3rd Conference on Energy Internet and Energy System Integration (EI2), Changsha, China, 8–12 November 2019; IEEE: New York, NY, USA, 2019. [Google Scholar]
  29. Yang, J.; Paudel, A.; Gooi, H.B. Compensation for power loss by a Proof-of-Stake consortium blockchain microgrid. IEEE Trans. Ind. Inform. 2020, 17, 3253–3262. [Google Scholar] [CrossRef]
  30. Wu, C.; Zhou, D.; Lin, X.; Wei, F.; Chen, C.; Ma, Y.; Dawoud, S.M. A novel energy cooperation framework for community energy storage systems and prosumers. Int. J. Electr. Power Energy Syst. 2022, 134, 107428. [Google Scholar] [CrossRef]
  31. El-Batawy, S.A.; Morsi, W.G. Optimal design of community battery energy storage systems with prosumers owning electric vehicles. IEEE Trans. Ind. Inform. 2017, 14, 1920–1931. [Google Scholar] [CrossRef]
  32. Shin, I. Approximation algorithm-based prosumer scheduling for microgrids. Energies 2020, 13, 5853. [Google Scholar] [CrossRef]
  33. Ali, Z.M.; Diaaeldin, I.M.; Aleem, S.H.E.A.; El-Rafei, A.; Abdelaziz, A.Y.; Jurado, F. Scenario-Based network reconfiguration and renewable energy resources integration in large-scale distribution systems considering parameters uncertainty. Mathematics 2021, 9, 26. [Google Scholar] [CrossRef]
  34. Pirouzi, S.; Aghaei, J.; Niknam, T.; Shafie-Khah, M.; Vahidinasab, V.; Catalão, J.P.S. Two alternative robust optimization models for flexible power management of electric vehicles in distribution networks. Energy 2017, 141, 635–652. [Google Scholar] [CrossRef]
  35. Lin, M.H.; Tsai, J.F.; Yu, C.S. A review of deterministic optimization methods in engineering and management. Math. Probl. Eng. 2012, 2012, 756023. [Google Scholar] [CrossRef] [Green Version]
  36. Adetunji, K.E.; Hofsajer, I.W.; Abu-Mahfouz, A.M.; Cheng, L. A Review of metaheuristic techniques for optimal integration of electrical units in distribution networks. IEEE Access 2021, 9, 5046–5068. [Google Scholar] [CrossRef]
  37. Djebedjian, B.; Abdel-Gawad, H.A.; Ezzeldin, R.M. Global performance of metaheuristic optimization tools for water distribution networks. Ain Shams Eng. J. 2021, 12, 223–239. [Google Scholar] [CrossRef]
  38. Grisales-Noreña, L.F.; González-Rivera, O.D.; Ocampo-Toro, J.A.; Ramos-Paja, C.A.; Rodríguez-Cabal, M.A. Metaheuristic optimization methods for optimal power flow analysis in DC distribution networks. Trans. Energy Syst. Eng. Appl. 2020, 1, 13–31. [Google Scholar] [CrossRef]
  39. Kahouli, O.; Alsaif, H.; Bouteraa, Y.; Ali, N.B.; Chaabene, M. Power System reconfiguration in distribution network for improving reliability using genetic algorithm and particle swarm optimization. Appl. Sci. 2021, 11, 3092. [Google Scholar] [CrossRef]
  40. Ionescu, L.-M.; Bizon, N.; Mazare, A.-G.; Belu, N. Reducing the cost of electricity by optimizing real-time consumer planning using a new genetic algorithm-based strategy. Mathematics 2020, 8, 1144. [Google Scholar] [CrossRef]
  41. Katoch, S.; Chauhan, S.S.; Kumar, V. A review on genetic algorithm: Past, present, and future. Multimed. Tools Appl. 2021, 80, 8091–8126. [Google Scholar] [CrossRef] [PubMed]
  42. Lambora, A.; Gupta, K.; Chopra, K. Genetic algorithm—A literature review. In Proceedings of the 2019 International Conference on Machine Learning, Big Data, Cloud and Parallel Computing (COMITCon), Faridabad, India, 14–16 February 2019; IEEE: Piscataway, NJ, USA, 2019. [Google Scholar]
  43. Alam, T.; Qamar, S.; Dixit, A.; Benaida, M. Genetic algorithm: Reviews, implementations, and applications. Int. J. Eng. Pedag. 2020, 10, 57–77. [Google Scholar] [CrossRef]
  44. Mirjalili, S. Genetic algorithm. In Evolutionary Algorithms and Neural Networks; Springer: Berlin/Heidelberg, Germany, 2019; pp. 43–55. [Google Scholar]
  45. The National Regulatory Authority for Energy (ANRE) Order no. 26/2016 Approving the Technical Energy Rule on Deter-Mining Own Technological Consumption in Public Electricity Networks—NTE 013/16/00. Available online: http://www.anre.ro (accessed on 10 August 2021).
Figure 1. The basic genetic algorithm.
Mathematics 09 02375 g001
Figure 2. A chromosome for the ESMRG algorithm.
Mathematics 09 02375 g002
Figure 3. The uniform crossover procedure modified for the ESMRG algorithm: (a) Scenario 1; (b) Scenarios 2 and 3.
Mathematics 09 02375 g003
Figure 4. The EDN used in the study.
Mathematics 09 02375 g004
Figure 5. The hourly surplus of each prosumer.
Mathematics 09 02375 g005
Figure 6. The hourly consumption in the network.
Mathematics 09 02375 g006
Figure 7. The active energy losses in the reference case.
Mathematics 09 02375 g007
Figure 8. The discharge pattern for the batteries, Scenario 1.
Mathematics 09 02375 g008
Figure 9. The energy loss reduction at peak hours, Scenario 1.
Mathematics 09 02375 g009
Figure 10. The discharge pattern for the batteries, Scenario 2.
Mathematics 09 02375 g010
Figure 11. The energy loss reduction at peak hours, Scenario 2.
Mathematics 09 02375 g011
Figure 12. The discharge pattern for the batteries, Scenario 3.
Mathematics 09 02375 g012
Figure 13. The charge pattern for the batteries, Scenario 3.
Mathematics 09 02375 g013
Figure 14. The energy loss pattern at battery discharging hours, Scenario 3.
Mathematics 09 02375 g014
Figure 15. The energy loss pattern at battery charging hours, Scenario 3.
Mathematics 09 02375 g015
Table 1. Summary data for the network used in the case study.
Number of buses121
Number of consumers113
Total load (24 h/06:00—18:00)219.85/76.01 kW
Total prosumer generation122.00 kW
Total prosumer surplus75.38 kW
Network typeOverhead, classic
Total/main feeder length4840/2240 m
Table 2. The solutions obtained using the ESMRG algorithm.
ScenarioSolutionΔW, kWh
Scenario 18585858585113126.63
Scenario 2851191198556122115.62
Scenario 3107 (85)83 (63)107 (85)94 (119)44 (37)121237.61
Publisher’s Note: MDPI stays neutral with regard to jurisdictional claims in published maps and institutional affiliations.

