Article

Analytical Stress Solution and Numerical Mechanical Behavior of Rock Mass Containing an Opening under Different Confining Stress Conditions

1
School of Resource Environment and Safety Engineering, University of South China, Hengyang 412001, China
2
School of Civil, Mining and Environmental Engineering, University of Wollongong, Wollongong, NSW 2522, Australia
3
School of Mines, China University of Mining and Technology, Xuzhou 221116, China
*
Author to whom correspondence should be addressed.
Mathematics 2021, 9(19), 2462; https://doi.org/10.3390/math9192462
Submission received: 1 September 2021 / Revised: 20 September 2021 / Accepted: 26 September 2021 / Published: 2 October 2021

Abstract

:
In this study, the triangle interpolation method for the calculation of mapping functions of plates containing an opening with arbitrary shapes is investigated with an improved method for point adjudgment during iterations. Afterwards, four kinds of openings with typical shapes are considered and the mapping functions for them are calculated, based on which the influence of calculation parameters such as iteration time and the number of terms on the accuracy of mapping function is discussed. Finally, the stress around an inverted U-shaped opening and around an arched opening under different far-field stress conditions is calculated and the effect of opening shape and lateral pressure coefficient on stress distribution and rock mechanical behaviors is further analyzed combined with the discrete element method (DEM) numerical simulation. The result shows that the stability and failure pattern of the rock mass is correlated with the stress around the opening, which is affected by the opening shape. The existence of opening also greatly reduces the enhancing influence of confining stress on rock specimen.

1. Introduction

There are an extensive range of underground openings such as roadways, tunnels, gas wells and so on in rock engineering. Stress distribution and failure characteristics around underground openings are important references in terms of the engineering design and stability assessment for such openings.
Currently, a great number of experimental studies have been conducted for the purpose of improving the understanding of the mechanical behavior of rock mass under different engineering conditions [1,2,3,4,5]. The mechanical behavior of underground engineering structures is usually studied via experiments on rock specimens containing one or more openings or joints under different stress conditions [6,7,8]. With the employment of the digital image correlation (DIC) technique, Zhou et al. [9] and Tan et al. [10] studied the mechanical behavior and crack propagation of rock specimens containing rectangular openings under static and dynamic loading, respectively. Wu et al. [11] processed rock specimens containing an opening with five presentive shapes and investigated the influence of an opening shape on the mechanical properties and fracture characteristics of rock specimens under uniaxial loading. These studies show that maniacal properties and fracturing behavior of rock specimens are tightly correlated with the loading condition and opening shape. The existence of openings significantly degrades the strength of specimens. The initial failure tends to appear at the top and bottom of the opening and dominated cracks always develop from opening corners. These influences of openings may be attributed to stress distribution. The mechanical behavior of rock mass containing defects also affects the confining stress. Wang et al. [12] reported that for rock specimens containing two flaws under compression tests, crack propagation and failure pattern of specimens are obviously affected by confining stress. The failure pattern of the specimen is transformed from vertical failure to horizontal failure with the increase in confining stress and is dominated by shear cracks under high confining stress conditions.
Experimental studies have significantly contributed to revealing the mechanical properties and failure behavior of rock mass containing defects. However, focusing on the phenomena analysis is less able to reveal the stress characteristics within the rock mass, which is essential for the prediction of potential risk [13]. Alternatively, with the development of computing capability, analytical and numerical methods have been widely employed for complex stress problems. Particularly, analytical studies promise high accuracy solutions and allow efficient parametric investigation to the analysis influence of engineering parameters on opening stability. With the employment of the complex variable method, stress solution for elastic plates containing an opening has been studied in a large amount of literature. Ukadgaonker and Awasare [14,15,16,17] conducted a series of studies on the analytical solutions for circular, elliptical, triangular, and rectangular openings in an infinite plane. Sharma [18] presented the general stress functions for determining the stress concentration around circular, elliptical and triangular openings with different opening orientation and far-field stress conditions. Wu et al. [19] calculated the stress concentration factor on the periphery of the horseshoe-shaped opening based on the analytical stress solution and analyzed the fracture response of specimens containing an opening with the combination of an analytical solution and experimental results. Zhao et al. [20] presented the analytical solution for rock stress around a square tunnel under different confining stress conditions. They found that with the increasing pressure coefficient, the boundary stress gradually converted from tensile stress to compressive stress for the two sidewalls while the opposite situation occurred for the roof and floor. According to the boundary conditions with the consideration of lining support force, Lv et al. [21] calculated the analytical solutions for a non-circular tunnel with closed support, which offers a perspective on the stress solution for supported openings at great depth. Recently, Setiawan and Zimmerman [22] revived a graphical approach proposed by Melentiev [23] and then proposed a new method for the calculation of in-plane stress around a hole with arbitrary shapes in isotropic or anisotropic materials.
In the above-mentioned analytical studies, the calculation of stress solution is based on conformal mapping, which allows an opening in a domain to be mapped into a unit circle in another domain via a mapping function. Therefore, the determination of the mapping function is preliminary and essential for the analytical solution based on the complex variable theory. The mapping function for a circular opening can be directly calculated according to its radius. For openings with simple shapes such as regular polygons, their mapping functions can also be easily calculated by given formulas [24,25]. However, for openings with complex shapes, mapping functions are usually characterized by a great number of terms and parameters, which makes it difficult to determine. Lv et al. [26] developed a general optimization method to calculate the mapping function parameters for plates containing an opening with arbitrary shapes, in which an objective function is proposed to calculate the optimal parameters by reducing the coordinate error of mapping points during iterations. Combined with Box’s optimization method [27], this method is further improved by Tan et al. with a new objective function proposed for the optimization calculation [28,29]. Another method for the calculation of mapping functions is the triangle interpolation method. By repeating the mutual iteration of odd and even interpolation points, Zhu et al. [30] solved the mapping functions for a series of engineering openings with complex shapes based on the triangular interpolation theory. Compared with other methods for the calculation of mapping functions, this method is of high efficiency and allows more terms with coefficients in the form of complex numbers to obtain a high accurate solution for openings with complex shapes.
In this study, the procedure of calculating the mapping functions for openings with complex shapes using the triangular interpolation method was introduced and improved. The mapping functions of four openings with presentative shapes were calculated and the factors affecting their accuracy were discussed. In addition, the inverted U-shaped opening and arched opening were selected, and the stress solution around them with different lateral pressure coefficients were calculated. The influence of the opening shape and confining stress on the stress characteristics was studied. Furthermore, DEM numerical simulations were conducted with the failure patterns of openings at different confining stress levels presented. With the combination of analytical and numerical results, the correlation between stress distribution and failure patterns around the openings was discussed.

2. Determination of Mapping Function

2.1. Principles of Triangle Interpolation

Based on conformal mapping method, the plane containing an opening (z-plane) can be mapped to the plane containing a unit circle (ζ-plane), which is realized by the mapping function:
Z = ω ( ζ ) = k = 1 C k ζ 2 k
Take the leading m Ck of ω ( ζ ) , then it can be written as:
Z = ω ( ζ ) = k = 1 m C k ζ 2 k
Usually, Ck are complex constants, which can be expressed as:
C k = A k + i B k k = 1 ,   2 ,   3 ,   ,   m
where both Ak and Bk are real constants.
For any point σ at the boundary of the unit circle in ζ-plane whose polar coordinate is (1, θ), it can be expressed as:
σ = cos θ + i sin θ
Similarly, for the mapping point t of σ at the boundary of the opening in z-plane, whose polar coordinate is (r, α), it can be expressed as:
t = r cos α + i r sin α
By substituting Equations (3)–(5) into Equation (2), we can find:
r cos α + i r sin α = k = 1 m { A k cos [ ( k 2 ) θ ] + B k sin [ ( k 2 ) θ ] i A k sin [ ( k 2 ) θ ] + i B k cos [ ( k 2 ) θ ] }
With the extraction of the real part and imaginary part, the following equation can be obtained:
{ r cos α = k = 1 m { A k cos [ ( k 2 ) θ ] + B k sin [ ( k 2 ) θ ] } r sin α = k = 1 m { A k sin [ ( k 2 ) θ ] + B k cos [ ( k 2 ) θ ] }
For m points at the unit circle in ζ-plane with coordinates of (1, θj), their mapping points in z-plane are (rj, αj). Based on the orthogonality of trigonometric functions, Ak and Bk can be expressed as:
{ A k = 1 m j = 1 m { r j cos α j cos [ ( k 2 ) θ j ] r j sin α j sin [ ( k 2 ) θ j ] } B k = 1 m j = 1 m { r j cos α j sin [ ( k 2 ) θ j ] + r j sin α j cos [ ( k 2 ) θ j ] }
Then, 2n points are uniformly sampled at the unit circle in ζ-plane, which are divided into two groups σ e , j   ( 1 ,   θ e , j ) and σ o , j   ( 1 ,   θ o , j ) :
{ θ e , j = 2 π j n θ o , j = π ( 2 j 1 ) n j = 1 ,   2 ,   3 ,   ,   n
During the first iteration, n points tj (rj, αj) (j = 1, 2, 3, …, n) are randomly sampled at the boundary of the opening in z-plane. By substituting σ e , j and tj into Equation (8), the initial solutions A k ( 0 ) and B k ( 0 ) can be obtained:
{ A k ( 0 ) = 1 m j = 1 m { r j cos α j cos [ ( k 2 ) θ e , j ] r j sin α j sin [ ( k 2 ) θ e , j ] } B k ( 0 ) = 1 m j = 1 m { r j cos α j sin [ ( k 2 ) θ e , j ] + r j sin α j cos [ ( k 2 ) θ e , j ] }
Then the initial mapping function ω ( 0 ) ( ζ ) is determined with the substitution of A k ( 0 ) and B k ( 0 ) into Equation (2). Based on ω ( 0 ) ( ζ ) , the mapping points t o , j in z-plane of σ o , j can be calculated by:
t o , j = ω ( 0 ) ( σ o , j   ) j = 1 ,   2 ,   3 ,   ,   n
If the difference between tj and to,j is within tolerance, A k ( 0 ) and B k ( 0 ) are regarded as the optimal Ak and Bk, respectively. Otherwise, t o , j will be moved to the opening boundary and replaced by the original tj. By substituting σ o , j and tj into Equation (8), the solutions of Ak and Bk in the first iteration can be determined by:
{ A k ( 1 ) = 1 m j = 1 m { r j cos α j cos [ ( k 2 ) θ o , j ] r j sin α j sin [ ( k 2 ) θ o , j ] } B k ( 1 ) = 1 m j = 1 m { r j cos α j sin [ ( k 2 ) θ o , j ] + r j sin α j cos [ ( k 2 ) θ o , j ] }
The mapping function ω ( 1 ) ( ζ ) in the first iteration can be determined by Equation (11) with the substitution of A k ( 1 ) and B k ( 1 ) . Here the first iteration is completed. The accuracy of ω ( 1 ) ( ζ ) can be assessed by comparing tj and the mapping points t e , j of σ e , j calculated by ω ( 1 ) ( ζ ) ; ω ( 1 ) ( ζ ) is employed as the optimal mapping function if its accuracy is satisfying. Otherwise, t e , j will be moved to the opening boundary and then become the new tj. Then the next iteration calculation will be conducted. With the increase in iteration times, the solution accuracy will gradually increase and finally remain stable.
As for the movement of t o , j and t e , j into the opening boundary, the previous study [30] has realized this process in the Cartesian coordinate system. As shown in Figure 1, for a point z0 in z-plane, its Cartesian coordinate is (x0, y0). The line through z0 and the origin is described by function g(z) and the opening boundary is described by function f(z). Then, the corresponding point z1 at the opening boundary for z0 can be calculated by:
g ( z 1 ) = f ( z 1 )
Though it is feasible for openings with simple shapes, this method may be unavailable when the function describing the opening boundary is difficult to determine. To address this problem, reference points at opening boundary rather than the boundary function were used to moving an outside-opening point into the opening boundary. As shown in Figure 2, there are nref reference points uniformly distributed at the opening boundary in the polar coordinate system. For an outside-opening point t0 (r0, α0), its corresponding point at the opening boundary is tnew (rnew, α0). The reference points previous to and next to point t0 are p1(r1,α1) and p2(r2,α2), respectively. Then rnew can be calculated by linear interpolation:
r n e w = r 1 r 2 ( cos α 2 sin α 1 sin α 1 cos α 2 ) ( r 2 sin α 2 r 1 sin α 1 ) cos α 0 ( r 2 cos α 2 r 1 cos α 1 ) sin α 0
With Equation (14), the movement of t o , j and t e , j can be easily and accurately realized during each iteration. In this study, nref in all calculations for mapping functions is set as 1 × 10⁴ for a high accurate solution.

2.2. The Determination of Mapping Functions

As shown in Figure 3, four openings with typical shapes were used to verify the availability of the triangle interpolation. Among them the trapezoidal opening and irregular inverted U-shaped opening are asymmetric openings while the inverted U-shaped opening and the arched opening are symmetric openings. For the trapezoidal opening (Figure 3a), H1 = 2.50 m, H2 = 3.70 m and L1 = 4.00 m. For the irregular inverted U-shaped opening (Figure 3b), H1 = 2.50 m, H2 = 1.40 m, H3 = 1.90 m, L1 = 3.15 m and L2 = 1.05 m. For the inverted U-shaped opening (Figure 3c), H1 = 2.50 m, H2 = 1.40 m, H3 = 1.90 m and L1 = 4.20 m. For the arched opening (Figure 3d), R1 = 6.30 m, R2 = 8.80 m, R3 = 1.60 m, R4 = 15.60 m, L1 = 12.25 m, L2 = 2.50 m, L3 = 4.64 m, and L4 = 0.96 m. The origin of all planes containing a single opening is the centroid of the opening.
By uniformly sampling n points σ j   ( 1 ,   θ j ) from σ 1   ( 1 ,   0 ) , the mapping point of σ j is ( r σ ,   α σ ) and its corresponding point at the opening boundary is ( r σ ( 0 ) ,   α σ ) , the average absolute relative error (average ARE) of the n points is defined as:
f e b r e = 1 n j = 1 n | r σ r σ ( 0 ) | r σ ( 0 )
The change in the average ARE and the maximum absolute relative error (maximum ARE) of the mapping functions for each opening with the increase in iteration time are presented in Figure 4. In this study, n was set as 200 in all cases. It can be seen that both average ARE and maximum ARE decrease exponentially with the increase in iteration time. In all cases, average ARE decrease rapidly and then remains at a stable level close to zero with the increase in iteration time, indicating that the mapping functions for all openings are of high accuracy. However, the maximum ARE for all openings except the arched opening fails to decrease to zero but remains at a stable level greater than zero when the iteration time reaches a certain number. Especially for the irregular inverted U-shaped opening (Figure 4b), the maximum ARE is as high as 0.019. In contrast, the maximum ARE for the arched opening is almost closed to zero, showing little error of the mapping function. From Figure 4, the accuracy improvement of mapping functions becomes insignificant once iteration time reaches a certain value. In the following calculations, once error decrement, which is the difference between average ARE in the current iteration and in the prior iteration, is less than 1 × 10⁻⁶, the calculation result is determined to be convergent, and the result of the last iteration is adopted.
The increase in Ck number m contributes to the improvement of the accuracy of the mapping function. However, too many Ck terms may lead to a time-consuming calculation and high computational complexity. Therefore, the optimal Ck number is expected to be determined to achieve the balance between accuracy and efficiency. Accordingly, the relation curves between average ARE and m for the mapping functions of plates with the four kinds of openings are presented in Figure 5. For the irregular inverted U-shaped opening, the accuracy of mapping function remains a stable level when m is greater than 60. For the others, mapping functions almost reach stable when m is greater than 20. Therefore, in this study, m was set as 60 for the irregular inverted U-shaped opening and 20 for the other openings. Figure 6 presents the iteration time for convergency with the increase of m for each opening. Overall, more iterations are required for the calculation convergency for the asymmetric openings (trapezoidal opening and irregular inverted U-shaped opening) than that for symmetric openings (inverted U-shaped opening and arched opening). This may be because Ck are complex numbers in the mapping functions for the former openings but are real number for the later openings, which makes the calculation for the former ones more complex and accordingly more iteration times for them are required.
Figure 7 plots the comparisons between the mapping shape and original shape of all openings. We can find that obvious differences between the mapping shape and original shape exist at the lower right corners of the irregular inverted U-shaped opening though the whole mapping shape agree well with the original one. Comparing Figure 4 and Figure 7 shows that for the arched opening without corners, the mapping function is perfectly accurate with little error. However, obvious error is more likely to happen at the corners of the other openings especially for those with complex shapes.
The parameters of mapping functions for some openings are listed in Table 1. As the mapping function of the plane containing the irregular inverted U-shaped opening has too many terms of Ck, its parameters are not presented. For the inverted U-shaped opening and the arched opening which are symmetrical about the x axis, Ck are real constants, namely Bk = 0.

3. Stress Solution of Plates Containing a Single Opening

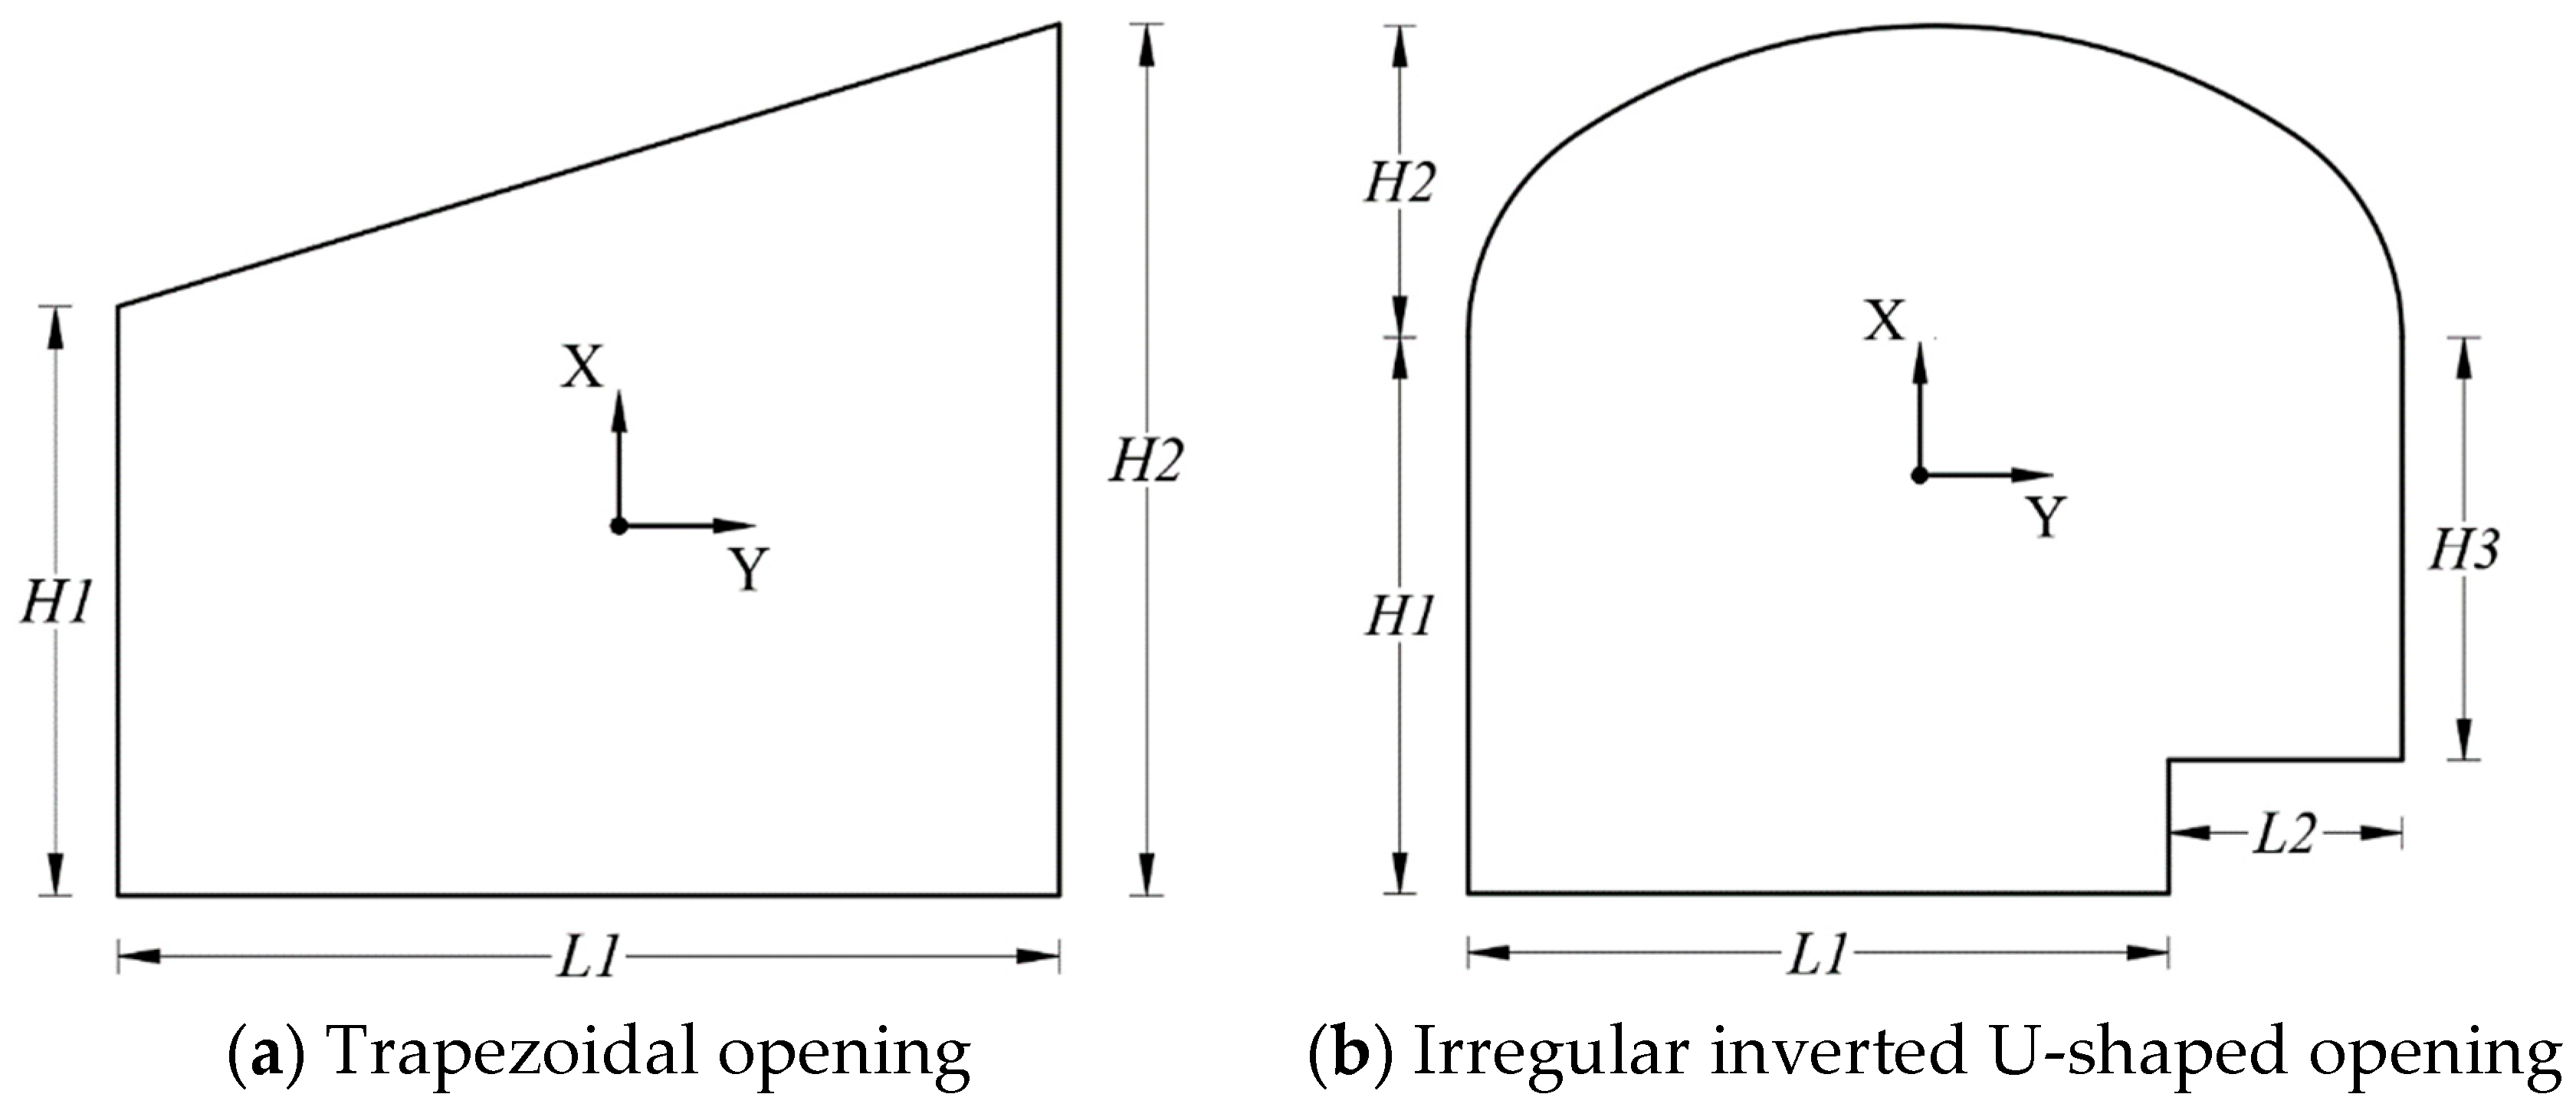
3.1. Calculation Models

In practical engineering, the surrounding rock mass of the underground opening is usually in complex stress conditions. The far-field stress may have a significant influence on the stress distribution around the opening and thus may further affect the stability and failure pattern of the opening. To improve the understanding of stress distribution around the opening under different far-field stress conditions, the inverted U-shaped opening and arched opening are selected and the analytical stress solutions for them are calculated, based on which the effect of the opening shape and lateral pressure coefficient λ on stress distribution is investigated. To make the calculation more effective, principal stresses are suggested for the description the far-field stress condition, which can be realized by adjusting the orientation of the opening. In practical underground engineering, as the direction of vertical stress is usually close to or identical to that of a principal stress and the tunnel orientation is usually designed to be parallel to a principal stress direction to minimize the effect of antiplane stresses. The change in opening orientation is not considered in the following examples. As shown in Figure 8, the far-field vertical stress σ x and the far-field horizontal stress σ y are two principal stresses in the plate, which are set as p and λp, respectively. λ is the lateral pressure coefficient. In this study, seven levels of λ are considered, whose value is from 0 to 1.0 with an interval of 0.1. The detailed solution procedure for a plate containing an opening has been elaborated by many studies [28,31]. Therefore, it is not presented in this study.

3.2. Stress Calculation for Plates

Figure 9 presents the analytical solutions of hoop stress σθ on the opening boundaries with some typical λ. The negative σθ is tensile stress and the positive σθ is compressive stress. Tensile stress appears in the roof and floor of the openings while compressive stress appears in other locations for both kind of openings under uniaxial stress (λ = 0), but the tensile stress gradually decreases and finally converts into compressive stress with the increase in confining stress. However, despite their similarity, significant difference is observed between the stress distribution around the inverted U-shaped opening and around the inverted U-shaped opening. The compressive stress concentration level at the corners of the inverted U-shaped opening is much higher than that at the corners of the arched opening. For example, the maximum hoop stress at the corners is 7.69p for the inverted U-shaped opening but is only 3.73p for the arched opening. In addition, the two kinds of openings also show different stress response to the change in λ. Figure 10 presents the change trend of the maximum hoop stress σθ,max, the minimum hoop stress σθ,min and the difference between them (σθ,maxσθ,min) with the increase in λ. For both openings, σθ,min is close to -p when λ = 0 and linearly increase with the increase in λ (Figure 10b). When λ reaches a certain value, which is about 0.58 for the inverted U-shaped opening and 0.62 for the arched opening, σθ,min begin to be positive, which means there is no tensile stress appearing at the opening boundaries anymore. However, from Figure 10a we can see that σθ,max at the boundary of the inverted U-shaped opening increases linearly with λ but σθ,max at the boundary of the arched opening almost remains constant. In addition, Figure 10a shows that the gap between σθ,max and σθ,min is more and more greater for the inverted U-shaped opening but keeps narrowing for the arched opening.

4. DEM Numerical Simulation

4.1. Numerical Modelling

The mechanical properties and failure patterns of rock mass containing an opening under different stress conditions were further investigated by DEM numerical simulations via the commercial DEM code PFC2D. The balls within the models were bonded by contacts with the linear parallel bond model, which has been extensively used to study the mechanical behavior of rock mass by Itasca and many studies [32,33,34,35]. As shown in Figure 11, numerical specimens containing an inverted U-shaped opening and an arched opening were established. Axial stress σv was produced by axial displacement-control loading and confining stress σh was applied on both sides of the specimens. The meso-parameters of the numerical specimens were calculated by a series of numerical standard uniaxial compression tests based on a kind of sandstone with UCS of 49.5 MP and Young’s Modulus of 7.2 GPa, respectively. To make the numerical results for them comparable, the parameter Ck for both of their mapping functions were scaled down by 1: C1 respectively to make sure the sizes of the two openings were at the same level. Then, the size of the scaled-down openings was used in the numerical modelling.

4.2. Mechanical Properties

Some representative curves of axial stress versus axial strain for numerical specimens are presented in Figure 12. The axial stress is computed by dividing sectional area of the specimen into the force on the loading plate. The axial strain is the ratio of the initial length of the specimen to the axial displacement of the loading plate. It should be noted that the computed stress and strain are used to demonstrate the effect of a hole on the mechanical behavior of surrounding rock mass rather than to quantify the stress and strain conditions within specimens as they are not uniform within the specimens containing holes. For all intact specimens containing an opening, their stress-strain curves increase linearly during the early loading stage until close to their peak points. All the curves drop sharply during post-peak stage under uniaxial compressive loading (σh = 0 MPa), indicating strong brittle behavior. However, the plastic behavior appears under confining stress conditions, especially for the numerical specimens containing an inverted U-shaped opening where stress curves tend to be flat close to the peak point.
The change trends of peak axial stress of numerical specimens with different confining stress are shown in Figure 13. For intact specimens, a near linear relation between peak axial stress and confining stress is observed. However, this relation is not linear for specimens containing an opening. Moreover, the peak axial stress of specimens containing an opening is much lower than that of intact specimens. Take the numerical specimen containing an arched opening for example, its peak axial stress under uniaxial compression condition is 30.94 MPa, which is 79.76% of that of the intact specimen. In comparison, when the confining stress reaches 20 MPa, peak axial stress of the intact specimen sharply increases to 104.74 MPa while that of the specimen containing an arched opening only slightly increases to 45.49 MPa, which is only 43.43% of the intact one, also indicates that the existence of the opening significantly suppresses the positive influence of confining stress on strength of specimens. In addition, the opening shape also has an influence on the specimen strength. The specimen containing an arched opening is able to bear higher axial stress than that containing an inverted U-shaped opening under the same confining stress condition.

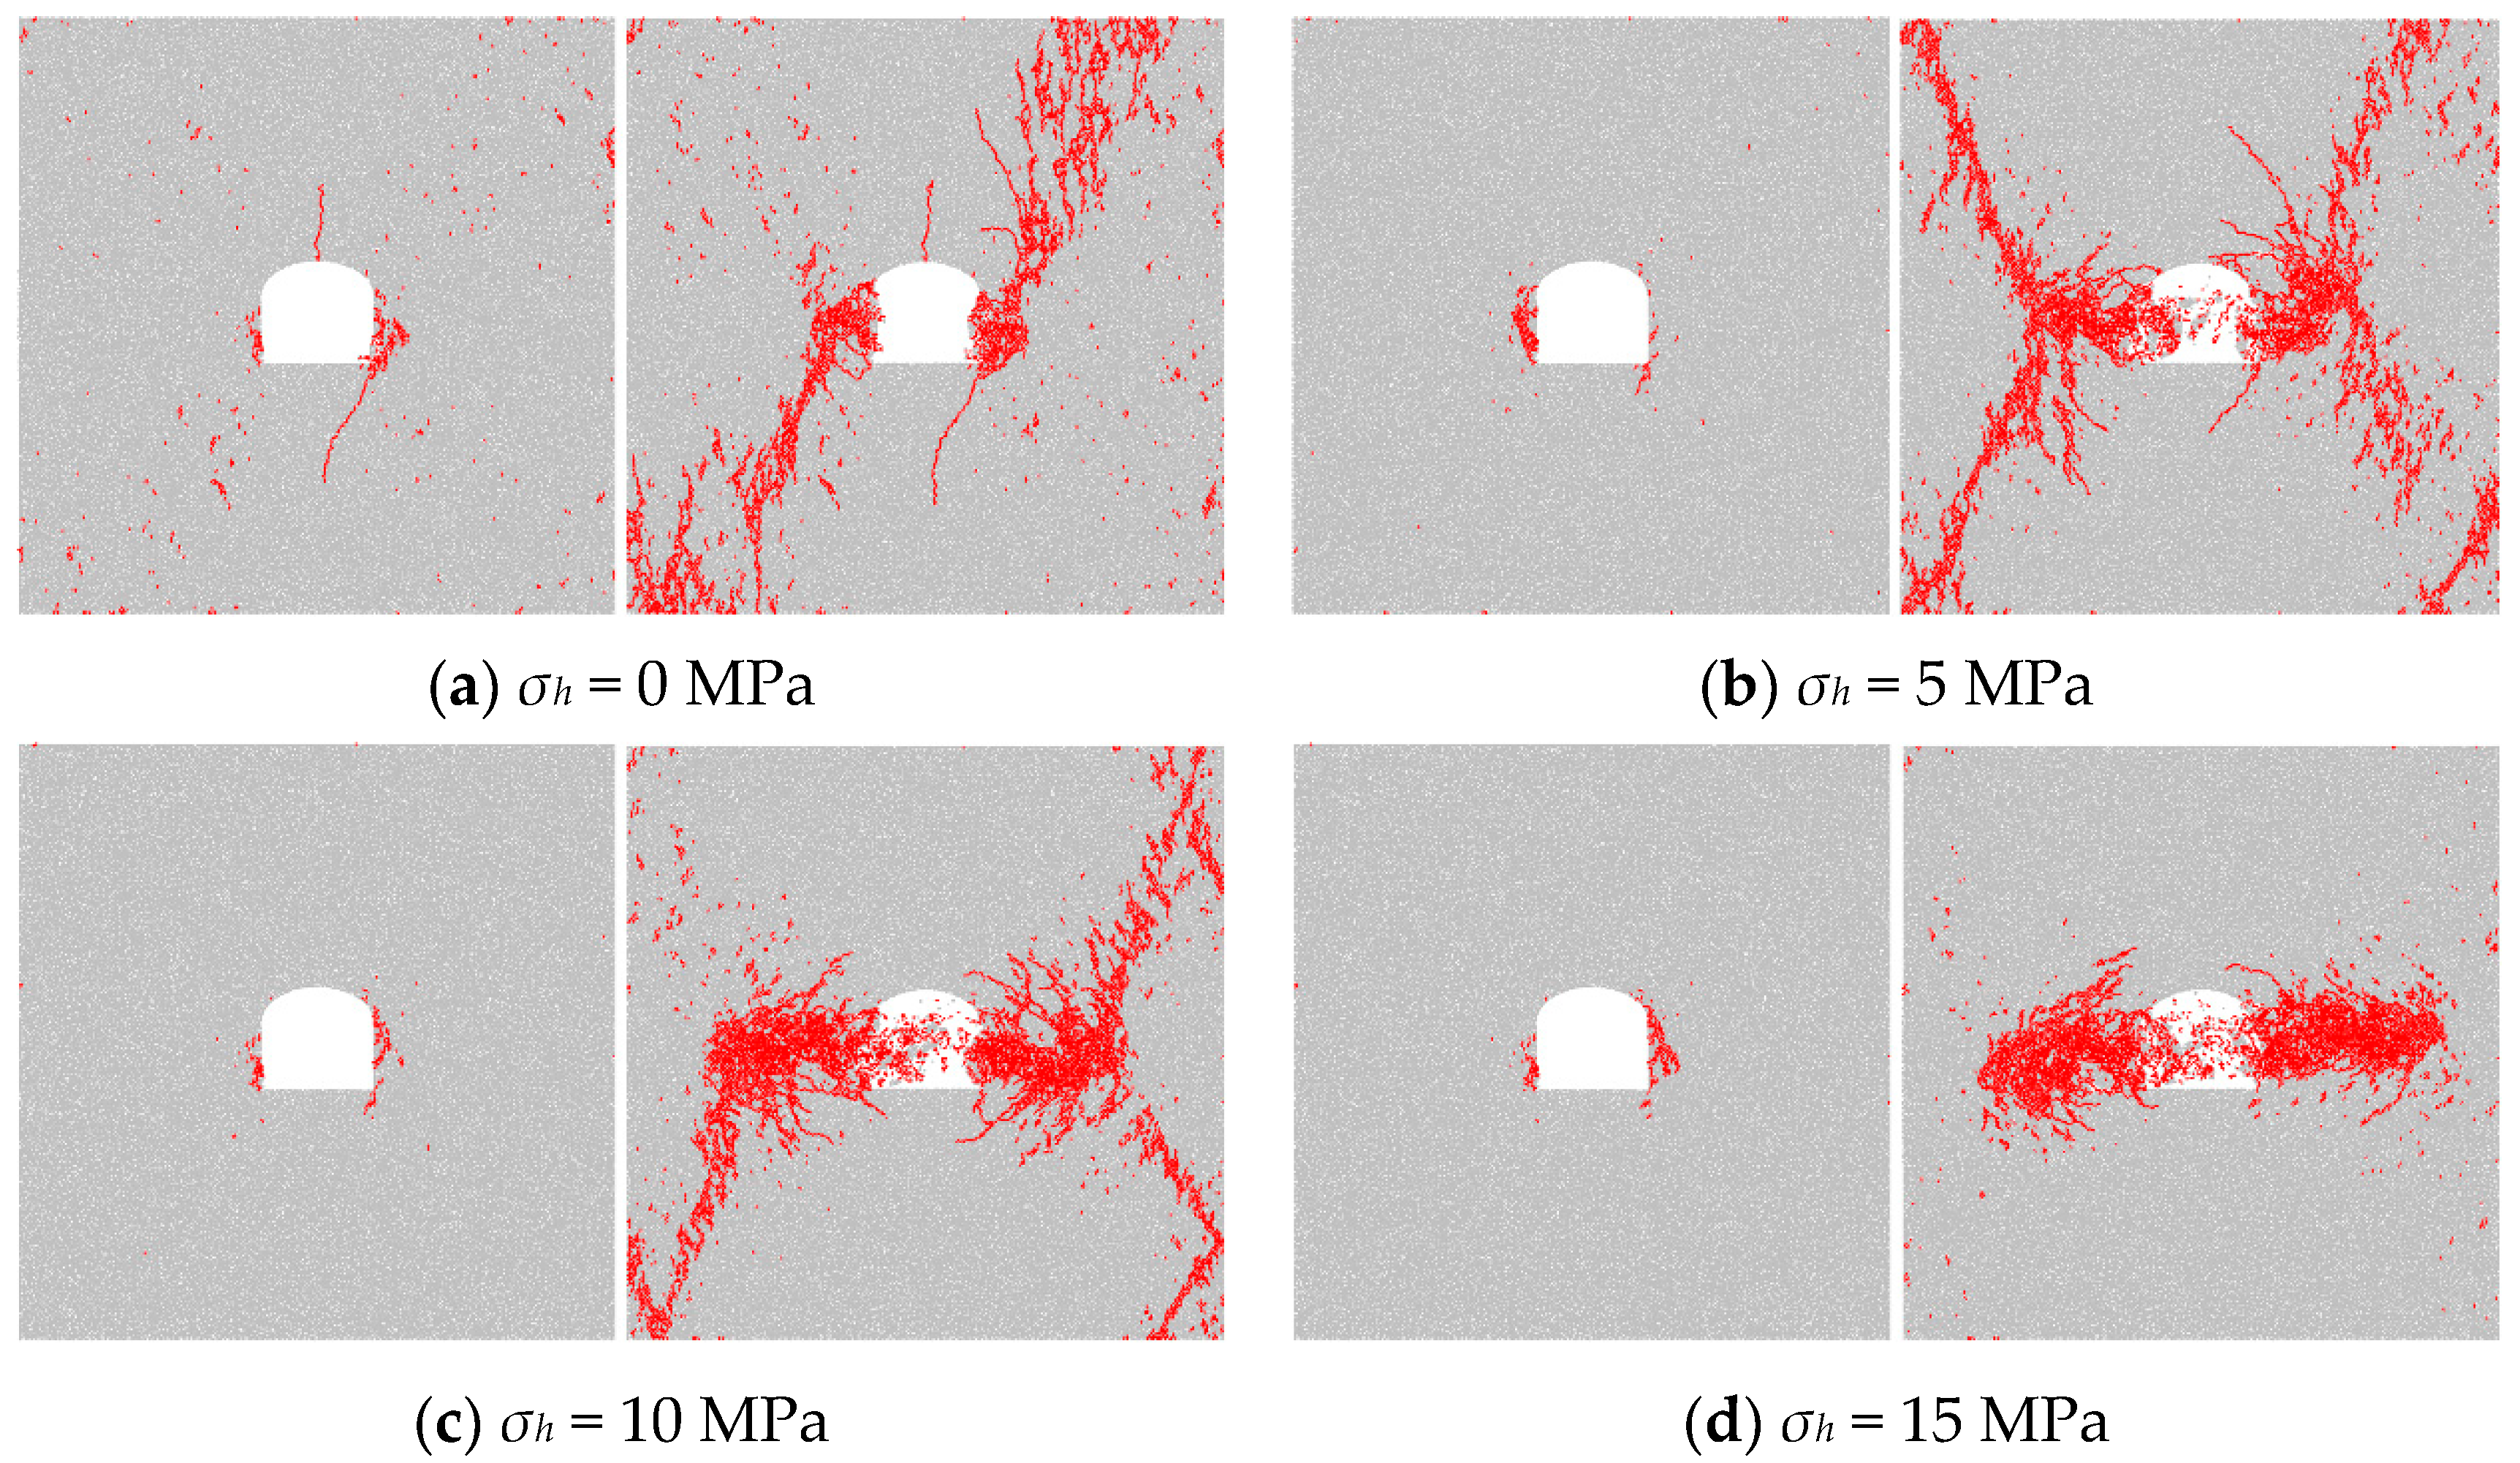
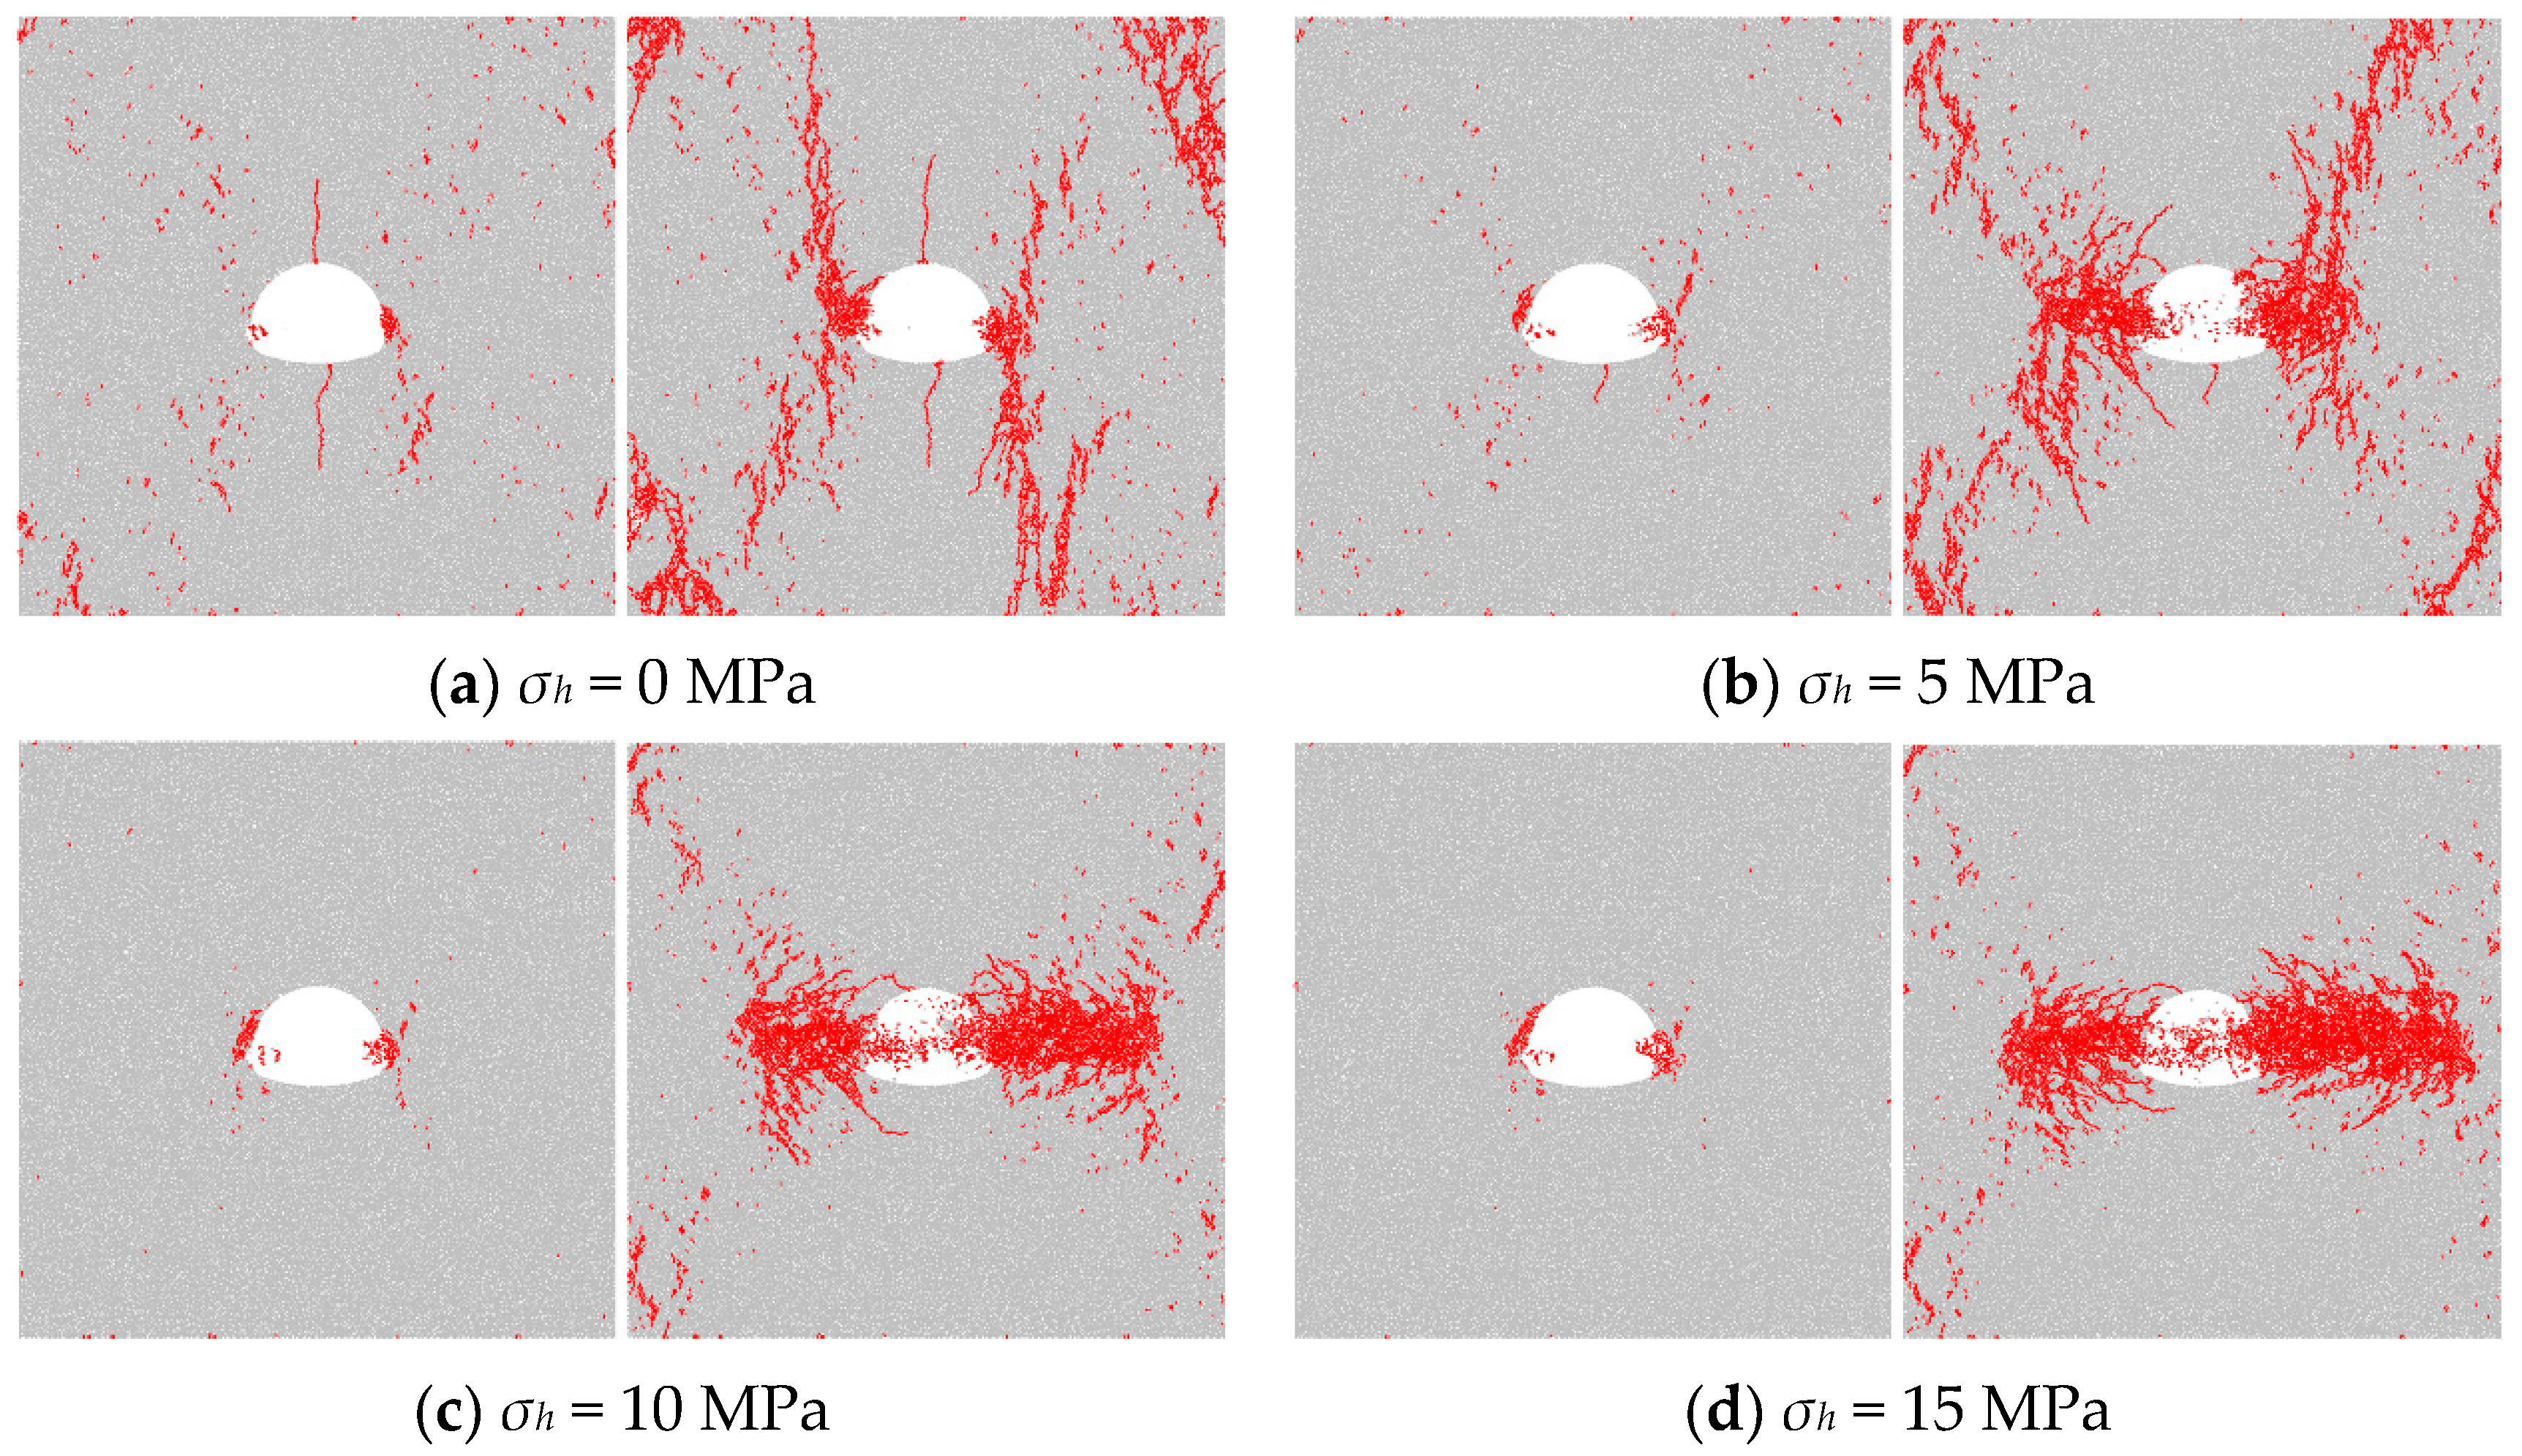
4.3. Failure Patterns

Figure 14 and Figure 15 present the failure patterns of specimens in some representative cases. The left part of each sub-figure plots the failure pattern of the specimen at the point of 95% peak axial stress in the pre-peak stage and the right part plots the failure pattern at the point of 70% peak axial stress in the post-peak stage, which is the end of the loading test. As revealed by Figure 12, specimens are mainly under elastic deformation in the pre-peak stage, therefore the failure that appears in this stage may tightly relate to the stress distribution determined by the analytical solution of the elastic plate containing the opening. For the specimen containing a single inverted U-shaped opening at the point of 95% peak axial stress in the pre-peak stage, failure concentrates the corners and the wall sides without confining stress. Meanwhile, a tensile crack parallel to the axial loading direction from the middle part of the roof, where the maximum tensile stress in the corresponding analytical stress solution, is observed. When there is confining stress, the characteristics of failure around the sidewalls and corners remains the same, but the tensile crack on the opening roof fails to appear anymore. It can be seen in all cases for the inverted U-shaped opening, failure forming a “V-shaped” wedge around the sidewalls, which are a compressive stress concentration area in corresponding cases. Similar failure patterns happened to the specimen containing a single arched opening in the pre-peak stage, where tensile cracks appear in the middle parts of the opening roof and floor under uniaxial compressive loading but do not appear under confining stress conditions.
Combining the analytical solution and numerical results shows that the failure patterns around openings in the pre-peak stage are in accord with stress distribution characteristics in the corresponding analytical cases. With the loading going on, the stress distribution continuously changes with more and more cracks appearing. In the post-peak stage, the specimens are broken with intensive failure, where the patterns are not only led by initial cracks during elastic deformation but also affected by the interaction between the specimen boundaries and the openings. For the specimen containing an inverted U-shaped opening under uniaxial loading, two shear cracks appeared in the failure area around the opening sidewalls and extends to the upper right corner and the lower left corner respectively, which forms a diagonal failure area connected with the opening. When the confining stress reached 5 MPa, the specimen was fractured by four shear cracks connecting the opening and the specimen corners. Then, the shear cracks seem were suppressed with the confining stress increasing to 10 MPa. When the confining stress was 15 MPa, no shear cracks connecting the opening and the specimen boundary appeared. The specimen instability is dominated by intensive failure around both sidewall because of strong compressive stress concentration. Similar response of failure patterns to confining stress are also happened to the specimen containing an arched opening.

5. Discussion

5.1. Generality of the Improved Triangle Interpolation Method for the Determination of Mapping Function

The accuracy of the mapping function depends on the iteration time and the number of Ck. The optimal iteration time can be determined when the error decrement is less than a given value, which is 1 × 10⁻⁶ in this study. Generally, the optimal number of Ck depends on the complexity of the opening. The mapping function for an opening with a more complex shape requires more terms of Ck for a satisfying accuracy, but this study reveals that the accuracy will gradually converge on a constant value with the increase in Ck number, showing an exponential decrease trend. As too many terms of Ck may increase the difficulty of following the calculations for analytical stress solution, the minimum number of Ck satisfying the desired is suggested according to the practical engineering requirements.
The triangle interpolation method has been proved to be an efficient method to calculate the mapping functions for openings with arbitrary shapes. In the previous study, the adjustment of mapping points during iterations was conducted by means of the boundary curve function of the opening. However, the boundary curve function may be inaccurate and difficult to be determined for openings with complex shapes. Alternatively, by sampling enough reference points uniformly at the boundary, the adjustment of mapping points can be realized easily without an accuracy loss caused by the boundary curve function.

5.2. Influence of Opening Shape and Confining Stress on the Mechanical Behaviour of Specimens

Based on the analytical and numerical results, it can be inferred that for openings under low confining stress conditions, initial failure may always appear on the roof in the form of tensile cracks. However, under high confining stress, the tensile concentration will be reduced and even disappear. Fracturing, deformation and rock burst around the sidewalls and corners, which are high compressive stress concentration areas, are more likely to appear than a disaster led by tensile failure on the opening roof. Accordingly, the stability of sidewalls and corners deserve more attention than that of roof. Based on the stress variation laws revealed by the analytical solution, however, it is logical that the stress around the sidewalls will convert into tensile stress and compressive stress concentration will form in the roof and floor of the opening when the lateral pressure coefficient reaches a certain level. In such a case, vulnerable areas and failure patterns around the opening may be quite different and corresponding solutions and analyses should be further carried out.
Compared with the inverted U-shaped opening, the analytical stress solution shows that the compressive stress concentration around the arched opening is much lower under the same far-field stress condition. The stress distribution around the arched opening is more uniform and the difference between the maximum hoop stress and the minimum hoop stress reduces with the increase in lateral pressure coefficient, which is opposite to that for the inverted U-shaped opening. Numerical results also show that the strength of specimens contacting an arched opening is higher than that of specimens containing an inverted U-shaped opening under all test conditions. These comparisons seem to indicate that opening sections with corners are not suggested for long-term rock engineering underground.

6. Conclusions

In this study, the stress solution for plates containing an opening was studied based on conformal mapping. The triangle interpolation method for the determination of mapping functions was discussed and improved. The stress distribution and failure patterns of rock mass containing an opening under different confining stress conditions were further analyzed with the combination of analytical stress solutions and numerical simulations. The main conclusions of this paper include:
(1)
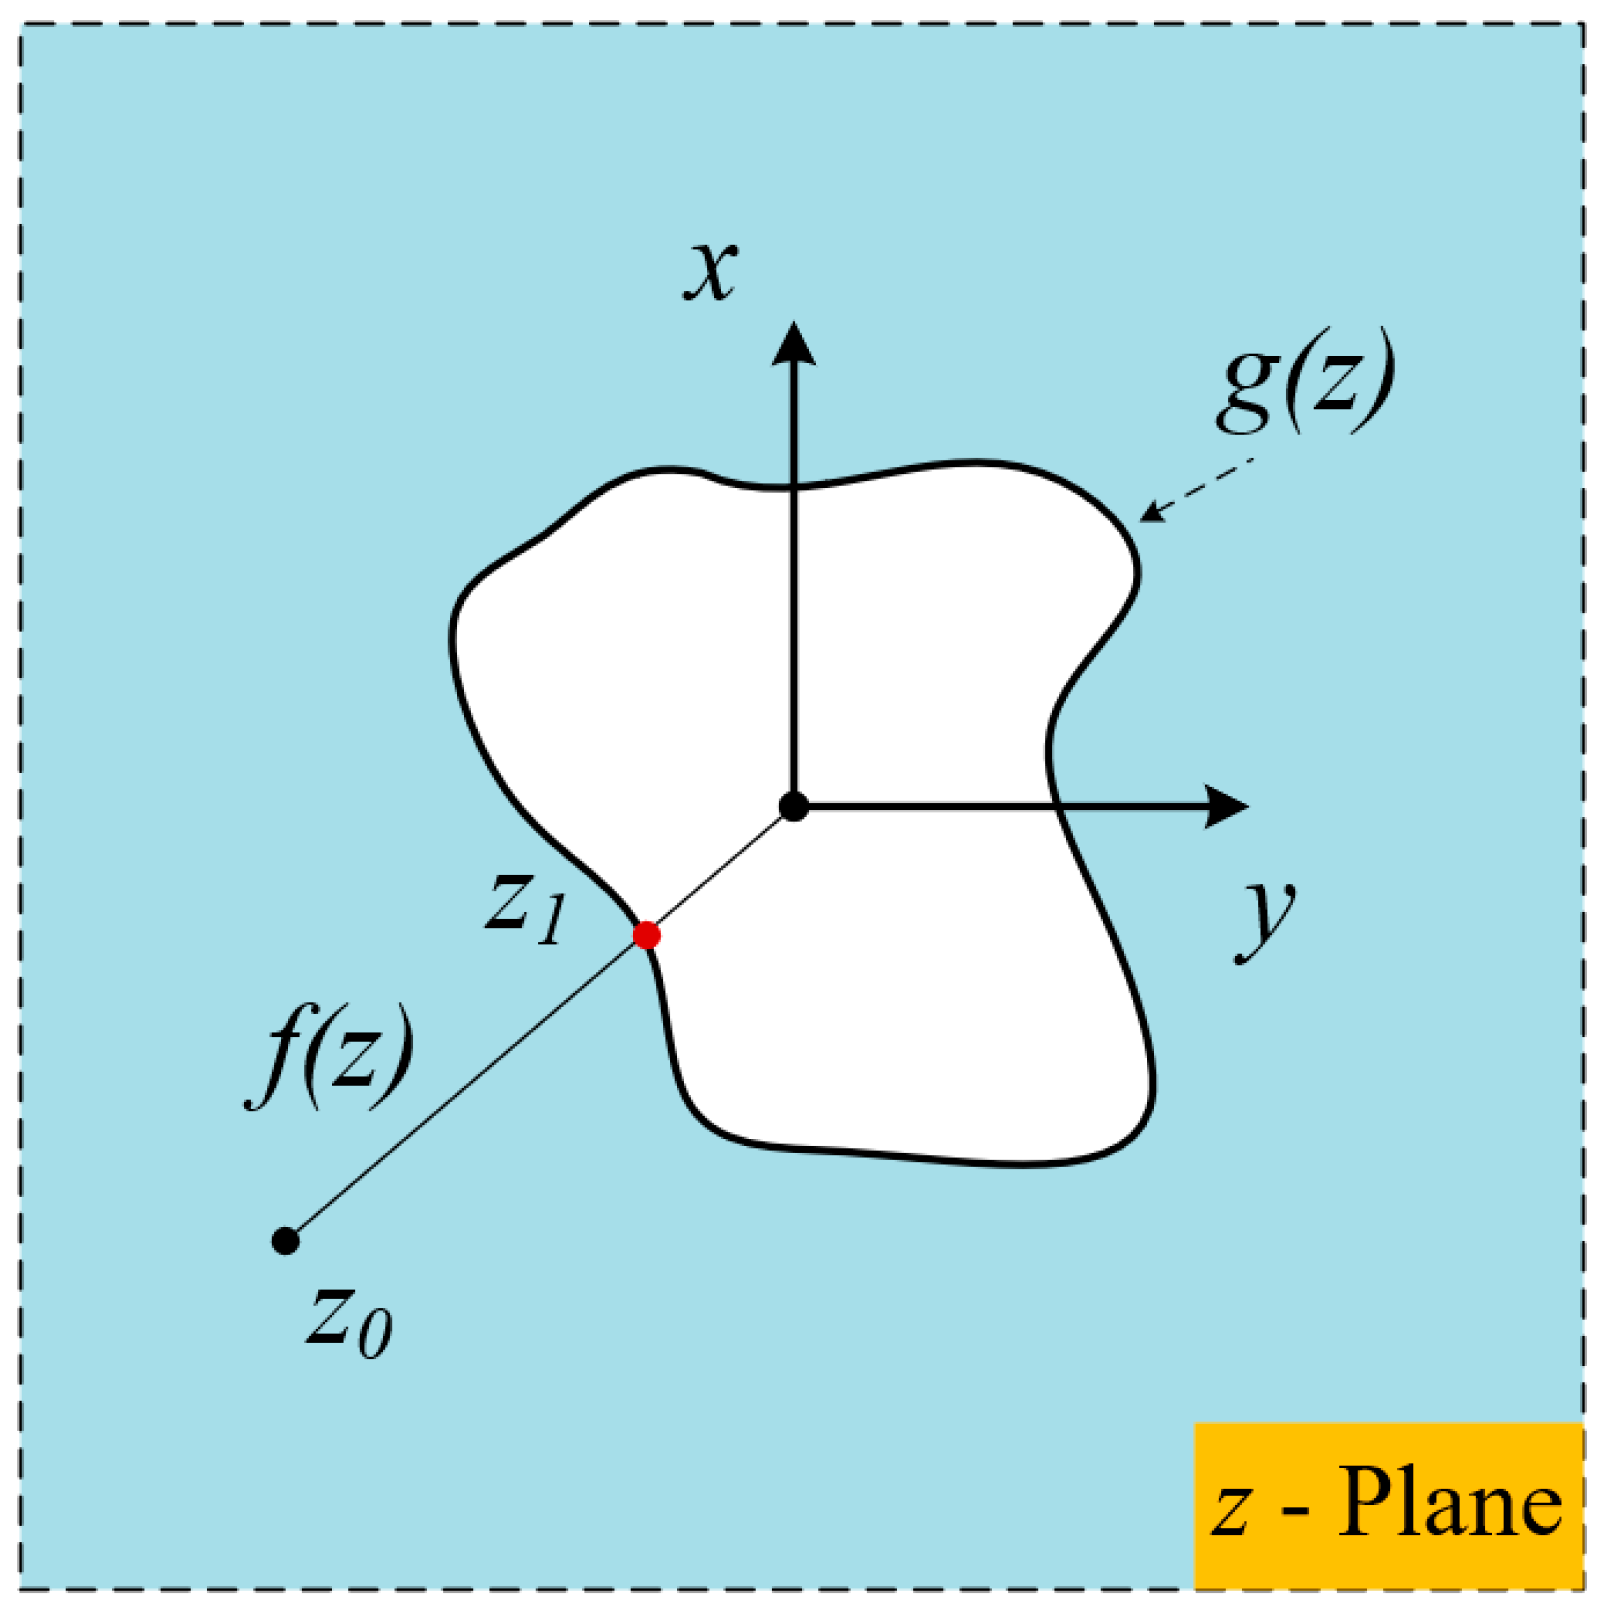
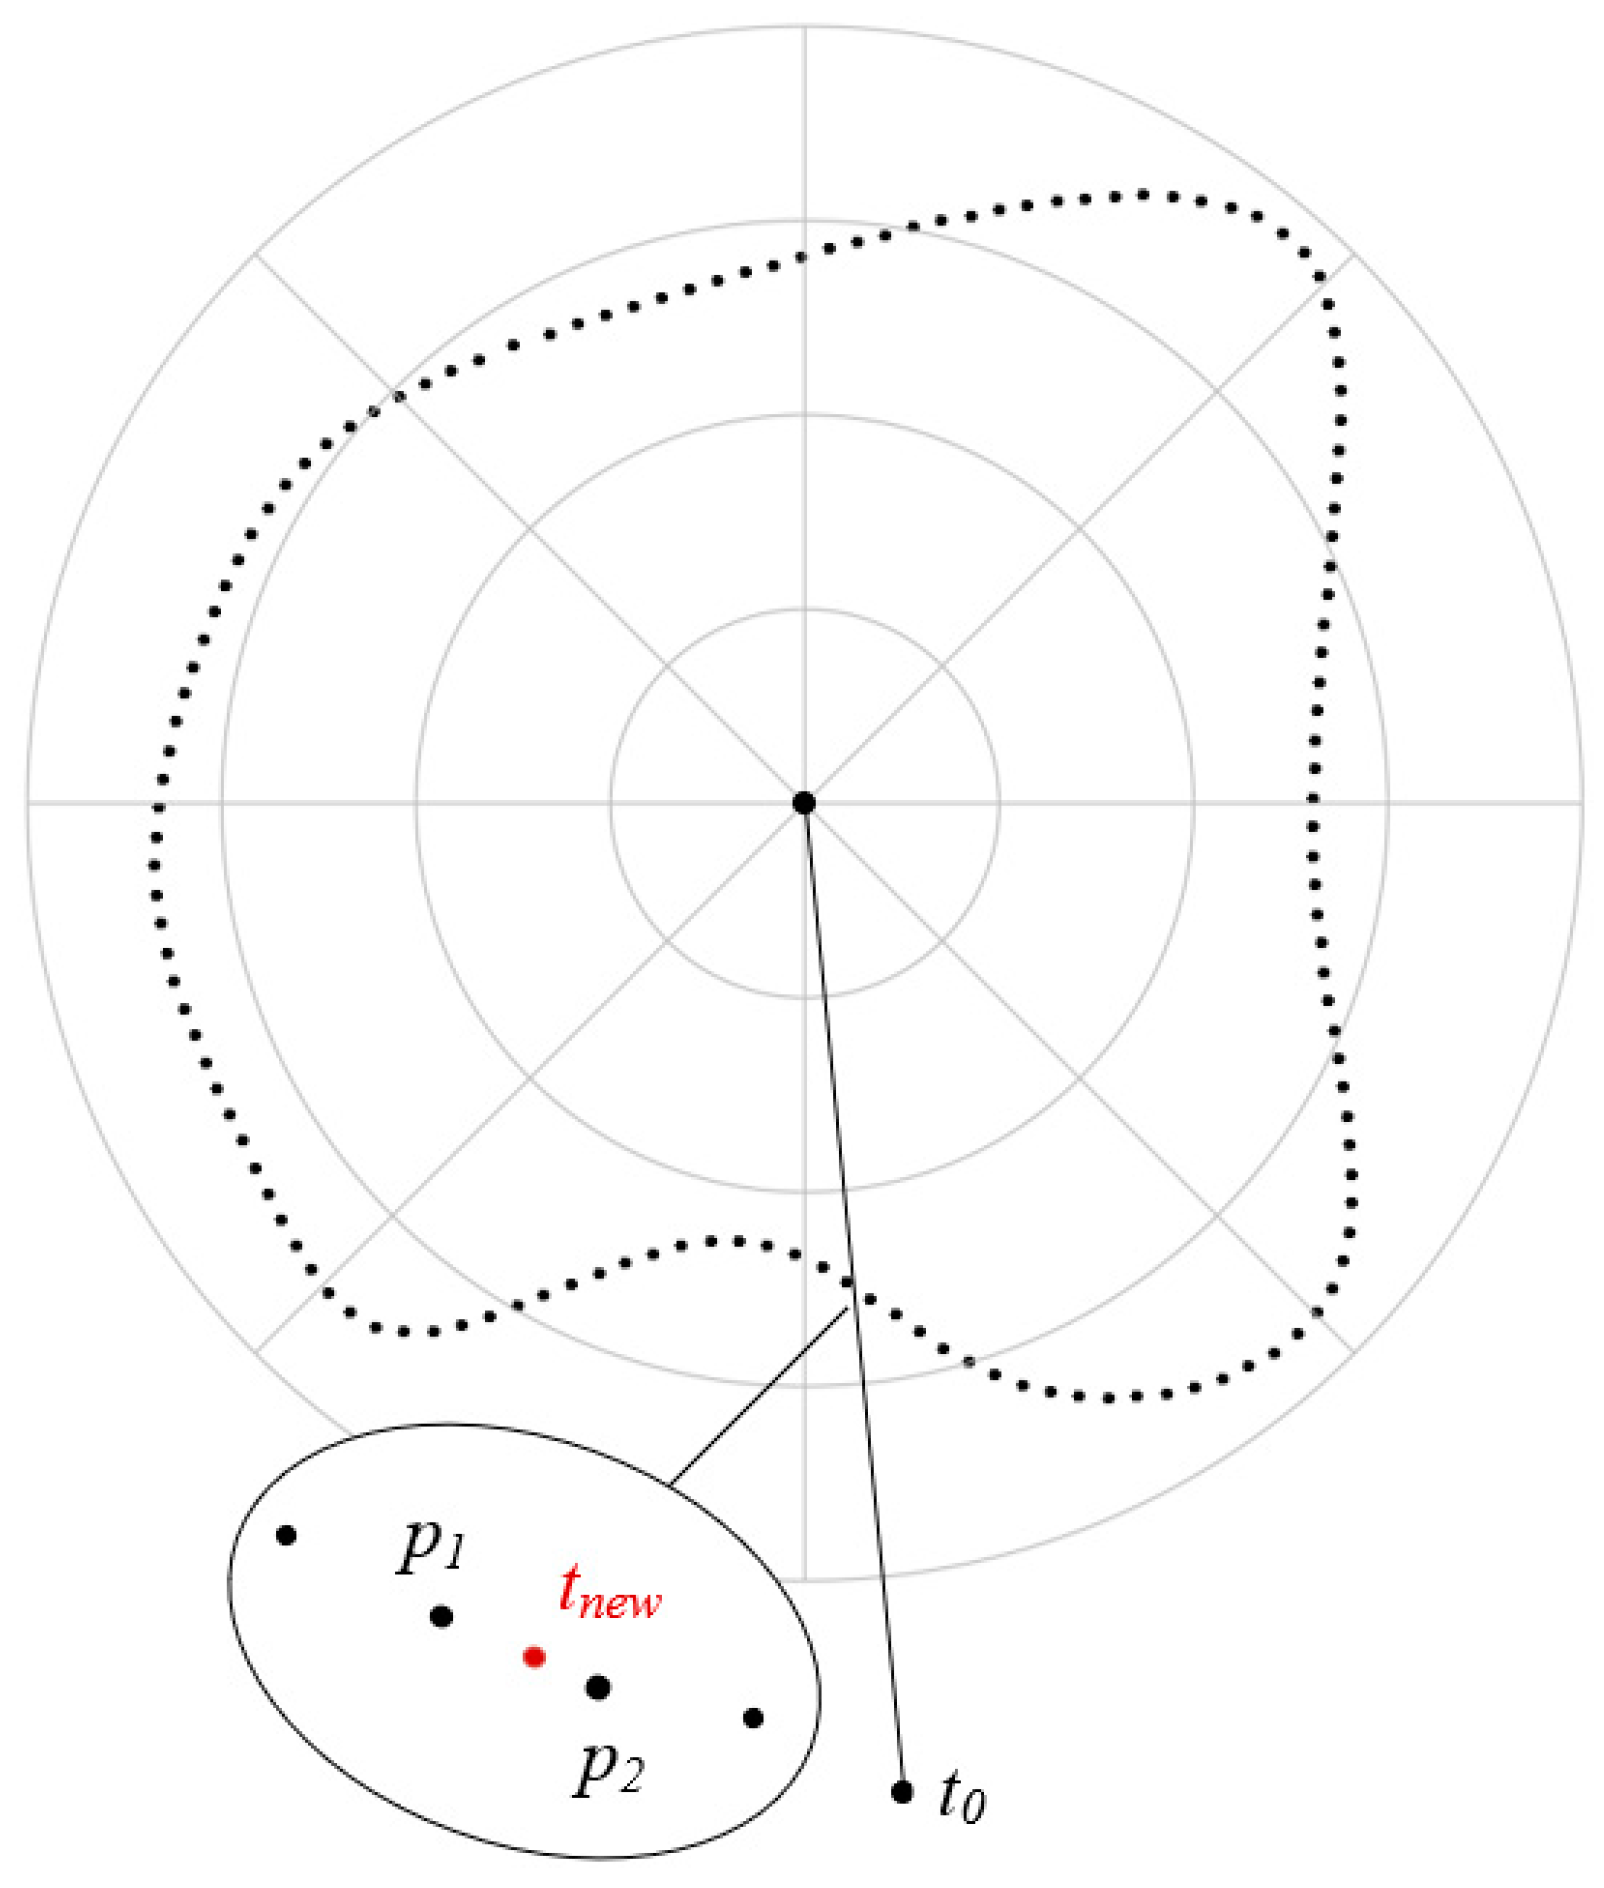
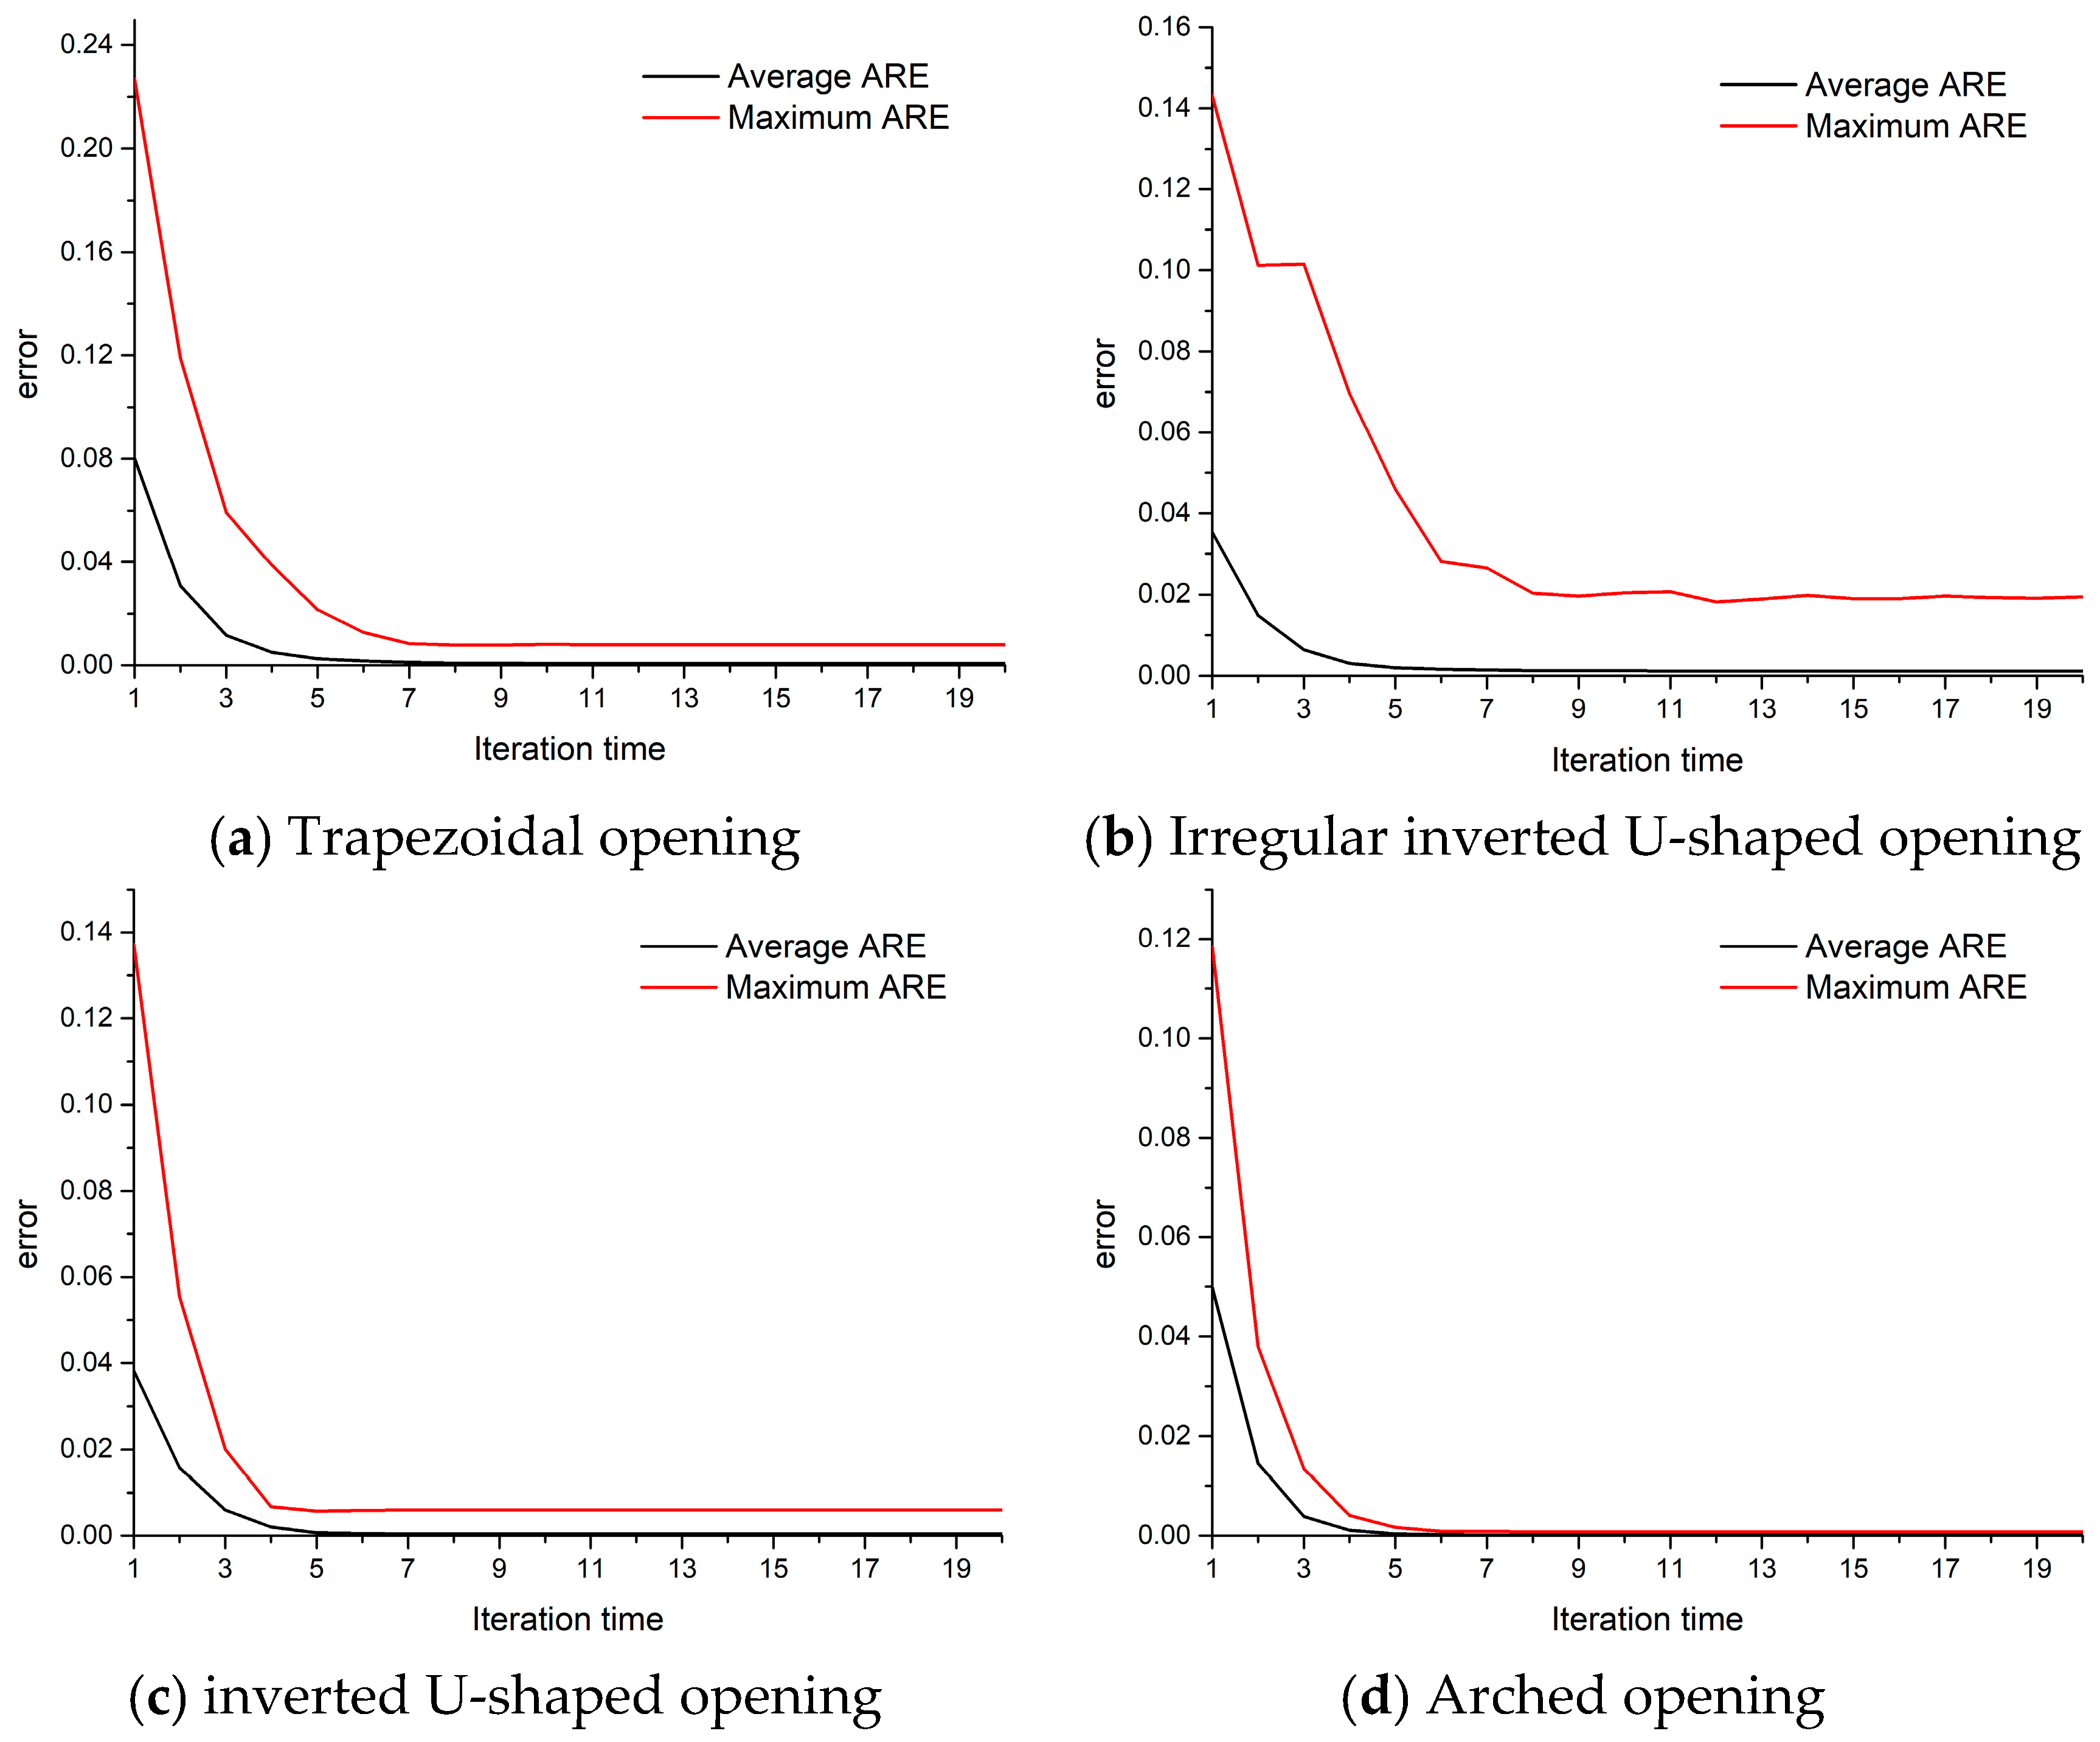
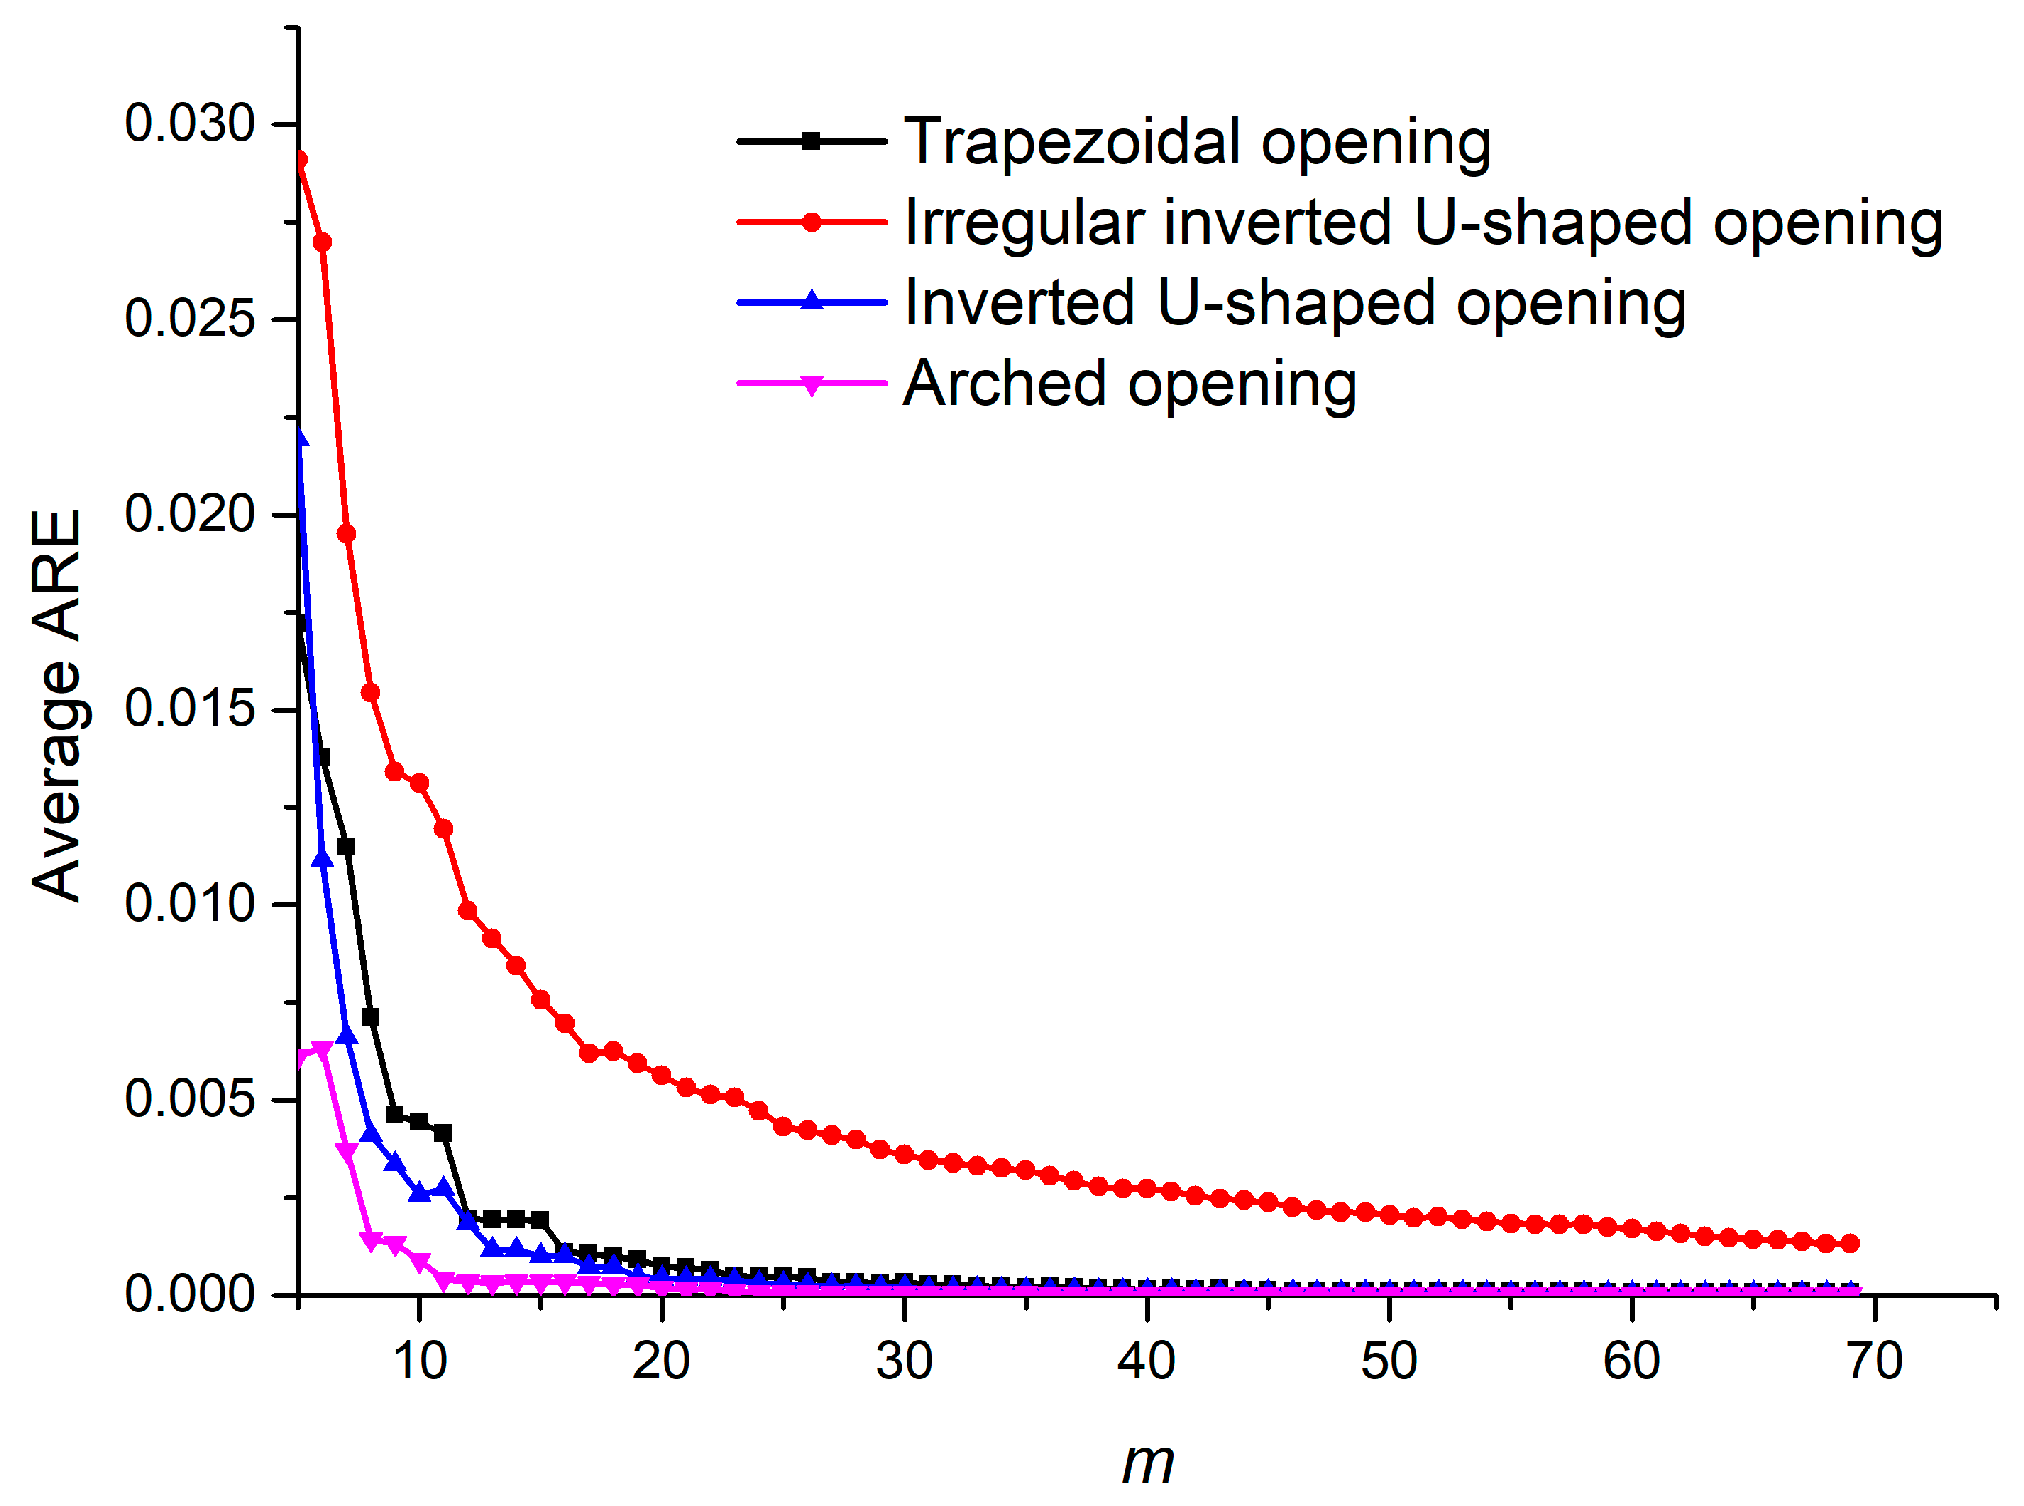
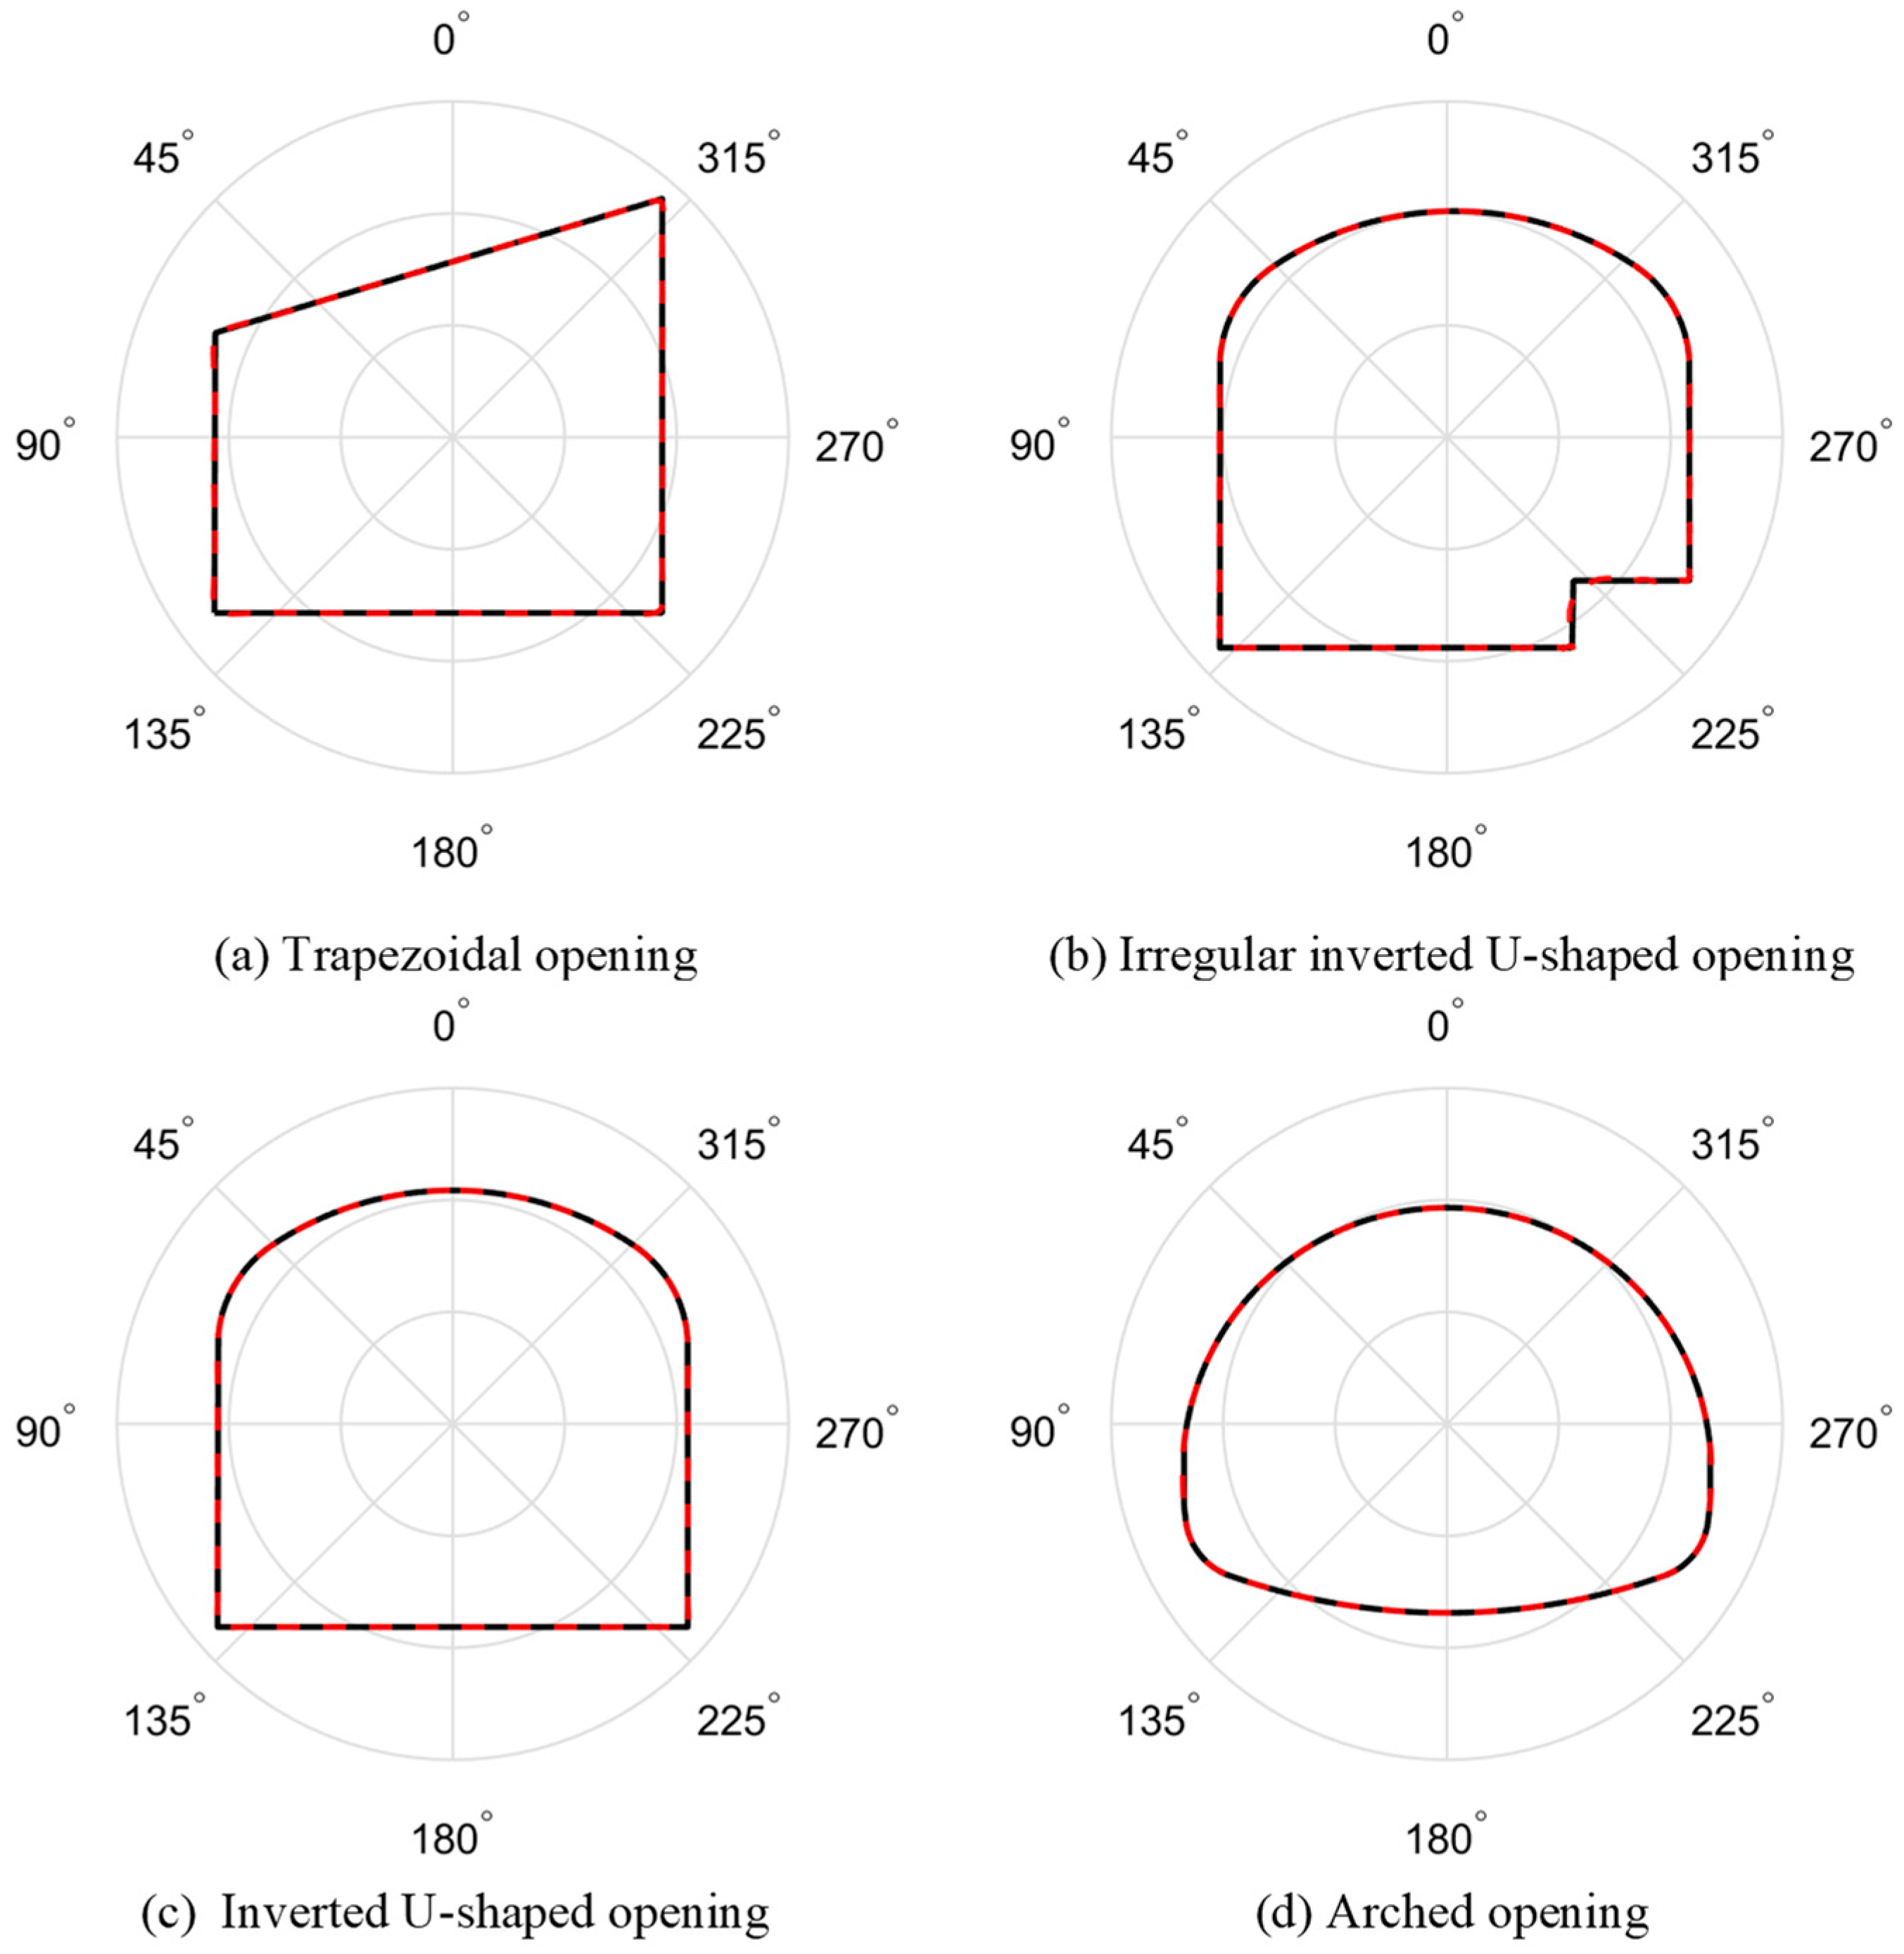
Mapping function is essential for the stress solution of rock mass around underground openings. By keeping even and odd interpolation points iterating each other repeatedly, the mapping function for a given opening can be effectively determined by the triangle interpolation method. The key point of this method is to move the calculated mapping points into the opening boundary during each iteration. Compared with boundary curve function, the method of sampling reference points at the boundary combined with linear interpolation is suggested for this adjustment as it is easy to conduct and promise high accuracy.
(2)
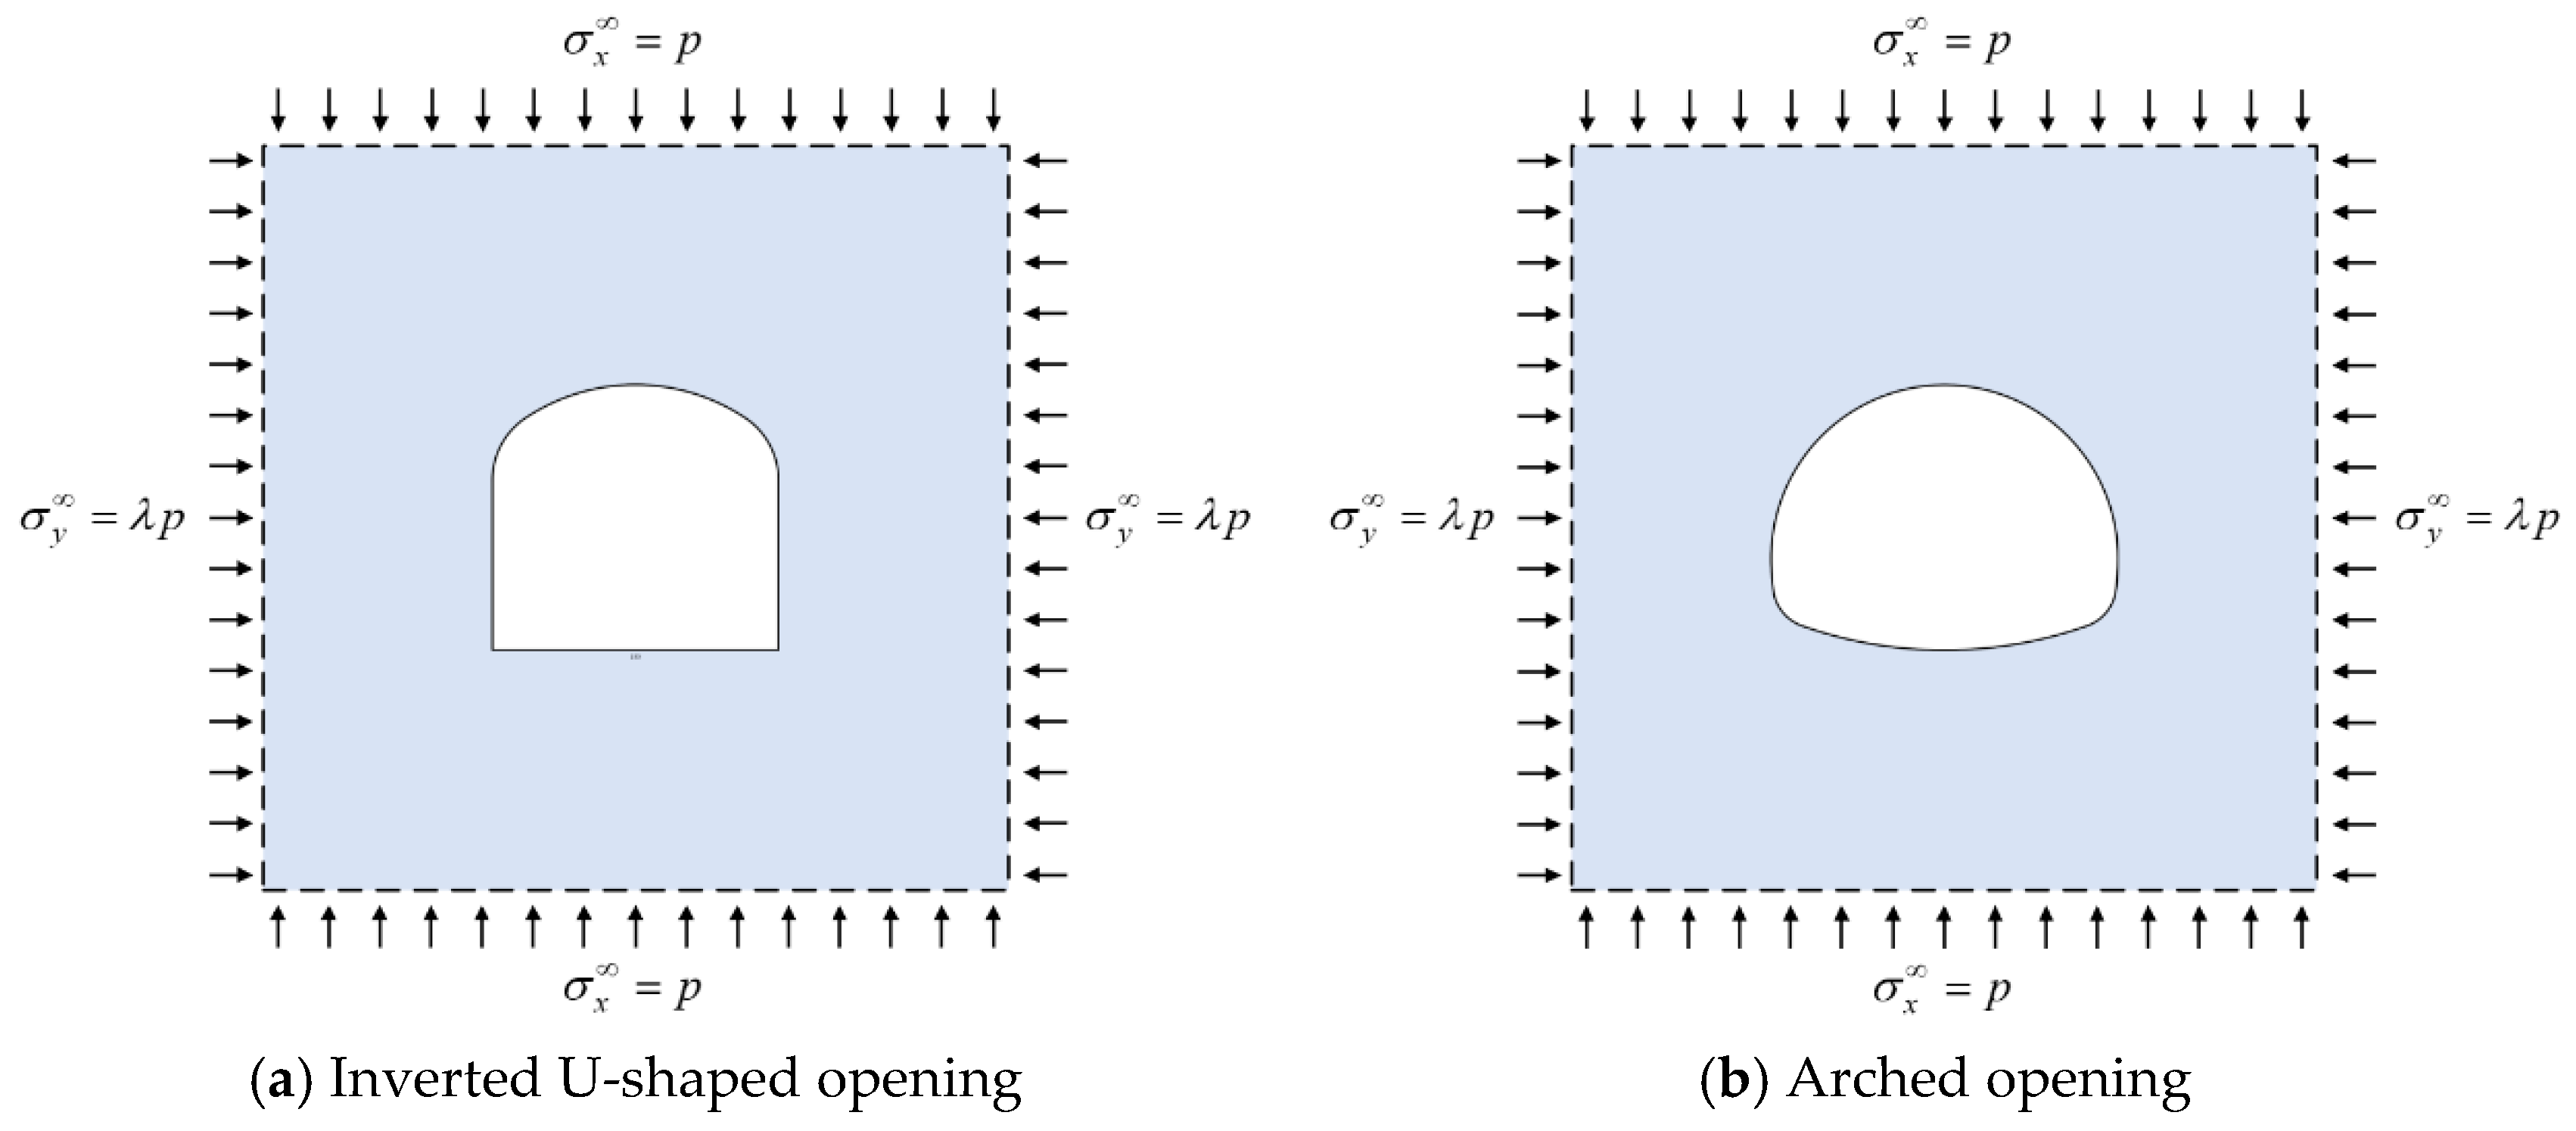
Stress distribution characteristics around the opening are significantly affected by the opening shape, which further affects the stability and failure pattern of the rock mass. The maximum hoop stress at the boundary of the inverted U-shaped opening is much higher than that at the boundary of the arched opening under the same far-field stress condition and shows a linear increasing trend with the increase in lateral pressure coefficient. However, the sensitivity of the maximum hoop stress of the later one to the lateral pressure coefficient is much less, remaining at a stable level despite of the varying lateral pressure coefficient.
(3)
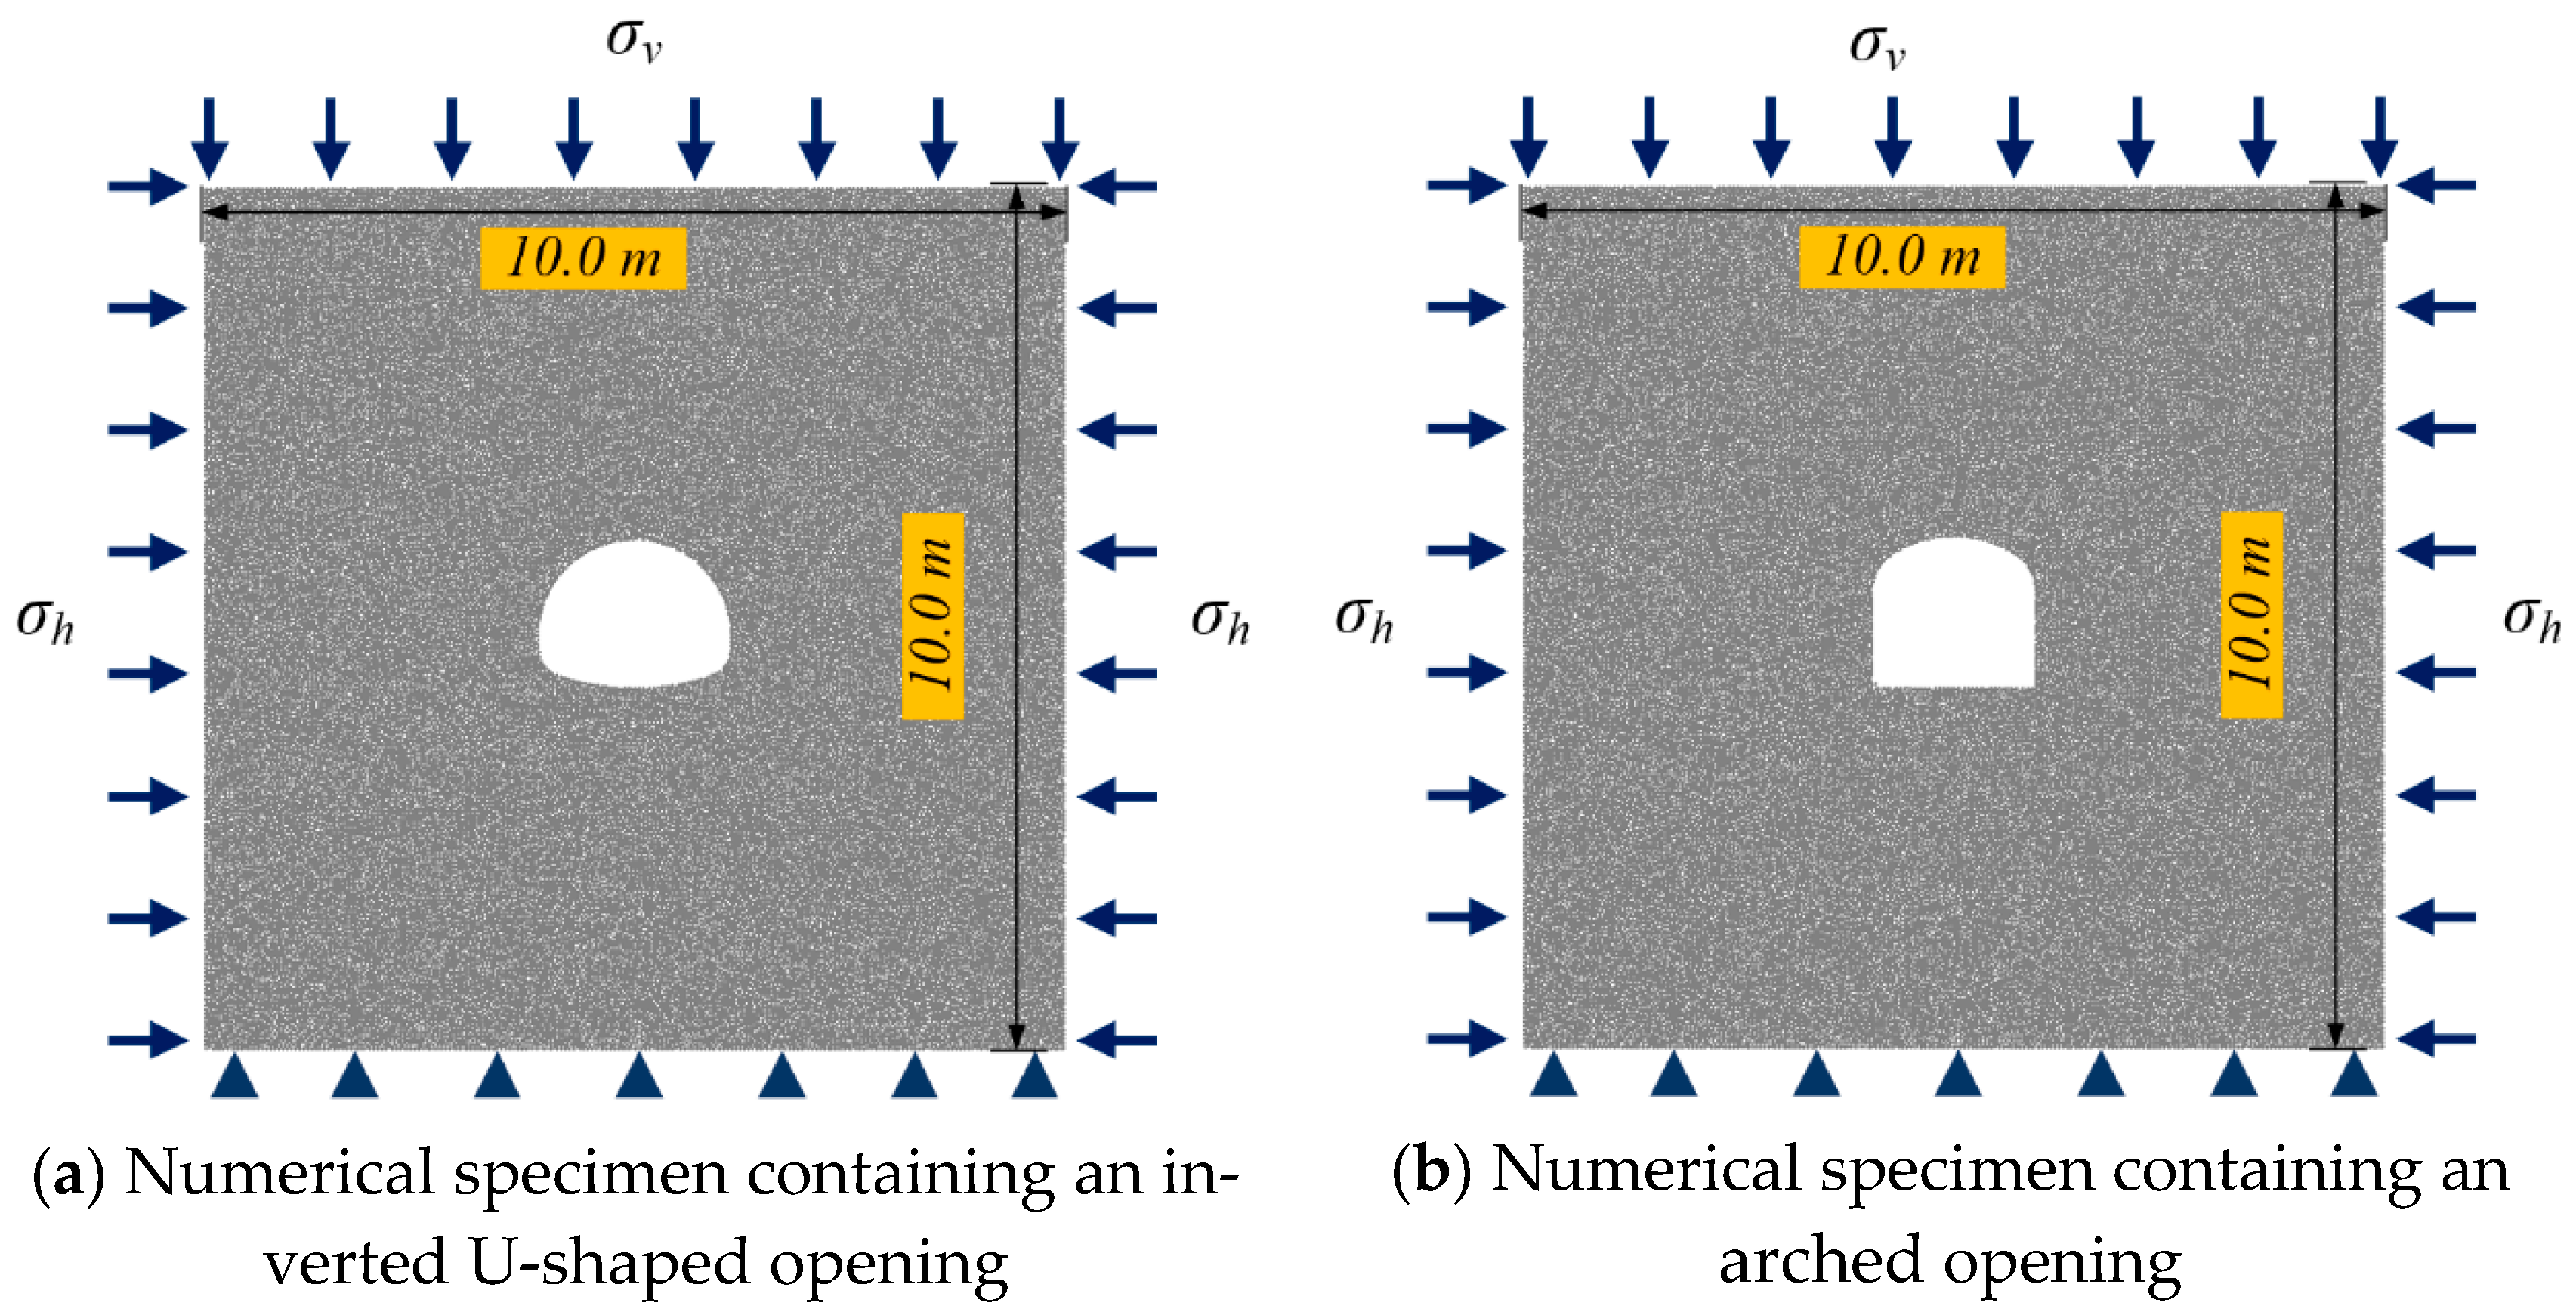
Combining the analytical stress solution and DEM numerical tests shows that the failure patterns of specimens in the pre-peak stage agree well with the analytical elastic stress solution. Under uniaxial stress conditions, initial failure is characterized by tensile cracks from the roof and floor of the openings, where there are tensile stress concentration areas, then failure from the sidewalls and corners caused by concentrated compressive stress is observed. Under biaxial stress conditions, the analytical stress solution reveals that tensile stress around the openings gradually decreases and finally coverts into compressive stress with the increase in the lateral pressure coefficient. Accordingly, the tensile failure is suppressed in the corresponding numerical cases.

Author Contributions

Conceptualization, methodology, software, writing—original draft preparation: L.T.; writing—review and editing, X.Y., G.W.; supervision, T.R., L.D.; funding acquisition, H.P., L.D. All authors have read and agreed to the published version of the manuscript.

Funding

This research is supported by financial grants from the National Natural Science Foundation of China (51934007, 51874292), Fundamental Research Funds for the Central Universities (2020QN44) and Research Foundation of Education Bureau of Hunan Province, China (19B479). The authors are very grateful to the financial contribution and convey their appreciation of the organization for supporting this basic research.

Data Availability Statement

Data sharing not applicable.

Conflicts of Interest

The authors declare no conflict of interest.

References

  1. Zhou, Z.; Cai, X.; Li, X.; Cao, W.; Du, X. Dynamic Response and Energy Evolution of Sandstone Under Coupled Static–Dynamic Compression: Insights from Experimental Study into Deep Rock Engineering Applications. Rock Mech. Rock Eng. 2020, 53, 1305–1331. [Google Scholar] [CrossRef]
  2. Cai, X.; Zhou, Z.; Zang, H.; Song, Z. Water saturation effects on dynamic behavior and microstructure damage of sandstone: Phenomena and mechanisms. Eng. Geol. 2020, 276, 105760. [Google Scholar] [CrossRef]
  3. Wang, S.-F.; Tang, Y.; Li, X.-B.; Du, K. Analyses and predictions of rock cuttabilities under different confining stresses and rock properties based on rock indentation tests by conical pick. Trans. Nonferr. Met. Soc. China 2021, 31, 1766–1783. [Google Scholar] [CrossRef]
  4. Wang, S.-F.; Tang, Y.; Wang, S.-Y. Influence of brittleness and confining stress on rock cuttability based on rock indentation tests. J. Cent. South. Univ. 2021, 1–15. [Google Scholar] [CrossRef]
  5. Song, Z.; Konietzky, H.; Cai, X. Modulus degradation of concrete exposed to compressive fatigue loading: Insights from lab testing. Struct. Eng. Mech. 2021, 78, 281–296. [Google Scholar]
  6. Tan, L.; Ren, T.; Yang, X.; He, X. A numerical simulation study on mechanical behaviour of coal with bedding planes under coupled static and dynamic load. Int. J. Min. Sci. Technol. 2018, 28, 791–797. [Google Scholar] [CrossRef]
  7. Cao, R.-H.; Yao, R.; Hu, T.; Wang, C.; Li, K.; Meng, J. Failure and mechanical behavior of transversely isotropic rock under compression-shear tests: Laboratory testing and numerical simulation. Eng. Fract. Mech. 2021, 241, 107389. [Google Scholar] [CrossRef]
  8. Cai, X.; Zhou, Z.; Du, X. Water-induced variations in dynamic behavior and failure characteristics of sandstone subjected to simulated geo-stress. Int. J. Rock Mech. Min. Sci. 2020, 130, 104339. [Google Scholar] [CrossRef]
  9. Zhou, Z.; Tan, L.; Cao, W.; Zhou, Z.; Cai, X. Fracture evolution and failure behaviour of marble specimens containing rectangular cavities under uniaxial loading. Eng. Fract. Mech. 2017, 184, 183–201. [Google Scholar] [CrossRef]
  10. Tan, L.; Ren, T.; Dou, L.; Cai, X.; Yang, X.; Zhou, Q. Dynamic response and fracture evolution of marble specimens containing rectangular cavities subjected to dynamic loading. Bull. Eng. Geol. Environ. 2021. [Google Scholar] [CrossRef]
  11. Wu, H.; Zhao, G.; Liang, W. Mechanical properties and fracture characteristics of pre-holed rocks subjected to uniaxial loading: A comparative analysis of five hole shapes. Theor. Appl. Fract. Mech. 2020, 105, 102433. [Google Scholar] [CrossRef]
  12. Wang, M.; Wan, W.; Zhao, Y. Experimental study on crack propagation and the coalescence of rock-like materials with two preexisting fissures under biaxial compression. Bull. Eng. Geol. Environ. 2020, 79, 3121–3144. [Google Scholar] [CrossRef]
  13. Zhou, K.; Dou, L.; Gong, S.; Li, J.; Zhang, J.; Cao, J. Study of Rock Burst Risk Evolution in Front of Deep Longwall Panel Based on Passive Seismic Velocity Tomography. Geofluids 2020, 2020, 8888413. [Google Scholar] [CrossRef]
  14. Ukadgaonker, V.; Awasare, P. A novel method of stress-analysis of an infinite-plate with rounded corners of a rectangular hole under uniform edge loading. Indian J. Eng. Mater. 1994, 1, 17–25. [Google Scholar]
  15. Ukadgaonker, V.; Awasare, P. A novel method of stress analysis of an infinite plate with elliptical hole with uniform loading at infinity. J. Inst. Eng. (India) 1993, 73, 309–311. [Google Scholar]
  16. Ukadgaonker, V.; Awasare, P. A novel method of stress-analysis of infinite-plate with circular hole with uniform loading at infinity. Indian J. Eng. Mater. Sci. 1994, 1, 17–25. [Google Scholar]
  17. Ukadgaonker, V.; Rao, D. Stress distribution around triangular holes in anisotropic plates. Compos. Struct. 1999, 45, 171–183. [Google Scholar] [CrossRef]
  18. Sharma, D.S. Stress distribution around circular/elliptical/triangular holes in infinite composite plate. Eng. Lett. 2012, 20, 1. [Google Scholar]
  19. Wu, H.; Ma, D. Fracture response and mechanisms of brittle rock with different numbers of openings under uniaxial loading. Geomech. Eng. 2021, 25, 481–493. [Google Scholar]
  20. Zhao, G.; Yang, S. Analytical solutions for rock stress around square tunnels using complex variable theory. Int. J. Rock Mech. Min. Sci. 2015, 80, 302–307. [Google Scholar] [CrossRef]
  21. Lu, A.-z.; Zhang, N.; Kuang, L. Analytic solutions of stress and displacement for a non-circular tunnel at great depth including support delay. Int. J. Rock Mech. Min. Sci. 2014, 70, 69–81. [Google Scholar] [CrossRef]
  22. Setiawan, N.B.; Zimmerman, R.W. A unified methodology for computing the stresses around an arbitrarily-shaped hole in isotropic or anisotropic materials. Int. J. Solids Struct. 2020, 199, 131–143. [Google Scholar] [CrossRef]
  23. Melentiev, P. Several New Methods and Devices for Approximate Computations; Nordhoff: Groningen, The Netherlands, 1953. [Google Scholar]
  24. Sharma, D.S. Stress distribution around polygonal holes. Int. J. Mech. Sci. 2012, 65, 115–124. [Google Scholar] [CrossRef]
  25. Balakrishnan, A.; Joines, W.T.; Wilson, T.G. Air-gap reluctance and inductance calculations for magnetic circuits using a Schwarz-Christoffel transformation. IEEE Trans. Power Electron. 1997, 12, 654–663. [Google Scholar] [CrossRef]
  26. Lv, A.Z.; Wang, Q.W. New Method of Determination for the Mapping Function of Tunnel with Arbitrary Boundary Using Optomozation Techniques. Chin. J. Rock Mech. Eng. 1995, 014, 269–274. [Google Scholar]
  27. Holland, J.H. Adaptation in Natural and Artificial Systems: An Introductory Analysis with Applications to Biology, Control, and Artificial Intelligence; The University of Michigan Press: Ann Arbor, MI, USA, 1975. [Google Scholar]
  28. Tan, L.; Ren, T.; Dou, L.; Yang, X.; Qiao, M.; Peng, H. Analytical stress solution and mechanical properties for rock mass containing a hole with complex shape. Theor. Appl. Fract. Mech. 2021, 114, 103002. [Google Scholar] [CrossRef]
  29. Tan, L.; Ren, T.; Dou, L.; Yang, X.; Cai, X.; Qiao, M. Analytical stress solution for rock mass containing two holes based on an improved Schwarz alternating method. Theor. Appl. Fract. Mech. 2021, 116, 103092. [Google Scholar] [CrossRef]
  30. Zhu, J.H.; Yang, J.H.; Shi, G.P.; Wang, J.; Cai, J.P. Calculating method on the conformal mapping from the exterior of unit circle to the exterior of cavern with the arbitrary excavation cross section. Rock Soil Mech. 2014, 35, 175–183. [Google Scholar]
  31. Wu, H.; Kulatilake, P.H.S.W.; Zhao, G.; Liang, W.; Wang, E. A comprehensive study of fracture evolution of brittle rock containing an inverted U-shaped cavity under uniaxial compression. Comput. Geotech. 2019, 116, 103219. [Google Scholar] [CrossRef]
  32. Itasca, C. PFC (particle flow code in 2 and 3 dimensions), version 5.0 [User’s manual]. Numer. Anal. Methods Geomech. 2014, 32, 189–213. [Google Scholar]
  33. Wu, N.; Liang, Z.; Zhou, J.; Zhang, L. Energy evolution characteristics of coal specimens with preformed holes under uniaxial compression. Geomech. Eng. 2020, 20, 55–66. [Google Scholar]
  34. Vahab, S.; Tabaroei, A. Numerical simulation of the influence of interaction between Qanat and tunnel on the ground settlement. Geomech. Eng. 2020, 23, 455–466. [Google Scholar] [CrossRef]
  35. Fan, H.; Sun, S.; Wei, J.; Le, H.; Zhu, F.; Wang, W.; Liu, Y.; Wang, J. Shear Behavior of Soil–Rock Mixture Composed of Diorite-Porphyrite Considering Weathering Sequence. Int. J. Geomech. 2021, 21, 04021122. [Google Scholar] [CrossRef]
Figure 1. Schematic diagram of an opening in an infinite elastic plate.
Mathematics 09 02462 g001
Figure 2. Schematic diagram of reference points at the opening boundary.
Mathematics 09 02462 g002
Figure 3. Four openings with typical shapes.
Mathematics 09 02462 g003aMathematics 09 02462 g003b
Figure 4. The curves of average ARE and maximum ARE versus iteration time.
Mathematics 09 02462 g004
Figure 5. The relation curves between average ARE and m.
Mathematics 09 02462 g005
Figure 6. The relation curves between iteration time and m.
Mathematics 09 02462 g006
Figure 7. Comparisons between the mapping shape and original shape for different openings (black line indicates the original shape and red line indicates the mapping shape).
Mathematics 09 02462 g007
Figure 8. Schematic diagram of a plate containing an opening under far-field stress condition.
Mathematics 09 02462 g008
Figure 9. Analytical solution of hoop stress around openings with different λ.
Mathematics 09 02462 g009
Figure 10. Curves of σθ,max, σθ,min and (σθ,maxσθ,min) versus λ.
Mathematics 09 02462 g010
Figure 11. Numerical modelling of rock specimens containing an opening.
Mathematics 09 02462 g011
Figure 12. Axial stress-strain curves for specimens with different openings.
Mathematics 09 02462 g012
Figure 13. Peak axial stress of numerical specimens under different confining stress conditions.
Mathematics 09 02462 g013
Figure 14. Failure patterns of numerical specimens containing an inverted U-shaped opening.
Mathematics 09 02462 g014
Figure 15. Failure patterns of numerical specimens containing an arched opening.
Mathematics 09 02462 g015
Table 1. Mapping function parameters of plates with different openings.
Trapezoidal OpeningInverted U-Shaped OpeningArched Opening
kAkBkCkCk
12.108 −0.016 2.252 5.689
20.022 −0.027 −0.061 −0.071
3−0.190 −0.233 −0.105 −0.760
40.054 −0.209 0.147 0.421
5−0.295 −0.102 −0.237 −0.152
60.026 −0.035 0.073 −0.003
70.022 0.009 0.032 0.049
8−0.016 0.026 −0.022 −0.033
90.017 0.014 0.013 0.004
10−0.007 0.003 −0.008 0.009
11−0.004 −0.005 −0.003 −0.007
120.010 −0.007 0.008 0.001
13−0.001 −0.001 −0.006 0.000
140.001 0.001 −0.001 0.001
150.000 0.001 0.002 0.000
16−0.005 0.001 −0.002 −0.002
170.000 −0.001 0.003 0.003
180.001 0.000 0.000−0.001
190.000 0.001 −0.002 −0.001
200.002 0.000 0.001 0.002
Publisher’s Note: MDPI stays neutral with regard to jurisdictional claims in published maps and institutional affiliations.

