
An Efficient Chameleon Swarm Algorithm for Economic Load Dispatch Problem
by
 , , , and
Mokhtar Said
1,* ,
,
Ali M. El-Rifaie
2,* ,
,
Mohamed A. Tolba
3,4,
Essam H. Houssein
5 and
and
Sanchari Deb
6 1
Electrical Engineering Department, Faculty of Engineering, Fayoum University, Fayoum 43518, Egypt
2
College of Engineering and Technology, American University of the Middle East, Egaila 54200, Kuwait
3
Nuclear Research Center, Reactors Department, Egyptian Atomic Energy Authority, Cairo 11787, Egypt
4
Electrical Power Systems Department, Moscow Power Engineering Institute, 111250 Moscow, Russia
5
Faculty of Computers and Information, Minia University, Minia 61519, Egypt
6
VTT Technical Research Centre of Finland Ltd., 02044 Espoo, Finland
*
Authors to whom correspondence should be addressed.
Mathematics 2021, 9(21), 2770; https://doi.org/10.3390/math9212770
Submission received: 10 October 2021
/
Revised: 24 October 2021
/
Accepted: 25 October 2021
/
Published: 1 November 2021
(This article belongs to the Topic Power System Modeling and Control)
Abstract
:Economic Load Dispatch (ELD) is a complicated and demanding problem for power engineers. ELD relates to the minimization of the economic cost of production, thereby allocating the produced power by each unit in the most possible economic manner. In recent years, emphasis has been laid on minimization of emissions, in addition to cost, resulting in the Combined Economic and Emission Dispatch (CEED) problem. The solutions of the ELD and CEED problems are mostly dominated by metaheuristics. The performance of the Chameleon Swarm Algorithm (CSA) for solving the ELD problem was tested in this work. CSA mimics the hunting and food searching mechanism of chameleons. This algorithm takes into account the dynamics of food hunting of the chameleon on trees, deserts, and near swamps. The performance of the aforementioned algorithm was compared with a number of advanced algorithms in solving the ELD and CEED problems, such as Sine Cosine Algorithm (SCA), Grey Wolf Optimization (GWO), and Earth Worm Algorithm (EWA). The simulated results established the efficacy of the proposed CSA algorithm. The power mismatch factor is the main item in ELD problems. The best value of this factor must tend to nearly zero. The CSA algorithm achieves the best power mismatch values of , and for demand loads of 700, 1000, and 1200 MW, respectively, of the ELD problem. The CSA algorithm achieves the best power mismatch values of , for demand loads of 700, 1000, and 1200 MW, respectively, of the CEED problem. Thus, the CSA algorithm was found to be superior to the algorithms compared in this work.
1. Introduction
The problem of economically allocating the power production of each generating unit and minimizing the emissions of these units is an ongoing challenge for engineers. This has led to the development of the Economic Load Dispatch (ELD) and Combined Economic and Emission Dispatch (CEED) problems. ELD and CEED are among the most complex power system optimization problems. The solution methodology of these complex problems is mostly dependent on metaheuristics [1]. In [2], Gradient-Based Optimizer (GBO) was used for solving ELD, with and without the valve point effect, in addition to CEED. In [3], the authors used a modified version of the Class Topper Optimizer (CTO) algorithm for solving different variants of ELD. In [4], the Turbulent Flow of Water Optimization (TFWO) algorithm was used for solving ELD and CEED. In [5], a hybrid algorithm comprising the Firefly Algorithm (FA) and Bat Algorithm (BA) was used for solving variants of the ELD problem. Simulation results showed that the hybrid algorithm performed better than the standalone algorithms. However, the computational cost of the hybrid algorithm is greater than that of the standalone algorithms. In [6], a memory-based Gravitational Search Algorithm (GSA) was used for solving the ELD problem in a micro-grid environment having renewable generation. In [7], authors used Moth Flame Optimization (MFO) for solving the ELD problem considering the valve point effect, wind power, and the load transit conditions. In [8], a novel algorithm considering amalgamation of quantum theory, the Gravitational Search Algorithm (GSA), and Particle Swarm Optimization (PSO) was used for solving the ELD of a power system having photovoltaic generation. When integrated into the algorithm, the quantum theory concepts enhanced the capability. This is due to the fact that, in quantum space, the movement of particles is not restricted and the optimal solution can be found with an even smaller population. In [9], authors proposed the Firefly Algorithm (FA) with a non-homogeneous population for solving different variants of the ELD problem. In [10], the authors proposed an improved version of the Firefly Algorithm (FA) for solving the reserve constrained dynamic ELD problem in multi-area power systems. In [11], a quantum-inspired Bat Algorithm (BA) was used for solving the ELD problem with the valve point effect. In [12], the authors used a Pareto-based PSO for solving CEED. In [13], the authors modelled the ELD problem in the presence of Electric Vehicles (EVs) as a storage medium and solved the problem by reinforcement learning. In [14], authors proposed a novel island-based Harmony Search (HS) algorithm for solving the non-convex ELD problem. In [15], authors proposed an improved directional Bat Algorithm (BA) for solving different variants of the ELD problem. In [16], authors used a modified version of the Krill Herd (MKH) algorithm for solving an ELD problem including nonlinear characteristics of generators. It was observed that the MKH performed relatively well compared to other metaheuristics and that tuning of parameters was also very easy in MKH. In [17], an improved version of symbiosis PSO was proposed for solving the ELD problem. In [18], the authors proposed an improved version of Teaching Learning Based Optimization (TLBO) for solving dynamic ELD considering wind resources and load demand uncertainty. In [19], the authors proposed an evolutionary adaptive Hooke Jeeves algorithm for solving ELD considering the valve point effect. A hybrid algorithm considering amalgamation of PSO with DE was proposed for solving ELD with and without the valve point effect in [20]. In [21], authors applied Ant Colony Optimization (ACO) for solving ELD in the case of an IEEE 26 bus test system considering the valve point effect. In [22], authors applied oscillatory PSO for solving ELD with multiple fuel options. A hybrid GA and fish swarm algorithm was used for solving ELD with multiple fuel and valve point effects in [23]. It was observed that the hybrid algorithm performed better than the standalone algorithms when applied to the ELD problem.
From references [2,3,4,5,6,7,8,9,10,11,12,13,14,15,16,17,18,19,20,21,22,23], it can be concluded that researchers have used a number of metaheuristics, such as BA, FA, PSO, CTO, GSA, and MFO, for solving the complex and demanding problem of ELD. Regardless of the application of various metaheuristics for addressing the ELD problem, researchers continue to seek and develop new and novel methods for its solution. The superb inspiration driving this is the No Free Lunch (NFL) hypothesis [24,25,26,27,28]. The NFL hypothesis expresses that a single algorithm does not perform equally well when applied to all enhancement issues. Henceforth, it is a legitimate goal to propose new, more proficient methods and improve the existing techniques. Thus, the current study proposes a novel Chameleon Swarm Algorithm (CSA) for solving the ELD problem. CSA is a novel algorithm proposed by Braik in 2021 that mimics the hunting and food searching mechanism of chameleons [29].
The main items of this work are as follows:
- ▪
- Discussion of the problems of economic load dispatch (ELD) and the combined emission and economic dispatch (CEED) for a six-unit network system.
- ▪
- The Chameleon Swarm Algorithm (CSA) is used as a new metaheuristic technique for the two case studies.
- ▪
- Minimizing the fuel cost is the main item in the objective function in the ELD problem.
- ▪
- Minimizing the fuel cost and emission cost are the main items in the objective function in the CEED problem.
- ▪
- A comparison between the proposed CSA method and other algorithms, such as the Sine Cosine Algorithm (SCA), Grey Wolf Optimization (GWO), and Earth Worm Algorithm (EWA), is undertaken for the two case studies.
- ▪
- The performance of all algorithms is measured according to the power mismatch factor in the ELD and CEED problems.
- ▪
- The maximum, mean, minimum, and standard deviation values of 30 independent runs were examined as statistical analyses for all applied algorithms.
2. Economic Load Dispatch Problem
Power system operation is subject to a number of problems; one of these is the ELD problem. Minimizing fuel consumption cost is the main issue in the optimization of the ELD problem to maximize the benefit economic of the power system. The main variable in the ELD problem is the allocating vector of each unit that specifies the optimal production for each unit in the system. Section 2.1 discusses ELD with losses and Section 2.2 discusses combined economic and emission dispatch (CEED).
2.1. ELD
The mathematical modeling of ELD with losses is clarified in this section. The operating cost of fuel consumption of n generators is:
where F is the total fuel cost, F1 is the cost of fuel for the 1st generator, and Fn is the cost of fuel for the nth generator. The fuel consumption cost function is estimated in quadratic form as:
where c, b, a are the fuel cost weight constants.
The generator constraints of each unit are given by Equations (3) and (5):
where signifies total network demand and represents the network transmission losses.
where is the loss factor, is the power generated by the ith generator, and is the power generated by the jth generator.
2.2. CEED
The ELD problem is further developed by taking the reduction of emissions into consideration with the production cost; this is then called the CEED problem. Minimizing fuel cost is aligned with minimizing the emissions. Similarly, minimizing the emissions is aligned with minimizing the fuel cost.
The CEED problem is concerned with the minimization of the gases from power plants. The factor of emission is specified by:
The CEED problem fitness function is:
where is the penalty factor of price, as shown in Equation (8):
The generator constraints of each unit are given by Equations (3) and (5).
3. Chameleon Swarm Algorithm (CSA)
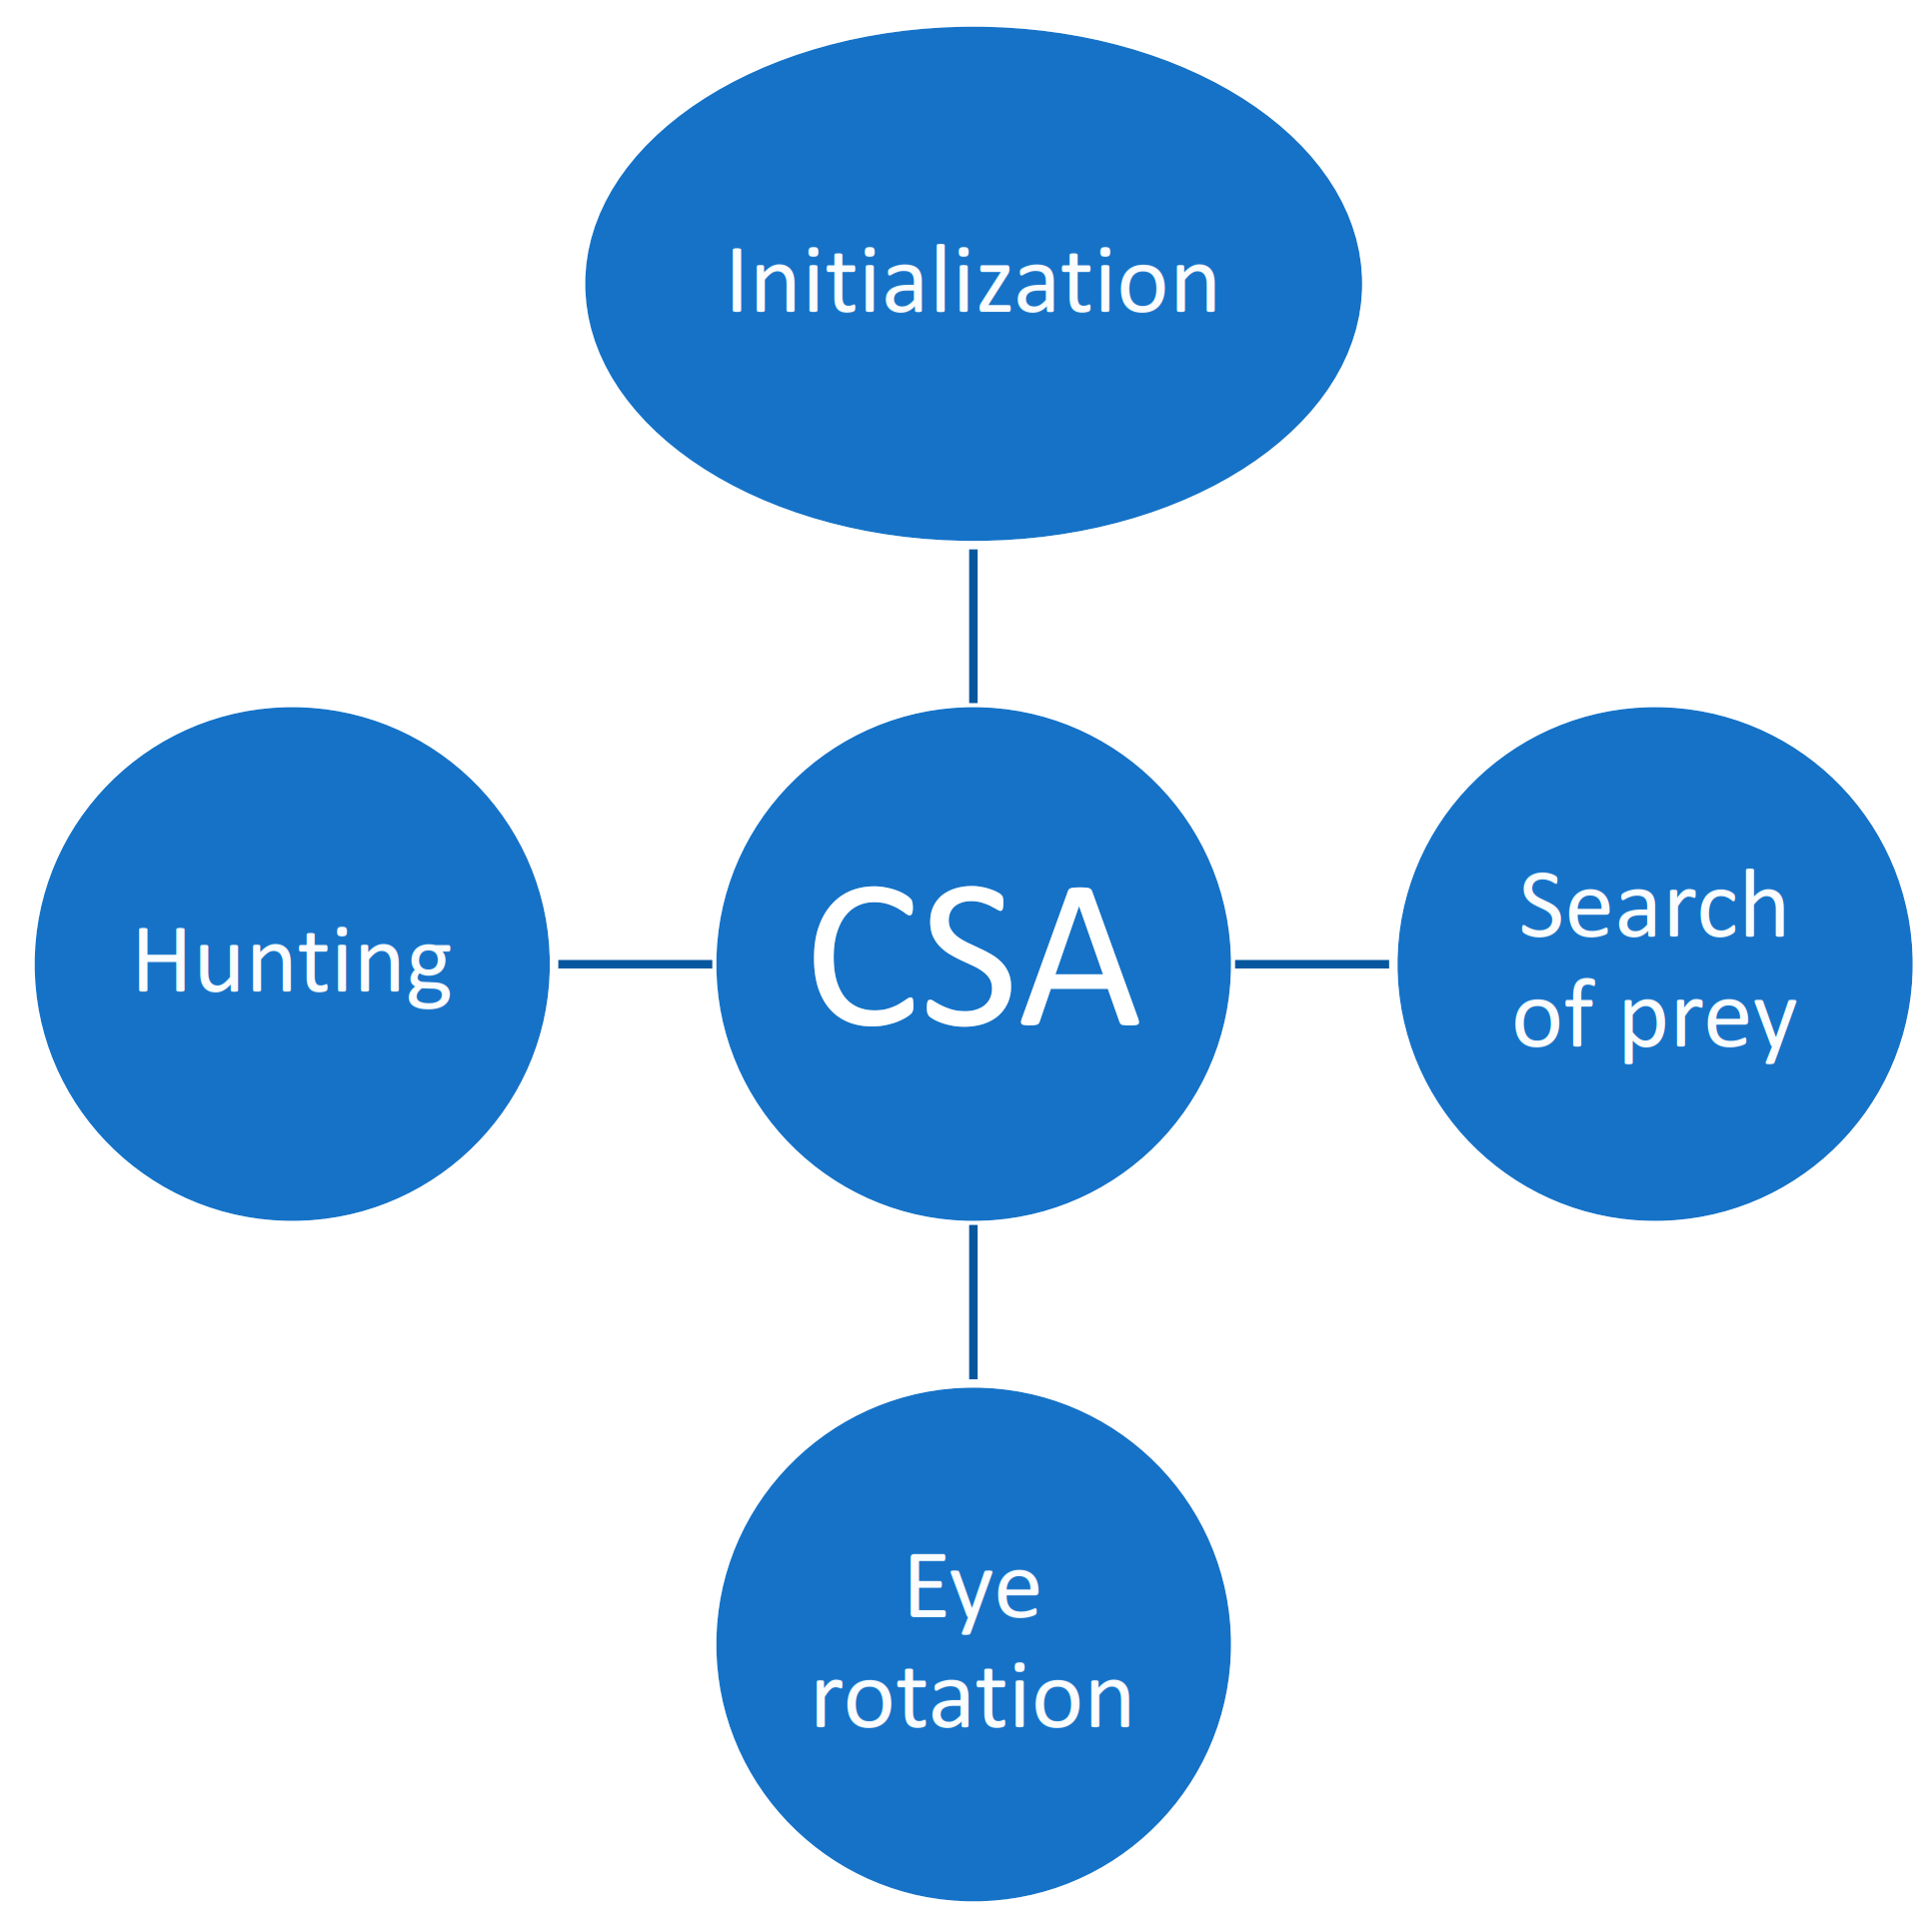
CSA is one of the most recent metaheuristics and was proposed by Braik in 2021. This algorithm mimics the hunting and food searching mechanism of chameleons [29]. Chameleons are a highly specialized class of species, having the ability to change color to mix in with their surrounding environment [29]. Chameleons have the capacity to live and survive in lowlands, mountains, deserts, and semi-desert areas, and generally eat insects [29]. Their food hunting process involves a number of steps, such as tracking the prey, pursuing the prey using their sight, and attacking the prey, as shown in Figure 1. The mathematical models and steps of this algorithm are explained in the subsequent sub-sections.
Figure 1.
Steps of CSA.
3.1. Initialization and Function Evaluation
CSA is a population-based metaheuristic that randomly generates an initial population to start the process of optimization. The chameleon population with size n is generated in a d dimensional search area, where each individual of the population is a possible solution to the optimization problem. The chameleon position at any iteration in the search area is characterized by Equation (9):
where i = 1,2…t represents the count of iteration, represents the position of chameleon.
The initial population is generated based on the problem dimension and the number of chameleons in the search space as shown in Equation (10):
where is the initial vector of the ith chameleon, and refer to the upper and lower limits of the search space, respectively, and r is a random uniformly number ranging from 0 to 1. The solution quality in each step is measured for each new position on the basis of the evaluation of the objective function.
3.2. Search of Prey
The chameleons’ movement behavior during searching can be characterized based on the updating strategy of position, as in Equation (11):
where t and (t + 1) indicate the tth and (t + 1)th iteration step, respectively. i and j represent the ith chameleon in the jth dimension. and are the current and new positions, respectively, of the chameleon. and imply the best and global best positions of the chameleon, respectively.
Where, are two positive numbers that control exploration ability. , , and are random uniformly numbers created and ranging from 0 to 1. is a random uniformly number created at index i ranging from 0 to 1. indicates the probability of the chameleon perceiving prey. has an effect on the direction of exploitation and exploration, and can be either −1 or 1. μ is a function of iterations parameter that reduces with the number of iterations.
3.3. Chameleon’s Eyes Rotation
Chameleons possess the capacity to identify the position of the prey by rotating their eyes. This rotational feature assists them to spot the prey through 360 degrees [21]. The accompanying steps happen in the following manner:
- The first position of the chameleon is the focal point of gravity (i.e., the beginning);
- The rotation matrix is discovered that recognizes the position of the prey;
- The situation of the chameleon is refreshed utilizing the rotation matrix at the focal point of gravity;
- Finally, the chameleons are returned to the first position
3.4. Hunting Prey
Chameleons assault their prey when it comes excessively close. The chameleon that is nearest to the prey is the optimal chameleon, and is viewed as the best result. This chameleon assaults the prey by utilizing its tongue. The situation of the chameleon is improved because it can extend its tongue by twice its length. This helps the chameleon to take advantage of the pursuit space, and allows it to adequately snatch prey [21]. The speed of a chameleon’s tongue when it is extended toward prey can be numerically demonstrated by Equation (12):
where indicates the new velocity of the ith chameleon in the jth dimension of iteration t +1, and indicates the current velocity of the ith chameleon in the jth dimension.
4. Numerical Analysis of Results
The performance of CSA for two scenarios of ELD was examined. The proposed CSA algorithm was compared with Grey Wolf Optimization (GWO), Sine Cosine Algorithm (SCA), and Earth Worm Algorithm (EWA) for the same two case studies. Table 1 describes the two case studies used to compare the proposed CSA with the other algorithms. The general and private settings for all algorithms are reported in Table 2. The independent runs were performed on MATLAB R2015b software and Intel(R) Core(TM) i7-4600U CPU @ 2.10 GHz–2.70 GHz hardware with Windows User 10 Pro and 8 GB RAM.
4.1. Results of the ELD Problem
The network system of six generator units with several demand loads, as shown in Table 1, was used to solve the ELD problem based on several optimization algorithms, namely, the CSA, SCA, GWO, and EWA algorithms. The comparison between all algorithms was performed based on 30 independent runs. Table 3 presents the statistical analysis, showing the standard deviation, minimum, mean, and maximum of the objective function for all algorithms based on the 30 independent runs for all demand loads. Based on this table, the proposed CSA algorithm achieved the best objective function and standard deviation for all cases. Thus, CSA is more reliable and has higher accuracy than the other competitor algorithms. The best fuel consumption cost for all demand loads and the best objective function for all algorithms is reported in Table 4. The allocation vector of each unit in the network system based on the best fitness function is reported in Table 5, Table 6 and Table 7, for demand loads of 700, 1000, and 1200 MW, respectively. Based on these results, the proposed CSA algorithm achieved the best fuel consumption cost for all demand cases. The order of algorithms based on the best cost is CSA, GWO, SCA, and EWA for all demand cases. The convergence and robustness curves for all algorithms over 30 independent runs are shown in Figure 2, Figure 3 and Figure 4, for demand levels of 700, 1000, and 1200 MW, respectively. Based on these figures, the CSA reached the optimal solution faster than the other algorithms. The convergence and robustness curves indicate the solution achieved by the proposed CSA algorithm was the global optimal solution for ELD problem.

Table 3.
Statistical analysis of objective function for case 1.
| Load (MW) | Technique | Min | Mean | Max | SD |
|---|---|---|---|---|---|
| 700 | CSA | 8528.091975 | 8922.841673 | 9093.525189 | 133.4072202 |
| GWO | 554,192.147 | 8,523,819.629 | 29,793,196.04 | 7,437,182.379 | |
| SCA | 7,680,621.197 | 69,654,953.61 | 203,722,478.8 | 42,769,492.03 | |
| EWA | 14,863.57446 | 46,501,446.523 | 196,465,481.6 | 57,752,646.53 | |
| 1000 | CSA | 12,120.08172 | 12,311.32929 | 12,695.87285 | 115.7916315 |
| GWO | 495,091.3593 | 12,418,496.27 | 39,059,487.38 | 9,946,760.603 | |
| SCA | 1,836,263.786 | 126,730,461.9 | 620,534,587.7 | 122,987,260.2 | |
| EWA | 44,518.42105 | 25,701,303.152 | 156,109,230.1 | 37,277,321.51 | |
| 1200 | CSA | 14,846.46878 | 14,964.33727 | 16,640.51747 | 319.5243805 |
| GWO | 3,089,864.26 | 15,978,305.46 | 119,976,210.6 | 21,625,976.95 | |
| SCA | 15,376,807.46 | 199,191,415.2 | 608,076,225.3 | 157,173,566.8 | |
| EWA | 14,915.7328 | 71,604,765.525 | 564,214,908.2 | 121,880,902.4 |
Table 4.
Best fuel cost in $ per hour for various load settings of case 1.
| Technique | 700 MW | 1000 MW | 1200 MW |
|---|---|---|---|
| CSA | 8528.091869 | 12,120.04448 | 14,846.46878 |
| GWO | 8602.008494 | 12,363.08738 | 14,865.77008 |
| SCA | 8717.700902 | 12,370.84528 | 14,962.38136 |
| EWA | 9540.807338 | 14,612.63001 | 17,447.40468 |
Table 5.
Vector of allocation for the best objective function for all techniques of case 1 at demand of 700 MW.
Table 5.
Vector of allocation for the best objective function for all techniques of case 1 at demand of 700 MW.
| CSA | GWO | SCA | EWA |
|---|---|---|---|
| 201.2535201 | 165.20543 | 163.4754609 | 57.01527783 |
| 129.4000937 | 126.7615129 | 94.97953739 | 75.0047139 |
| 154.2857039 | 200.0201434 | 151.0967108 | 91.00020071 |
| 71.30891756 | 69.4678662 | 150 | 116.0167198 |
| 98.34085361 | 101.459958 | 84.37601099 | 124.0000002 |
| 57.66734009 | 50 | 69.14598368 | 248.4968272 |
Table 6.
Vector of allocation for the best objective function for all techniques of case 1 at demand of 1000 MW.
Table 6.
Vector of allocation for the best objective function for all techniques of case 1 at demand of 1000 MW.
| CSA | GWO | SCA | EWA |
|---|---|---|---|
| 403.4372818 | 500 | 273.3437231 | 56.00029022 |
| 142.9644621 | 151.23974 | 112.4433126 | 84.00042386 |
| 244.1627946 | 80.9641118 | 300 | 102.0006046 |
| 66.55584622 | 97.7893247 | 79.70060918 | 143.6741356 |
| 116.3668887 | 139.896394 | 141.6622318 | 149.0010695 |
| 50.00013166 | 52.367134 | 120 | 486.9954158 |
Table 7.
Vector of allocation for the best objective function for all techniques of case 1 at demand of 1200 MW.
Table 7.
Vector of allocation for the best objective function for all techniques of case 1 at demand of 1200 MW.
| CSA | GWO | SCA | EWA |
|---|---|---|---|
| 467.1166529 | 456.069504 | 500 | 51.02070233 |
| 192.0406171 | 160.473756 | 169.2380267 | 105.9965483 |
| 231.0401614 | 264.875181 | 300 | 132.0054405 |
| 126.9090868 | 138.920676 | 139.6603993 | 180.963024 |
| 147.2057156 | 109.351234 | 50 | 276.8977415 |
| 69.81050052 | 104.7556989 | 74.15460988 | 486.8740064 |
Figure 2.
Convergence and robustness behavior using all techniques for case 1 at demand load of 700 MW.
Figure 2.
Convergence and robustness behavior using all techniques for case 1 at demand load of 700 MW.

Figure 3.
Convergence and robustness behavior using all techniques for case 1 at demand load of 1000 MW.
Figure 3.
Convergence and robustness behavior using all techniques for case 1 at demand load of 1000 MW.

Figure 4.
Convergence and robustness behavior using all techniques for case 1 at demand load of 1200 MW.
Figure 4.
Convergence and robustness behavior using all techniques for case 1 at demand load of 1200 MW.

4.2. Results of CEED Problem
The network system of six generator units with several demand loads, as shown in Table 1, was used to solve the CEED problem based on several optimization algorithms, namely, the CSA, SCA, GWO, and EWA algorithms. The comparison between all algorithms was performed based on 30 independent runs. Table 8 presents the statistical analysis and shows the standard deviation, minimum, mean and maximum of the objective function for all algorithms based on the 30 independent runs for all demand loads. Based on this table, the proposed CSA algorithm achieved the best objective function and standard deviation for all cases. Thus, CSA is more reliable and has higher accuracy than the other competitor algorithms. The best fuel consumption cost for all demand loads and the best objective function for all algorithms is reported in Table 9. The allocation vector of each unit in the network system based on the best fitness function is reported in Table 10, Table 11 and Table 12, for demand levels of 700, 1000, and 1200 MW, respectively. Based on these results, the proposed CSA algorithm achieved the best fuel consumption cost for all demand cases. The order of algorithms based on the best cost is CSA, GWO, SCA, and EWA for all demand cases. The convergence and robustness curves for all algorithms over 30 independent runs are explained in Figure 5, Figure 6 and Figure 7, for demand levels of 700, 1000, and 1200 MW, respectively. Based on these figures, the CSA reached the optimal solution faster than the other algorithms. The convergence and robustness curves indicate the solution achieved by the proposed CSA algorithm is the global optimal solution for the CEED problem.
Table 8.
Statistical analysis of the objective function for case 2.
| Load (MW) | Technique | Min | Mean | Max | SD |
|---|---|---|---|---|---|
| 700 | CSA | 13,740.19426 | 15,341.954 | 16,374.91585 | 673.5762317 |
| GWO | 99,263.42118 | 8,823,549.782 | 32,618,509.3 | 8,180,728.243 | |
| SCA | 1,299,372.036 | 58,806,922.34 | 268,245,016.9 | 70,125,512.69 | |
| EWA | 94,898.9244 | 36,933,381.1603 | 132,342,809.9 | 34,411,120.3 | |
| 1000 | CSA | 21,612.42374 | 22,386.89567 | 23,771.54396 | 526.6885085 |
| GWO | 491,868.4754 | 10,247,754.87 | 43,428,023.49 | 9,546,163.002 | |
| SCA | 12,621,456.9 | 87,188,746.09 | 305,519,608.7 | 64,964,750.28 | |
| EWA | 70,176.0552 | 12,601,434.865 | 46,743,568.71 | 14,550,469.21 | |
| 1200 | CSA | 27,972.52315 | 28,378.16957 | 30,238.11598 | 430.7763349 |
| GWO | 3,103,205.769 | 15,991,735.76 | 119,989,397.5 | 21,625,919.36 | |
| SCA | 15,390,677.52 | 199,205,138 | 608,090,433.9 | 157,173,553.9 | |
| EWA | 33,465.88848 | 78,645,451.7863 | 448,031,794.3 | 113,944,006.1 |
Table 9.
Best fuel and emission costs in $ per hour for various load settings of case 2.
| Technique | 700 MW | 1000 MW | 1200 MW | |||
|---|---|---|---|---|---|---|
| Fuel | Emission | Fuel | Emission | Fuel | Emission | |
| CSA | 8462.268917 | 6792.11394 | 12,139.60382 | 10,527.9799 | 14,856.97546 | 15,211.91134 |
| GWO | 8907.148297 | 12,152.50578 | 12,260.97086 | 8748.43968 | 14,865.77008 | 16,562.15696 |
| SCA | 9066.659657 | 4136.630696 | 12,237.98949 | 9363.736686 | 14,962.38136 | 18,113.98812 |
| EWA | 9368.5485 | 10,248.42837 | 13,633.57578 | 22,746.5453 | 16,837.91299 | 42,558.60192 |
Table 10.
Vector of allocation for the best objective function for all techniques of case 2 at demand of 700 MW.
Table 10.
Vector of allocation for the best objective function for all techniques of case 2 at demand of 700 MW.
| CSA | GWO | SCA | EWA |
|---|---|---|---|
| 258.0083211 | 115.216131 | 117.2751813 | 53 |
| 50.00000869 | 75.731398 | 200 | 84 |
| 167.3337086 | 300 | 80 | 109 |
| 106.613021 | 103.905314 | 50 | 135 |
| 73.44096019 | 67.6531736 | 200 | 158 |
| 56.5684972 | 52.354702 | 67.13006412 | 175 |
Table 11.
Vector of allocation for the best objective function for all techniques of case 2 at demand of 1000 MW.
Table 11.
Vector of allocation for the best objective function for all techniques of case 2 at demand of 1000 MW.
| CSA | GWO | SCA | EWA |
|---|---|---|---|
| 400.4399359 | 376.513695 | 394.8204572 | 78.0000557 |
| 140.5499372 | 200 | 157.0376964 | 94.17467563 |
| 195.0348613 | 137.696695 | 131.0117043 | 133.9999977 |
| 119.3390882 | 74.5127265 | 140.4159948 | 164.4652813 |
| 98.24778751 | 135.028378 | 119.2275839 | 265.4122572 |
| 69.56091425 | 100.274265 | 81.11261153 | 290.2872253 |
Table 12.
Vector of allocation for the best objective function for all techniques of case 2 at demand of 1200 MW.
Table 12.
Vector of allocation for the best objective function for all techniques of case 2 at demand of 1200 MW.
| CSA | GWO | SCA | EWA |
|---|---|---|---|
| 480.1323819 | 456.069504 | 500 | 87.99845176 |
| 171.3582298 | 160.473756 | 169.2380267 | 138.4838263 |
| 266.9421588 | 264.875181 | 300 | 154.9963726 |
| 78.28987273 | 138.920676 | 139.6603993 | 170.9819546 |
| 152.5502456 | 109.351234 | 50 | 249.9359313 |
| 85.07538079 | 104.7556989 | 74.15460988 | 432.8298403 |
Figure 5.
Convergence and robustness behavior using all techniques for case 2 at demand load of 700 MW.
Figure 5.
Convergence and robustness behavior using all techniques for case 2 at demand load of 700 MW.

Figure 6.
Convergence and robustness behavior using all techniques for case 2 at demand load of 1000 MW.
Figure 6.
Convergence and robustness behavior using all techniques for case 2 at demand load of 1000 MW.

Figure 7.
Convergence and robustness behavior using all techniques for case 2 at demand load of 1200 MW.
Figure 7.
Convergence and robustness behavior using all techniques for case 2 at demand load of 1200 MW.

4.3. Discussion of Results
The power mismatch factor is the main factor in the ELD problems. This can be expressed by the absolute error between two terms; the first term is the sum of transmission losses and the load demand, and the second term is the sum of power generated by each unit in the system. The best value of this factor must tend to nearly zero. Based on the data identified from all algorithms, the power mismatch factor was calculated. The value of this factor is illustrated in Table 13 for the two cases used in this work. Based on this recorded data, the CSA technique achieved the best power mismatch factor compared to the GWO, SCA, and EWA algorithms.
5. Conclusions
ELD is a complicated problem in the optimization of power systems. This work validates the performance of the Chameleon Swarm Algorithm (CSA) in solving different cases of ELD. CSA is one of the most recently developed metaheuristics, and mimics the food hunting process of chameleons. CSA has an excellent balance between exploration and exploitation, and favors faster convergence. In the current study, the performance of CSA was compared with that of several metaheuristic algorithms, namely, GWO, SCA, and EWA, in solving CEED and ELD for a six unit system. It was found that CSA performed well compared to other state-of-the-art metaheuristics and favored a faster convergence. The proposed CSA algorithm achieved the best objective function and standard deviation for all cases of CEED and ELD for a six unit system. Thus, CSA is more reliable and has higher accuracy than the other competitor algorithms. The CSA technique achieved the best power mismatch factor in solving CEED and ELD for a six unit system compared to the GWO, SCA, and EWA algorithms.
Future research will focus on the following aspects:
- Improvement and hybridization of CSA;
- Using CSA for solving other complex power system optimization problems; for example, unit commitment and hydro-thermal scheduling.
Author Contributions
Data curation, M.S.; Formal analysis, A.M.E.-R.; Investigation, E.H.H.; Methodology, M.A.T.; Validation, S.D. All authors have read and agreed to the published version of the manuscript.
Funding
This research received no external funding.
Institutional Review Board Statement
Not applicable.
Informed Consent Statement
Not applicable.
Data Availability Statement
Not applicable.
Acknowledgments
The researcher (M.A.T.) is funded by a full scholarship (mission2019/20) from the Ministry of Higher Education of Egypt. The current research work is not funded by the mentioned ministry of Egypt or any other foundation or organization.
Conflicts of Interest
The authors declare no conflict of interest. Non-financial competing interest.
References
- Sheta, A.; Faris, H.; Braik, M.; Mirjalili, S. Nature-inspired metaheuristics search algorithms for solving the economic load dispatch problem of power system: A comparison study. In Applied Nature-Inspired Computing: Algorithms and Case Studies; Springer: Berlin/Heidelberg, Germany, 2020; pp. 199–230. [Google Scholar]
- Deb, S.; Abdelminaam, D.S.; Said, M.; Houssein, E.H. Recent Methodology-Based Gradient-Based Optimizer for Economic Load Dispatch Problem. IEEE Access 2021, 9, 44322–44338. [Google Scholar] [CrossRef]
- Srivastava, A.; Das, D.K. A New Aggrandized Class Topper Optimization Algorithm to Solve Economic Load Dispatch Problem in a Power System. IEEE Trans. Cybern. 2020, 1–11. [Google Scholar] [CrossRef] [PubMed]
- Deb, S.; Houssein, E.H.; Said, M.; Abdelminaam, D.S. Performance of Turbulent Flow of Water Optimization on Economic Load Dispatch Problem. IEEE Access 2021, 9, 77882–77893. [Google Scholar] [CrossRef]
- Gherbi, Y.A.; Lakdja, F.; Bouzeboudja, H.; Gherbi, F.Z. Hybridization of two metaheuristics for solving the combined economic and emission dispatch problem. Neural Comput. Appl. 2019, 31, 8547–8559. [Google Scholar] [CrossRef]
- Younes, Z.; Alhamrouni, I.; Mekhilef, S.; Reyasudin, M. A memory-based gravitational search algorithm for solving economic dispatch problem in micro-grid. Ain Shams Eng. J. 2021, 12, 1985–1994. [Google Scholar] [CrossRef]
- Sunanda, H.; Provas, K.R. Metaheuristic Moth-Flame Optimization Applied on Renewable Wind Energy Incor-porating Load Transmit Penetration. Int. J. Appl. Metaheuristic Comput. 2021, 12, 185–210. [Google Scholar]
- Bodha, K.D.; Yadav, V.K.; Mukherjee, V. A novel quantum inspired hybrid metaheuristic for dispatch of power system including solar photovoltaic generation. Energy Sources Part B Econ. Plan. Policy 2021, 16, 1–26. [Google Scholar] [CrossRef]
- Kapelinski, K.; Neto, J.P.J.; dos Santos, E.M. Firefly Algorithm with non-homogeneous population: A case study in economic load dispatch problem. J. Oper. Res. Soc. 2021, 72, 519–534. [Google Scholar] [CrossRef]
- Zare, M.; Narimani, M.R.; Malekpour, M.; Azizipanah-Abarghooee, R.; Terzija, V. Reserve constrained dynamic economic dispatch in multi-area power systems: An improved fireworks algorithm. Int. J. Electr. Power Energy Syst. 2021, 126, 106579. [Google Scholar] [CrossRef]
- Vasant, P.; Mahdi, F.P.; Marmolejo-Saucedo, J.A.; Litvinchev, I.; Aguilar, R.R.; Watada, J. Quantum-Behaved Bat Algorithm for Solving the Economic Load Dispatch Problem Considering a Valve-Point Effect. Res. Anthol. Adv. Quantum Technol. 2021, 11, 93–110. [Google Scholar] [CrossRef]
- El-Shorbagy, M.; Mousa, A.A. Constrained Multiobjective Equilibrium Optimizer Algorithm for Solving Combined Economic Emission Dispatch Problem. Complexity 2021, 2021, 1–14. [Google Scholar] [CrossRef]
- Navin, N.K. A Multiagent Fuzzy Reinforcement Learning Approach for Economic Power Dispatch Considering Multiple Plug-In Electric Vehicle Loads. Arab. J. Sci. Eng. 2021, 46, 1431–1449. [Google Scholar] [CrossRef]
- Al-Betar, M.A. Island-Based Harmony Search Algorithm for Non-convex Economic Load Dispatch Problems. J. Electr. Eng. Technol. 2021, 16, 1985–2015. [Google Scholar] [CrossRef]
- Singh, D.; Dhillon, J.S. Improved Directional Bat Algorithm Based Electric Power Dispatch. Electr. Power Compon. Syst. 2021, 48, 1–25. [Google Scholar] [CrossRef]
- Kaur, A.; Singh, L.; Dhillon, J. Modified Krill Herd Algorithm for constrained economic load dispatch problem. Int. J. Ambient. Energy 2021, 1–11. [Google Scholar] [CrossRef]
- Zhang, J.; Zhang, F.; Chi, M.; Wan, L. An Improved Symbiosis Particle Swarm Optimization for Solving Economic Load Dispatch Problem. J. Electr. Comput. Eng. 2021, 2021, 1–11. [Google Scholar] [CrossRef]
- Alanazi, M.S. A Modified Teaching—Learning-Based Optimization for Dynamic Economic Load Dispatch Considering Both Wind Power and Load Demand Uncertainties with Operational Constraints. IEEE Access 2021, 9, 101665–101680. [Google Scholar] [CrossRef]
- Tabassum, M.F.; Saeed, M.; Chaudhry, N.A.; Ali, J.; Farman, M.; Akram, S. Evolutionary simplex adaptive Hooke-Jeeves algorithm for economic load dispatch problem considering valve point loading effects. Ain Shams Eng. J. 2021, 12, 1001–1015. [Google Scholar] [CrossRef]
- Parouha, R.P.; Verma, P. An innovative hybrid algorithm to solve nonconvex economic load dispatch problem with or without valve point effects. Int. Trans. Electr. Energy Syst. 2021, 31, 12682. [Google Scholar] [CrossRef]
- Vasovala, P.J.; Mirchiwala, M.I.; Mayank, V.; Ghanchi, V.H. Application of ant colony optimization technique in economic load dispatch of IEEE-26 bus system with valve point loading. Int. J. Res. Appl. Sci. Eng. Technol. 2021, 9, 51–58. [Google Scholar] [CrossRef]
- Paramguru, J.; Barik, S.K.; Barisal, A.K.; Dhiman, G.; Jhaveri, R.H.; Alkahtani, M.; Abidi, M.H. Addressing Economic Dispatch Problem with Multiple Fuels Using Oscillatory Particle Swarm Optimization. Comput. Mater. Contin. 2021, 69, 2863–2882. [Google Scholar] [CrossRef]
- Kabir, A.M.; Kamal, M.; Ahmad, F.; Ullah, Z.; Albogamy, F.R.; Hafeez, G.; Mehmood, F. Optimized Economic Load Dispatch with Multiple Fuels and Valve-Point Effects Using Hybrid Genetic–Artificial Fish Swarm Algorithm. Sustainability 2021, 13, 10609. [Google Scholar] [CrossRef]
- Ho, Y.; Pepyne, D. Simple Explanation of the No-Free-Lunch Theorem and Its Implications. J. Optim. Theory Appl. 2002, 115, 549–570. [Google Scholar] [CrossRef]
- Adam, S.P.; Alexandropoulos, S.-A.N.; Pardalos, P.M.; Vrahatis, M.N. No Free Lunch Theorem: A Review. In Approximation and Optimization; Springer: Cham, Switzerland, 2019; pp. 57–82. [Google Scholar] [CrossRef]
- Ho, Y.-C.; Pepyne, D.L. Simple explanation of the no free lunch theorem of optimization. In Cybernetics and Systems Analysis, Proceedings of the IEEE Conference on Decision and Control (Cat. No.01CH37228); Orlando, FL, USA, 4–7 December 2001; IEEE: Piscataway, NJ, USA, 2002; Volume 5, pp. 4409–4414. [Google Scholar]
- Serafino, L. The No Free Lunch Theorem: What Are its Main Implications for the Optimization Practice? In Variational Analysis and Aerospace Engineering; Springer: Berlin/Heidelberg, Germany, 2021; Volume 170, pp. 357–372. [Google Scholar]
- Kang, J.-W.; Park, H.-J.; Ro, J.-S.; Jung, H.-K. A Strategy-Selecting Hybrid Optimization Algorithm to Overcome the Problems of the No Free Lunch Theorem. IEEE Trans. Magn. 2018, 54, 1–4. [Google Scholar] [CrossRef]
- Braik, M.S. Chameleon Swarm Algorithm: A bio-inspired optimizer for solving engineering design problems. Expert Syst. Appl. 2021, 174, 114685. [Google Scholar] [CrossRef]
Table 1.
Cases of the tested networks.
| Item | Problem | Test Network | Load (MW) |
|---|---|---|---|
| 1 | ELD | 6 | 1200 |
| 1000 | |||
| 700 | |||
| 2 | CEED | 6 | 1200 |
| 1000 | |||
| 700 |
Table 2.
Algorithms’ specific parameter settings.
| Algorithms | Parameter Values |
|---|---|
| Common parameters | Size of population: N = 30 Number of iterations is 1000 |
| CSA | p1, p2, ρ, c1, c2 are equal to 0.25, 1.50, 1.0 1.75, 1.75, respectively. |
| GWO | a decreases linearly from 2 to 0 |
| SCA | A = 2 |
| EWA | A = 0.98, β0 = 1, and γ = 0.9 |
Table 13.
The power mismatch value for all cases.
| Cases | Algorithm | 700 MW | 1000 MW | 1200 MW |
|---|---|---|---|---|
| Case 1 | CSA | |||
| GWO | ||||
| SCA | 0.00076719 | |||
| EWA | 5.71 | 20.1 | 23.4 | |
| Case 2 | CSA | |||
| GWO | ||||
| SCA | 0.000128351 | 0.001259941 | 0.001536185 | |
| EWA | 2.164245 | 9.051048781 | 17.36856684 |
Publisher’s Note: MDPI stays neutral with regard to jurisdictional claims in published maps and institutional affiliations. |
© 2021 by the authors. Licensee MDPI, Basel, Switzerland. This article is an open access article distributed under the terms and conditions of the Creative Commons Attribution (CC BY) license (https://creativecommons.org/licenses/by/4.0/).
Share and Cite
MDPI and ACS Style
Said, M.; El-Rifaie, A.M.; Tolba, M.A.; Houssein, E.H.; Deb, S. An Efficient Chameleon Swarm Algorithm for Economic Load Dispatch Problem. Mathematics 2021, 9, 2770. https://doi.org/10.3390/math9212770
AMA Style
Said M, El-Rifaie AM, Tolba MA, Houssein EH, Deb S. An Efficient Chameleon Swarm Algorithm for Economic Load Dispatch Problem. Mathematics. 2021; 9(21):2770. https://doi.org/10.3390/math9212770
Chicago/Turabian StyleSaid, Mokhtar, Ali M. El-Rifaie, Mohamed A. Tolba, Essam H. Houssein, and Sanchari Deb. 2021. "An Efficient Chameleon Swarm Algorithm for Economic Load Dispatch Problem" Mathematics 9, no. 21: 2770. https://doi.org/10.3390/math9212770
Note that from the first issue of 2016, this journal uses article numbers instead of page numbers. See further details here.