
ARDL as an Elixir Approach to Cure for Spurious Regression in Nonstationary Time Series


1
Economics Department, University of Lahore, Lahore 55150, Pakistan
2
Department of Economics and Econometrics, Pakistan Institute of Development Economics, Islamabad 44000, Pakistan
3
Kashmir Institute of Economics, University of Azad Jammu and Kashmir, Muzaffarabad 13100, Pakistan
4
La Trobe Business School, La Trobe University, Melbourne, VIC 3083, Australia
*
Author to whom correspondence should be addressed.
Mathematics 2021, 9(22), 2839; https://doi.org/10.3390/math9222839
Submission received: 30 August 2021
/
Revised: 25 October 2021
/
Accepted: 1 November 2021
/
Published: 9 November 2021
(This article belongs to the Special Issue Generalized Fractional Dynamics in Graphs and Complex Systems)
Abstract
:In conventional Econometrics, the unit root and cointegration analysis are the only ways to circumvent the spurious regression which may arise from missing variable (lag values) rather than the nonstationarity process in time series data. We propose the Ghouse equation solution of autoregressive distributed lag mechanism which does not require additional work in unit root testing and bound testing. This advantage makes the proposed methodology more efficient compared to the existing cointegration procedures. The earlier tests weaken their position in comparison to it, as they had numerous linked testing procedures which further increase the size of the test and/or reduce the test power. The simplification of the Ghouse equation does not attain any such type of error, which makes it a more powerful test as compared to widely cited exiting testing methods in econometrics and statistics literature.
1. Introduction
The most important feature that led to development of new time series econometrics was spurious regression. Spurious regression is a phenomenon known to econometricians since the times of [1]. This problem was attributed to missing variables until [2] showed that it can also be found in nonstationary time series even with no missing variable. Most of the time series are better characterized as nonstationary [3]. Spurious regression has performed a vital role in the construction of contemporary time series econometrics and have developed many tools employed in applied macroeconomics. However, the widespread literature considers the nonstationarity as the only reason for spurious regression. To evade the problem of spurious regression caused by the nonstationarity, researchers frequently employed unit root and cointegration procedures.
Supposing that the spurious regression occurs due to nonstationarity and unit root and cointegration testing are used as the remedy, even then it is very hard to find reliable inferences. There is no test of unit root with good size and power in small sample size [4]. The unit root and cointegration procedures involve many prior specification decisions such as lag length, trend, and structural stability. If we do data-based decision making, it will involve a large battery of tests. Each test is having a specific statistical error (type I, II error). The cumulative probability of error in all tests leave the results of the unit root test unreliable. Because of these reasons, the literature is still underdeveloped and inconclusive after four decades.
It is a common misunderstanding that unit root is the only cause of spurious regression; however, this paper argues that missing relevant variable is a larger issue than unit root, causing spurious regression. It can be shown from the ref. [2] experiment that spurious regression arises due to missing variable (lag values). In this paper, we propose Ghouse equation (looks like ARDL equation) as an alternative possible solution to the spurious regression mainly from the perspective of missing variables (lag values).
In this paper, we make two arguments with this setup: one, it significantly reduces the probability of spurious regression in the case of nonstationary (Section 4); and two, that spurious regression occurs due to missing variable and can be avoided by including missing lags (Section 4). The objective of this study is to explore an alternative solution that is expected to perform for nonstationary series. This study investigates whether it is possible to use Ghouse equation to evade the spurious regression bypassing the simple ordinary least square (OLS) method and complicated unit root testing. We generate the autoregressive (nonstationary) series and investigate how the probability of spurious regression increases dramatically in nonstationary case by ignoring the lag dynamics through Monte Carlo simulations.
There is a considerable amount of literature available on spurious regression. In this section, we briefly discuss the proposed theoretical and empirical methods for the treatment of this problem. The history of debate on spurious regression can be traced back to [1] study of relationship between mortality rate and proportion of marriages of the Church of England to all marriages during 1866 and 1911. The results presented evidence of strong correlation of 0.9512 between variables that were not directly related to each other, and the presence of spurious regression is due to some missing relevant variable. The argument in favor of spurious correlation due to missing variable is also supported by literature and its remedy towards inclusion of additional variables as a genuine solution [5].
As mentioned earlier, ref. [2] study shows significant dependence between the variables that are nonstationary and independent. To showcase this phenomenon, they generate two and , both of which are functions only of their own lags, and no other variable is involved in the construction of both variables.
They ran the following regressions:
Much to their surprise, a very strong correlation existed between the variables even though both variables were unrelated. Hence, the results were spurious but the underlying reason was not explored thoroughly. Nonstationarity of the series as a cause of this problem attracted the sole focus in literature while the issue of missing variable (lags) completely faded away.
The alternative explanation of spurious regression proposed by [2] is now more popular in literature, while other explanations were not explored. As a result, in conventional econometrics, the unit root and cointegration analysis have become the only ways to circumvent the spurious regression in case of nonstationary time series.
Post Granger Newbold’s revelation of an existence of spurious regression in nonstationary series opened up a much larger debate on deceptive statistical evidence with an exclusive focus on stationarity. It was found that, with differencing, stationarity could be achieved in most of the series [6], whilst if regression was carried out without first achieving stationarity, the regression will provide misleading results with unreliable distribution of test statistics and estimator properties [7]. Analysis of the asymptotic properties of spurious least square regression also endorsed Granger and Newbold’s position on this issue [8].
Mostly, the nominal economic variables are correlated, even there is no relationship between them, and the mutual presence of price level in data series develops correlation between them. It is also shown that many time series are nonstationary, which is why the probability of spurious regression is very high. There is a considerable number of studies that exhibit a weak understanding of the concept of spurious regression due to missing and dispelled variables. A study conducted in Indian Kashmir shows that a significant positive correlation between Nass chewing, hookah smoking, and many other habits with esophageal squamous cell carcinoma (ESCC) risk [9] does not necessarily mean that such a relationship truly exists between them [10]. This is because the original study failed to control for the ‘water filtering factor’ that was critical to the whole process.
Moreover, it is intuitive that a human’s baby birth and stork nesting are not dependent upon each other. However, the statistics would show a strong positive correlation between the two [11] if there is a failure to identify the variable that is causing the association, i.e., the state of weather. This gives us a clear indication that human’s baby birth and stork nesting are spuriously correlated, due to a lack of statistical information on associating variables [12].
Ref. [3] study holds huge historical significance in its role in shaping the debate on spurious regression for decades to come. Their demonstration shows twelve out of fourteen economic series of U.S.A. under consideration to be unit root, with a simple Dickey Fuller test, which has shaped the interest of researchers for further exploration.
Building on the momentum set by Nelson and Plosser, cointegration surfaced as a viable solution to spurious regression due to nonstationarity in time series [13]. The premise of this error correction-based solution was simple; if there is error correction among two variables, they are cointegrated and conversely if two variables are cointegrated then error correction must exist between the two. In any case, an affirmative would indicate towards a long-run relationship. The solution, however, is not without its own limitations: one, EG cointegration tests deals with only one cointegrated vector; second, it depends upon two step estimation process; and, finally, the estimators have non-standard distributions.
To overcome the issue of estimators having non-standard distributions, a three-step procedure was proposed [14] that ensured the estimator followed a normal distribution. However, this was still limited to one cointegrated vector problem. This limitation led to the development of multivariate cointegration test [15]. The JJ test became more popular than the EG test for two reasons: one, it was no longer limited to one cointegrating vector; and two, it considered the short-run dynamics that were overlooked in the EG test.
Ref. [16] proposed residual-based tests under the null hypothesis of no cointegration in time series in which the asymptotic distributions of residual-based tests depend upon number of variables and deterministic trend terms. Refs. [17,18] proposed a single-equation autoregressive distributed lag (ARDL) approach for cointegration as an alternative of EG and EY. The first advantage of the ARDL cointegration approach is that it provides explicit tests for the presence of a single cointegrating vector, instead of assuming uniqueness. Ref. [18] revealed that asymptotically valid inference on short-run and long-run parameters could be made by employing ordinary least square estimations of ARDL model. So, the ARDL model order is properly augmented to grant for contemporary correlation among the stochastic elements of the data-generating processes involved in estimation.
The cointegration testing involves several specification decisions which undermine the reliability of results. The existing cointegration testing procedures do not provide any reasonable criteria regarding these specification decisions, i.e., the choice of the deterministic part, structural breaks, the choice of lags, and the innovation process of distribution. For example, lag length specification is a significant practical question relating to the application of any econometric analysis. Likewise, in case of a unit root test, if the lag length is too short then the serial correlation remains in errors and the results will be biased. If the lag length is too large, this will reduce the power of the test. In the same way, the cointegration tests are also very sensitive to lag length selection. Ref. [19] explored that the Engle Granger (EG) cointegration test is extremely sensitive to lag length. Ref. [20] examined that the lag length misspecification may significantly affect the cointegration results. In case of the under specification, it could undermine the cointegration results, and, in over specification, it may diminish the power of test. Similarly, trend specification is also a very significant issue in econometric literature.
Ref. [21] explored that when the deterministic linear time trend is included in Johansen’s cointegration test, it provides disproving results. Whereas, after it is excluded, it got robust results. He also suggested that great attention must be taken in trend specification in cointegration analysis. There are several studies available in literature on this issue but most of them produce different results. Ref. [22] used three cointegration test for independent integrated series and each series has a structural break. They found cointegration among them until structural break are not properly treated. Ref. [23] examined that the economic models for cointegration are often provided erroneous results. The main reason is the errors are unit root non-stationary, owing to the fact that one of the variables has non-stationary measurement error. They stated that “If the money demand function is stable in the long run, we have a cointegrating regression when money is measured with a stationary measurement error but have a spurious regression when money is measured with a nonstationary measurement error”.
Most of the financial and economic time series exhibit nonstationary or trending behavior. It is very unlikely to obtain reliable results from these kinds of series due to specification decisions involved in testing for unit root and cointegration. A battery of studies on the topic of unit root uses the US GNP series as a guinea pig for their analysis; however, nothing reasonable could be said in terms of a collective opinion. Summary findings tell us that refs. [24,25,26,27] classify it as trend stationary while [3,28,29] classify it as difference stationary, whereas [30] has inconclusive results in this matter [4].
2. Materials and Methods
This study mainly focuses on Monte Carlo simulations. The methodology is based on two components: one, data-generating process; and, two, testing and simulations. The data are generated with pre-decided specifications, and the probability of spurious regression is tested with OLS cointegration methods and the Ghouse equation.
2.1. Data-Generating Process (DGP)
Here, we have a data-generating process:
We can rewrite it as for simplification of notation:
The data-generating process Equation (6) can generate data in quite large types of scenarios. Suppose and = 0, the data-generating process will generate two independent series and would be indication of spurious regression if the regression of on turns out to be significant. If A = 0, it indicates that there is no autocorrelation and cross autocorrelation in the series. If A is zero, it means that the series would be identically independently distributed (IID). The value of degree of association depends upon only ∑.
2.2. The Testing and Simulations
The probability of spurious regression of Ghouse equation and conventional econometrics tools is estimated through Monte Carlo simulations.
2.2.1. The ARDL Model (Ghouse Equation)
The Ghouse equation is carefully developed on the footings of autoregressive distributed lag mechanism. This study in hand brings a break through intervention in the existing [24] proposed ARDL methodology (DHSY, hereafter) by employing a remedial measure for spurious regression, which has not been explored before. That is why, for the sake of understanding, we refer to it as the Ghouse equation instead of the ARDL model.
The ref. [18] bound testing procedure is also based on autoregressive distributed lag mechanism; however, as an extension to it, it employs bound testing and unit root testing to some extent. One of the important findings of this study is that the Ghouse equation does not require any extension, like bound testing and unit root procedure. This relaxation makes it indeed improved version as compared to existing cointegration procedures.
The earlier models weaken their position in comparison to the Ghouse equation, as they had numerous linked testing procedures which further increase the size of test or reduce the power of the test. The simplification of the Ghouse equation does not attain any such type of error, which makes it a more powerful test compared to widely cited exiting procedures (for details, see Section 4).
Ref. [7] proposed ARDL methodology (DHSY, hereafter) to model the UK consumption function. However, their study has also overlooked this aspect. The present study is simplified by [18] which is widely cited in the literature and provides a very limited knowledge of unit root testing. On the other hand, the ARDL model as a dependent variable is expressed by the lag and current values of independent variable and its own lag value. The ARDL model normally starts from a reasonably general and large dynamic model, and progressively reducing its mass and altering variable can be achieved by imposing linear and non-linear restrictions [31]. The autoregressive distributed lag (ARDL) model is one of the most general dynamic unrestricted models in econometric literature. As the ARDL methodology follows a general to specific approach, it could be possible to tackle many econometric problems, such as misspecification and autocorrelation, and come up with a most appropriate interpretable model. The ARDL (1, 1) is the simplest form of ARDL model. Consider an ARDL (1, 1) model:
Refs. [31,32,33] argued that, by imposing restrictions, we can find out at least ten most appropriate economically interpretable models from ARDL (1, 1) model. We are giving here some important cases of restrictions: for static regression; for the first-order autoregressive process; for the equation in the first difference; and for partial adjustment equation etc. As discussed, the spurious regression may be a consequence of missing variable. ARDL is a general specification taking into account the lag structure. Therefore, it could give better results.
2.2.2. The Engle and Granger Cointegration Explanation
According to ref. [34] the mechanism of cointegration is as follows. Suppose we have the equation:
For convenience, initially we assume no lag case:
where B is a backward lag operator . is and . The right-hand side spectrum will be:
is cross spectrum between variables The special conditions are following:
- (i)
- , when is small, and so, .
- (ii)
“The components of vector are said to be cointegrated of order (d, b), if (i) all components ofare I (d); (ii) there exists a vector (≠ 0) = , b > 0. The vector is called the cointegrated vector.”
In other words, the two-unit root series, i.e., Xt and Yt, are cointegrated if their linear combination Zt is stationary.
2.2.3. Johansen and Juselius Cointegration Test
When we have more than two variables, there is the possibility of more than one cointegrated vector. In this case, these cointegration procedures do not provide any solution. So, to overcome this problem, [15] introduced the multivariate cointegration test. Johansen and Juselius (JJ) used two test statistics for the detection of cointegration. First, one is a trace test with the null hypothesis, suggesting that there are no more than “r” cointegrating vectors. The second is maximum eigen value test with the null hypothesis, suggesting that there are no more than “r + 1” cointegrating vectors against the alternative “r” cointegrating vectors.
Suppose we have vector of variables with each element have same order of integration: here Xt denotes n x 1 vector of regressors. The JJ cointegration testing procedure starts from vector autoregressive (VAR) model and we have a VAR model of order p:
It can be written as:
where and . If , the coefficient matrix, reduces its rank r < n, then there are n x r matrices of and , and each of them has ‘r’ rank such that , while is stationary. In the error correction model, represents the adjustment parameter and every column of the shows the cointegrating vector. The r represents the cointegration relationships. They used two likelihood ratio test statistics for cointegration. The trace test equation is and is for the maximum eigenvalue test. The shows the ith high canonical correlation and T represents the number of observations. The JJ test helps to find out more than one cointegrated vectors, such that it is generally more applicable than EG and EY cointegration tests. We know that EG and EY single-equation procedures ignore short-run dynamics, when the relationships are estimated. However, the JJ procedure also considers the short-run dynamics. Ref. [35] proposed an extensive form of the JJ test which includes the trends for the treatment of stochastic cointegration in data series. Ref. [36] explored how the asymptotic critical values are not applicable when the sample size is 100 or less than 100. The JJ test suffers in size and power problem when the sample size is small. Refs. [16,37,38] estimated cointegration by employing principal component analysis.
2.2.4. The ARDL Bound Testing
Refs. [17,18] proposed a single-equation autoregressive distributed lag (ARDL) approach for cointegration as an alternative of EG and EY. The first advantage is the ARDL cointegration approach which provides explicit tests for the presence of a single cointegrating vector, instead of assuming uniqueness. Suppose we have two variables, and , and both are first difference stationary, then the cointegration regression equation of ARDL is the following:
The F test is employed to find out the joint significance for short-run and long-run relationships. The hypotheses for long-run relationship are and (which means that there is no long-run relationship), and (which means that there is a long-run relationship). While, the hypotheses for the short-run relationship are and (which means that there is no short-run relationship) and (which means that there is a short-run relationship). The F statistic (Wald test) for these hypotheses tested in each of the models can be denoted as and .
The distribution of Wald test is non-standard asymptotically under the null of no cointegration. Ref. [18] revealed that asymptotically valid inference on short-run and long-run parameters could be made by employing ordinary least square estimations of ARDL model. So, the ARDL model order is properly augmented to grant for contemporary correlation among the stochastic elements of the data-generating processes involved in estimation. Ref. [17] provided critical values of two bounds, i.e., upper and lower, which are used for cointegration. The lower bound considers variables which are stationary and which have no long-run relationship. The upper bound considers variables which are different stationary and which have long-run relationships. When the F-stat values line in the upper-bound critical region, then it rejects H0. This means that variables are cointegrated.
3. Results
Suppose we have a set of independent time series with no mutual relationship, and we test the relationship using Ghouse equation, it should be able to find that there is no relationship. More technically, suppose that xt and yt are independent by construction and we estimate:
We test the hypotheses . Since all three hypotheses are, in fact, true, the possibility of rejection of the three hypotheses should not exceed the nominal size. If the probability is higher, then this size distortion can be regarded as spurious regression.
It is well known that OLS produces a high probability of spurious regression which increases with the increase in sample size [2]. On the other hand, since the Ghouse equation contains all the true determinants of regressand, we hope that ARDL performs better. The size analysis is performed to quantify the distortion in probability of type I error. It can be expressed in following way: .
In this study, size analysis is used to estimate the probability of spurious regression after employing conventional methods and the Ghouse equation with different specification. For this analysis, the independent autoregressive stationary and nonstationary time series are being generated with different specification, without drift and trend, without drift, with drift and with drift and trend. Suppose two independent autoregressive series x and y are being generated, after that regress on , if the results are significant, it indicates that regression produces spurious results. All the results in Table 1, Table 2 and Table 3 came after 100,000 simulations. The two independent autoregressive nonstationary series are generated using the above data-generating process in Equation (6). We estimate the following regression:
The probability of getting significant would be the actual size, which is different from nominal size. It would be considered as the probability of spurious regression. Below is the summary of actual empirical size and the probability of spurious regression given in Table 1, Table 2 and Table 3.
Size Analysis with Nonstationary Series
These data are generated with pre-decided specifications, and the probability of spurious regression is being tested using classical methods and with the Ghouse equation. The two independent autoregressive non-stationary series are generated using Equation (10). Figure 1 given below is based on the results of Table 1. In this study, four different specification cases are used: series without drift and trend, without drift, with drift, and with drift and trend. For these cases, we impose the following logical restrictions on the data-generating process given in Equation (6):
Scenario 1: Generate two independent nonstationary series without drift and trend by imposing restriction on , and .
Scenario 2: Generate two independent nonstationary series without drift and trend by imposing restriction on , and .
Scenario 3: Generate two independent nonstationary series without drift and trend by imposing restriction on , and .
Scenario 4: Generate two independent nonstationary series without drift and trend by imposing restriction on and .
Figure 1 given below shows the probability of spurious regression on the basis of F-statistics for the coefficients of independent variable of the ordinary least square (OLS) and the autoregressive distributed lag model. The F-stats are used for joint significance of current and lag values of independent variable for the Ghouse equation. When autoregressive parameters θ1 = θ2 are equal to 1, the series are nonstationary. This comparison is made on the different sample sizes. The panel (a) of Figure 1 is an independent nonstationary series without having drift and trend. After ruing regression with OLS, we obtained a 66.6% probability of spurious regression when the sample size is 50, and 78.2% and 86.3% when the sample size is 100 and 200, respectively. It supported the argument of ref. [2] that, as the sample size increased the independent nonstationary series, the probability of spurious regression also increased. While, at the sample size of 50, the Ghouse equation (1, 1) reduced this probability from 66.2% to just 6.2% and 78.2% to 6.5% for 100 and 86.3 to 6.5% for 200 sample sizes, respectively. This has very interesting implications in that the OLS increased in probability of spurious regression as the sample size increased, but the Ghouse equation retains its size in both small and large samples. The Ghouse equation (2, 2) represents the case of over specification. We intend to check its impact on the size of the test. The Ghouse equation (2, 2) also reduced this probability from 66%, 78.2%, and 86% to just around 6.7% for all sample sizes. This means over specification in the Ghouse equation model does not affect the size of the model.
Panel (b) is the case of independent nonstationary series having trend. The OLS regression generates 100% spurious regression for all sample sizes. While, the Ghouse equation (1, 1) significantly reduces this probability of spurious regression from 100% to around 80%, and ARDL (2, 2) gives more reduction which is around 55%. This means that the Ghouse equation with different specification significantly reduces the size distortion in the case of trend misspecification.
Panel (c) indicates the independent nonstationary series without trend. The OLS regression provides 100% probability of spurious regression on 50, 100, and 200 sample sizes. However, the Ghouse equation (1, 1) significantly reduces the probability of spurious regression from 100% to just 7%, 6.2%, and 6.4% for 50, 100, and 200 sample sizes, respectively. The Ghouse equation (2, 2) also reduced this probability of 100% to 7.5%, 7.4%, and 6.6% for 50, 100, and 200 sample sizes, respectively. The (d) panel of Figure 1 shows the case of independent nonstationary series with drift and trend. The Ghouse equation (1, 1) significantly reduces this probability of spurious regression from 100% to around 80%, while Ghouse equation (2, 2) reduces it even more (around 55%). This means that the Ghouse equation with different specification significantly reduces the size distortion in case of trend misspecification. The individual significance of the variables can be seen in Table 1 given below.
These results indicate that the Ghouse equation with specifications significantly reduces the size distortions. While, in the case of trend misspecification, the Ghouse equation drastically increases the probability of spurious regression but significantly reduces the sizes, as compared to OLS regression which can be seen in panel (b) and (d) in Table 1 and Figure 1. If this trend includes a test equation, it might be possible for it to reduce the size distortions efficiently.
Figure 2, based on the results of Table 3 given below, evaluates the robustness size misspecification of conventional cointegration procedures, i.e., Engle Granger, Johansen Juselius, and Ghouse equation, with different specifications. This figure shows four cases: two cases of correct specifications and two cases of incorrect specifications (over specification and under specification). The series and are of integrated order one: ~ d (1) and ~ d (1). The Monte Carlo simulations are used in this analysis. The results in Table 2 are summarized after 100,000-time simulations. The series are generated with a data-generating process in Equation (9). In this analysis, only independent nonstationary series are used with autoregressive parameter specification = 1 and = 1.
In our analysis, two cases of exact specification are considered: first, when the data-generating process and test equation both contain the drift term; and, second, when the data-generating process and test equation both contain the drift and trend term. The under specification is used when the data-generating process contains drift and trend, and when the test equation takes only drift terms. The over specification is used when the data-generating process contains drift, and when the test equation takes drift and trend terms.
The first case of the panel shows the correct specification case when both test equation and data-generating process take the drift term. The results indicate that the size of Engle Granger cointegration test is 21.3% which shows 16.3% size on the basis of a 5% nominal level of significance. The size of the Johansen Juselius test is 17% with 12% size distortion but the Ghouse Equation size is only 6.1%, which is within the limit of 1% to 10% level of the nominal level of significance. The second case of correct specification in panel (a) of Figure 2 concerns when the test equation and data generation process both have drift and trend term. The Engle Granger cointegration size is 20.1% which corresponds to a 15.1% size distortion, while the Johansen Juselius cointegration size is 19.5% with a 14.5% level of significance. The Ghouse equation size is only 8.4% with a 3.4% size distortion.
In both case of correct specification, the Engle Granger and Johansen Juselius show a huge size distortion while the Ghouse equation has very minor size distortion within the limit of a 1% to 10% level of significance, meaning it is negligible for size distortion.
The (b) panel of Figure 2 shows the results of misspecification. The first case corresponds to over specification (over specified). In this case, the test equation takes drift and trend, while the data generation process only takes drift. So, the model is over-specified. In this case, the size of Engle Granger is 15.7% with a 10.7% size distortion and the Johansen Juselius size is 8% with just a 3% size distortion. However, the Ghouse equation size is 7% with 2% negligible size distortion. The second case of panel (b) of Figure 2 displays the results of under specification, in which the test equation contains only drift but the data-generating process has drift and trend. This means that the test equation suffers in trend misspecification. The Engle Granger and Johansen Juselius cointegration procedures sizes are 25.8% and 20%, respectively. While, the size of the Ghouse equation increased drastically around 87%, with an 82.7% size distortion. This means that the Ghouse equation badly suffers in the trend misspecification case. It can be covered by including trend in a test equation, as we can see in the second case of the panel (a) of Figure 2.
In the first three cases, the Ghouse equation efficiently reduces the size distortions and performs better than the Engle Granger and Johansen Juselius cointegration procedures. However, the performance of the Ghouse equation is not good when the model suffers trend misspecification. This is because of the following specification reasons: the Engle Granger model based on ordinary least square regression only considers the contemporaneous effects, while the Johansen Juselius based on a vector autoregressive model only considers the lag value. However, the Ghouse equation is the most general model; it contains both current and lag values. That is why its performance is better than the other ones. For more results, the table is given below:
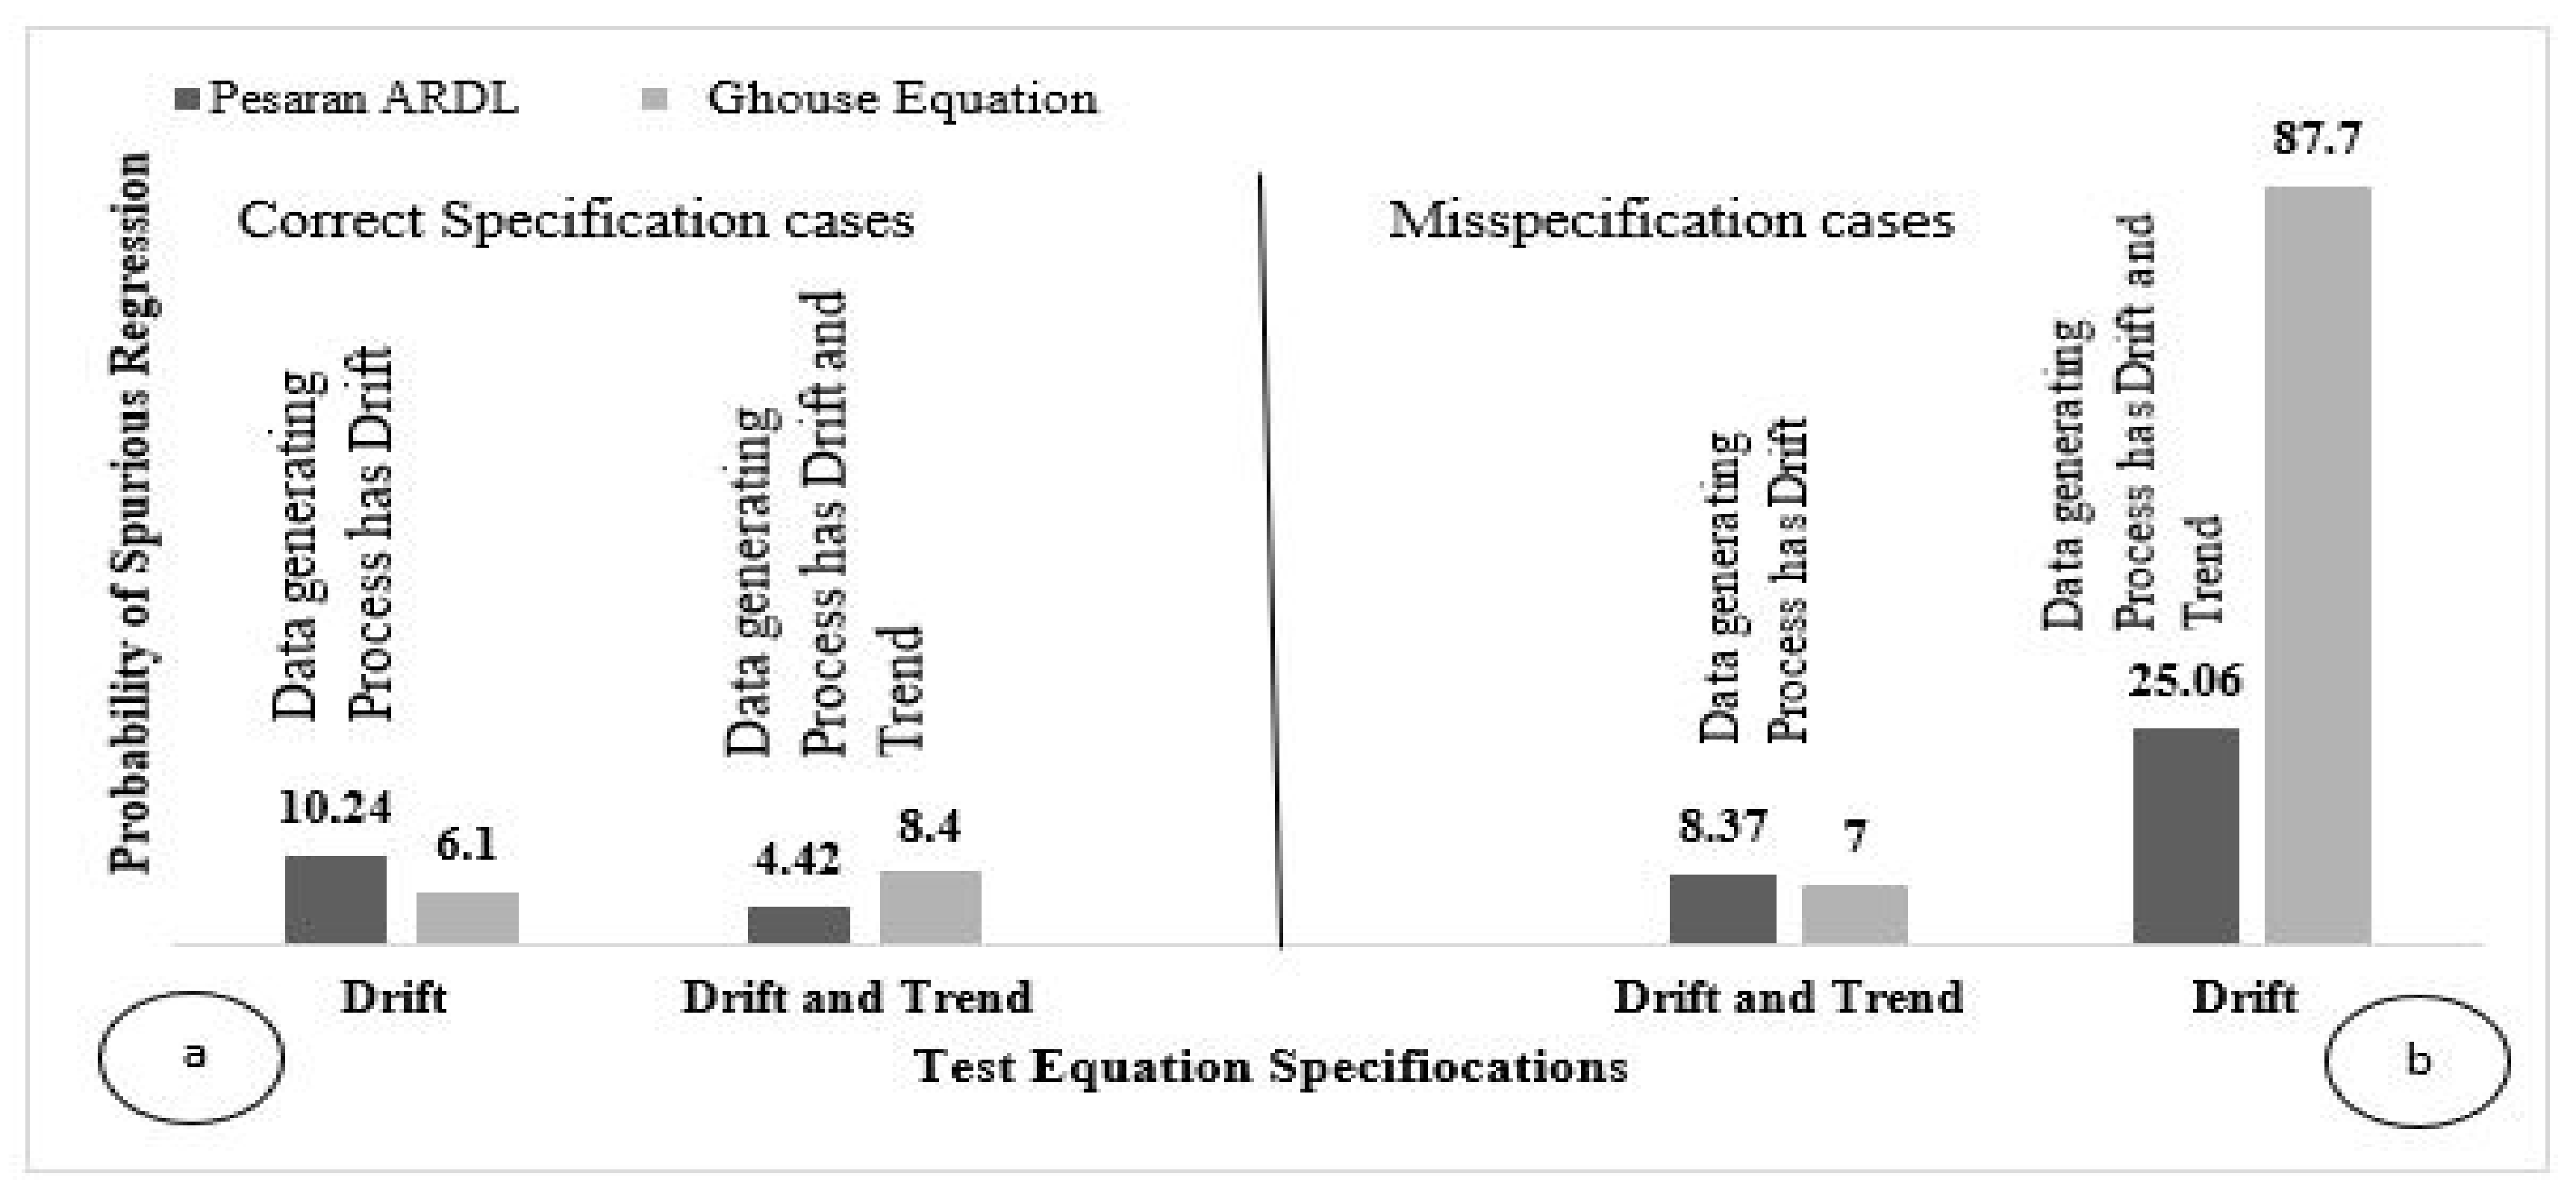
After comparison of the Ghouse equation with conventional cointegration procedures, we compare the sizes of the Ghouse equation and ARDL bound testing. For convenience, both procedures are written with the name of their producers. The detailed results of this comparison are given in Table 4, after 100,000 simulations, and Figure 3. As mentioned earlier, to check the robustness of size misspecification, we consider four cases.
The panel (a) of Figure 3 shows the results of correct specification cases while panel (b) displays the results of misspecification. The first case of panel (a) of Figure 3 shows the case of correct specification when both the test equation and data generation process have a drift term.
In this case, the size of Pesaran ARDL is 10.4% with a 5.4% size distortion at a 5% nominal level significance, while the Ghouse equation size is 6.1% with a 1.1% size distortion. This means that the actual level of significance of Pesaran ARDL is higher than the Ghouse equation. The size of the Ghouse equation is within the limit of 1% to 10% level of significance, but the Pesaran ARDL actual level of significance is beyond higher level of this limit. The second case of panel (a) is also of correct specification when the test equation and data-generating process both have a drift and trend term. In this case, the Pesaran ARDL obtains no size distortion, but the Ghouse Equation has 3.4% of size distortion which is very minor and within the limit, meaning it is negligible.
The panel (b) of Figure 3 shows the results of misspecification. The first case of panel (b) is about over specification where the test equation has drift and trend, while the data-generating process only has drift term. In this case, the size of Pesaran ARDL is 8.37% with a 3.37% level of significance. Whereas, the Ghouse equation size is 7% with just a 2% size distortion. The second case of panel (b) of Figure 3 is the case of under specification in which the test equation has drift, while the data-generating process has drift and trend. There is trend misspecification in the models. The size of Pesaran ARDL is around 25% with a 20.06% size distortion. On the other hand, the Ghouse equation does not perform in a better way, as we have seen in all previous cases of trend misspecification. The size of the Ghouse equation is around 87% with an 82% size distortion.
The results of the Ghouse equation performs well in three cases, but not in the fourth case because it badly suffers in trend misspecification. The detailed results are given in Table 3 below.
The results indicate that the Ghouse equation model performs better than Pesaran ARDL in terms of correct specification and over specification; however, in the case of under specification, the Ghouse equation failed to perform due to trend misspecification.
4. Concluding Remarks
The conventional econometrics literature considers nonstationarity as the only reason for spurious regression and propose unit root and cointegration procedures to handle this problem. These procedures are unable to tackle the problem of spurious regression in a nonstationary time series. We offer an alternative procedure for the treatment of this problem in a nonstationary time series.
The results concluded that the unit root and commonly used cointegration procedures ordinarily provide misleading results, as we have seen in size analysis. These procedures provide unreliable results due to some specification decisions. The specification decisions made, based on classical model selection techniques, often provide spurious results in time series data.
The underlying reason may be that, in the case of nonstationarity, these model specification techniques become worthless. The conventional econometric method OLS suffers a considerable size distortion problem when the series has a unit root. On the other hand, the Ghouse equation has no size distortion problem. It should be noted, however, that under specification—when the data-generating process contains a linear trend, but the trend is not included in the regression model—then both the OLS and the Ghouse equation suffer in size distortion. Regardless, even under the case of specification, the Ghouse equation significantly reduces the probability of spurious regression, as compared to OLS.
The commonly used conventional cointegration procedures, i.e., Engle Granger, Johansen Juselius, and Pesaran ARDL, all have size distortion problems, even in the case of correct specifications. The Ghouse equation does not show a size problem in the case of correct specification. In the case of over specification, conventional cointegration procedures show a size problem, whereas the Ghouse equation has no size problem. Nonetheless, under specification, the Ghouse equation suffers in severe size distortion problem as compared to the conventional cointegration test. This clarifies that the Ghouse equation is the most robust model in terms of correct and over specification, but not in under specification. There are some limitations to this study. First, the data-generating process used in this study is only based on two variables, meaning that all the experiments are carried out on bivariate regression, however, in the case of multivariate analysis, the results might be varied to some extent. Second, this study only deals with autoregressive process, but this study should be analyzed with autoregressive moving as the average method.
Author Contributions
Conceptualization, G.G., A.U.R. and S.A.K.; methodology, G.G., A.U.R. and M.I.B.; software, G.G.; validation, G.G., S.A.K., A.U.R. and M.I.B.; formal analysis, G.G.; investigation, G.G. and M.I.B.; resources, data curation; writing—original draft preparation, G.G.; writing—review and editing, G.G., S.A.K., A.U.R. and M.I.B.; visualization and supervision, S.A.K., A.U.R. and M.I.B. All authors have read and agreed to the published version of the manuscript.
Funding
This research received no external funding.
Institutional Review Board Statement
Not applicable.
Informed Consent Statement
Not applicable.
Data Availability Statement
Not applicable.
Acknowledgments
We’re thankful to handling editor, anonymous referees and our respective institutions for providing excellent research facilities in terms of time allocation which enables to conduct research.
Conflicts of Interest
The authors declare no conflict of interest.
References
- Yule, G.U. Why do we sometimes get Nonsense-Correlations between Time-Series? A Study in Sampling and the Nature of Time-Series. J. R. Stat. Soc. 1926, 89, 1–63. [Google Scholar] [CrossRef]
- Granger, C.W.; Newbold, P. Spurious Regressions in Econometrics. J. Econom. 1974, 2, 111–120. [Google Scholar] [CrossRef] [Green Version]
- Nelson, C.R.; Plosser, C.R. Trends and Random Walks in Macroeconmic Time Series: Some Evidence and Implications. J. Monet. Econ. 1982, 10, 139–162. [Google Scholar] [CrossRef]
- Rehman, A.U.R.; Zaman, A. Model Specification, Observational Equivalence and Performance of Unit Root Tests; University Library of Munich: München, Germany, 2008; p. 13489. [Google Scholar]
- Simon, H.A. Spurious Correlation: A Causal Interpretation. J. Am. Stat. Assoc. 1954, 49, 467–479. [Google Scholar]
- Hendry, D.F. Econometrics—Alchemy or Science? Economica 1980, 47, 387–406. [Google Scholar] [CrossRef]
- Plosser, C.I.; Schwert, G.W. Money, Income, and Sunspots: Measuring Economic Relationships and the Effects of Differencing. J. Monet. Econ. 1978, 4, 637–660. [Google Scholar] [CrossRef]
- Phillips, P.C. Understanding Spurious Regressions in Econometrics. J. Econom. 1986, 33, 311–340. [Google Scholar] [CrossRef] [Green Version]
- Dar, N.A.; Bhat, G.A.; Shah, I.A.; Iqbal, B.; Kakhdoomi, M.A.; Nisar, I.; Rafiq, R.; Iqbal, S.T.; Bhat, A.B.; Nabi, S.; et al. Hookah smoking, nass chewing, and oesophageal squamous cell carcinoma in Kashmir, India. Br. J. Cancer 2012, 107, 1618–1623. [Google Scholar] [CrossRef] [Green Version]
- Chaouachi, K. False Positive Result in Study on Hookah Smoking and Cancer in Kashmir: Measuring Risk of Poor Hygiene Is Not the Same as Measuring Risk of Inhaling Water Filtered Tobacco Smoke All Over the World. Br. J. Cancer 2013, 108, 1389–1390. [Google Scholar] [CrossRef] [Green Version]
- Sapsford, R.; Jupp, V. Data Collection and Analysis; Sage: Newbury Park, CA, USA, 2006; ISBN 0-7619-4362-5. [Google Scholar]
- Höfer, T.; Hildegard, P.; Silvia, V. New Evidence for the Theory of the Stork. Paediatr. Perinat. Epidemiol. 2004, 18, 18–22. [Google Scholar] [CrossRef] [PubMed]
- Engle, R.F.; Granger, C.W. Co-integration and Error Correction: Representation, Estimation, and Testing. Econom. J. Econom. Soc. 1987, 55, 251–276. [Google Scholar] [CrossRef]
- Engle, R.; Yoo, S. Forecasting and Testing in Co-Integrated Systems. In Long Run Economic Relationships: Readings in Cointegration; Engle, R.F., Granger, C.W.J., Eds.; Oxford University Press: New York, NY, USA, 1991; Volume 35, pp. 237–267. [Google Scholar]
- Johansen, S.; Juselius, K. Testing Structural Hypotheses in a Multivariate Cointegration Analysis of the PPP and the UIP for the UKG. J. Econom. 1992, 53, 211–244. [Google Scholar] [CrossRef]
- Phillips, P.C.; Ouliaris, S. Asymptotic Properties of Residual Based Tests for Cointegration. Econom. J. Econom. Soc. 1990, 58, 165–193. [Google Scholar] [CrossRef] [Green Version]
- Pesaran, M.H. The Role of Economic Theory in Modelling the Long Run. Econ. J. 1997, 107, 178–191. [Google Scholar] [CrossRef]
- Pesaran, M.H.; Smith, R. Estimating Long-Run Relationships from Dynamic Heterogeneous Panels. J. Econom. 1995, 68, 79–113. [Google Scholar] [CrossRef]
- Agunloye, O.K.; Shangodoyin, D.K. Lag Length Specification in Engle-Granger Cointegration Test: A Modified Koyck Mean Lag Approach Based on Partial Correlation. Stat. Transit. New Ser. 2014, 15, 559–572. [Google Scholar]
- Gutierrez, C.E.; Souza, R.C.; de Carvalho Guillén, O.T. Selection of Optimal Lag Length in Cointegrated VAR Models with Weak form of Common Cyclical Features. Braz. Rev. Econom. 2009, 29, 59–78. [Google Scholar] [CrossRef] [Green Version]
- Ahking, F.W. Model Mis-Specification and Johansen’s Co-integration Analysis: An Application to the US Money Demand. J. Macroecon. 2002, 24, 51–66. [Google Scholar] [CrossRef]
- Leybourne, S.J.; Newbold, P. Spurious Rejections by Cointegration Tests Induced by Structural Breaks. Appl. Econ. 2003, 35, 1117–1121. [Google Scholar] [CrossRef]
- Choi, C.Y.; Hu, L.; Ogaki, M. A Spurious Regression Approach to Estimating Structural Parameters. In Proceedings of the North American Winter Meetings, San Diego, CA, USA, 3–5 January 2004. [Google Scholar]
- Diebold, F.X.; Senhadji, A.S. The Uncertain Unit Root in Real GNP: Comment. Am. Econ. Rev. 1996, 86, 1291–1298. [Google Scholar]
- Papell, D.H.; Prodan, R. Restricted Structural Change and the Unit Root Hypothesis. Econ. Inq. 2007, 45, 834–853. [Google Scholar] [CrossRef] [Green Version]
- Perron, P. Testing for a Unit Root in a Time Series with a Changing Mean. J. Bus. Econ. Stat. 1990, 8, 153–162. [Google Scholar]
- Zivot, E.; Andrews, D.W.K. Further Evidence on the Great Crash, the Oil-Price Shock, and the Unit-Root Hypothesis. J. Bus. Econ. Stat. 1992, 10, 251–270. [Google Scholar]
- Kilian, L.; Ohanian, L.E. Unit Roots, Trend Breaks, And Transitory Dynamics: A Macroeconomic Perspective. Macroecon. Dyn. 2002, 6, 614–632. [Google Scholar] [CrossRef]
- Murray, C.J.; Nelson, C.R. The Great Depression and Output Persistance. J. Money Credit. Bank. 2002, 34, 1090–1098. [Google Scholar] [CrossRef]
- Rudebusch, G.D. The Uncertain Unit Root in Real GNP. Am. Econ. Rev. 1993, 83, 264–272. [Google Scholar]
- Charemza, W.W.; Deadman, D.F. New Directions in Econometric Practice; Edward Elgar Publishing: Cheltenham, UK, 1997. [Google Scholar]
- Hendry, D.F.; Pagan, A.R.; Sargan, J.D. Dynamic Specification. Handb. Econom. 1984, 2, 1023–1100. [Google Scholar]
- Hendry, D.F.; Richard, J.F. The Econometric Analysis of Economic Time Series. Int. Stat. Rev. 1983, 51, 111–148. [Google Scholar] [CrossRef]
- Granger, C.W. Some Properties of Time Series Data and Their Use in Econometric Model Specification. J. Econom. 1981, 16, 121–130. [Google Scholar] [CrossRef]
- Perron, P.; Campbell, J.Y. A note on Johansen’s cointegration procedure when trends are present. In New Developments in Time Series Econometrics; Physica HD: Heidelberg, Germany, 1994; pp. 221–233. [Google Scholar] [CrossRef]
- Podivinsky, J.M. Testing Misspecified Cointegrating Relationships. Econ. Lett. 1998, 60, 1–9. [Google Scholar] [CrossRef]
- Harris, D. Principal Components Analysis of Cointegrated Time Series. Econom. Theory 1997, 13, 529–557. [Google Scholar] [CrossRef]
- Stock, J.H.; Watson, M.W. Testing for Common Trends. J. Am. Stat. Assoc. 1988, 83, 1097–1107. [Google Scholar] [CrossRef]
Figure 1.
Probability of spurious regression with OLS and Ghouse equation. (a) an independent nonstationary series without having drift and trend; (b) the case of independent nonstationary series having trend; (c) the independent nonstationary series without trend; (d) the case of independent nonstationary series with drift and trend.

Figure 2.
The size comparison among Ghouse equation, Engle Granger, and Johansen Juselius procedures. (a) both test equation and data-generating process take the drift term; (b) the test equation takes drift and trend, the data generation process takes drift.
Figure 2.
The size comparison among Ghouse equation, Engle Granger, and Johansen Juselius procedures. (a) both test equation and data-generating process take the drift term; (b) the test equation takes drift and trend, the data generation process takes drift.
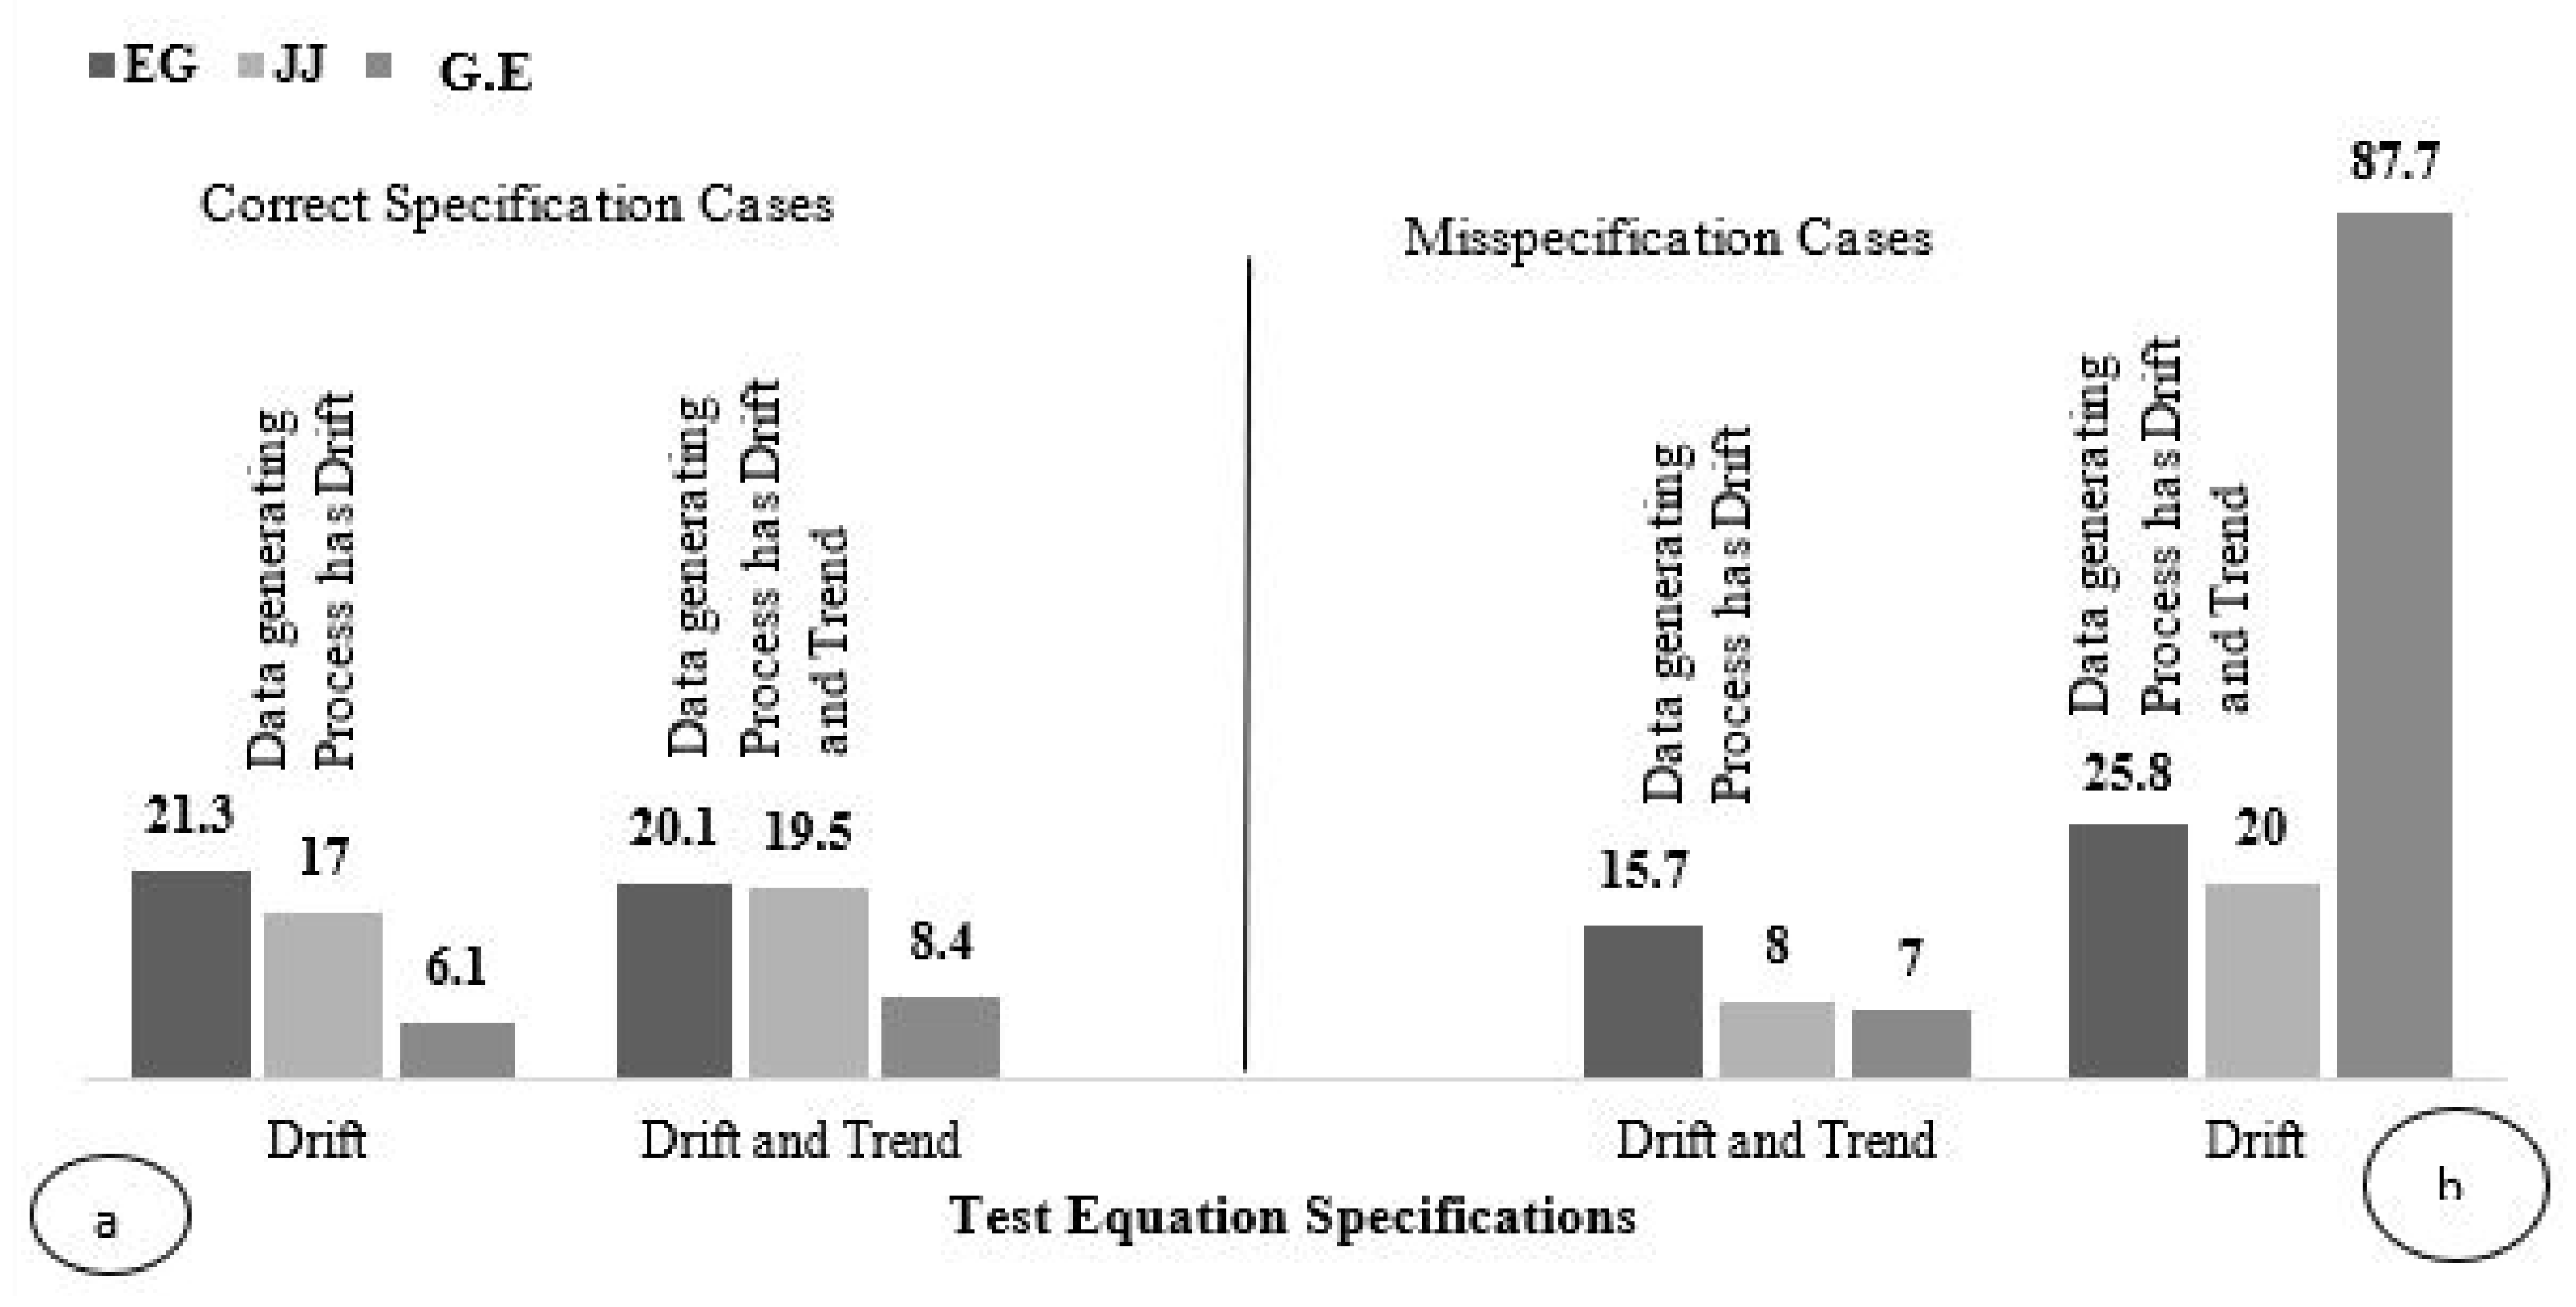
Figure 3.
The size comparison between Pesaran ARDL and the Ghouse equation. (a) the results of correct specification cases; (b) the results of misspecification.
Figure 3.
The size comparison between Pesaran ARDL and the Ghouse equation. (a) the results of correct specification cases; (b) the results of misspecification.

Table 1.
Probability of spurious regression with OLS and Ghouse equation.
| OLS | G.E (1, 1) | G.E (2, 2) | |||||||||
|---|---|---|---|---|---|---|---|---|---|---|---|
| Xt | Xt | xt−1 | yt−1 | F-stat | Xt | xt−1 | xt−2 | yt−1 | yt−2 | F-stat | |
| N | = 0 | ||||||||||
| 50 | 66.6 | 6.6 | 6.6 | 100.0 | 6.4 | 7.3 | 6.2 | 7.0 | 100.0 | 7.0 | 6.7 |
| 100 | 78.2 | 6.1 | 6.5 | 99.7 | 6.5 | 7.2 | 6.1 | 7.0 | 100.0 | 7.3 | 6.7 |
| 200 | 86.3 | 6.0 | 6.6 | 95.8 | 6.5 | 7.3 | 6.1 | 6.9 | 100.0 | 6.9 | 6.8 |
| N | = 0 | ||||||||||
| 50 | 100.0 | 94.9 | 81.8 | 100.0 | 80.4 | 75.4 | 7.8 | 36.2 | 100.0 | 56.0 | 55.3 |
| 100 | 100.0 | 93.0 | 80.0 | 100.0 | 81.5 | 75.2 | 8.1 | 35.1 | 100.0 | 58.3 | 56.6 |
| 200 | 100.0 | 93.1 | 81.1 | 100.0 | 81.0 | 76.8 | 7.9 | 35.6 | 100.0 | 60.2 | 56.4 |
| N | = 0 | ||||||||||
| 50 | 100.0 | 6.1 | 8.0 | 100.0 | 7.0 | 8.3 | 6.3 | 8.2 | 100.0 | 6.4 | 7.5 |
| 100 | 100.0 | 6.1 | 6.4 | 100.0 | 6.2 | 7.5 | 6.5 | 8.6 | 100.0 | 6.6 | 7.4 |
| 200 | 100.0 | 6.3 | 7.2 | 100.0 | 6.4 | 7.6 | 6.6 | 8.4 | 100.0 | 6.5 | 6.6 |
| N | 0 | ||||||||||
| 50 | 100.0 | 95.9 | 83.1 | 100.0 | 81.7 | 76.8 | 7.6 | 36.7 | 100.0 | 55.9 | 56.6 |
| 100 | 100.0 | 93.5 | 83.4 | 100.0 | 80.9 | 76.3 | 7.4 | 33.2 | 100.0 | 56.1 | 56.3 |
| 200 | 100.0 | 94.1 | 83.5 | 100.0 | 82.3 | 77.1 | 8.3 | 35.8 | 100.0 | 55.6 | 57.2 |
Table 2.
Specific Cases of Data Generating Process and Test Equation.
| Specification Cases | |||
|---|---|---|---|
| Data-Generating Process | |||
| Drift | Drift and Trend | ||
| Test Equation | Drift | Exactly Specified | Under Specified |
| Drift and Trend | Over Specified | Exactly Specified | |
Table 3.
Probability of spurious regression with Engle and Granger, Johansen and Juselius cointegration tests, and the Ghouse equation.
Table 3.
Probability of spurious regression with Engle and Granger, Johansen and Juselius cointegration tests, and the Ghouse equation.
| Engle Granger (EG) Cointegration Test | |||
| Data Generating Process | |||
| Drift | Drift and Trend | ||
| Test Equation | Drift | 21.3 | 25.8 |
| Drift and Trend | 15.7 | 20.1 | |
| Johansen and Juselius (JJ) Cointegration Test | |||
| Data Generating Process | |||
| Drift | Drift and Trend | ||
| Test Equation | Drift | 17 | 20 |
| Drift and Trend | 8 | 19.5 | |
| ARDL Model | |||
| Data Generating Process | |||
| Drift | Drift and Trend | ||
| Test Equation | Drift | 6.1 | 87.7 |
| Drift and Trend | 7 | 8.4 | |
Table 4.
Probability of spurious regression with Pesaran ARDL bound testing and the Ghouse equation.
Table 4.
Probability of spurious regression with Pesaran ARDL bound testing and the Ghouse equation.
| Pesaran ARDL Model Test | |||
|---|---|---|---|
| Data-Generating Process | |||
| Drift | Drift and Trend | ||
| Test Equation | Drift | 10.24 | 25.06 |
| Drift and Trend | 8.37 | 4.42 | |
| Ghouse Equation | |||
| Data-Generating Process | |||
| Drift | Drift and Trend | ||
| Test Equation | Drift | 6.1 | 87.7 |
| Drift and Trend | 7 | 8.4 | |
Publisher’s Note: MDPI stays neutral with regard to jurisdictional claims in published maps and institutional affiliations. |
© 2021 by the authors. Licensee MDPI, Basel, Switzerland. This article is an open access article distributed under the terms and conditions of the Creative Commons Attribution (CC BY) license (https://creativecommons.org/licenses/by/4.0/).
Share and Cite
MDPI and ACS Style
Ghouse, G.; Khan, S.A.; Rehman, A.U.; Bhatti, M.I. ARDL as an Elixir Approach to Cure for Spurious Regression in Nonstationary Time Series. Mathematics 2021, 9, 2839. https://doi.org/10.3390/math9222839
AMA Style
Ghouse G, Khan SA, Rehman AU, Bhatti MI. ARDL as an Elixir Approach to Cure for Spurious Regression in Nonstationary Time Series. Mathematics. 2021; 9(22):2839. https://doi.org/10.3390/math9222839
Chicago/Turabian StyleGhouse, Ghulam, Saud Ahmad Khan, Atiq Ur Rehman, and Muhammad Ishaq Bhatti. 2021. "ARDL as an Elixir Approach to Cure for Spurious Regression in Nonstationary Time Series" Mathematics 9, no. 22: 2839. https://doi.org/10.3390/math9222839
Note that from the first issue of 2016, this journal uses article numbers instead of page numbers. See further details here.