Article

Modeling and Simulation Techniques Used in High Strain Rate Projectile Impact

Air Force Institute of Technology, Wright-Patterson AFB, Dayton, OH 45433, USA
*
Author to whom correspondence should be addressed.
Mathematics 2021, 9(3), 274; https://doi.org/10.3390/math9030274
Submission received: 2 December 2020 / Revised: 13 January 2021 / Accepted: 18 January 2021 / Published: 30 January 2021
(This article belongs to the Special Issue Applied Mathematics and Computational Physics)

Abstract

:
A series of computational models and simulations were conducted for determining the dynamic responses of a solid metal projectile impacting a target under a prescribed high strain rate loading scenario in three-dimensional space. The focus of this study was placed on two different modeling techniques within finite element analysis available in the Abaqus software suite. The first analysis technique relied heavily on more traditional Lagrangian analysis methods utilizing a fixed mesh, while still taking advantage of the finite difference integration present under the explicit analysis approach. A symmetry reduced model using the Lagrangian coordinate system was also developed for comparison in physical and computational performance. The second analysis technique relied on a mixed model that still made use of some Lagrangian modeling, but included smoothed particle hydrodynamics techniques as well, which are mesh free. The inclusion of the smoothed particle hydrodynamics was intended to address some of the known issues in Lagrangian analysis under high displacement and deformation. A comparison of the models was first performed against experimental results as a validation of the models, then the models were compared against each other based on closeness to experimentation and computational performance.

1. Introduction

High strain rate impact testing entails the high velocity collision of a projectile with a target, then observing the effects of the interaction. This is primarily done in terms of deformation and fragmentation, considering both the projectile and target, and evaluating the target failure pattern and projectile penetration depth [1]. Due to the expense of these impact experiments, especially considering the rising interest in hyper-velocity ballistic applications, much of this research must be done utilizing numerical and computational modeling and simulation methods [2]. Modeling and simulation of impact scenarios is complicated, involving the evaluation of several non-linear steps, such as contact between the projectile and target, high strain rates near the impact region, stress wave propagation through both projectile and target, and material deformation and separation. Due to these complexities, high strain rate impact has predominantly been modeled in two-dimensional space, only recently expanding into three dimensions with moderate success of correlating deformation with variation in impact velocity and projectile shape [3,4]. Progression into three-dimensional simulation is important to accurately characterize projectile impact, since in the real world impacts almost always occur across all three dimensions. Oblique impact, translation, and rotation all play a significant role in the outcome of an impact scenario, and these conditions can only truly be represented in three-dimensional space. Due to the overall complexity of the impact scenarios and expansion into three dimensions, being further combined with varied sources of non-linearity, it is essential to perform model validation. A thorough impact evaluation provides the validation of numerical failure models through the assessment of the energy absorbed during impact, penetration depth in a thick target or residual velocity of the projectile in the thin target, and the measured deformation of both projectile and target [5].
There have been several numerical methods devised to provide insight and evaluate an impact event, two of the more prevalent methods used to simulate and model impacts are the meshed finite elements and mesh-free discrete elements. The finite element method (FEM) has successfully been used to simulate and model impacts beyond a one-dimensional representation. Johnson first introduced two-dimensional and three-dimensional Lagrangian numerical models to simulate high velocity impact, noting that the elements were subjected to large distortions that required significant remeshing, which introduced error into the solution [6,7]. Utilizing two-dimensional FEM, Gailly and Espinosa were able to create an impact model that correlated well with experimental results at increased impact velocities, up to 1450 m per second [8]. Following the work of Gailly and Espinosa, Kurtaran et al. demonstrated that FEM is also capable of providing relatively accurate three-dimensional simulations at increased velocities, up to 1500 m per second [3]. As computing power increases, the use of three-dimensional FEM in modeling impact has also increased, with work expanding into impact modeling of fiber reinforced composites [9,10], concrete beams [11], and thin target perforation [12,13].
The second numerical method for analyzing impacts, which has been gaining renewed interest, is the Discrete Element Method (DEM). Although Cundall and Strack first suggested the use of the DEM in 1979 as a numerical method to evaluate the stresses and strains within a continuum of discontinuous materials [14], it was not until the early 1990s that it began to gain influence in impact modeling. Libersky et al. first adapted the Smoothed Particle Hydrodynamics (SPH) methodology within DEM to model the dynamic response of solids [15,16], later adapting their model to simulate high velocity impact [17]. Johnson et al. were some of the first to incorporate SPH into a computational model for impact simulation, which was used to address the severe distortions noted in traditional FEM [18]. The authors later introducing a normalized smoothing function into their algorithm which scoped the region of particle interaction within a coupled FEM-SPH model [19]. More recently, SPH modeling techniques have expanded into simulation of hypervelocity impact [20,21], penetration of ballistic gelatin [22,23], perforation of layered targets [24], and use of granular media [25,26]. Much of this work has remained in two-dimensional space as the computational requirements for modeling in three-dimensions are still high.
Within the Air Force Institute of Technology (AFIT), FEM has been used successfully in related impact analysis efforts preceding the current research effort. The previous work focused on two-dimensional stress field analysis for use in topology optimization of an additively manufactured projectile impacting a concrete target [27], expansion of the impact scenario to multiple target sets [28], inclusion of a multi-material projectile [29], and inclusion of a lattice substructure within the projectile wall [30]. The current line of research is expanding the high strain rate impact scenario to three dimensions with the inclusion of a lattice section into the projectile to aid in impact energy absorption and stress wave management [31,32]. Impact testing will also be used to determine the dynamic material properties of the lattice designs, along with characterizing plasticity and damage modeling parameters. With an emphasis on high strain rate impact, one of the first steps taken in this research was to develop and validate a three-dimensional physics based computational model capable of accurately representing the impact environment. As part of the modeling effort, an analysis between two particular techniques, traditional Lagrangian finite elements and SPH discrete methods, was performed to investigate the differences in methodology, modeling, and analysis capabilities.

2. Methodology

FEM is a numerical method used to find the solution to boundary value problems. FEM grew out of the aerospace industry in the 1960s, as a method for performing stress and thermal analysis on complex aircraft, rocket, and engine parts [33]. FEM uses the concept of discretization, by applying a fixed mesh, to divide a body into smaller units, finite elements, which are interconnected across shared nodes or boundaries. Applicable field quantities are approximated across the entire structure through piecewise element interpolation and summation [34].
FEM has been used with success to describe the failure modes of brittle materials during ballistic penetration, finding where transition from micro-cracking to pulverization occurs in ceramic armor [8]. Utilizing FEM techniques, two-dimensional impact models have been created that showed good correlation with experimental results even at higher impact velocities, up to 1450 m per second. More recently, FEM has proven capable of providing relatively accurate three-dimensional simulations at increased velocities, modeling the deformation patterns of projectile and target up to 1500 m per second, as well as showing the effects of thermal softening in target deformation at the higher velocities [3]. As demonstrated by the aforementioned studies, one benefit of FEM over other impact modeling techniques is the relative computational ease to perform simulations in both two and three dimensions while maintaining good correlation with experimental and real-world results.
Since Dassault Systèmes Abaqus finite element software was used as the primary means of computational analysis within this study, the specific applications and mathematical representations used within Abaqus are highlighted within the described theory and application sections.

2.1. Lagrangian Finite Element Analysis

Finite Element Analysis (FEA) is the numerical method for solving complex boundary value problems where analytical solutions may not be able to be obtained utilizing FEM. Within FEA, the explicit approach is most useful in solving problems that result in large deformations or are highly time dependent. Instead of solving the traditional finite element problem of global mass and stiffness matrices, the explicit technique solves Newton’s Second Law of Motion, F = m a for each element. This relies on a half-step time integration technique that evaluates a known nodal solution of displacement and acceleration component vectors at set time t with the velocity components at time t 1 2 [34]. This solution is then iterated with the next time increment, Δ t . This analysis technique is formulated as an initial value problem that is capable of determining how a system evolves given an initial loading condition and position. Explicit analysis was required to be used in this study since it deals with the time dependent behavior of materials, the high strain rate effects of impact, and the progression of a wave through the system.
The explicit analysis approach, in order to account for the deformation rate and stress wave propagation of impact, must consider displacement, velocity, and acceleration on a node by node basis within the structure with respect to time. Abaqus incorporates a finite difference scheme incorporating central difference time integration (CDTI) that is used to calculate nodal field variables as the time step is incremented along with the use of lumped mass matrices. As this is a three-dimensional problem, the nodes create three-dimensional solid elements, which were represented by eight-noded stress bricks with reduced integration, or C3D8R elements, in this implementation. The C3D8R is considered a general purpose three-dimensional linear element with a single integration point. The reduced integration allows the element to overcome the shear locking issue prevalent in the full integration element, C3D8, under high values of plasticity. Shear locking is prevalent in all first-order, fully integrated solid elements, where the element cannot exhibit pure bending [35]. The failure to exhibit pure bending deformation leads to parasitic shear strain developed alongside the bending strain, where strain energy is absorbed by the shear strain causing the element to appear too stiff. Reduced integration of the element limits the development of parasitic shear strain. The first step in the CDTI process, using a half-step central differences scheme, is to create a force balance using the equations of motion at time t, then the acceleration values at time t are used to determine the nodal velocities at time t + Δ t 2 , which is then, in turn, used to determine the displacements at time t + Δ t . This process is repeated throughout the time interval of interest, and evaluates deformation and stress wave propagation through the part. In this implementation of CDTI, the expressions for displacement ( d ) , velocity ( d ˙ ) and acceleration ( d ¨ ) are given by Equation (1), Equation (2) and Equation (3) respectively [36].
d ( i + 1 ) = d ( i ) + Δ t ( i + 1 ) d ˙ ( i + 1 2 )
d ˙ ( i + 1 2 ) = d ˙ ( i 1 2 ) + Δ t ( i + 1 ) + Δ t ( i ) 2 d ¨ ( i )
d ¨ ( i ) = M 1 ( F ( i ) R ( i ) ) .
In these equations, the subscript i is the time increment number, and therefore i 1 2 and i + 1 2 refer to the mid-increment values, Δ t refers to the time step, M is the lumped mass matrix, and F is applied external load vector and R is the internal force vector [35]. The internal force vector is determined through an analysis of the element stress-strain relations.
In FEA, elemental strain, ε is determined from displacement through utilization of the strain-displacement matrix, shown in Equation (4).
ε = B u ( i )
The strain-displacement matrix, B, relates the displacements to the element strain component based on the derivatives of the element shape functions, or basis functions. The shape functions used by the C3D8R element are shown in their isoparametric form in Equation (5). In the isoparametric form, the reference coordinate system is changed to a natural coordinate system, where the element coordinates range from 1 to 1 regardless of the global element position. Here ξ , η , and ζ represent the element’s x, y, and z isoparametric coordinates respectively.
N 1 = 1 8 ( 1 ξ ) ( 1 η ) ( 1 + ζ ) N 2 = 1 8 ( 1 ξ ) ( 1 η ) ( 1 ζ ) N 3 = 1 8 ( 1 ξ ) ( 1 + η ) ( 1 + ζ ) N 4 = 1 8 ( 1 ξ ) ( 1 + η ) ( 1 ζ ) N 5 = 1 8 ( 1 + ξ ) ( 1 η ) ( 1 + ζ ) N 6 = 1 8 ( 1 + ξ ) ( 1 η ) ( 1 ζ ) N 7 = 1 8 ( 1 + ξ ) ( 1 + η ) ( 1 + ζ ) N 8 = 1 8 ( 1 + ξ ) ( 1 + η ) ( 1 ζ )
Thus, the strain-displacement matrix for this element can be found using the relationship shown in Equation (6), where the partial derivatives are taken within respect to the isoparametic coordinates found in the shape functions N i presented in Equation (5).
B = ] N
The strain determined from Equation (4) is the total strain, which is comprised of both the elastic and viscoplastic strain. Elastic strain is the deformation that is fully recoverable, and therefore is not reliant on deformation history. Viscoplastic strain on the other hand is not fully recoverable and results in permanent deformation, which means that is does rely on deformation history. Elastic strain is required to determine the internal force vector and is given by Equation (7).
ε e = ε t o t a l ε v p ( i )
where ε v p ( i ) is the viscoplastic strain at time increment i. The viscoplastic strain is determined through evaluation of a chosen plasticity model and determined in a later step of the explicit analysis. Having the elastic strain, the stress can now be determined through application of Hooke’s Law, see Equation (8).
σ = E ε e = E ( ε t o t a l ε v p )
Here E is the stress-strain relationship matrix, or elasticity matrix, which relates stress and strain through the Elastic Modulus, Shear Modulus, and Poisson’s Ratio. Figure 1 depicts a typical stress-strain curve with the total strain separated into viscoplastic and elastic strain components. As shown here, the viscoplastic strain is taken as the permanent set, or unrecoverable strain, when the curve is unloaded along the linear elastic slope. The recovered strain is the elastic strain portion, and that strain when multiplied by the elastic modulus provides the stress value at the total strain value as depicted. Therefore the stress is only reliant on the elastic strain and elastic matrix.
Once the stress has been calculated, the internal force vector can be found using Equation (9), which is used to determine the acceleration in Equation (3) through a nodal force balance.
R = V B T σ d V
In this integral, V represents the element volume at the current time step. The evaluation to determine R is based on the original shape elements, and as the elements deform the nodal integration across the volume is distorted when utilizing the Lagrangian coordinate systems for the B matrix. This allows for the development of errors within the solution. Abaqus uses the Eulerian coordinate system for certain functions, which is able to avoid significant distortion, to overcome this problem, although the coordinate transformations still introduce some error in this step. This error will ultimately be realized in the resultant nodal displacements determined through use of the CDTI Equations (1)–(3).
Plasticity is determined through an incremental approach, an associated flow rule, that is characterized through the use of an incremental stress function, the effective stress, and an incremental plastic strain function, the effective strain increment. For this impact study, the Johnson-Cook Flow Rule will be utilized, which allows for determination of the viscoplastic strain. The Johnson-Cook Flow Rule Condition evaluates the relationship between the Johnson-Cook Flow Stress and Static Stress, it is given by Equation (10). The Johnson-Cook equations are represented here as one-dimensional functions, when in reality they are multi-dimensional, but hold the same relationships as presented.
σ ¯ y σ ¯ 0 .
σ ¯ y is the Johnson-Cook Flow Stress is given by Equation (11), and σ ¯ 0 is the Static Stress, given by Equation (12) [37].
σ ¯ y = A + B ( ε ¯ v p ) n 1 + C ln ε ¯ ˙ v p ε ¯ ˙ 0 1 ( T * ) m
σ ¯ 0 = [ A + B ( ε ¯ v p ) n ] [ 1 ( T * ) m ] .
In Equations (11) and (12), A is the initial yield stress, B is the hardening modulus, C is a strain rate dependent coefficient, m is a thermal softening variable, and n is a work hardening variable. A, B, C, m, and n are material specific variables generally determined through experimentation. The first bracketed term accounts for the strain hardening, or plastic strain accumulation. The second bracketed term accounts for the effects of strain rate. The third, and final, bracketed term accounts for the effects of temperature. ε ¯ ˙ 0 is a reference strain rate, which is set to the strain rate for which A, B, and n were determined, and T * is the homologous temperature, a ratio of the difference between the current temperature and room temperature over the difference between the material melting temperature and the current temperature, Equation (13). The temperature considered within the flow equation is a function of amount of plastic energy that is assumed present at the nodal locations. For impact problems, this is generally taken to be 90% or greater [38,39].
T * = T T 0 T m T .
Stress can be divided into two components, hydrostatic stress and deviatoric stress. Hydrostatic stress can be thought of as pressure stress, and is the average of the three principal stresses, see Equation (14) [40].
σ h y d = 1 3 ( σ 11 + σ 22 + σ 33 ) .
Based on the assumption that metals are incompressible, it follows that hydrostatic stress cannot cause deformation. This means that deformation is caused by the deviatoric stress, which is the total stress minus the hydrostatic stress, presented in Equation (15) [40].
σ = σ t o t σ h y d .
The flow stress equation, Equation (11), is a function of the von Mises stress equation, which is derived from the deviatoric stress, as shown in Equation (16).
σ v M = 3 2 σ : σ .
Here, represents the double inner product, carried out across two second order stress tensor, which provides a scalar output. The von Mises stress is useful as an invariant effective stress, which can predict the onset of yield, which is why the von Mises stress can be utilized as the effective stress, σ e , for determination of plasticity [34].
If the Johnson-Cook Flow Rule Condition evaluates as true, then yielding has occurred and the viscoplastic strain rate must be determined to calculate the equivalent viscoplastic strain. Otherwise, yielding has not occurred and the element is still in the elastic region, and therefore the viscoplastic strain rate is zero. The viscoplastic strain rate is determined through Equation (17).
ε ¯ ˙ v p ( i + 1 / 2 ) = ε ˙ 0 e 1 C σ ¯ y σ ¯ 0 1 .
The viscoplastic strain rate is then used to calculate an equivalent plastic strain, see Equation (18).
ε ¯ v p ( i + 1 ) = ε ¯ v p ( i ) + 2 3 ε ¯ ˙ v p ( i + 1 / 2 ) : ε ¯ ˙ v p ( i + 1 / 2 ) Δ t ( i + 1 / 2 ) .
Δ t ( i + 1 / 2 ) is the half time step increment. This equivalent plastic strain is carried forward to the next time step and used to determine the elastic strain. This time step iteration process is continued for all of the subject finite elements until the time interval is exhausted, or the elements are damaged, which is covered further in Section 2.4 [35].
An equation of state (EOS), see Section 2.3, is required to be used when modeling dynamic impacts in order to balance the physical properties of the projectile and target due to shock wave creation and propagation. The EOS is also used in the solution of the conservation of mass, momentum, and energy equations. This allows velocity to be a normalizing function, so that equilibrium conditions can be determined by relating the material’s pressure and internal energy to its density and temperature.

2.2. Smoothed Particle Hydrodynamics

The large deformation and high strain rates of the projectile impact problem necessitates that another numerical technique be utilized, SPH. SPH is a computational technique used in FEA for the simulation of fluids and solid mechanics, primarily utilized due to its ability to trace failure events in a more physically representative manner. It was developed in the late 1970s for use in analyzing complex three-dimensional astrophysics problems related to asymmetry in stars [41] and fission of a rotating star [42] utilizing a mesh free method to determine element forces. As mentioned, this work was adapted and applied to solid materials in the early 1990s for use in a strength of materials elasticity model [15], then further refined for use in determining dynamic material response [16]. When applied to solid mechanics, it was found that the mesh free SPH method was able to handle larger displacements and distortions more accurately than the traditional Lagrangian grid-based methods, making SPH a useful tool in shock, impact, fracture, and damage analysis [4,43,44,45].
In SPH, the part being analyzed is discretized into a set of particles which retain all of the relevant field variable information within an associated volume, as well as maintain a mass [46]. Figure 2 shows the difference between a traditional grid-based FEM and SPH.
As integrated within Abaqus, SPH is an extension of the explicit method, except instead of solving for residual forces through element volume integration to determine nodal displacements. SPH relates particles, via a weighting function, through satisfying the conservation equations about a point. This is accomplished through use of an interpolation method to express any field value function, f in terms of the particle set, defined by Equation (19).
f ( x ) = f ( x ) W ( x x , h ) d x .
In this equation, x represents the coordinates of the point of interest, x denotes the particle positions, h is the smoothing length variable, and W is the interpolating kernel, which must satisfy the two properties presented in Equations (20) and (21). The smoothing length is the distance chosen to determine which particles within the model will influence the interpolation for the point of interest.
W ( x x , h ) d x = 1
lim h 0 W ( x x , h ) = δ ( x x ) .
Here δ represents the Delta function [47]. As the kernel starts with the Delta function, which is point oriented, a smoothing function is required to make the integral numerically discrete, although the smoothing function also makes the integration in Equation (19) an approximation. An essential property of the smoothing function value for a particle is that it should be monotonically decreasing with increasing the distance away from the particle. This property is based on the physical consideration in that a nearer particle should have a larger influence on the particle under consideration than one further away. Additionally, as mentioned, the smoothing function should satisfy the Dirac delta function condition as the smoothing function approaches zero. This property of the smoothing function makes sure as the smoothing length tends towards zero, the approximation value approaches the function value [48]. The result of applying Equations (19)–(21) is determining the field variable values through convolution across the domain created by the smoothing length utilizing the kernel function. In the original SPH theory, the calculations were performed using a Gaussian kernel; however, the cubic spline kernel is more widely used today than the Gaussian in SPH, and is the default kernel used within the Abaqus software package. The cubic spline kernel is shown in Equation (22) [35].
W ( x x , h ) = 1 h 3 π 1 3 2 ξ 2 + 3 4 ξ 3 , for 0 ξ 1 ; 1 4 ( 2 ξ ) 3 , for 1 ξ 2 ; 0 , for ξ > 2 ,
where ξ = x h . The cubic spline kernel reduces the number of particles included in the calculations to those that are within twice the smoothing length of the particle of interest, while still maintaining C 2 continuity. The kernel function is generally chosen based on the type of problem being addressed, and a reduced interaction function, such as the cubic spline kernel, is often better suited for highly time dependent problems that occur over a short duration, such as impact events [49]. Regardless of kernel chosen, for numerical operations the field variables can be approximated though a kernel summation, which is presented in Equation (23).
f ( x ) k = 1 N f k W ( x x k , h ) m k ρ k .
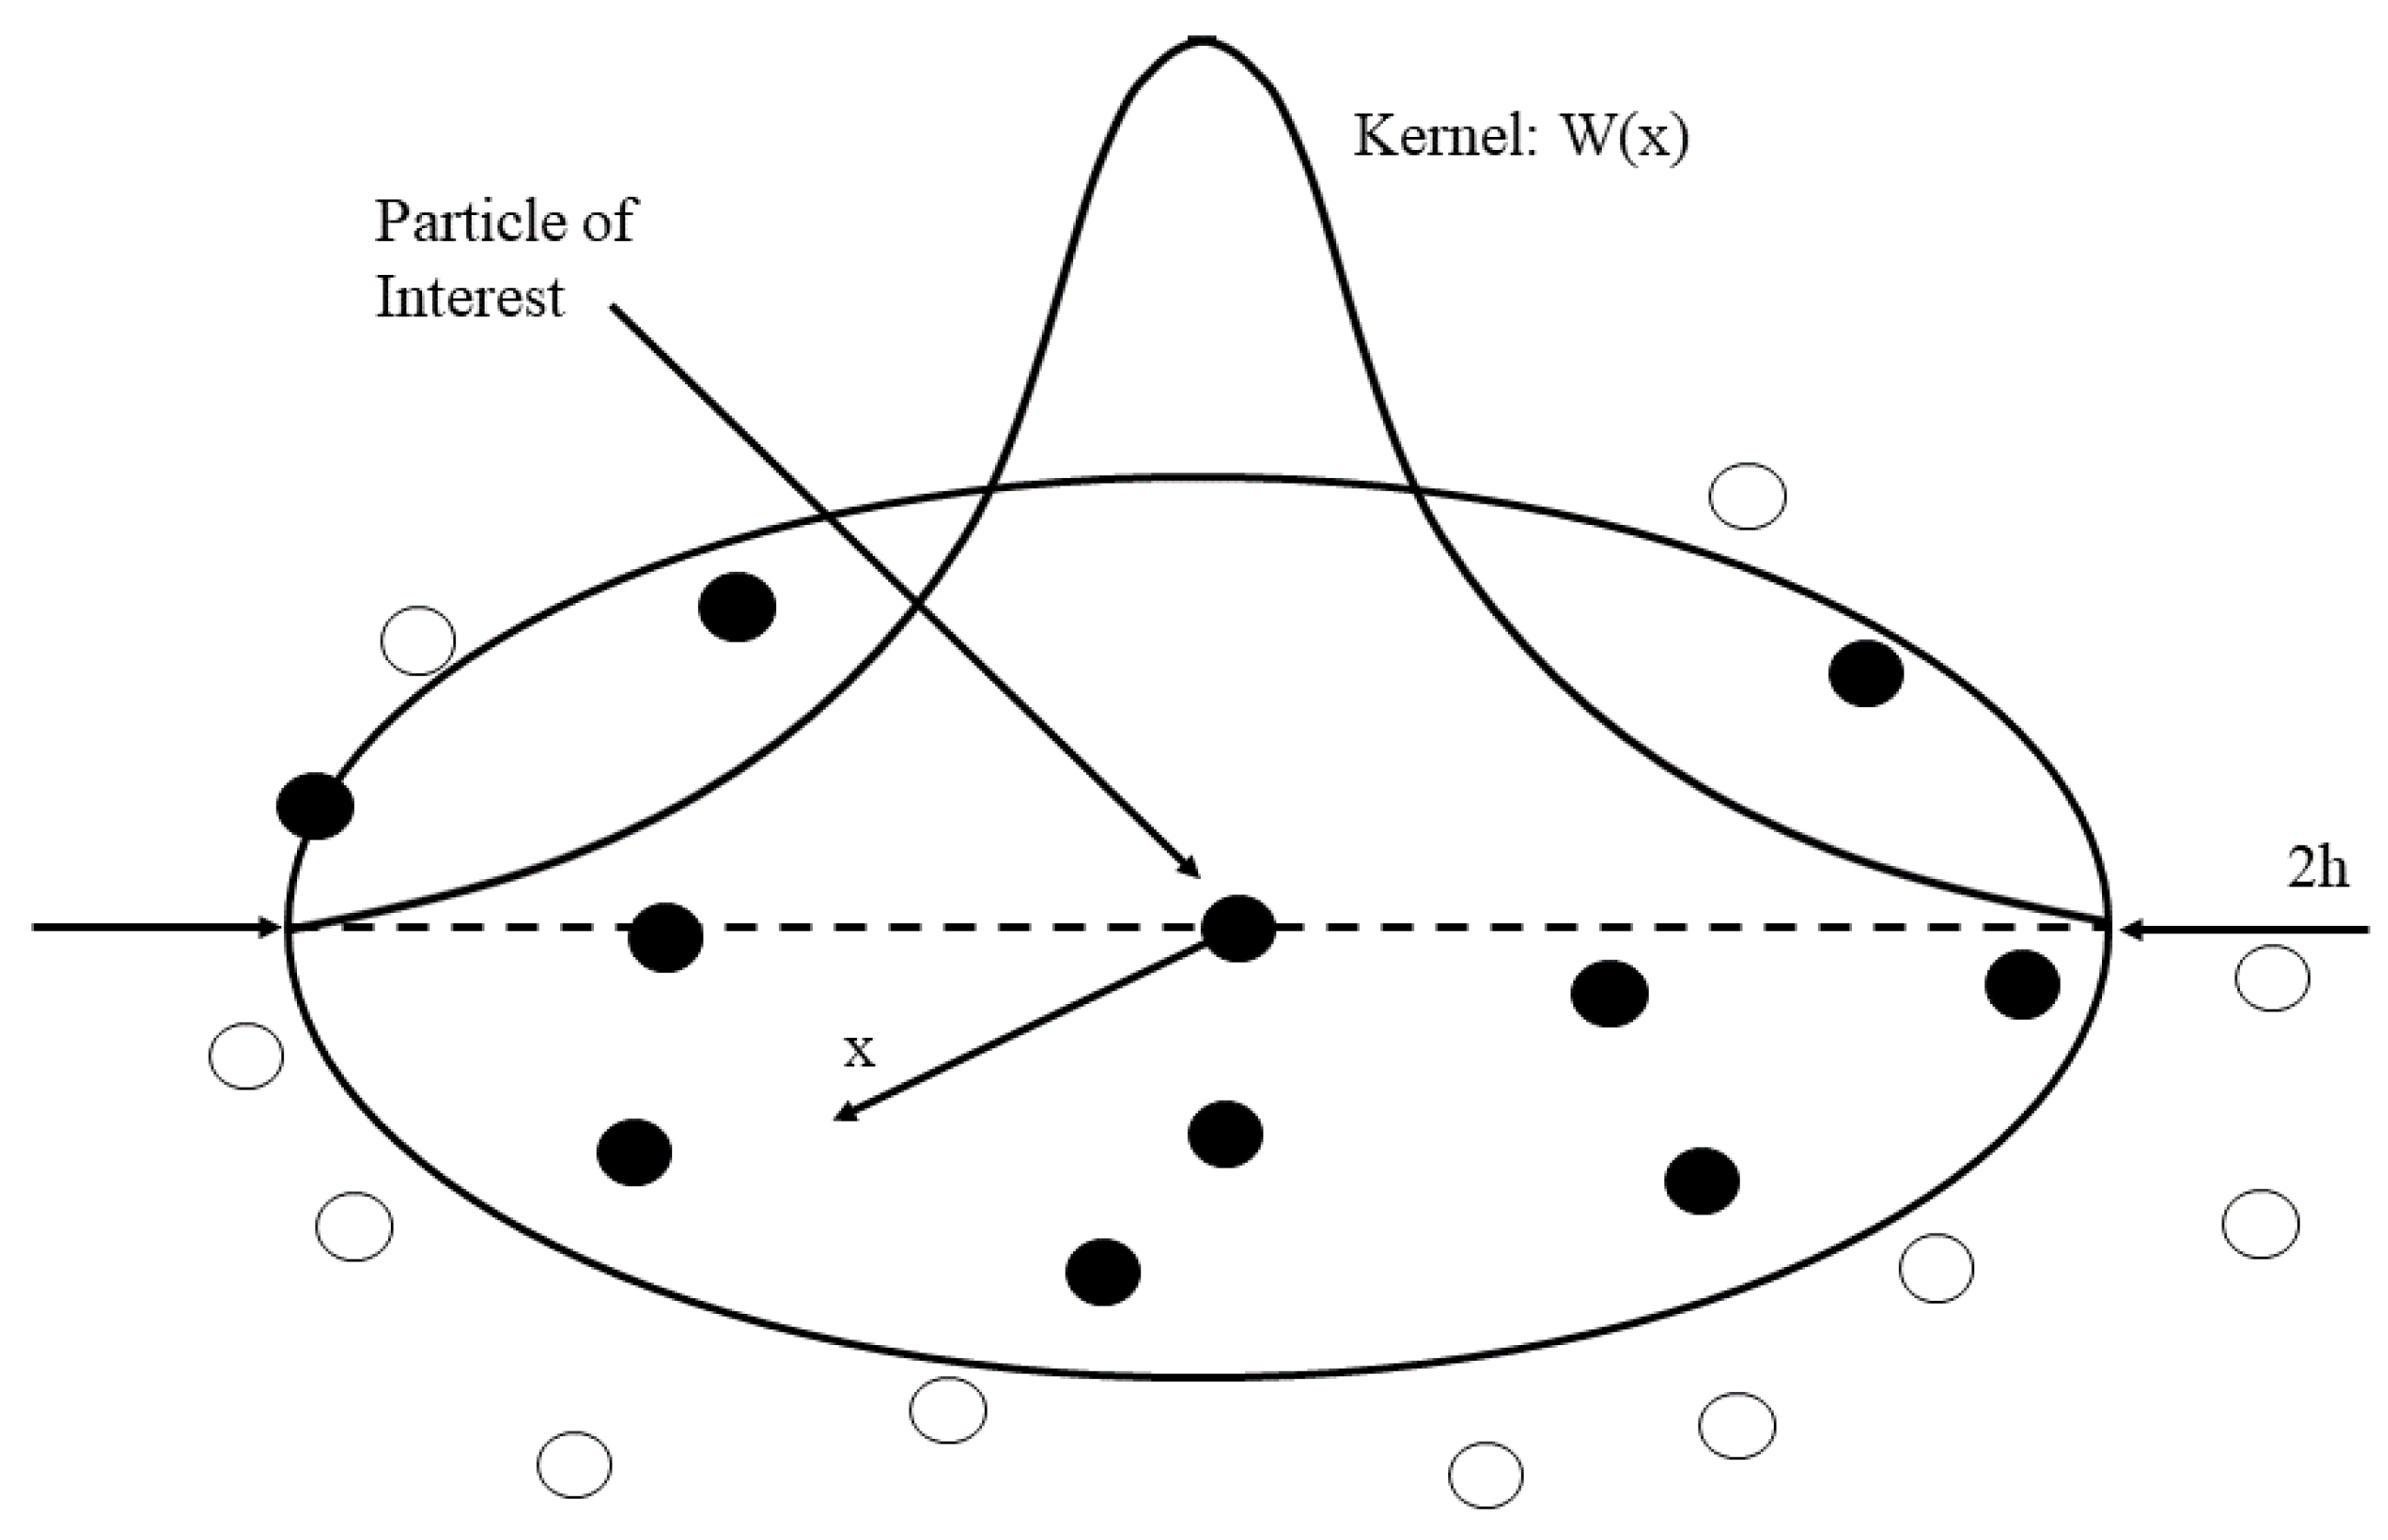
Here, k represents the particle index, N is the total number of particles, f k is the field variable at the kth particle, x k is the position of the kth particle, W and k remain the kernel function and smoothing length variable, m k is the mass of the kth particle, and ρ k is the density of the kth particle [44]. A visual example of a kernel function is depicted in Figure 3, where the black particles would be included in the computations and white particles would not be included.
As can be seen by viewing Equations (19) and (23), one of the primary differences between SPH and traditional grid based FEA is that SPH solves the field value differential functions through discretization of volume into particles versus a point-wise discretization of space-time [50]. Instead of solely using the traditional Lagrangian explicit technique based on Newton’s Second Law of Motion, the conservation of mass, momentum, and energy equations are utilized to determine particle response [47]. SPH still uses a Lagrangian formulation; however in the SPH implementation, the conservation equations must be satisfied for each particle at each time increment and the updated field values will be carried forward to the next time step.
The first conservation equation that must be addressed is the conservation of mass, also known as the continuity equation. The particle density is calculated through the continuity equation, which is needed for the two remaining conservation equations. In evaluating the mass density interaction between a particular particle pair, notated as a b , the continuity equation can be represented as the time rate of change of mass density shown in Equation (24). A subscript a denotes the properties at the particle of interest, and a subscript b denotes the properties at another particle within the field.
d ρ a d t = b m b ( v a v b ) a W a b .
In these equations, ρ is the particle density, m is the individual mass of the particle, v is the velocity of the particle, ∇ is the gradient function taken with respect to the coordinates of the particle of evaluation, and W a b is the kernel function relating particles a and b.
Once the conservation of mass equation has been satisfied, the conservation of momentum, or momentum equation, will be evaluated. Again, in evaluating the interaction between a particle pair a b , the momentum equation starts from a pressure gradient estimate shown in Equation (25) [47].
ρ a P a = b m b ( P b P a ) a W a b .
Here, P is the pressure at the particle under evaluation. In this form, the momentum equation is considered asymmetric, and can lead to unstable simulations by creating an inconsistent energy equation. To address this problem the pressure gradient can by symmetrized, then the equation can be rewritten using the relationship found in Equation (26) to arrive at Equation (27) [47].
P ρ = P ρ + P ρ 2 ρ
d v a d t = b m b P b ρ b 2 + P a ρ a 2 a W a b .
In Equation (27), d v / d t is the total time derivative, in the Lagrangian sense, of the velocity vector. By utilizing this form of the momentum equation both the linear and angular momenta are conserved, which may not be the case with an asymmetric pressure gradient term.
Finally, the conservation of energy, or energy equation, can be addressed. In the original SPH formulation, this was the rate of change of thermal energy per unit mass of the particles, or the hydrodynamic energy equation, absent heat sources or sinks as shown in Equation (28) [46].
d e d t = P ρ · v .
Here, d e / d t is the time derivative of the specific internal energy, e. This equation can be rewritten to determine the conservation of energy at particle a, and simplified for adiabatic systems, as shown in Equation (29).
d e a d t = P a ρ a 2 b m b ( v a v b ) · a W a b .
There are several variations on the energy equation that can be used in SPH analysis, and it is important to note that several of these forms can present non-realistic physical solutions, such as negative internal energy. These issues are typically solved through use of a predictor-corrector approach for analysis. In this approach the governing conservation equations are used to predict the field variables utilizing the chosen kernel, the predictor phase. This may lead to an unbalanced energy solution, which is corrected for through a local restoration of the conservation of energy equation, the corrector phase. Following the corrector phase the field values are adjusted to meet the new particle state. This process is followed at every time step used in analysis, and with a sufficiently small time increment the numerical adjustments used in the predictor-corrector method do not affect the accuracy of the solution [44].
As with the traditional Lagrangian implementation in Abaqus, the SPH technique incorporates the Johnson-Cook Flow Stress to determine viscoplastic strain, Equation (11). Again, this assumes that the von Mises flow stress can be determined as the combination of plastic strain accumulation, strain rate effects, and thermal effects. The Johnson-Cook Flow Stress is also used in determining particle damage utilizing the Johnson-Cook Damage Model described in Section 2.4.
One of the concerns that arose from adapting SPH to solid mechanics is the issue of boundary effects. When the summation approximation, Equation (23), is applied near a boundary there is a truncation error, which results in an incomplete summation and C 0 continuity may not be maintained. This means that rigid body motion may not be determined correctly through the analysis process [50]. There have been many efforts to overcome this error to regain at a minimum C 1 continuity through the use of Lagrangian stabilization [51], symmetric formulation [52,53], Galerkin formulation [54], least squares methods [55,56], or the ghost particle method [57].
Abaqus incorporates the ghost particle method as a primary means to deal with SPH boundary surfaces. This method creates imaginary particles when an SPH body interacts with a solid Lagrangian boundary. Interaction is considered when a particle is within twice the smoothing length of a boundary surface. In this case, a virtual plane is formed along this boundary, with the ghost particles being formed across the plane from the physical particles. The number of ghost particles included within the simulation is based upon the smoothing length utilized and the boundary condition. The ghost particle’s field properties are computed from those of the physical particles, as if the SPH part spanned the virtual plane, but they are assigned the opposite sign of the physical particles. The opposing field values are derived from a Lennard-Jones potential, which forms a repulsion force along the boundary surface, preventing SPH particle penetration of the solid [58,59,60]. Within the SPH methodology, the Lennard-Jones potential is used solely as a mathematical force generator for the required numerical boundary force. The use of ghost particles improves performance of SPH method integration along the boundaries, and it is worth noting that the ghost particles are not permitted to interact back across the virtual plane with the physical particles. As the ghost particles are still permitted to interact amongst themselves, care must be taken to avoid an excess of ghost particle mass [57]. An excess of ghost particle mass can start providing false inputs into the boundary surface integration, which in-turn can lead to errors in physical particle field values along the boundary. To limit the ghost particle mass the smoothing length can be decreased near a boundary, which is the application method used within Abaqus. See Figure 4 for a pictorial representation of the ghost particle method acting along a perpendicular boundary surface.

2.3. Equation of State

An EOS provides a hydrodynamic material model for use in FEA, in which the system’s pressure, volume or density, temperature, and energy are related through application of a specific EOS [61]. EOS are used to relate the state variables together when the conservation equations are not enough, which is the case of high strain rate impact, along with all fluid dynamics cases. One of the most commonly used EOS in impact modeling is the Mie-Grüneisen equation, which has also proven effective at predicting the response of porous materials to compressive shock waves [62,63,64,65], and was the EOS used in the Abaqus impact simulations run as part of this research. In order to develop a relationship between pressure and volume there must be a link between statistical mechanics and thermodynamics, which starts with the analysis of the Helmholtz free energy equation, Equation (30) [62].
A H = U T S .
A H represents the Helmholtz free energy, U is the internal energy of the system, T is the absolute temperature of the surroundings, and S is the entropy of the system. Within the EOS, entropy is linked to heat transfer, which ties the EOS to the same phenomena represented in the Johnson-Cook Flow Stress Equation, Equation (11), where temperature is a function of plastic energy concentrated at a nodal coordinate. The Helmholtz free energy is considered the useful energy within the system, as opposed to the energy related solely to the thermal environment. As such, it is defined as a measure of the work attainable within a closed thermodynamic system with constant temperature, or isothermal. Utilizing the fundamental thermodynamic relationship, see Equation (31), pressure is obtained through taking differential of the Helmholtz free energy with regards to volume, Equation (32) [66].
d A = T d S P d V
P = A H V T .
Through use of the virial theorem, mathematically represented in Equation (33) [67], Grüneisen obtained the pressure-energy relationship shown in Equation (34) [68]. For applications in mechanics, the virial theorem states that twice the total kinetic energy within a system is equal to the interaction of the particle forces, or virial, within the system [67]. Use of the total kinetic energy formulation provides valuable information on the system behavior, relating energy to force, which allows for the reformulation of the pressure-energy relationship from Equation (32) to Equation (34).
K E = 1 2 k = 1 N F k · x k .
Here K E represents the total kinetic energy, N is the total number of particles, F k is the force applied to the kth particle, and x k is the position vector of particle k in the local coordinates for a Lagrangian system [69].
P = Γ V E .
In this equation, Γ is the Grüneisen coefficient, defined by Equation (35) [70], where V s is the specific volume, e is the specific internal energy, and P is the pressure.
Γ = V s e P V s .
From here the Grüneisen equations were modified, utilizing the work performed by Mie, by relating the current conditions to those of a known value, a point off of the Hugoniot curve. Additionally, a simplification to the Grüneisen equations was made by correlating the material volume to its density. These two associations led to the Mie-Grüneisen equation taking on a linear form with respect to energy, as shown in Equation (36) [35].
P P H = Γ ρ ( e e H ) .
Here P is the current pressure, P H is the Hugoniot pressure, Γ is a redefined Grüneisen ratio, ρ is the material density, e is the specific internal energy, and e H is the Hugoniot specific energy. The Grüneisen ratio is presented in Equation (37), the Hugoniot pressure is presented in Equation (38), and the Hugoniot specific energy is presented in Equation (39).
Γ = Γ 0 ρ 0 ρ .
Γ 0 is the material specific Grüneisen coefficient, ρ 0 is a reference density, and ρ is the current density.
P H = ρ 0 c 0 2 η ( 1 s H η ) 2 .
In the Hugoniot pressure equation, c 0 is the material reference speed of sound, η is a nominal compressive strain, and s H is the linear Hugoniot slope coefficient. The Hugoniot pressure is solely a function of density, and is determined through fit of experimental data.
e H = P H η 2 ρ 0 .
In Equations (38) and (39), the nominal strain is represented by Equation (40).
η = 1 ρ 0 ρ .
Abaqus uses the form of the Mie-Grüneisen equation presented in Equation (41) for its analysis [35].
P = P H 1 Γ 0 η 2 + Γ 0 ρ 0 e .
This equation is solved simultaneously alongside the three conservation equations at each material point and time increment to ensure that the state variables are balanced throughout an impact event. In this implementation of the Mie-Grüneisen EOS, the reference material properties that will be used are those for the base material of the projectile and target.

2.4. Damage Modeling

As mentioned above, for both the Lagrangian and SPH finite analysis techniques, a damage model is required to determine when the elements or particles fail within a simulation so that they can be analyzed appropriately as part of the FEA process. The damage model used in this study, the Johnson-Cook failure model, was chosen due to its ability to model the failure of metals across a range of strain rates.
The Johnson-Cook failure model was developed in the 1980s, and It makes the assumption that the change in material properties between static and dynamic cases is due to strain rate effects, which can account for large strains, high temperatures, and high pressures [71]. It incorporates the Johnson-Cook material model and is based on plastic damage accumulation, that damage begins when plasticity begins. This model is commonly used for estimating the dynamics deformation of metals under high strain rates [72,73,74].
The Johnson-Cook failure model defines material damage as the sum of incremental equivalent plastic strain divided by the critical fracture strain, see Equation (42).
D = Δ ε ¯ p ε ¯ f .
In this failure model, D is the Johnson-Cook damage coefficient, Δ ε ¯ p is the increment of equivalent plastic strain, and ε ¯ f is the Johnson-Cook fracture strain, or strain at failure, see Equation (43). The right hand side of Equation (42) sums the incremental change in the element or particle plastic strain, and compares it as a ratio to the failure strain of the material, which is presented as the Johnson-Cook damage coefficient. The premise here is that as long as there is viscoplasticity, damage is accumulating. The damage coefficient has a range of zero to one. Where zero represents a pristine, or undamaged material, and a one represents the material being fully damaged and fracture will occur.
ε ¯ f = D 1 + D 2 e D 3 σ * 1 + D 4 ε * 1 + D 5 T * .
The Johnson-Cook relationship assumes that the damage effects can be decoupled. The first bracketed term contains the stress triaxiality effects. Where D 1 , D 2 , and D 3 are material specific model fit properties, and σ * is triaxiality ratio, or the ratio of the average normal stress to von Mises equivalent stress. This term accounts for the static and quasi-static strain response of the finite element parts. The second bracketed term comprises the strain rate effects. Where D 4 is another material specific model fit property and ε * is the dimensionless strain rate ratio of viscoplastic strain rate to reference strain rate. The reference strain rate here is the same as that used in Equation (11). The final bracketed term includes the effects of temperature on material failure. Where D 5 is a material specific model fit parameter, and T* is the material’s homologous temperature, Equation (13). The D i terms are traditionally found through experimentation, utilizing quasi-static compression testing and the Split Hopkinson Pressure Bar test, allowing for modeling of the material response across a broad range of strain rates.
The damage evolution presented by the Johnson-Cook failure model describes the degradation in the material stiffness once damage is initiated. This reduction in stiffness is formulated by Equation (44).
σ = ( 1 D ) σ ¯ y .
Here σ is the stress within the element or particle, σ ¯ y is the Johnson-Cook Flow Stress given by Equation (11), and D is the damage variable as described above. When the element or particle is fully damaged, D = 1 , it is removed from the analysis.

3. Results and Discussion

In this study, a three-dimensional physics based computational model was developed in Abaqus. This model was used to predict the damage and failure of both projectile and target under high strain rate impact using the Johnson-Cook plasticity and damage models native in the Abaqus software. The materials and dimensions for the initial model were chosen to match experimental validation conditions [4], in order to provide validation of the modeling techniques, configuration, and simulation execution.
The initial computational model used for this study was a single projectile-single target assembly constructed in Abaqus using the inherent explicit finite element solver. The models all started at the point of impact with calculated impact velocities from the experimental data. Contact between the two parts was modeling using the general contact algorithm native to Abaqus, which utilizes a penalty method to impose contact constraints through introduction of increased local stiffness. The general contact algorithm was used to enforce contact between two bodies, and model friction between parts. This algorithm allows for automatic contact definition based on surface inclusion. Within the Lagrangian systems, contact forces are generated based on node, face, and edge interactions. It is also capable of enforcing contact between Eulerian and Lagrangian systems, compensating for any discrepancies between the two constructs. Of the contact algorithms available within Abaqus, general contact is the only contact algorithm that can be used with three-dimensional models, and is capable of evaluating across a mixed model type simulation. The friction developed here follows the Coulomb friction model, which formulates the friction coefficient based on primarily on contact pressure for impact, but also includes surface slip and temperature at the contact point [35].
The projectile was configured with a cylindrical body 24.7 mm in length and 16.7 mm in diameter to develop an equivalent system to the experimental setup. It incorporated a blunt nose geometry, and was modeled using reference material properties of 6061-T6 Aluminum, shown in Table 1, along with the Johnson-Cook Parameters shown in Table 2. The impact velocity of 970 m per second was applied as a load to the rear face of the projectile, with no other boundary conditions enforced upon the projectile within the simulation.
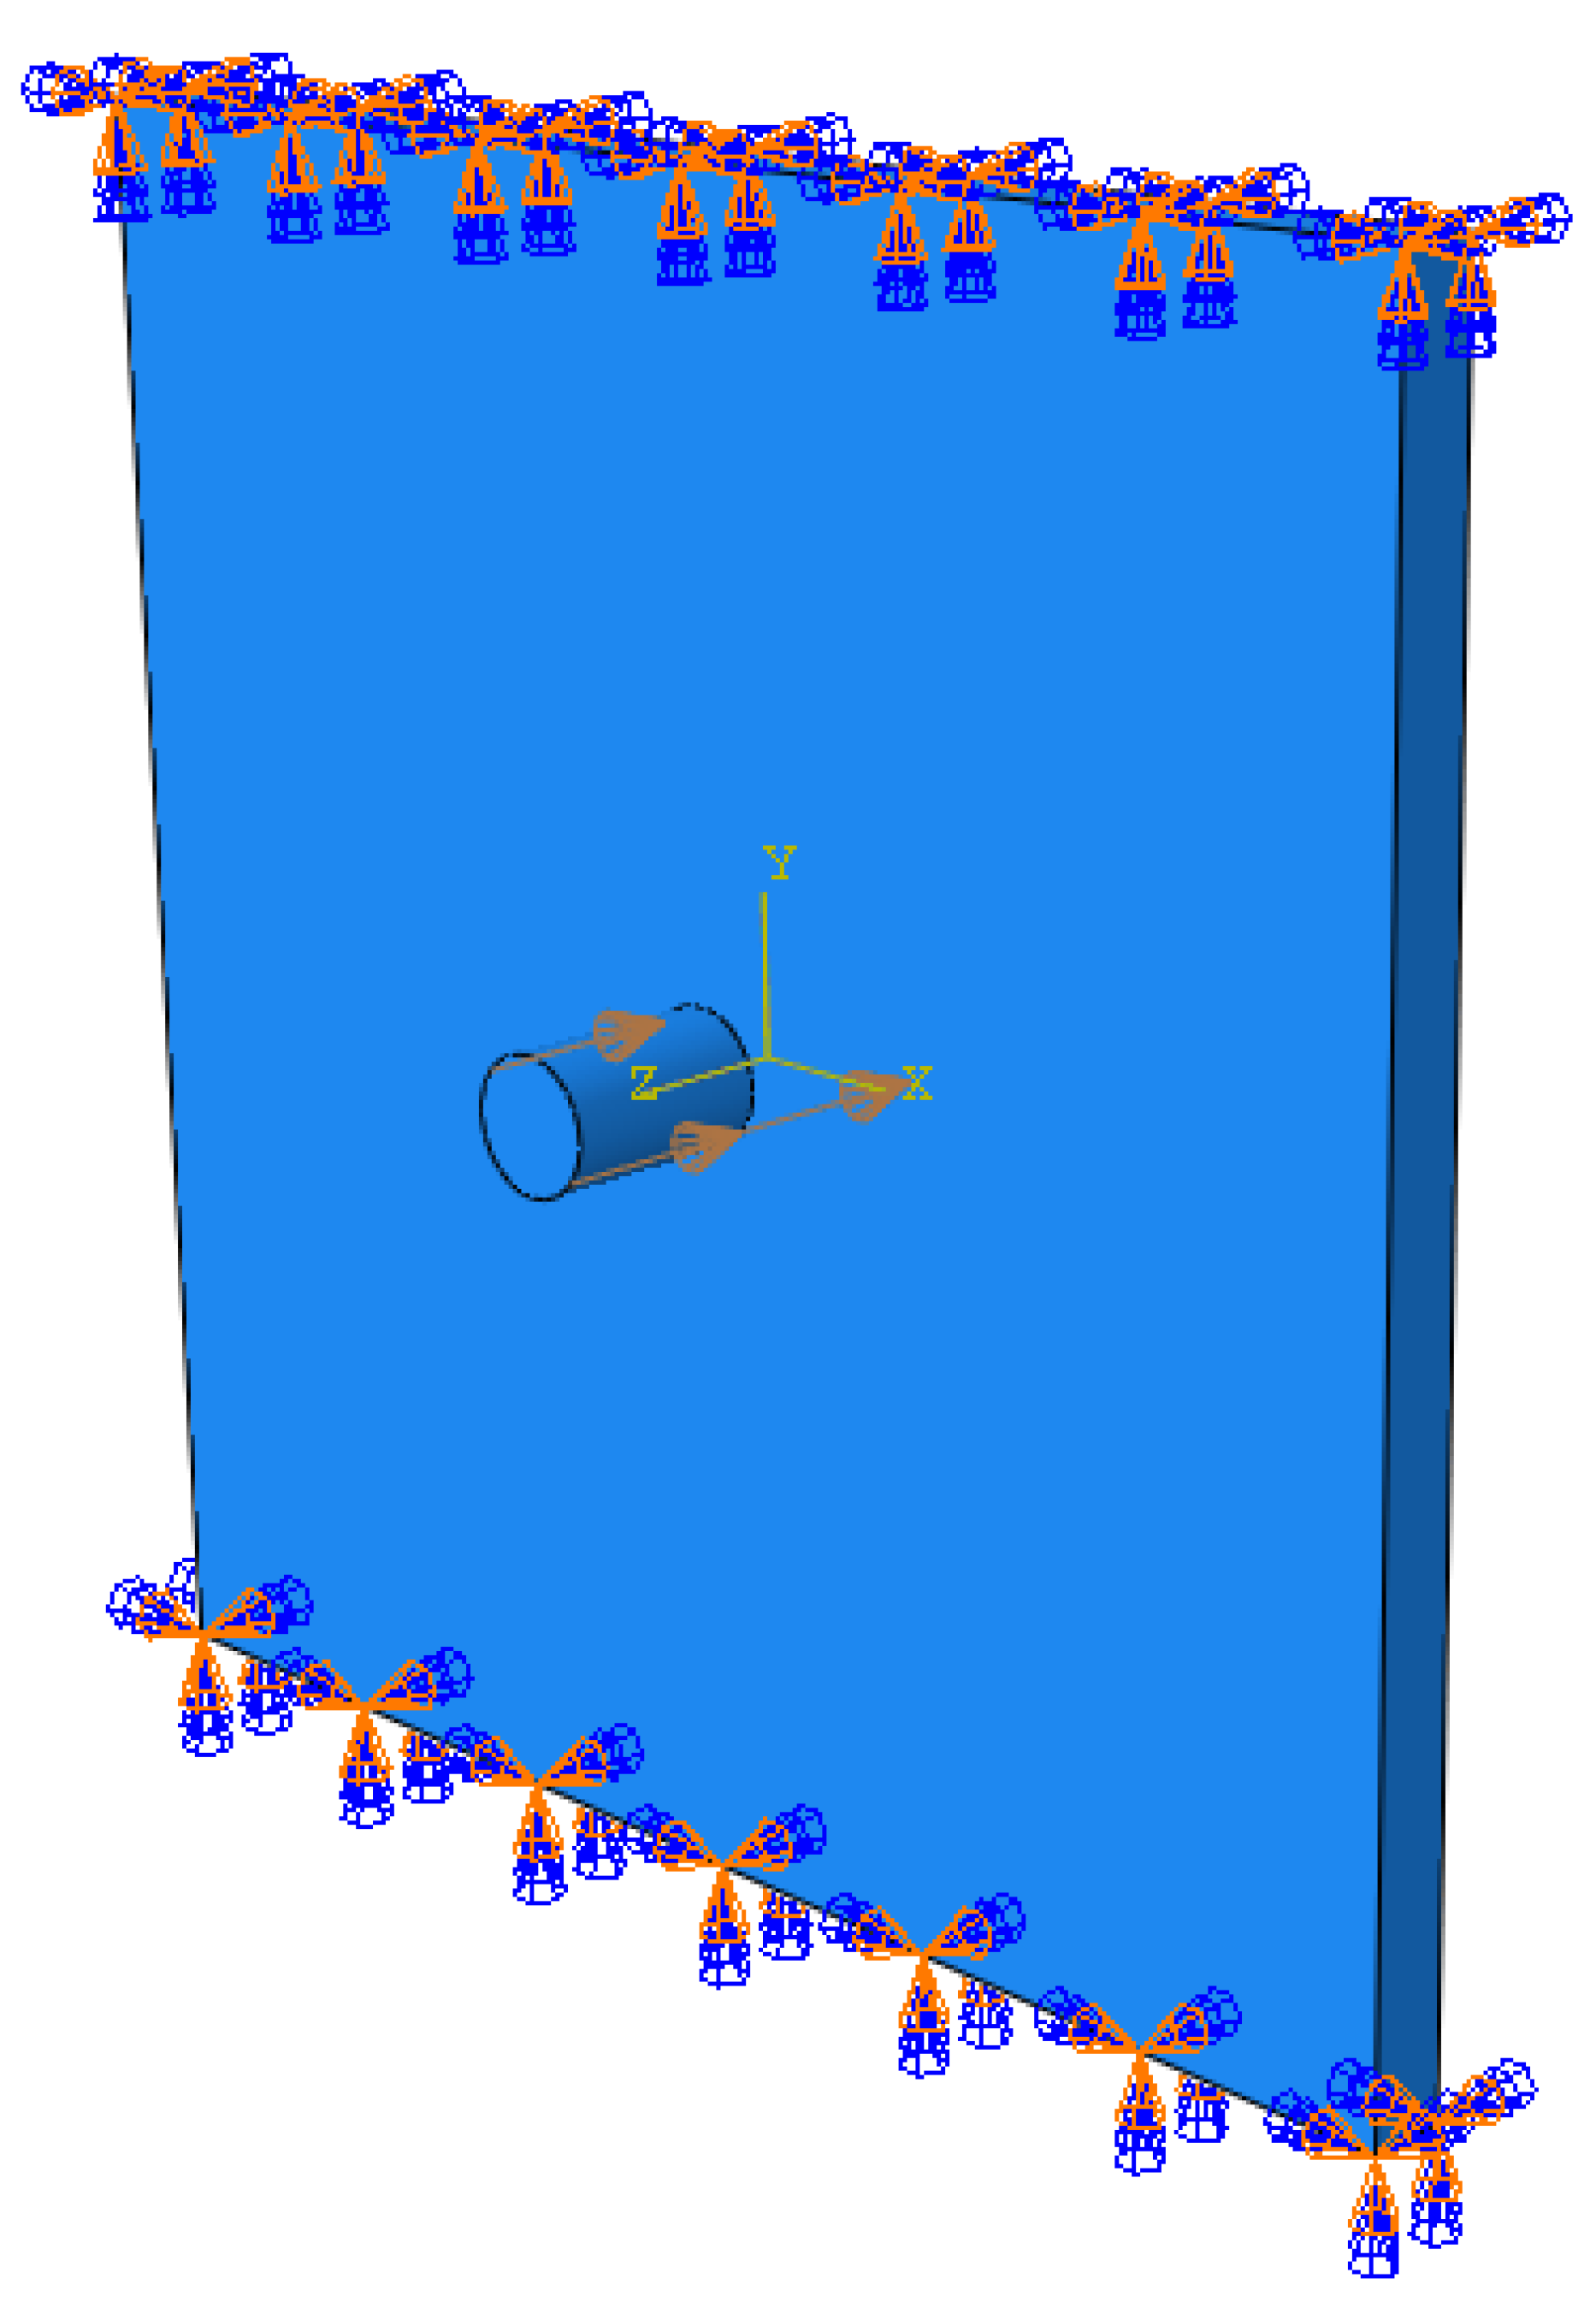
The targets were configured as square-faced plates that were 203 mm by 203 mm with a thickness of 12.7 mm, utilizing the same material set. The target had fixed boundary conditions applied at both the upper and lower surfaces, as if it were affixed in a mount, with the other edges left as free surfaces. A depiction of the simulation boundary and initial conditions is shown in Figure 5.
All of the simulations were evaluated for an impact time of 12 s. Presented here are the validation cases, utilizing a variety of FEA techniques, compared to the previously acquired experimental results as means for evaluation of the modeling techniques [4]. Three variations of the base model were developed to evaluate different modeling techniques for use in this work. The first two models were based solely on Lagrangian FEA techniques, comprising a full scale model to match the real-world dimensionality of the experiment, and a symmetry reduced model that used dual-axis symmetry to achieve a quarter scale model. The third incorporated the use of SPH to model the target. The target was chosen for the use case of SPH as it would see larger deformations than the projectile.
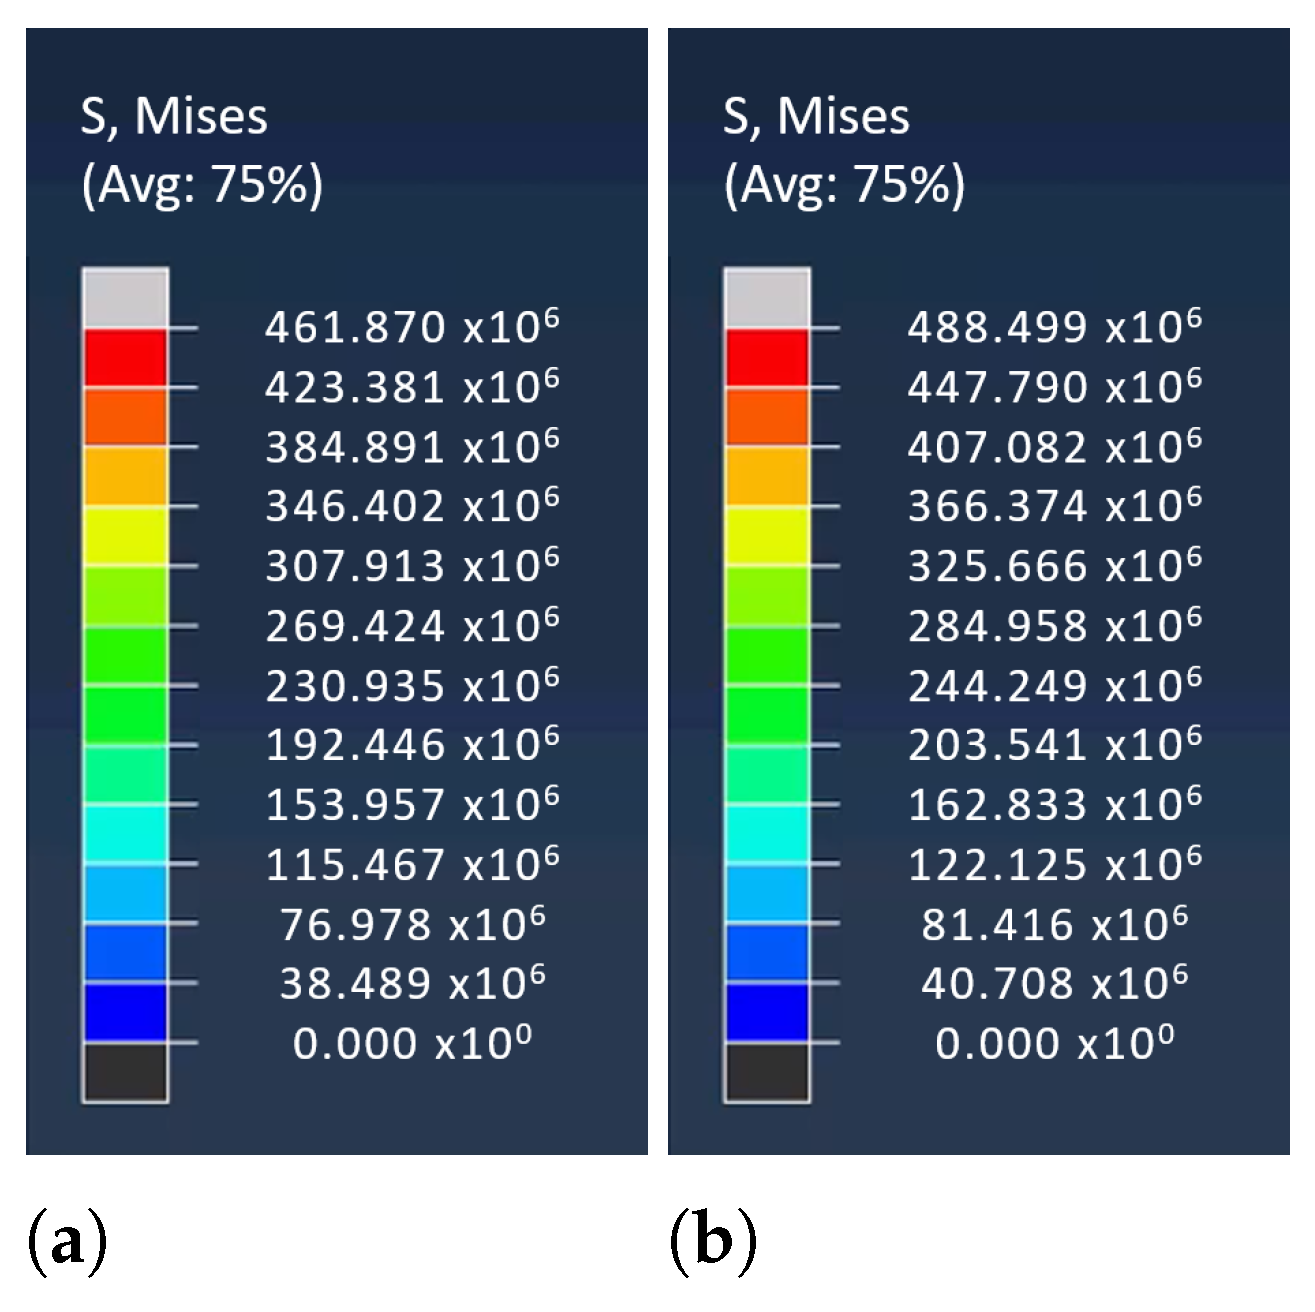
Figure 6a presents the stress colormap that corresponds to traditional Lagrangian models, and Figure 6b presents the stress colormap scales that correspond to the mixed Lagrangian-SPH models.

3.1. Lagrangian Models

The projectile and target were both symmetric across two axes, allowing the model to be cut along those axes and reduced in scale, to a quarter scale of the full model. This was only possible because of the shared planes of symmetry about the impact location of both the parts, forces, and boundary conditions. A visual comparison of the symmetry reduced and full scale model are provided in Figure 7.
As mentioned, in both the reduced and full scale models, the C3D8R eight-noded stress bricks with reduced integration were used as the elements for analysis of the projectile and target. In the full scale model, the projectile incorporated 7800 elements, and the plate target was comprised of 50,000 elements. The number of elements chosen for the parts was based on a convergence study performed by varying the element size from 1 / 50 th down to 1 / 500 th of the plate width using the symmetry reduced model. To save on computational run time the largest element size that still provided consistent results was chosen, which was 1 / 100 th of the plate width. The Johnson-Cook plasticity and failure models were used to estimate the element failure modes of the materials, with element deletion occurring for cells with equivalent plastic strain values greater than 1.0. This value was found to most closely match the model data to previous experimental results. Figure 8 and Figure 9 show a comparison between the full scale model deformation results against the experimental results of the projectile and target plate respectively [4].
There is noticeable difference in the projectile results shown in Figure 8. The most significant aspect of this difference, showing the leading face of the projectile narrowing versus mushrooming, is due to inaccurate equivalent plastic strains for the impact face elements combined with the element deletion scheme used. At the projectile impact velocity, and subsequent strain rate, the traditional Lagrangian modeling technique is subject to mesh distortion causing errors which are compounded through the CDTI methodology. Ultimately this will lead to inaccuracies in the element strain and equivalent plastic strain, which would cause errant element deletion.
The symmetry reduced model provided nearly identical results as the full scale model, yet took approximately one third of the time to run, 0.3 processor hours versus 1.0 processor hours for the full model.

3.2. Mixed SPH-Lagrangian Model

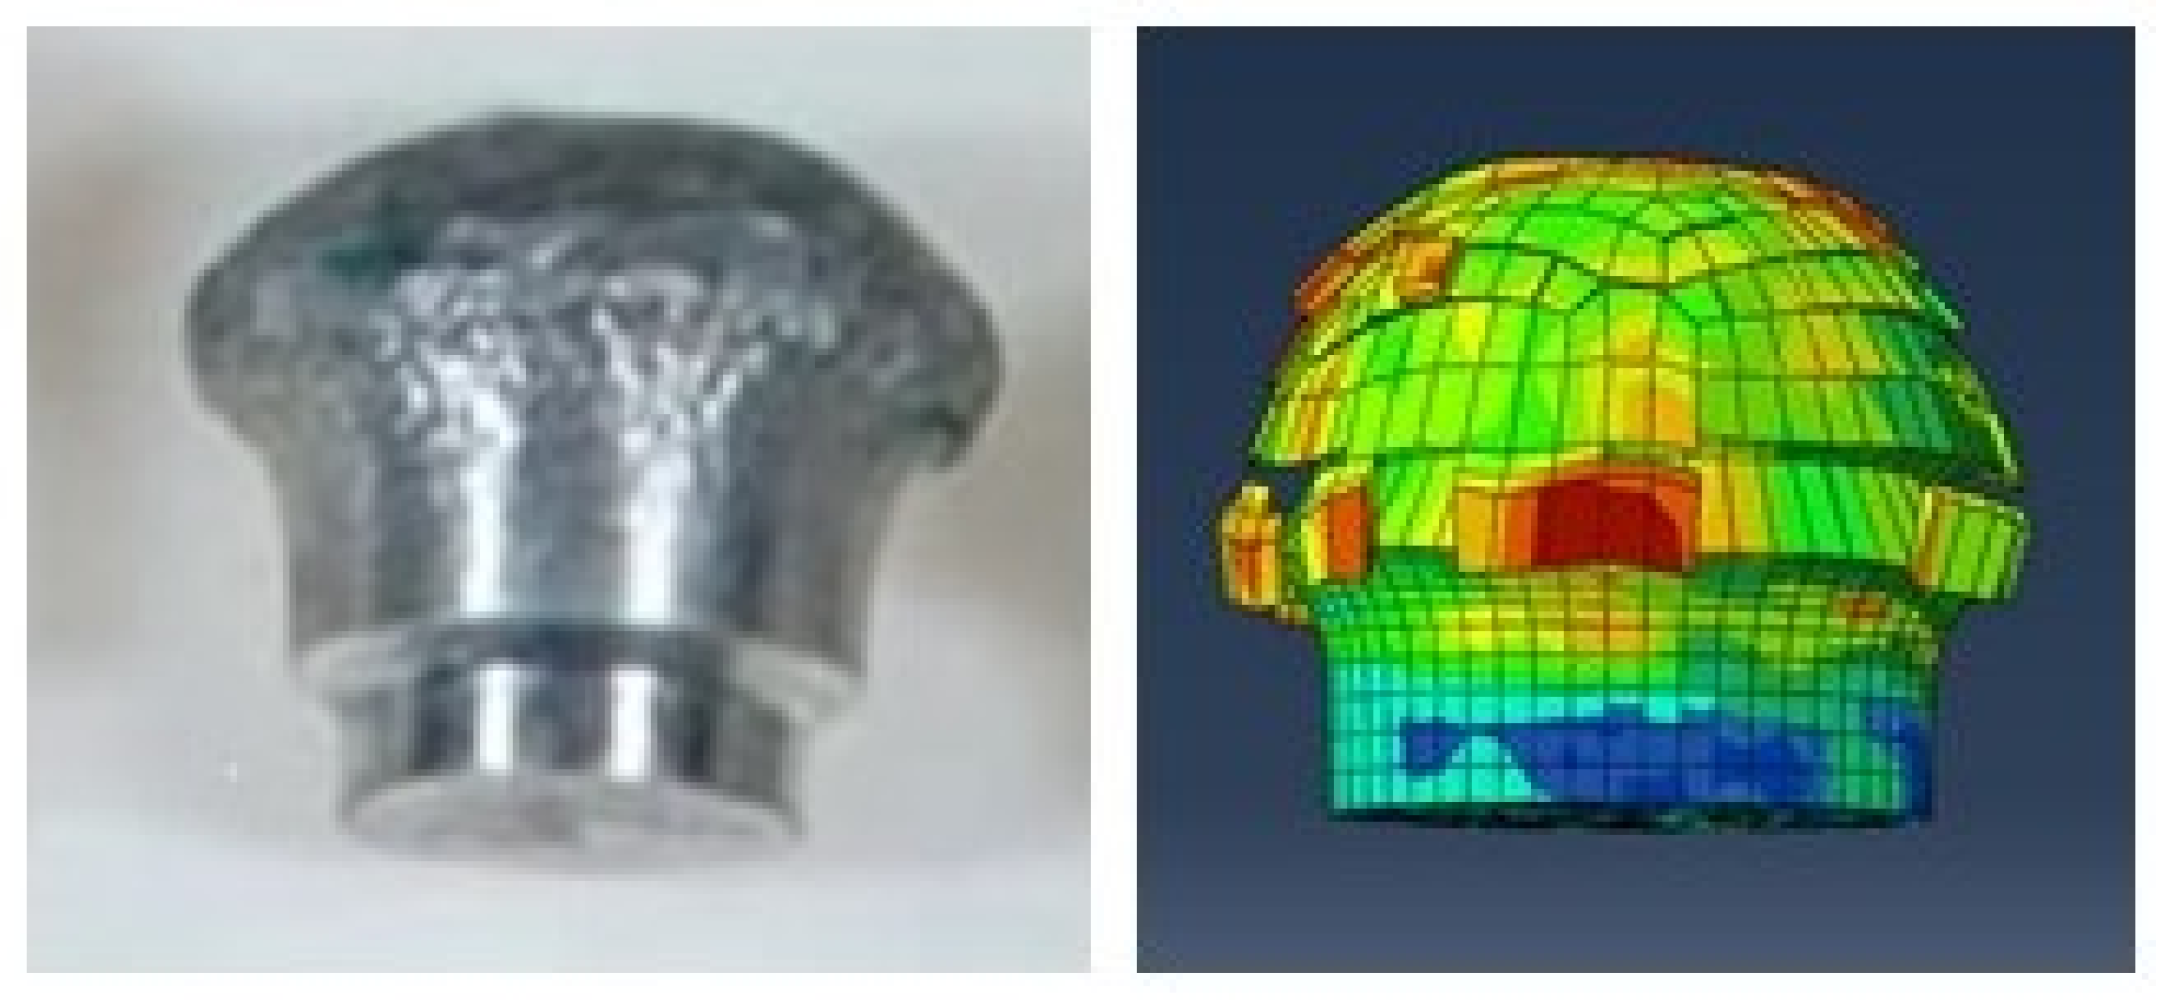
While the deformation results of the traditional Lagrangian model appeared to match the experimental results adequately for the target, the deformation and residual velocity of the projectile were not well modeled. Residual velocity is the projectile’s velocity upon exit of the target. Therefore, a mixed SPH-Lagrangian model was developed to evaluate the projectile and target dynamics and interactions more closely. As previously mentioned, it was decided that the target would be modeled utilizing SPH techniques, as it would be subject to larger deformations than the projectile based on the deformation seen in the traditional Lagrangian grid model and experimentation. The projectile was still modeled using the traditional C3D8R element with the same seeding as the full Lagrangian model, using 7800 elements. The plate was discretized into SPH particles to match the size of the elements used in the full Lagrangian model, resulting again in 50,000 elements used to model the target. However, due to the use of ghost particles in modeling boundary interaction within the SPH methodology, 100,000 particles were ultimately used in the computational analysis, which comprised the 50,000 particles used to represent the target plate and 50,000 particles used to model boundary interaction throughout the impact scenario. Figure 10 depicts the SPH target deformation following impact under the same parameters as the traditional model compared with the experimental results.
In this figure, the particles that are no longer attached to the target plate would have been removed from the target during impact, and show as deleted under the traditional FEA method. As shown here, the SPH model more closely replicates the asymmetric shearing around the exit hole that was found in the experimental results. While the impact problem is described as a symmetrical problem, there are potential sources for the asymmetry in the simulation, such as asymmetric discretization of a part and numerical round off. The projectile was discretized the same between the two models, and some element asymmetry was noted in both the impact and rear faces. The asymmetry in the projectile discretization can still provide physically relevant data, as it can be seen as a similar effect to imperfections within the part, or non-homogeneity within the material or structure. As different mathematical methodologies are used in the two models, an asymmetric discretization could lead to asymmetry in the mixed model but not the traditional model. In a similar manner, numerical round offs could cause asymmetry in either model, but as different equations are utilized the round off would likely manifest differently between the models.
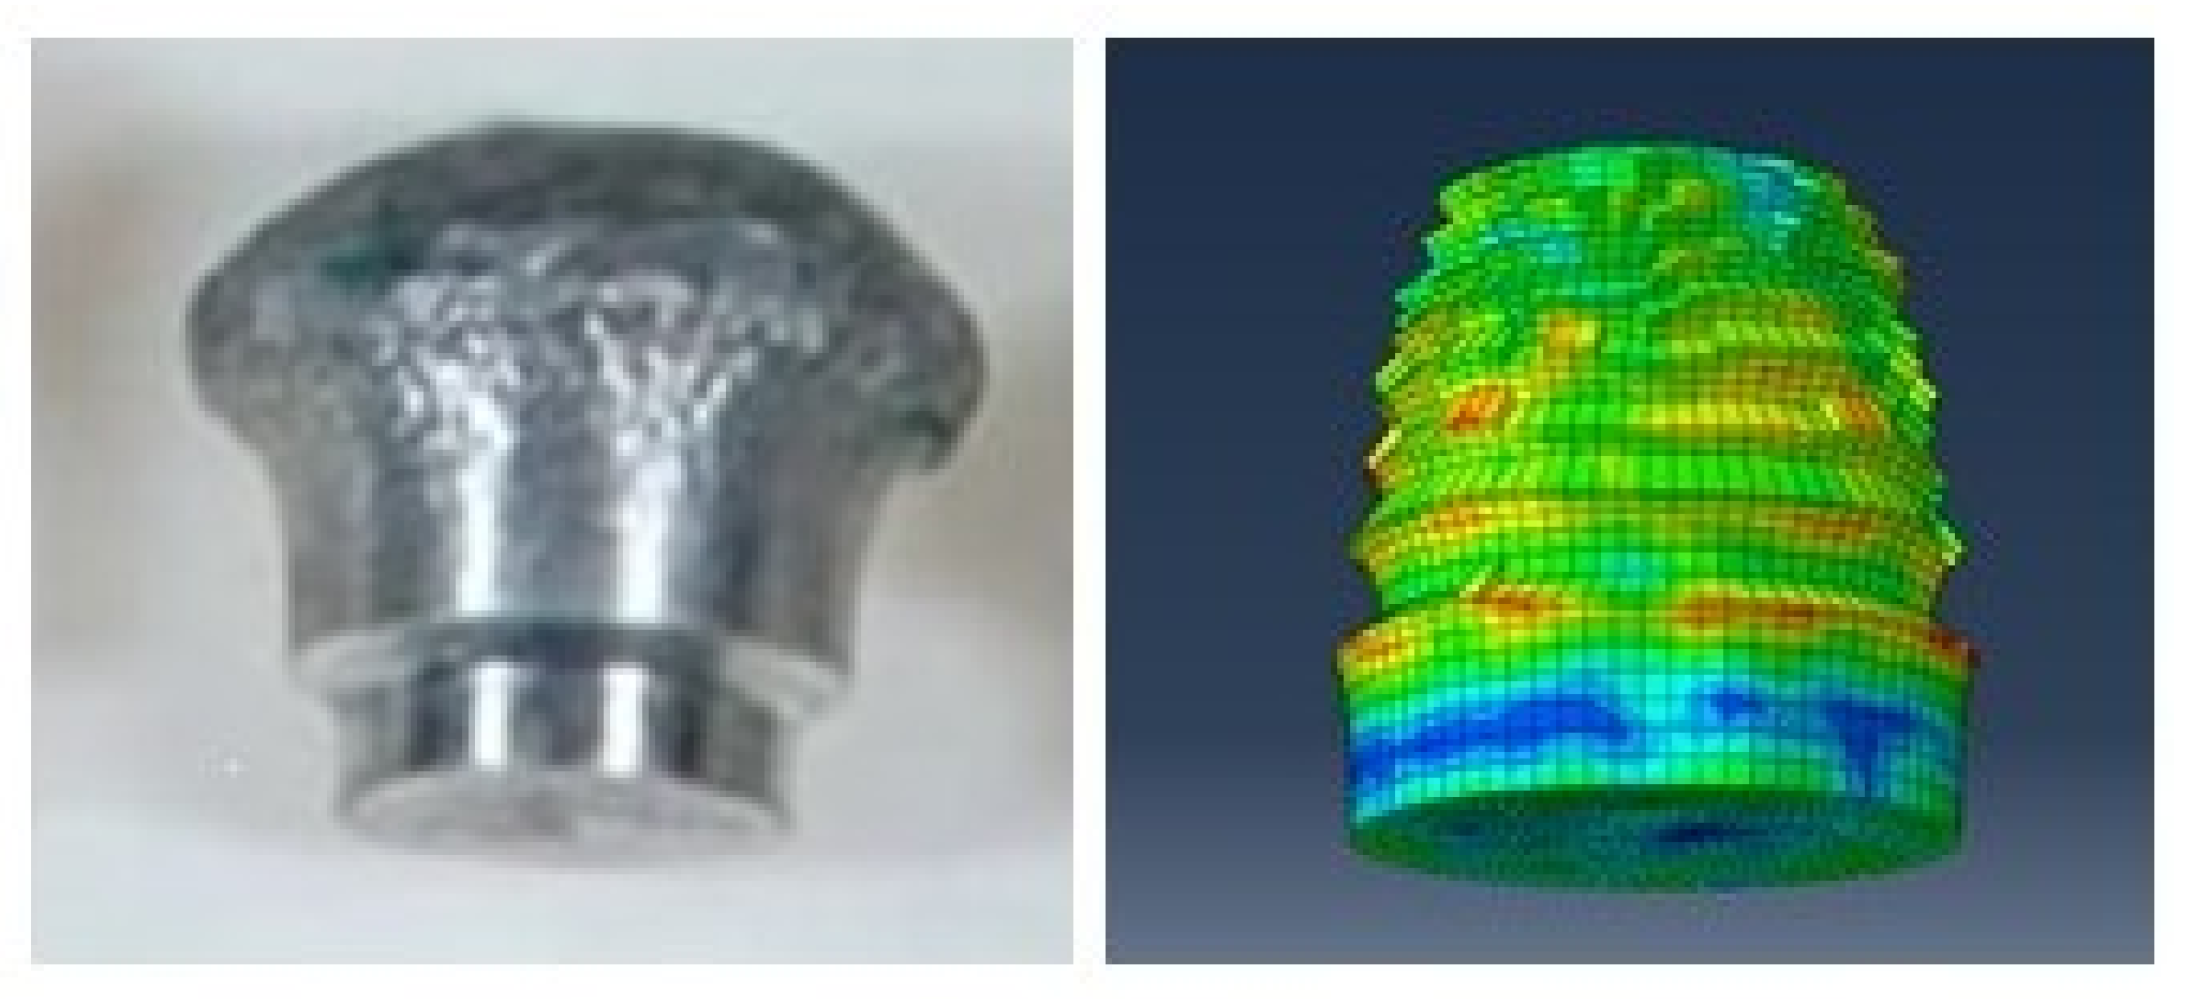
While in this model only the target was converted into an SPH model, the use of SPH in the assembly also gave a better appreciation of the projectile response throughout the interaction. Figure 11 shows the projectile following impact compared to the experimental projectile deformation.
Utilizing this model, the projectile shows a deformation pattern more similar to the experimental results than with the previous modeling technique. A primary contributor to the accuracy of the solution is the more precise displacement solution of the target through use of the SPH technique. With contact prescribed throughout much of the simulation, the displacement solution of the target has a direct impact on the forces imposed upon the projectile, which in-turn will dictate the plastic strain accumulation used in the damage model. An additional element that lead to the closeness in results is due to the equivalent plastic strain value used for element deletion being tuned more specifically for the projectile in the SPH-Lagrangian model than for the traditional model while maintaining a nearly identical target failure pattern. However, the SPH model took significantly longer to process than either the full scale or symmetry reduced models, with a run time of 5.2 processor hours.

3.3. Further Comparison of Models

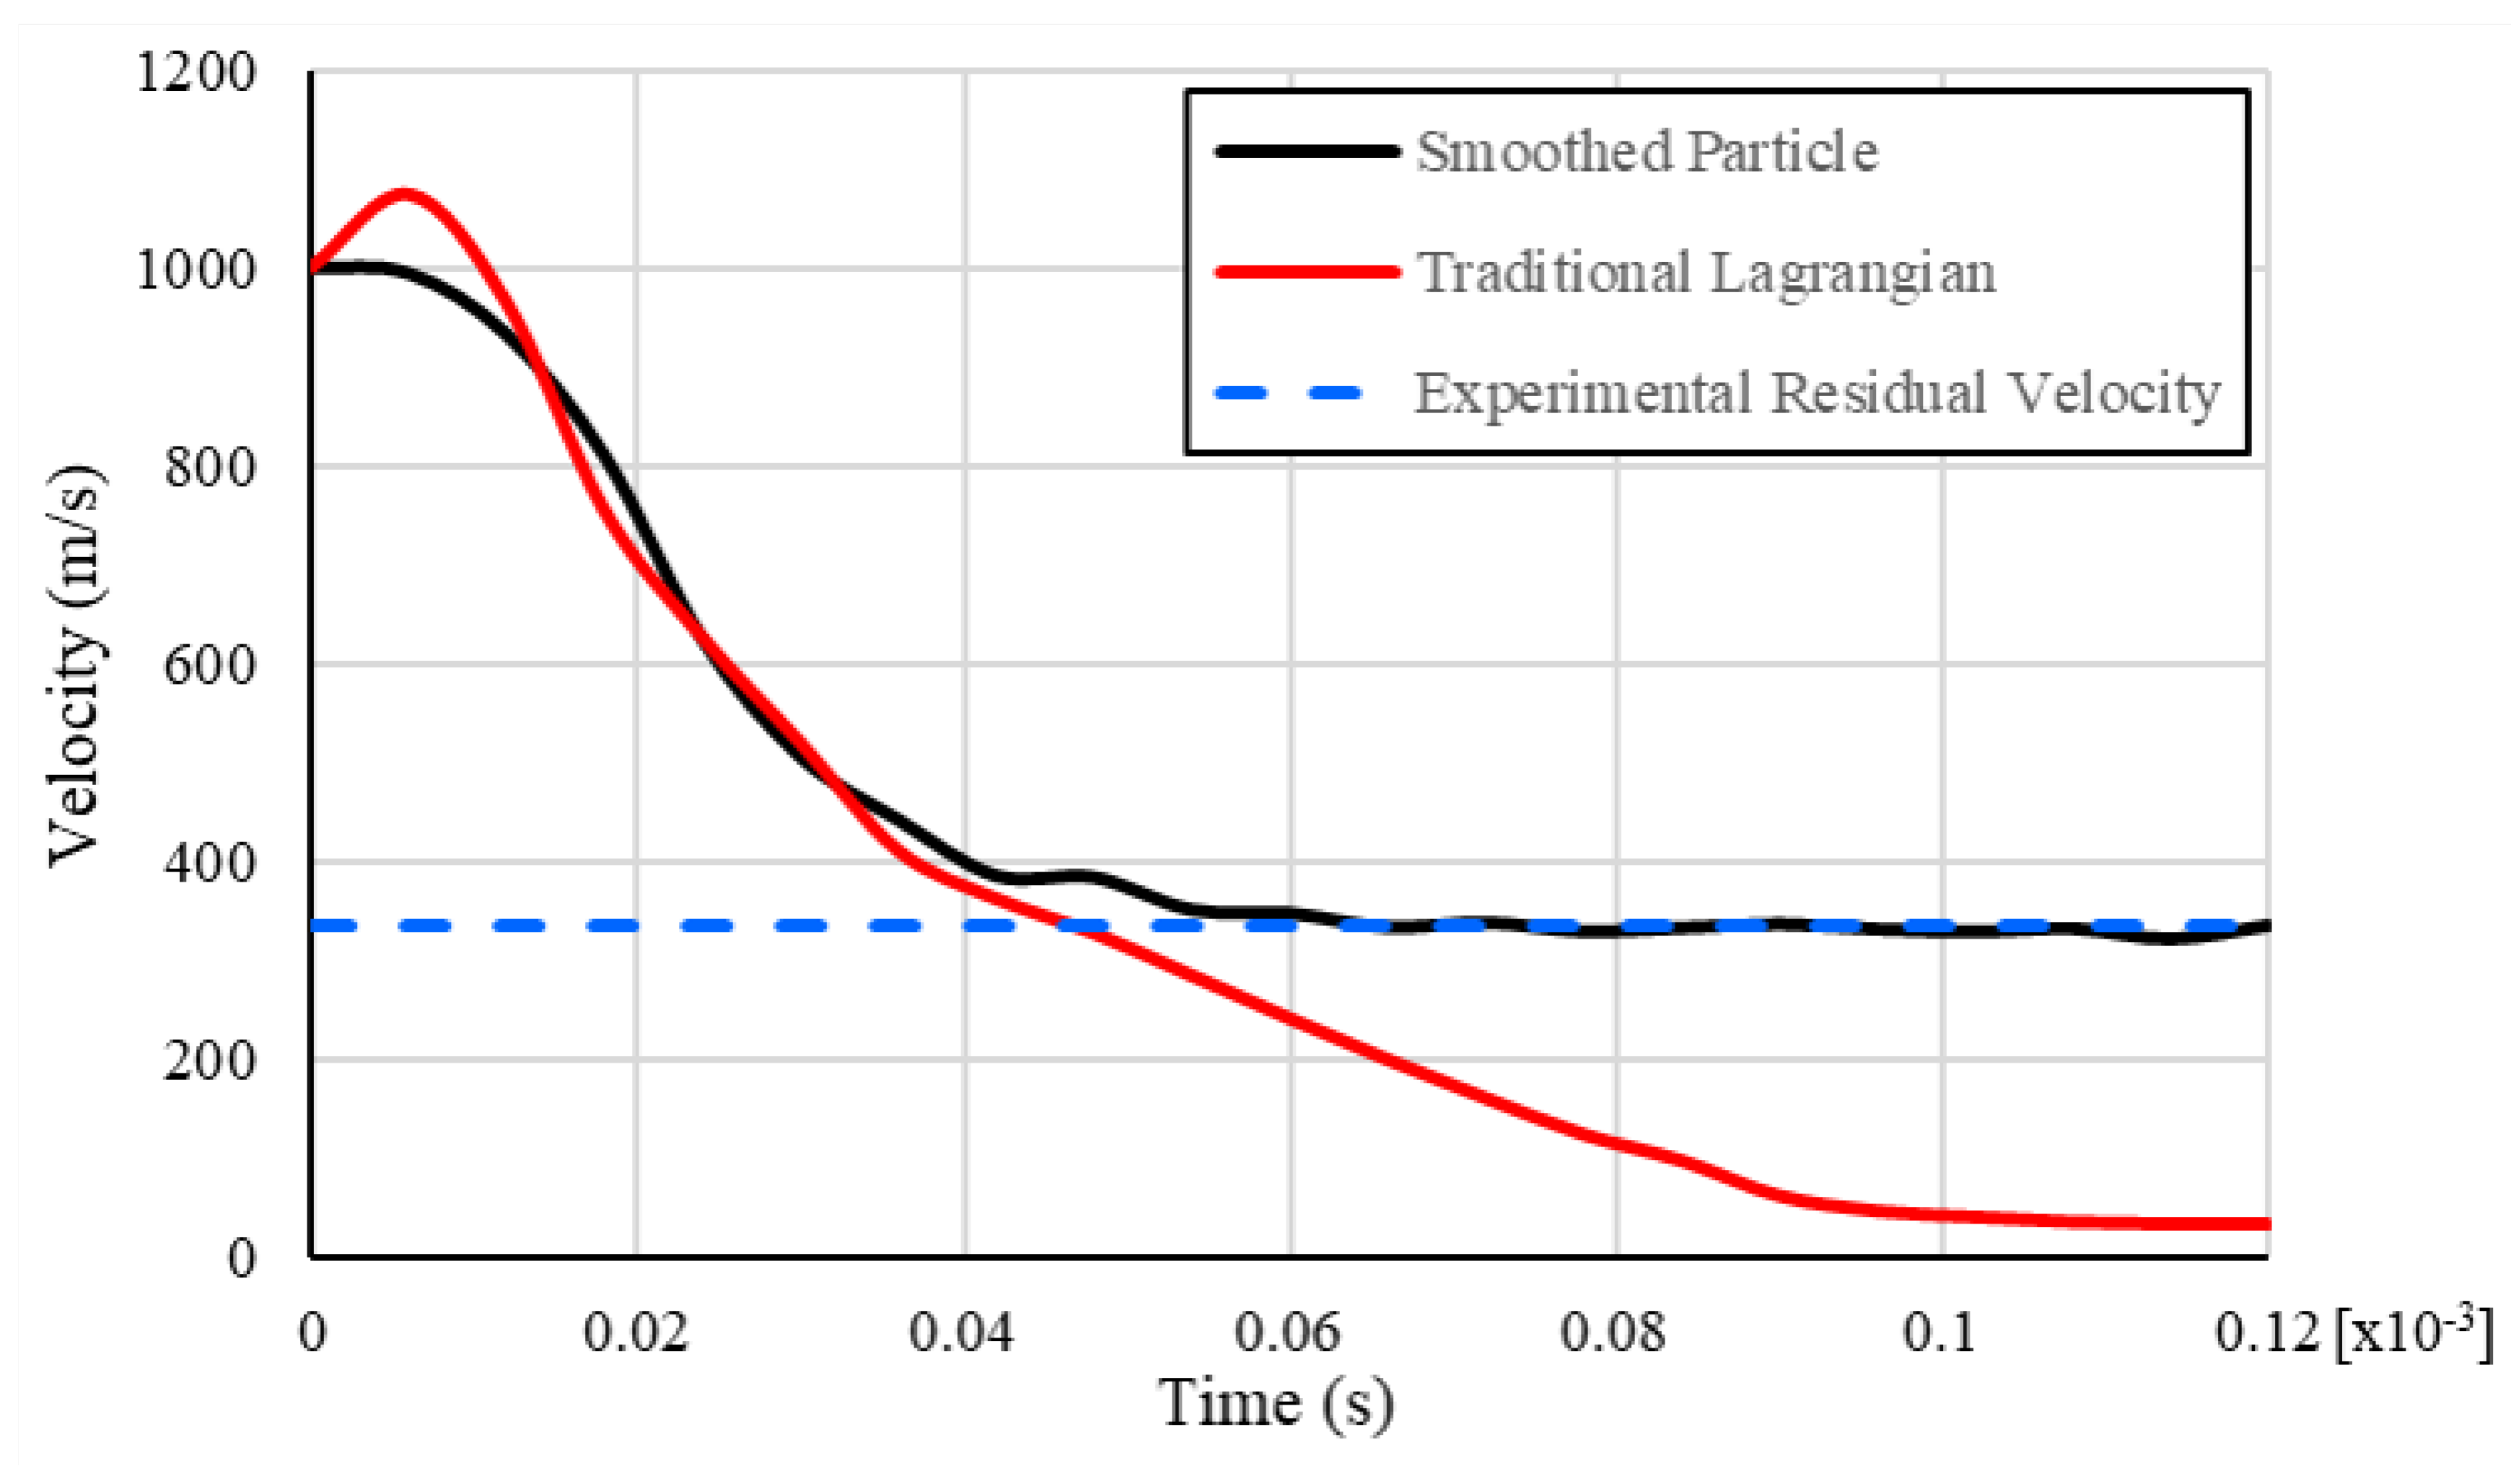
As mentioned above, the traditional grid model did not provide an adequate result for the projectile’s residual velocity, but the SPH model was able to very closely match the results seen through experimentation, see Table 3. Also shown here are the computer processing times required for each model.
Figure 12 shows the velocity plot of the projectile for both the traditional model and SPH model against the simulation time, with t = 0 being initial contact. The velocity values are taken from elements along the center-line of the projectile. As shown here, the SPH velocity follows a smooth and expected deceleration from the initial impact velocity to the projectile’s residual velocity. On the other hand, the traditional grid velocity shows an initial acceleration within the first time step, then decelerates more quickly down to a velocity roughly one-tenth of that observed in experimentation.
The initial increase in velocity is likely due to the high strain rate of impact, which could not be accurately modeled by the traditional explicit methodologies. One of the most essential differences between the two methods is that SPH is meshless, and the problem domain is discretized with particles that do not have a fixed connectivity. Thus, large displacement problems are better evaluated since there is no need to evaluate the internal forces based on individual volume integration as required in the traditional approach. The traditional Lagrangian method requires a continuity of nodes, which requires the integration of the volume represented by the element geometry, and under large deformations may be so distorted that the evaluation will produce errors in balancing force distribution. At this impact velocity, and subsequent strain rate, the full Lagrangian model would have produced some error in the elemental volume integration required to determine the internal force vector that is used to determine the time step acceleration term. In the SPH method, there is no need to evaluate the integration of volume within the element as there are no element connecting nodes, rather the internal force vector is through a pre-established association with the neighboring particles by means of the kernel function. This association is predetermined and becomes part of the derivative included within the conservation equations. Another potential source of error that led to the lower residual velocity is the implementation of the Coulomb friction coefficient in Abaqus’s general contact algorithm. If the friction coefficient is too high it can lead to binding in the model as it progresses. While the same friction coefficient was used in both models, the differences in relative motion of the projectile and target between the models would change the application of the friction and lead to errors in the velocity.
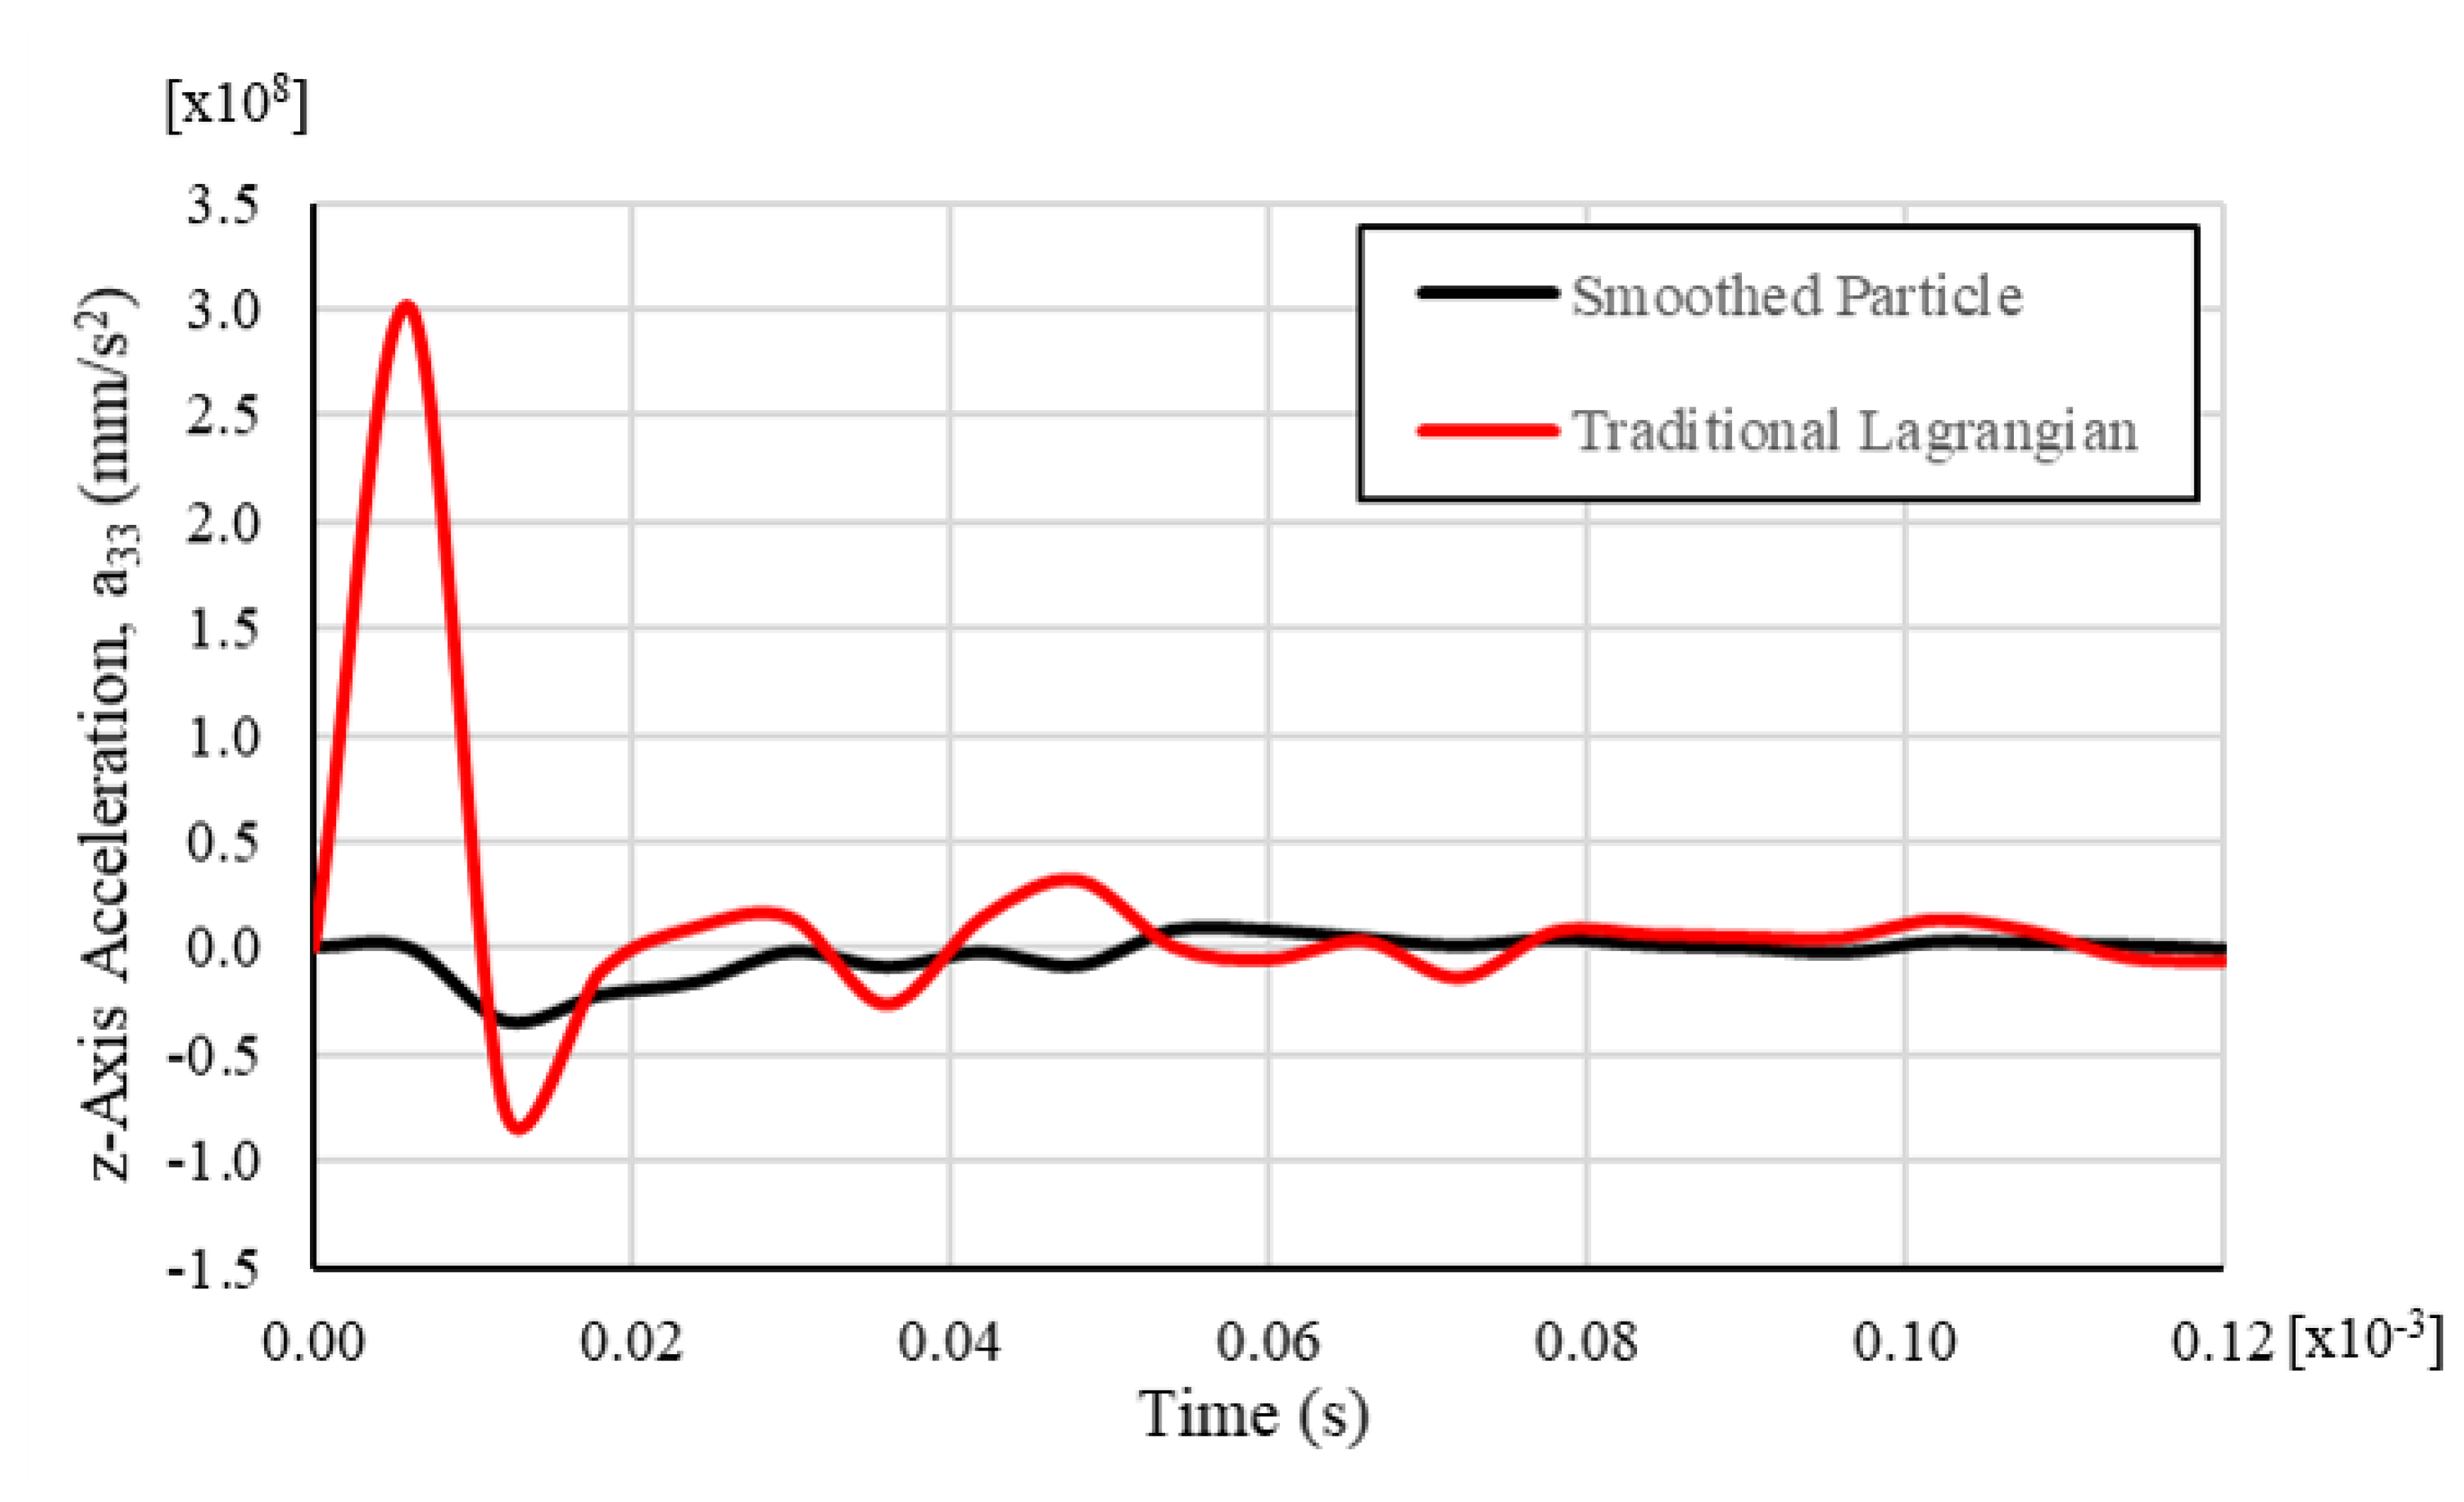
Figure 13, presents the impact axis, or z-axis, acceleration for a target particle and node on the edge of the initial contact. For reference, the model was oriented with initial impact velocity along the negative z-axis. The acceleration of the traditional Lagrangian element depicts a significantly larger rise in positive acceleration than the SPH particle in the beginning of the response. This difference is an important factor in the initial increase in velocity shown by the full Lagrangian model, and why the initial velocity of the SPH model stayed constant. The acceleration response of the full Lagrangian model also exhibits larger peaks and troughs, which is indicative of the errors manifesting in the internal energy volume integration.
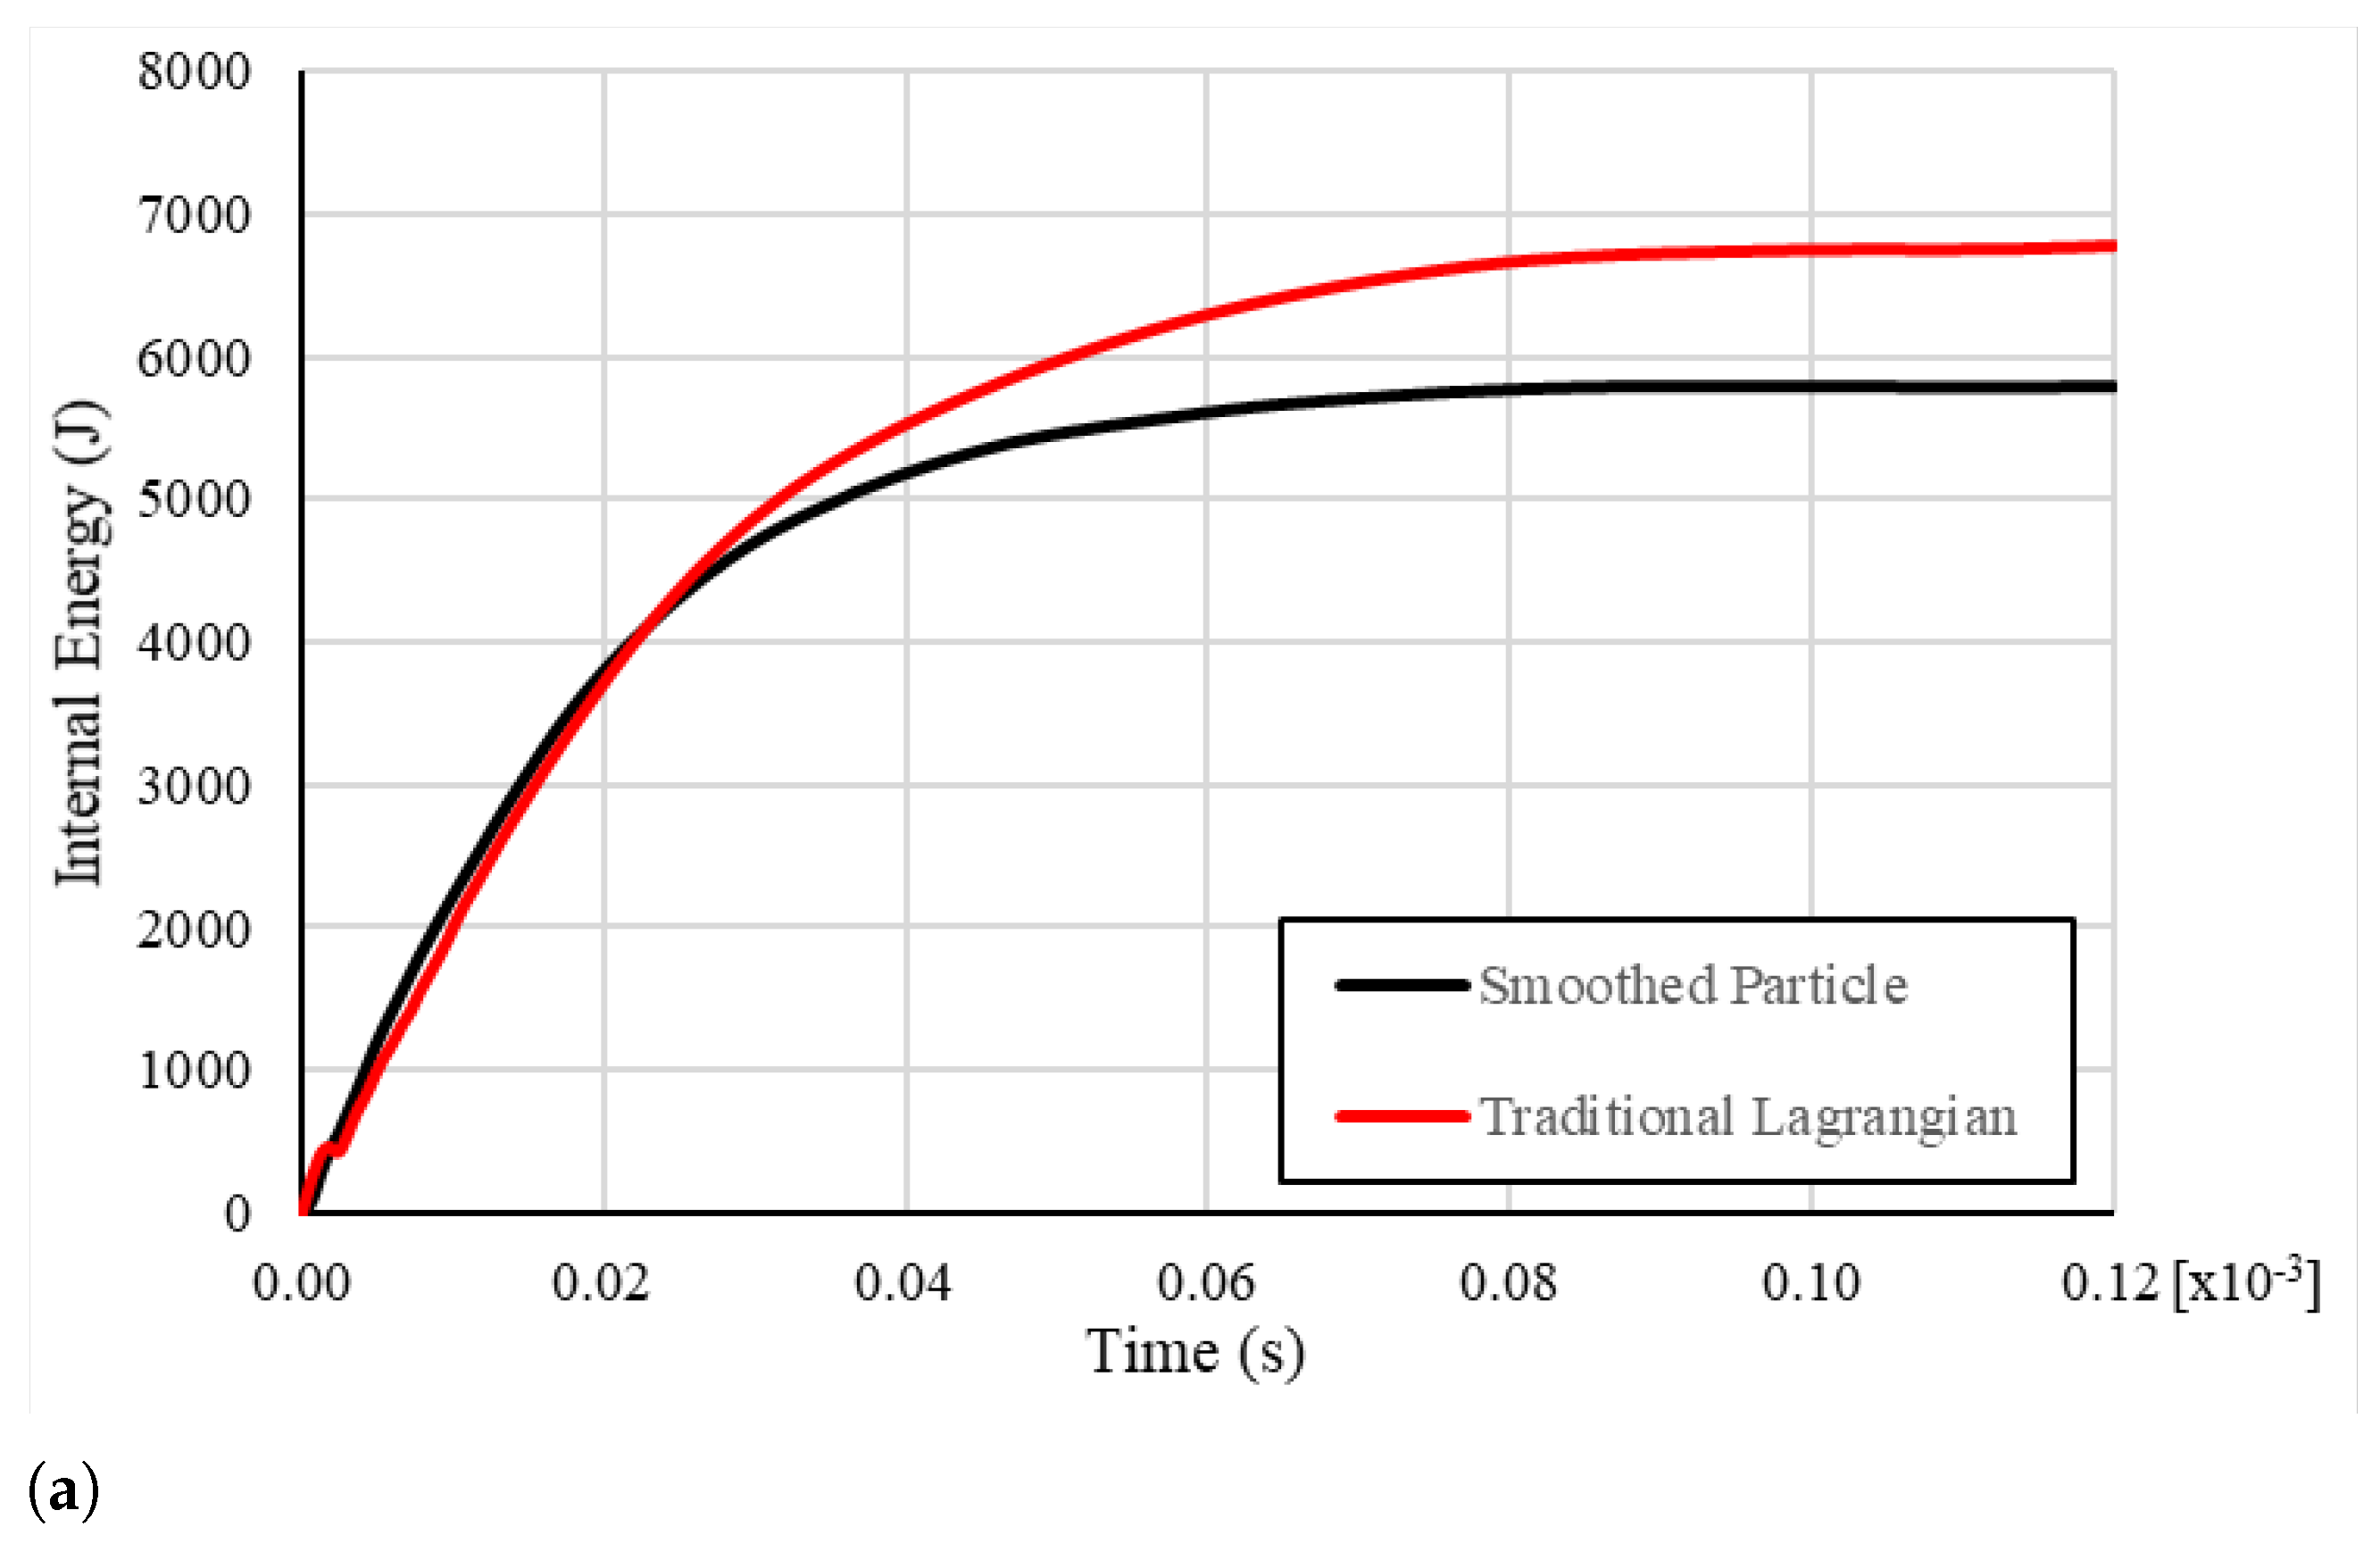
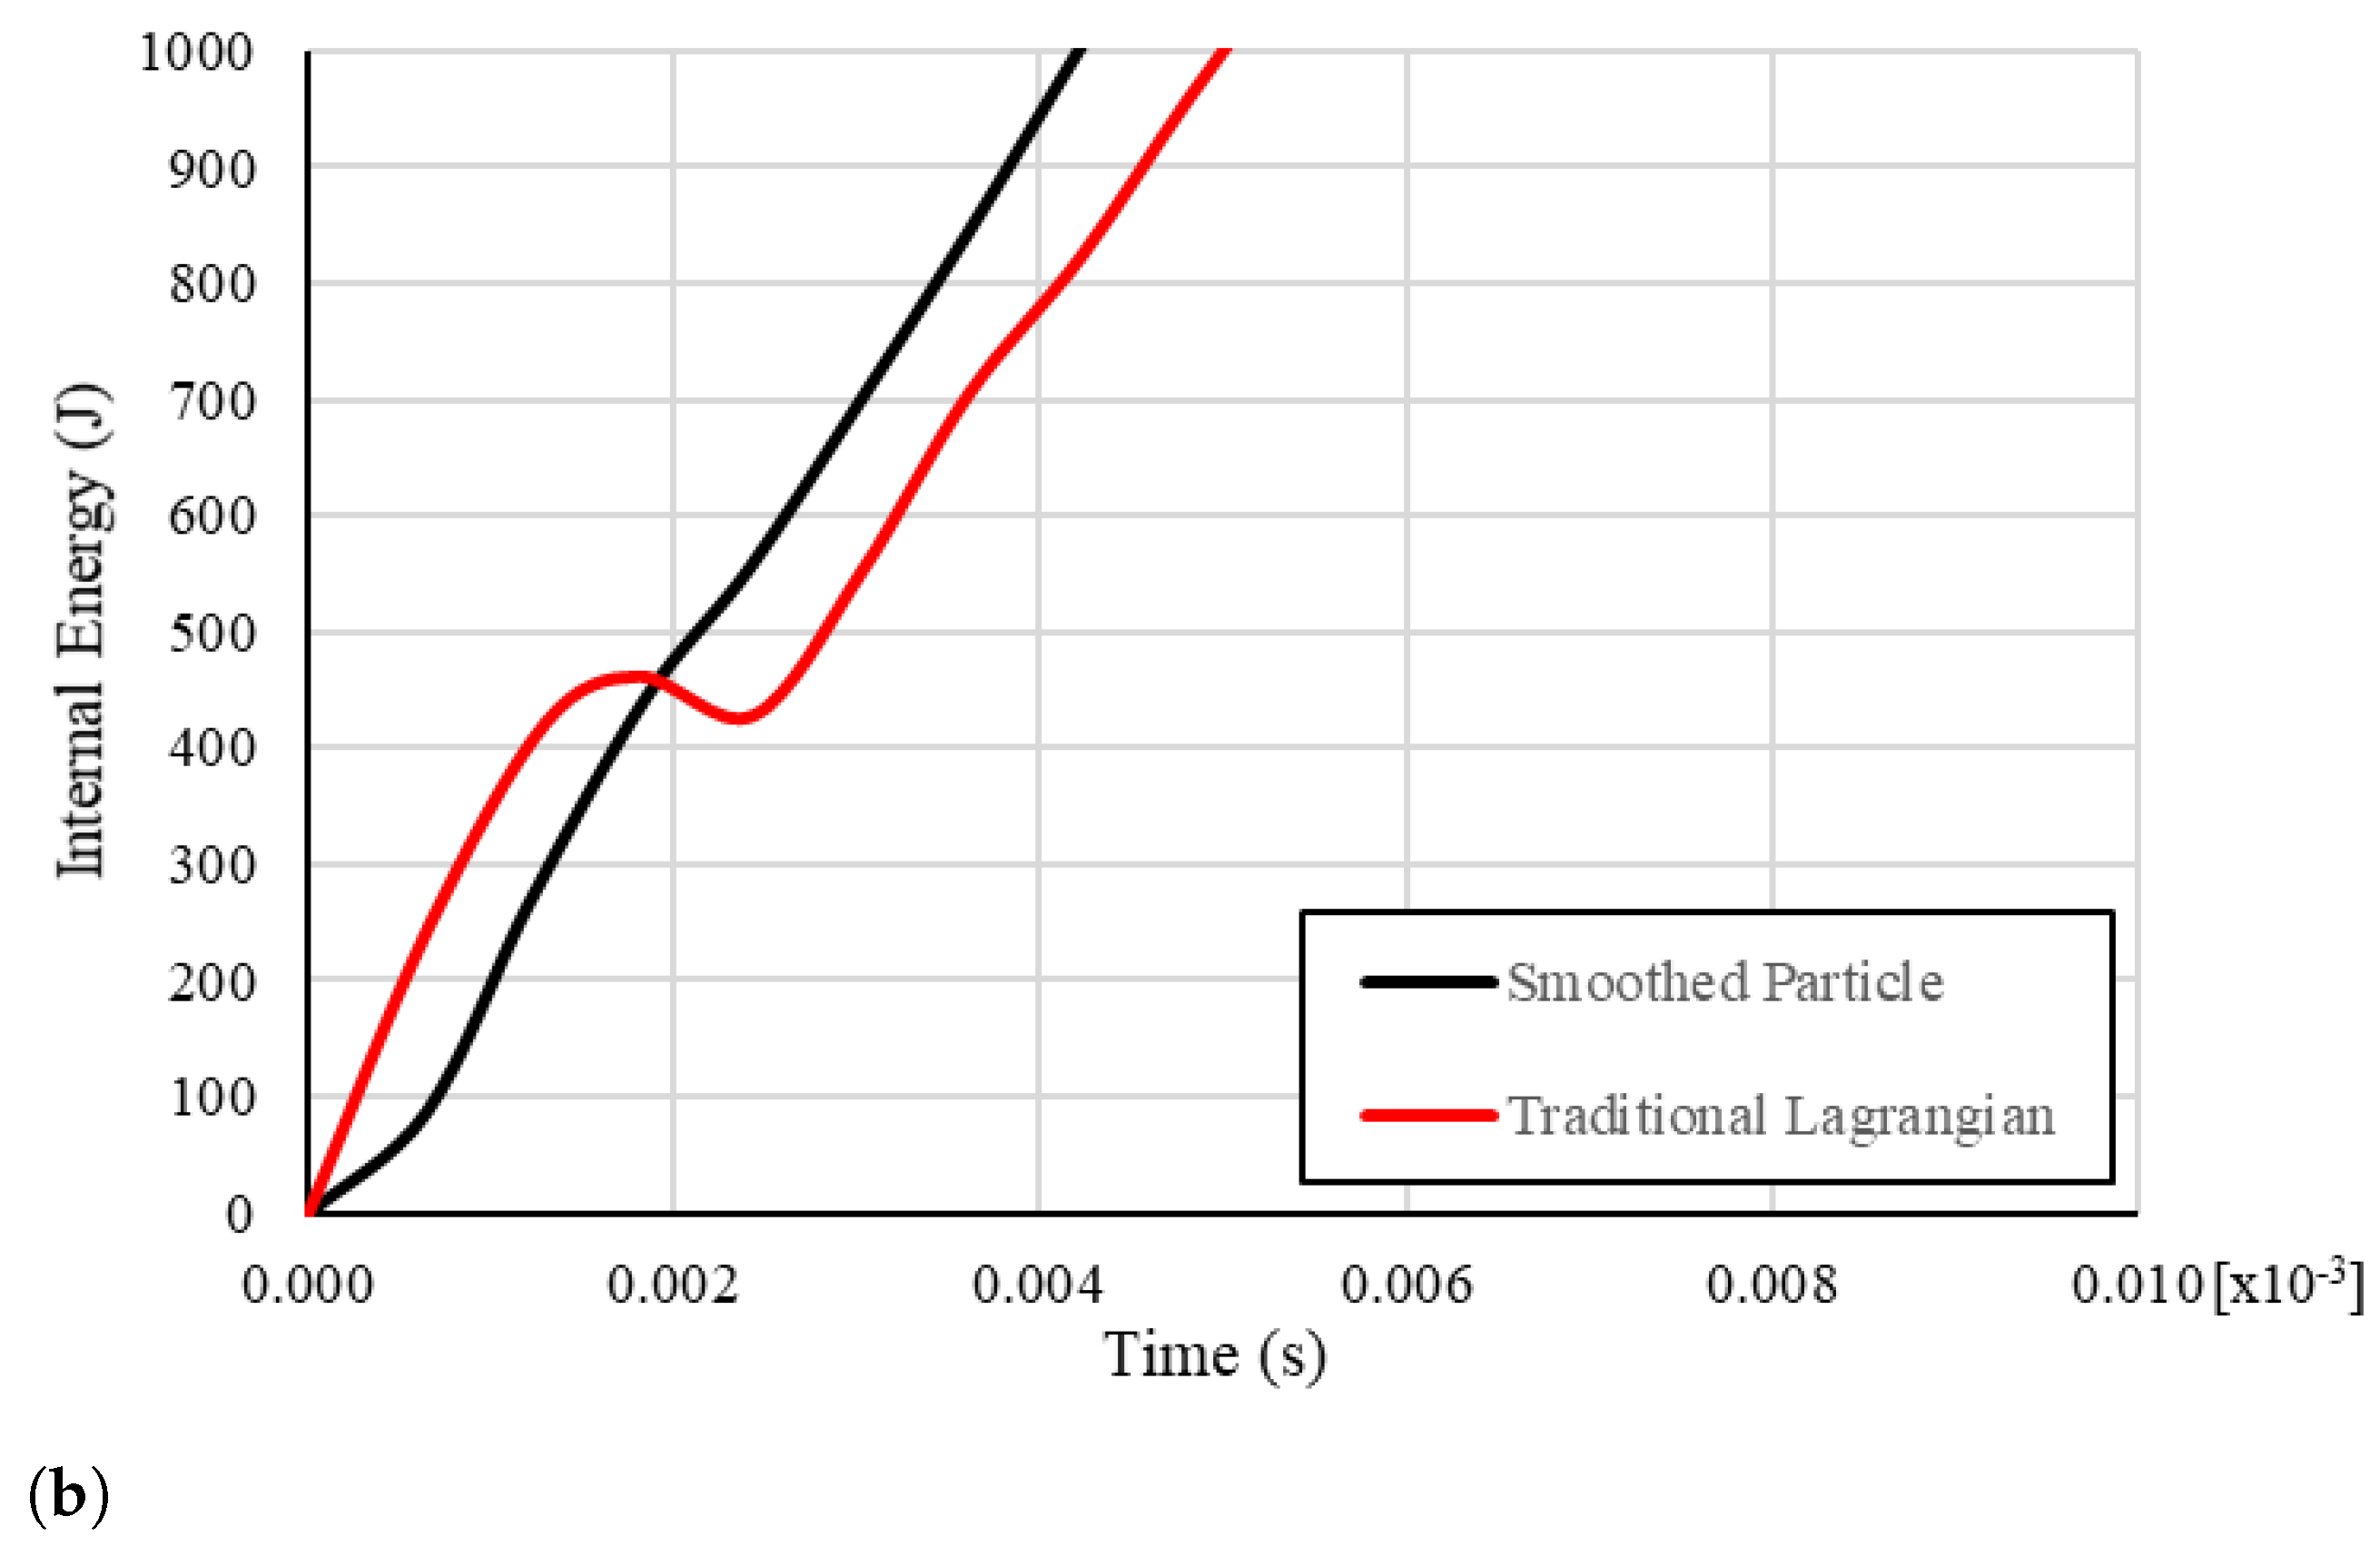
Furthermore, a comparison between the internal energy versus time for the two models is presented in Figure 14. Overall, the trend between the two curves is similar with the traditional model displaying higher internal energy values, see Figure 14a, but there is a unique artifact within the traditional model early within the simulation run, see Figure 14b. This variation within the internal energy curve is likely due to an error developed within the internal force calculations of the traditional method as mentioned above. Since the traditional Lagrangian model is based on Newton’s Second Law, the error in the acceleration derived from the internal force calculation would have been carried forward to the velocity and displacement vectors through the CDTI methodology shown in Equations (1)–(3) and compounded throughout the time step integration process. This is likely the cause of the significant error in residual velocity realized by the two traditional models.
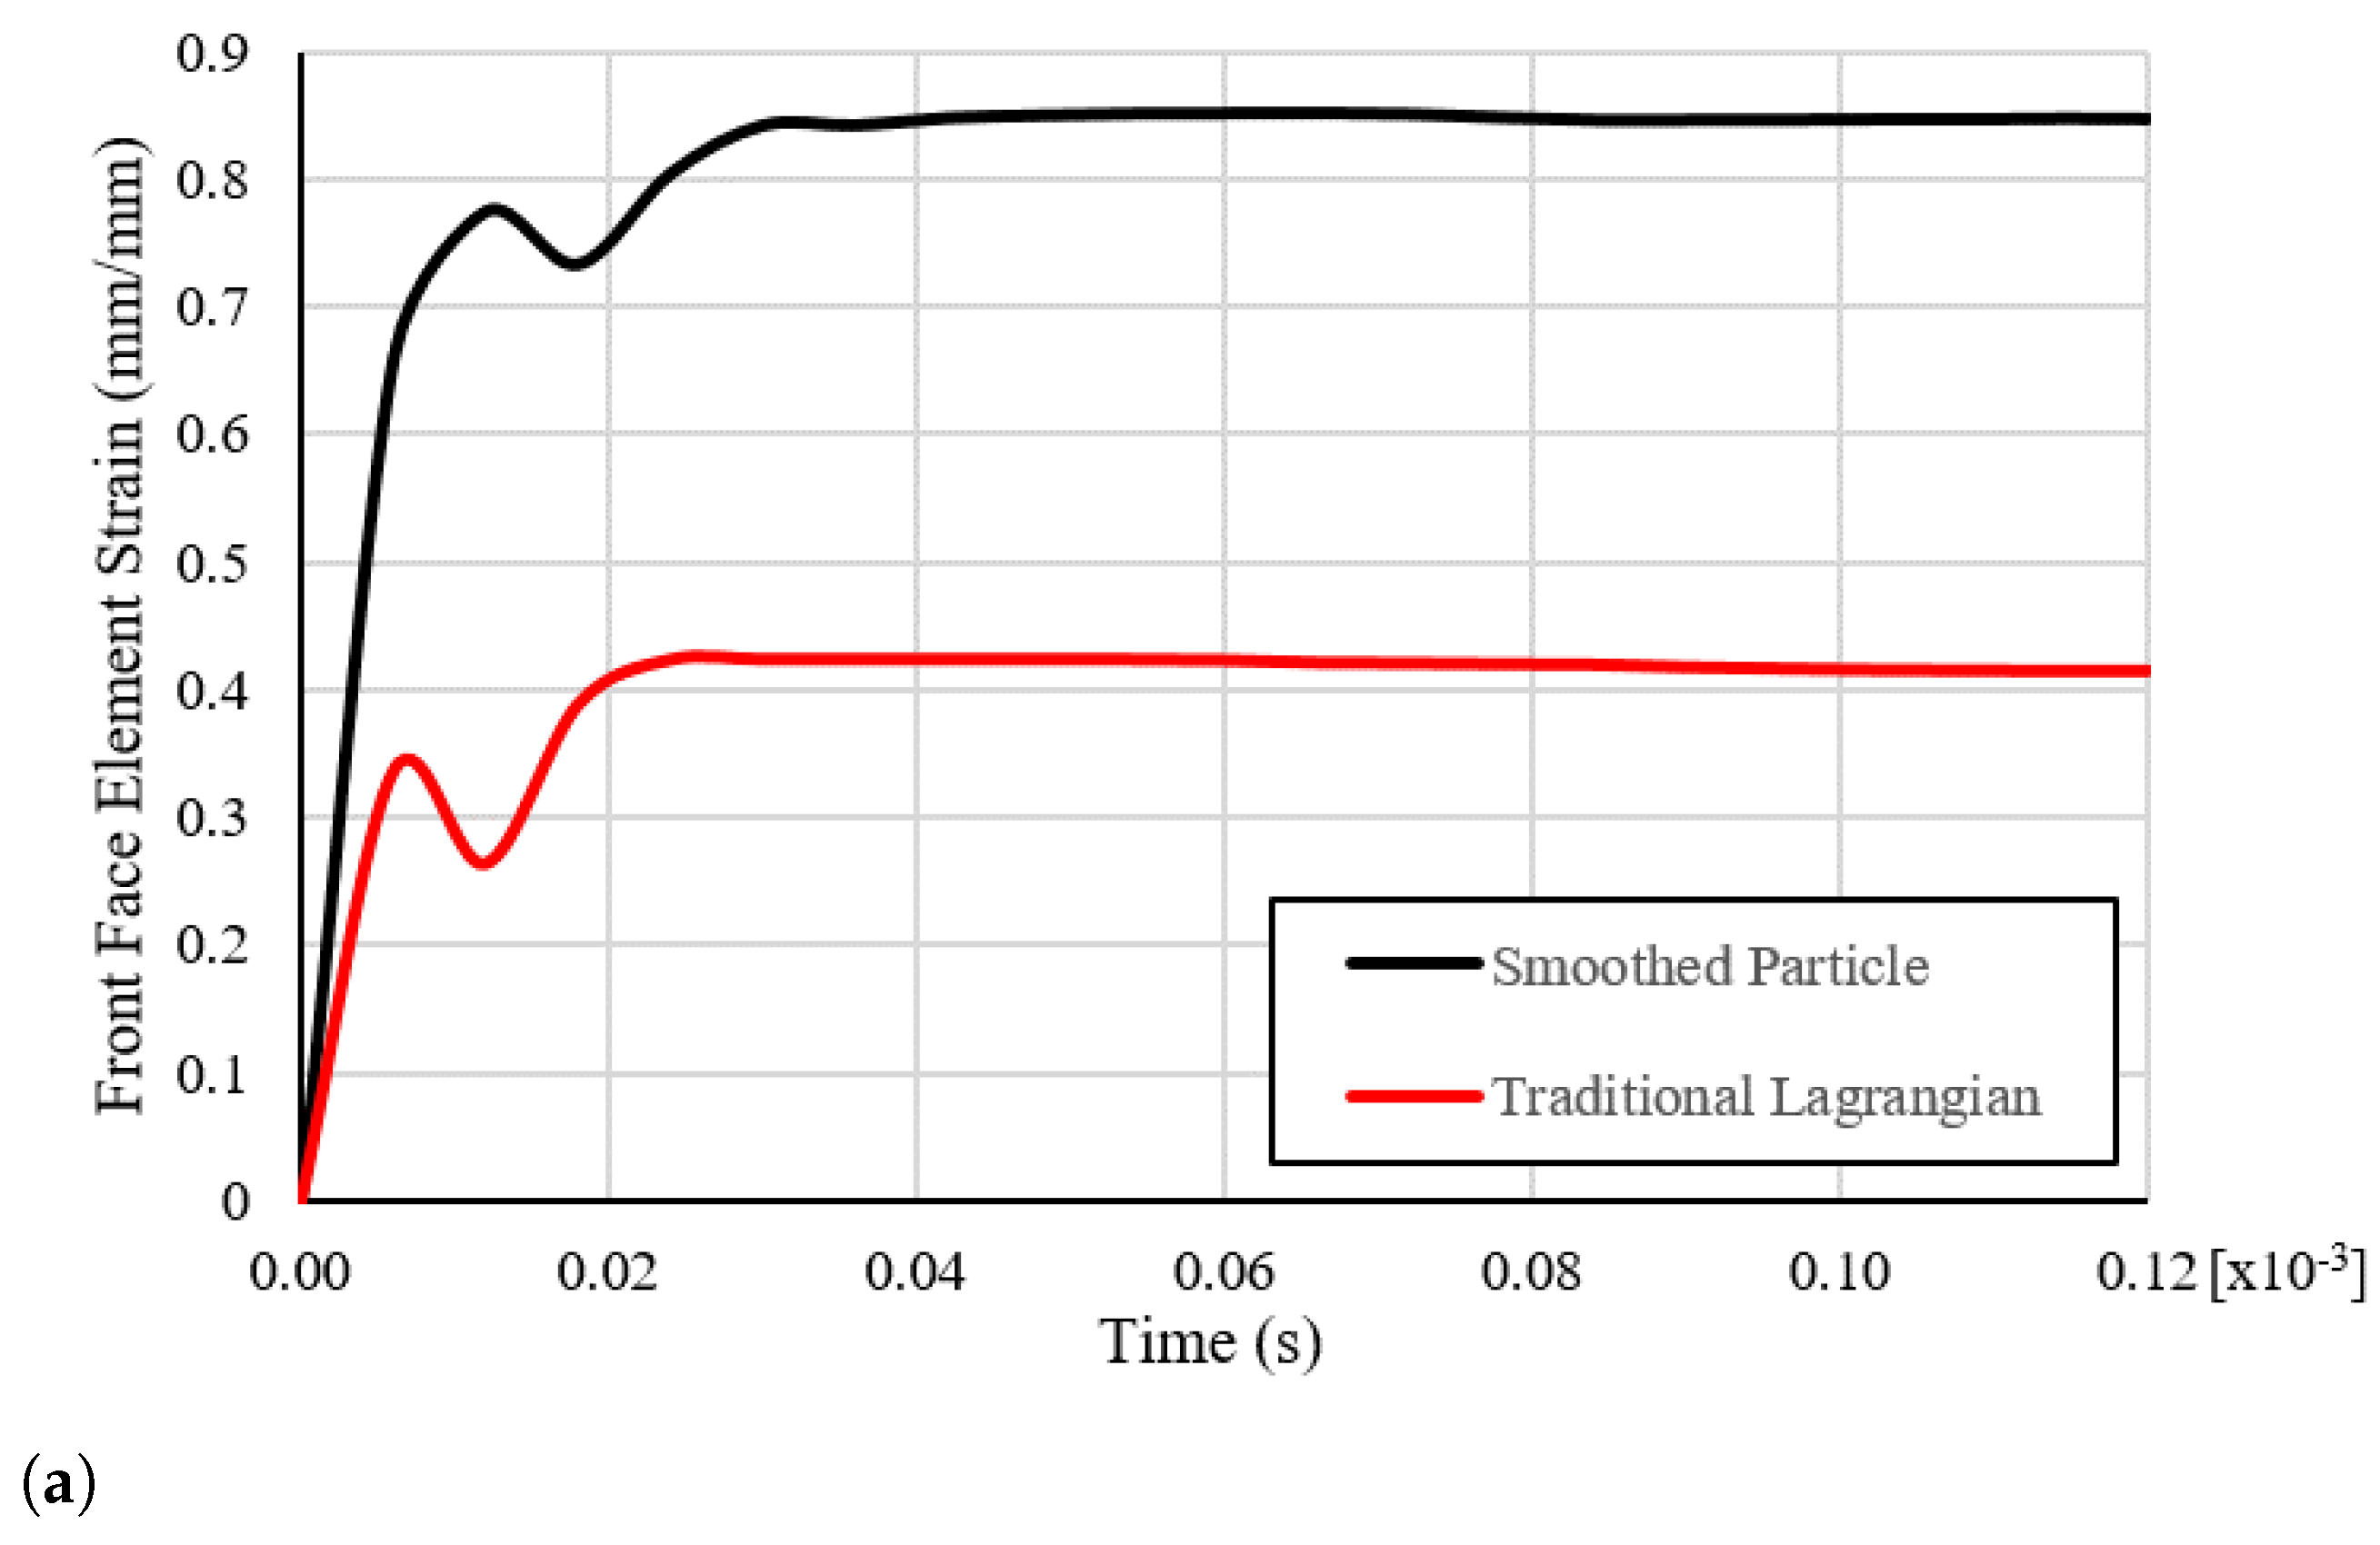
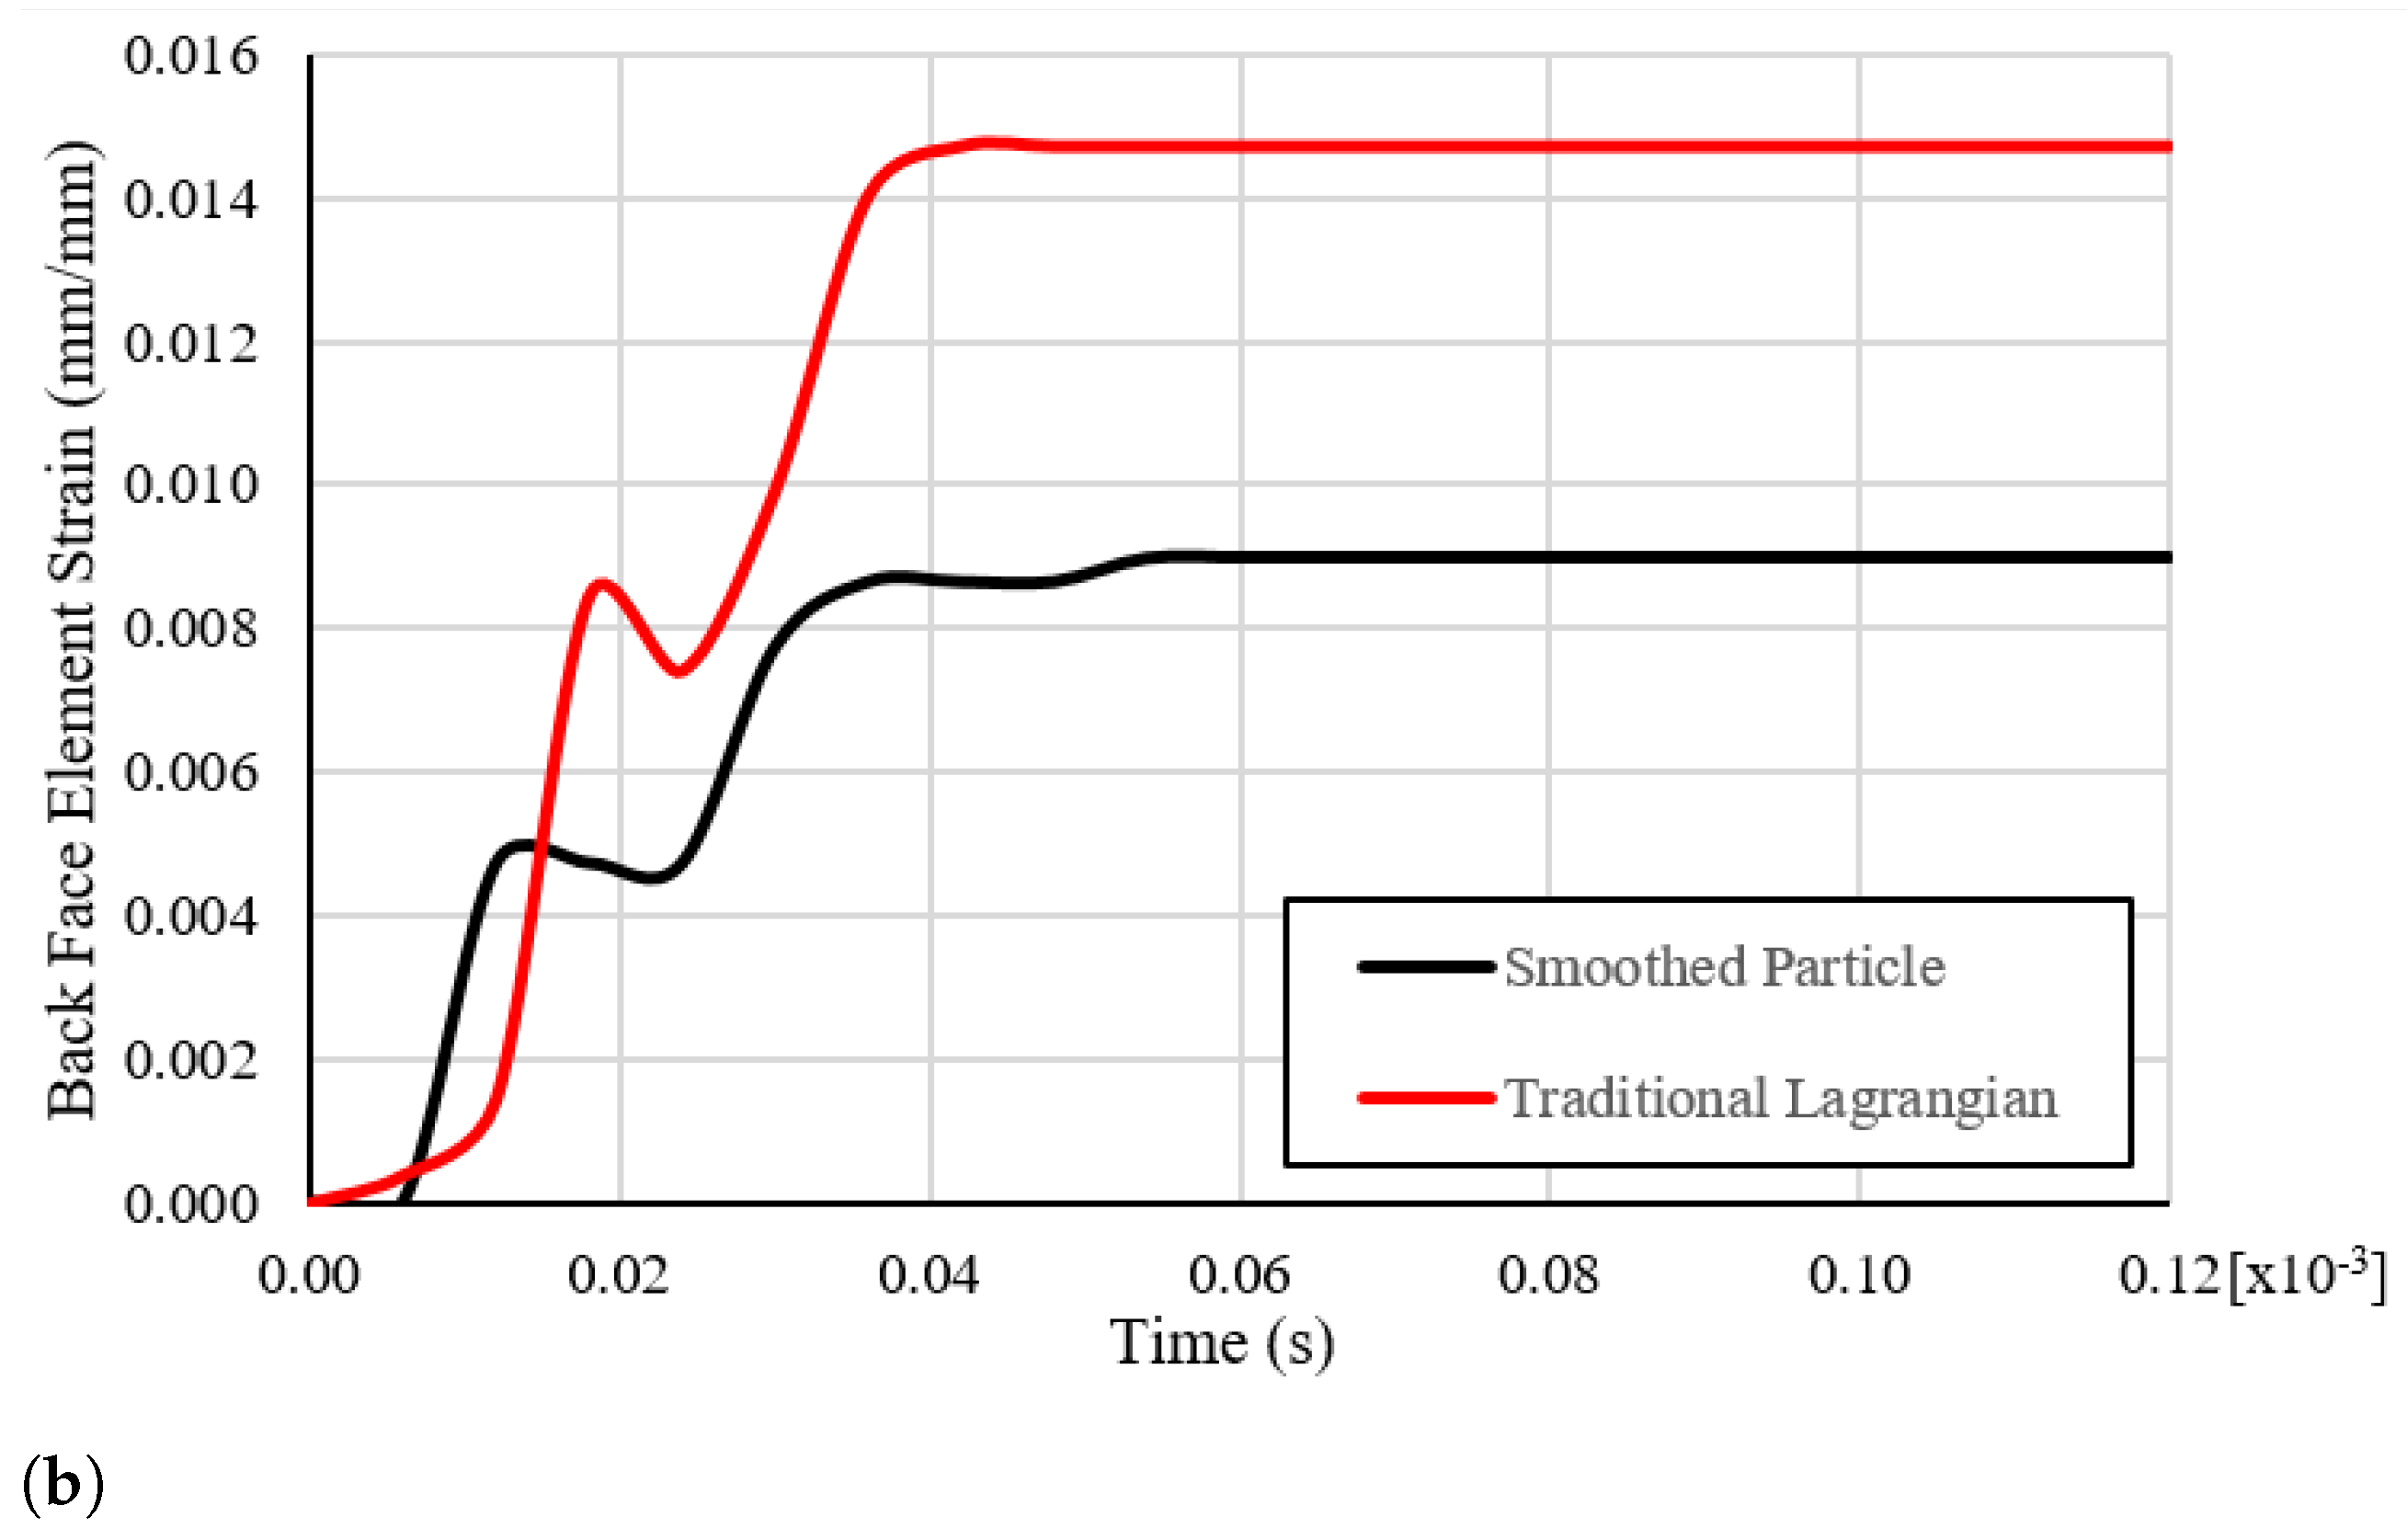
While both modeling techniques both rely upon a Lagrangian reference frame according to the internal interactions and external forces and thus evolve the system in time, within SPH the mathematical process of satisfying the three conservation equations alongside the equation of state reduces the likelihood of error. To highlight the differences in computed displacements between the two methods, a comparison of element strain over time is presented in Figure 15. Figure 15a compares the element strain of an element on the impact face of the projectile. As seen in the figure, both curve follow the same trend, although the SPH model strain is roughly twice that of the traditional model. Figure 15b shows a similar comparison for an element on the rear face of the projectile through the simulation duration. For this case, the response curves are not quite in alignment, although the general trend of the strain over time is comparable. The back face element shows the opposite case of the front face, in that here the strain values of the traditional model are higher than that of the SPH model, by roughly 70%. These figures emphasize the resultant difference in nodal displacements, and ultimately projectile strain, between the two models utilized.
Figure 16 depicts the plastic strain accumulation of a single target element or particle on the outer edge of the initial contact between the particle and target. The Johnson-Cook Damage Model, which is used to determine element and particle failure, relies upon the plastic strain accumulation within the model. The SPH plastic strain accumulation was characterized by a smooth accumulation up to a maximum strain of 0.73 mm/mm. The traditional Lagrangian response was significantly more chaotic, displaying several discontinuities. The element reached a maximum plastic strain of 1.1 mm/mm, although the mean plastic strain in the plateau region was 0.85 mm/mm. The more stable response from the SPH target provides a reliable input source into the damage model for determining degradation of material properties throughout the impact. The erratic strain response of the full Lagrangian model could lead to either early or late element deletion, which would have a substantial impact on further evaluation within the model.
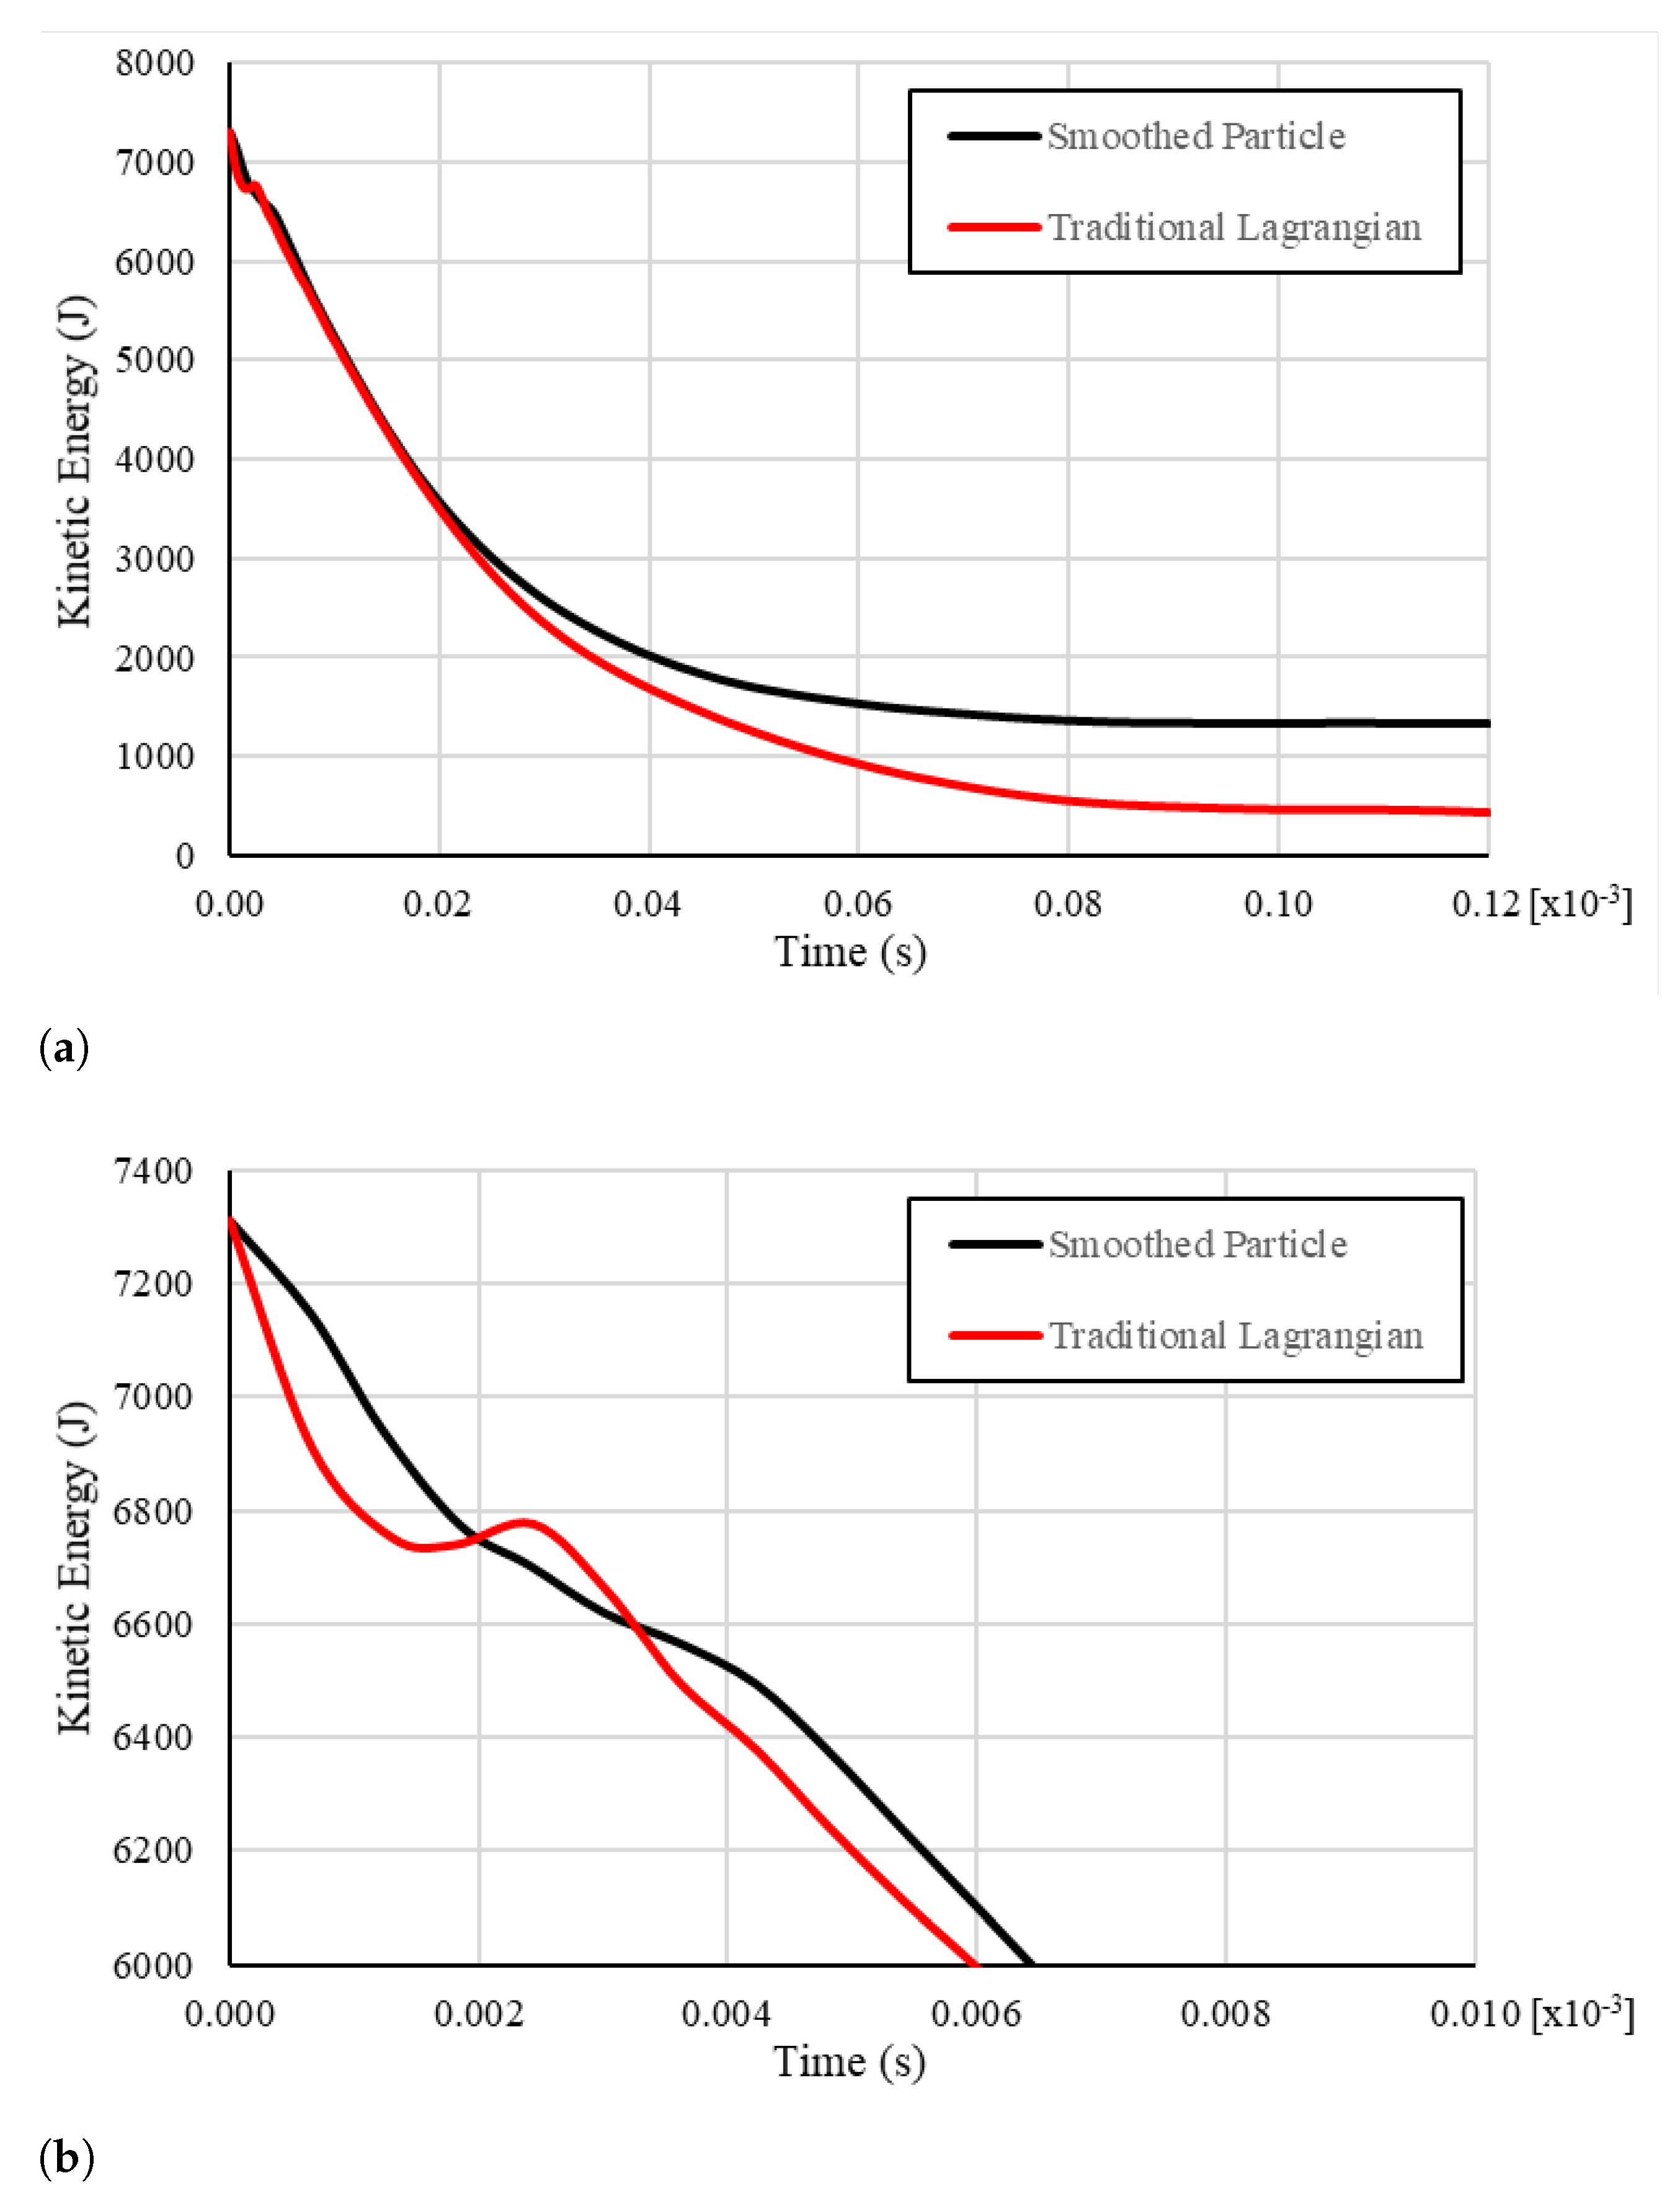
During the impact period, the high rate force is applied and kinetic energy is partially transferred between the colliding bodies, the use of the conservation of momentum and energy specifically provide a more balanced solution than Newton’s Second Law. Figure 17 shows a comparison of the model kinetic energy between the traditional model and mixed model. In Figure 17a, the model kinetic energy is presented over the entire simulation run, and it can be seen here that the SPH model retained a higher level of kinetic energy than the traditional model. This correlates with the higher residual velocity of the projectile in the SPH model; however, similar to the internal energy response, there is an interesting phenomenon that can be seen early in the simulation run, which is presented in Figure 17b. Early in the simulation, as shown in this figure, the traditional model appears to recover some kinetic energy, where the mixed model does not show this anomaly. This peculiar feature is a further indication of the errors produced in the Lagrangian impact model.

4. Conclusions

These two techniques show that there is a trade-off that must be made in the modeling of high-velocity projectile impact between computational cost and simulation performance. The first technique relied primarily on an explicit analysis of the impact using Lagrangian finite element methods and a finite difference time integration analysis to account for the dynamics. Lagrangian finite elements uses space-time discretization of the parts into a grid of elements connected by common nodes and boundaries. The time integration, CDTI, determines deformation through satisfying the equations of motions, which is used to find the strain and stress. Whereas the second technique, SPH, uses volume discretization into particles that retain volume, mass, and field properties. Then the three conservation equations are solved based on proximity to other particles through a kernel function. Considering the complexities of three-dimensional modeling, the Lagrangian model does an adequate job modeling physical deformation even at nearly 1000 m per second and at a reasonable computational cost. However, there are drawbacks to Lagrangian analysis. The most notable deficiency is that it does not model larger deformations or displacements well, which was plainly evident in the residual velocity results being one-tenth of that seen in experimentation. This deficiency is primarily caused by two factors. The first is in the volumetric integration used to determine the internal force vector, Equation (9), where the change in coordinate systems used between the Lagrangian and Eulerian systems introduces some error in the CDTI methodology, although less error than keeping the Lagrangian coordinate system through the integration. This miscalculation will propagate into the nodal displacement vector and can lead to significant mesh distortion, which will only further compound the error. A potential remedy to these issues within the full Lagrangian model is remeshing as the element distortion becomes too great to adequately evaluate the internal force integral. Remeshing adds significant complexity and time to the model, which would negate the benefit of a reduced run time. As the SPH technique does not rely on a mesh system, this error is not present in the SPH representation. The second source of error is in the mathematical methodology used, where the Lagrangian technique relies on solving Newton’s Second Law of Motion at each time step and SPH satisfies the conservation equations at each time step. The balance of the conservation equations with the equation of state provides for a more accurate solution at each individual time step in the formulation used here, which prevents compounding error. For these reasons, the mixed model was capable of handling higher strain rates and larger deformations better, which was evidenced in the closeness of the simulation results to the experimental values. The mixed model was able to achieve a residual velocity within a quarter of a percent of the experimental results, and also displayed asymmetric results in the deformation pattern similar to experimentation. While the computational cost was five times that of the more traditional Lagrangian technique, the improved accuracy in the solution makes the mixed model preferable for simulating high strain rate projectile impact.

Author Contributions

Conceptualization, D.G.S. and A.N.P.; Methodology, D.G.S. and A.N.P.; Software, D.G.S.; Validation, D.G.S., A.N.P. and R.A.K.; Formal Analysis, D.G.S.; Investigation, D.G.S.; Resources, A.N.P.; Data Curation, D.G.S.; Writing–Original Draft Preparation, D.G.S.; Writing–Review and Editing, A.N.P. and R.A.K.; Visualization, D.G.S.; Supervision, A.N.P.; Project Administration, D.G.S.; Funding Acquisition, A.N.P. All authors have read and agreed to the published version of the manuscript.

Funding

This research is sponsored by the United States Air Force, Air Force Research Laboratory, Air Force Office of Scientific Research (AFOSR) program on Dynamic Materials and Interactions.

Institutional Review Board Statement

Not applicable.

Informed Consent Statement

Not applicable.

Data Availability Statement

Data will be made available upon reasonable request.

Acknowledgments

The authors would like to thank Martin Schmidt for his support of this research.

Conflicts of Interest

The authors declare no conflict of interest. The funders had no role in the design of the study; in the collection, analyses, or interpretation of data; in the writing of the manuscript, or in the decision to publish the results.

Abbreviations

The following abbreviations are used in this manuscript:
CDTICentral Difference Time Integration
EOSEquation of State
FEAFinite Element Analysis
FEMFinite Element Method
KEKinetic Energy
SPHSmoothed Particle Hydrodynamics

References

  1. Ben-Dor, G.; Dubinsky, A.; Elperin, T. Ballistic impact: Recent advances in analytical modeling of plate penetration dynamics-a review. Appl. Mech. Rev. 2005, 58, 355–370. [Google Scholar] [CrossRef] [Green Version]
  2. Nair, R.P.; Rao, C.L. Simulation of depth of penetration during ballistic impact on thick targets using a one-dimensional discrete element model. Sadhana Acad. Proc. Eng. Sci. 2012, 37, 261–279. [Google Scholar] [CrossRef]
  3. Kurtaran, H.; Buyuk, M.; Eskandarian, A. Ballistic impact simulation of GT model vehicle door using finite element method. Theor. Appl. Fract. Mech. 2003, 40, 113–121. [Google Scholar] [CrossRef]
  4. Schwer, L.E. Aluminum Plate Perforation: A Comparative Case Study using Lagrange with Erosion, Multi-Material ALE, and Smooth Particle Hydrodynamics. In Proceedings of the 7th European LS-DYNA Conference, Salzburg, Austria, 14–15 May 2009; pp. 1–27. [Google Scholar]
  5. Resnyansky, A.; Katselis, G. Ballistic and Meterial Testing Procedures and Test Results for Composite Samples for the TIGER Helicopter Vulnerability Project, dsto-tr-16 ed.; Australian Government, Department of Defence: Canberra, Australia, 2004. [CrossRef]
  6. Johnson, G.R. High Velocity Impact Calculations in Three Dimensions. J. Appl. Mech. 1977, 44, 95–100. [Google Scholar] [CrossRef]
  7. Johnson, G.R. Closure to “Discussion of ‘High Velocity Impact Calculations in Three Dimensions’” (1977, ASME J. Appl. Mech., 44, pp. 793–794). J. Appl. Mech. 1977, 44, 794–795. [Google Scholar] [CrossRef]
  8. Gailly, B.A.; Espinosa, H.D. Modelling of failure mode transition in ballistic penetration with a continuum model describing microcracking and flow of pulverized media. Int. J. Numer. Methods Eng. 2002, 54, 365–398. [Google Scholar] [CrossRef]
  9. Grujicic, M.; Arakere, G.; He, T.; Bell, W.; Cheeseman, B.; Yen, C.F.; Scott, B. A ballistic material model for cross-plied unidirectional ultra-high molecular-weight polyethylene fiber-reinforced armor-grade composites. Mater. Sci. Eng. A 2008, 498, 231–241. [Google Scholar] [CrossRef]
  10. Grujicic, M.; Glomski, P.; He, T.; Arakere, G.; Bell, W.C.; Cheeseman, B. Material Modeling and Ballistic-Resistance Analysis of Armor-Grade Composites Reinforced with High-Performance Fibers. J. Mater. Eng. Perform. 2009, 18, 1169–1182. [Google Scholar] [CrossRef] [Green Version]
  11. Kantar, E.; Erdem, R.; Anıl, O. Nonlinear Finite Element Analysis of Impact Behavior of Concrete Beam. Math. Comput. Appl. 2011, 16, 183–193. [Google Scholar] [CrossRef] [Green Version]
  12. Hazell, P. Numerical simulations and experimental observations of the 5.56-MM L2A2 bullet perforating steel targets of two hardness values. J. Battlef. Technol. 2003, 6, 1–4. [Google Scholar]
  13. Borvik, T.; Dey, S.; Clausen, A. Perforation resistance of five different high-strength steel plates subjected to small-arms projectiles. Int. J. Impact Eng. 2009, 36, 948–964. [Google Scholar] [CrossRef]
  14. Cundall, P.A.; Strack, O.D.L. A discrete numerical model for granular assemblies. Géotechnique 1979, 29, 47–65. [Google Scholar] [CrossRef]
  15. Libersky, L.D.; Petschek, A.G. Smooth particle hydrodynamics with strength of materials. In Advances in the Free-Lagrange Method Including Contributions on Adaptive Gridding and the Smooth Particle Hydrodynamics Method; Trease, H.E., Fritts, M.F., Crowley, W.P., Eds.; Springer: Berlin/Heidelberg, Germany, 1991; pp. 248–257. [Google Scholar]
  16. Libersky, L.D.; Petschek, A.G.; Carney, T.C.; Hipp, J.R.; Allahdadi, F.A. High strain lagrangian hydrodynamics a three-dimensional SPH code for dynamic material response. J. Comput. Phys. 1993, 109, 67–75. [Google Scholar] [CrossRef]
  17. Randles, P.; Libersky, L. Smoothed Particle Hydrodynamics: Some recent improvements and applications. Comput. Methods Appl. Mech. Eng. 1996, 139, 375–408. [Google Scholar] [CrossRef]
  18. Johnson, G.; Petersen, E.H.; Stryk, R.A. Incorporation of an SPH option into the EPIC code for a wide range of high velocity impact computations. Int. J. Impact Eng. 1993, 14, 385–394. [Google Scholar] [CrossRef]
  19. Johnson, G.R.; Stryk, R.A.; Beissel, S.R. SPH for high velocity impact computations. Comput. Methods Appl. Mech. Eng. 1996, 139, 347–373. [Google Scholar] [CrossRef]
  20. O’Toole, B.; Trabia, M.; Hixson, R.; Roy, S.K.; Pena, M.; Becker, S.; Daykin, E.; Machorro, E.; Jennings, R.; Matthes, M. Modeling Plastic Deformation of Steel Plates in Hypervelocity Impact Experiments. Procedia Eng. 2015, 103, 458–465. [Google Scholar] [CrossRef] [Green Version]
  21. Poniaev, S.; Kurakin, R.; Sedov, A.; Bobashev, S.; Zhukov, B.; Nechunaev, A. Hypervelocity impact of mm-size plastic projectile on thin aluminum plate. Acta Astronaut. 2017, 135, 26–33. [Google Scholar] [CrossRef]
  22. Taddei, L.; Awoukeng Goumtcha, A.; Roth, S. Smoothed particle hydrodynamics formulation for penetrating impacts on ballistic gelatine. Mech. Res. Commun. 2015, 70, 94–101. [Google Scholar] [CrossRef]
  23. Frissane, H.; Taddei, L.; Lebaal, N.; Roth, S. SPH modeling of high velocity impact into ballistic gelatin. Development of an axis-symmetrical formulation. Mech. Adv. Mater. Struct. 2019, 26, 1881–1888. [Google Scholar] [CrossRef]
  24. Xiao, Y.; Dong, H.; Zhou, J.; Wang, J. Studying normal perforation of monolithic and layered steel targets by conical projectiles with SPH simulation and analytical method. Eng. Anal. Bound. Elem. 2017, 75, 12–20. [Google Scholar] [CrossRef]
  25. Chaussonnet, G.; Bravo, L.; Flatau, A.; Koch, R.; Bauer, H.J. Smoothed Particle Hydrodynamics Simulation of High Velocity Impact Dynamics of Molten Sand Particles. Energies 2020, 13, 5134. [Google Scholar] [CrossRef]
  26. Soriano-Moranchel, F.A.; Sandoval-Pineda, J.M.; Gutiérrez-Paredes, G.J.; Silva-Rivera, U.S.; Flores-Herrera, L.A. Simulation of Bullet Fragmentation and Penetration in Granular Media. Materials 2020, 13, 5243. [Google Scholar] [CrossRef] [PubMed]
  27. Graves, W.T.; Liu, D.; Palazotto, A.N. Impact of an Additively Manufactured Projectile. J. Dyn. Behav. Mater. 2017, 3, 362–376. [Google Scholar] [CrossRef]
  28. Provchy, Z.A.; Palazotto, A.N.; Flater, P. Topology Optimization for Projectile Design. J. Dyn. Behav. Mater. 2018, 4, 129–137. [Google Scholar] [CrossRef]
  29. Patel, A.; Palazotto, A.N. Investigation of Hybrid Material Projectile Impact Against Concrete Targets. In Proceedings of the 2018 AIAA/ASCE/AHS/ASC Structures, Structural Dynamics, and Materials Conference, Kissimmee, FL, USA, 8–12 January 2018. [Google Scholar] [CrossRef]
  30. Beard, A.; Palazotto, A.N. Composite Material for High-Speed Projectile Outer Casing. In Proceedings of the 2020 AIAA Science and Technology Forum, Orlando, FL, USA, 6–10 January 2020. [Google Scholar] [CrossRef]
  31. Spear, D.; Palazotto, A.N.; Kemnitz, R. Survivability and Damage Modeling of Advanced Materials. In Proceedings of the 2020 AIAA Science and Technology Forum, Orlando, FL, USA, 6–10 January 2020. [Google Scholar] [CrossRef]
  32. Spear, D.; Palazotto, A.N.; Kemnitz, R. First Cell Failure of Lattice Structure under Combined Axial and Buckling Load. In Proceedings of the AIAA Scitech 2021 Forum, Nashville, TN, USA, 11–15 January 2021; pp. 1–16. [Google Scholar] [CrossRef]
  33. Wilson, E.L. Structural analysis of axisymmetric solids. AIAA J. 1965, 3, 2269–2274. [Google Scholar] [CrossRef]
  34. Cook, R.D.; Malkus, D.S.; Plesha, M.E.; Witt, R.J. Concepts and Applications of Finite Element Analysis; John Wiley & Sons, Inc.: Hoboken, NJ, USA, 2002. [Google Scholar]
  35. Dassault Systèmes. ABAQUS Version 6.12 Theory Manual; Dassault Systemes Simulia Corp: Johnston, RI, USA, 2016. [Google Scholar]
  36. KJ Bath. Finite Element Procedures, 2nd ed.; KJ Bathe: Watertown, MA, USA, 2014; p. 1037. [Google Scholar]
  37. Johnson, G.; Cook, W. A Constitutive Model and Data for Metals Subjected to Large Strains, High Strain Rates, and High Temperatures. In Proceedings of the Seventh International Symposium on Ballistics, The Hague, The Netherlands, 19–21 April 1983; pp. 541–547. [Google Scholar]
  38. Leseur, D. Experimental Investigations of Material Models for Ti-6Al-4V Titanium and 2024-T3 Aluminum. DOT/FAA/AR-00/25. 2000, Volume 9, pp. 1–29. Available online: https://www.osti.gov/biblio/11977-experimental-investigationsmaterial-models-ti-t3 (accessed on 27 January 2021).
  39. Kay, G. Failure Modeling of Titanium-6Al-4V and 2024-T3 Aluminum with the Johnson-Cook Material Model. DOT/FAA/AR-03/57. 2003, Volume 9, pp. 1–17, doi:10.2172/15006359. Available online: https://www.osti.gov/biblio/15006359-failuremodeling-titanium-t3-aluminum-johnson-cook-material-model (accessed on 27 January 2021).
  40. Shames, I.; Cozzarelli, F. Elastic And Inelastic Stress Analysis; Taylor & Francis: Abingdon, UK, 1997. [Google Scholar]
  41. Gingold, R.A.; Monaghan, J.J. Smoothed particle hydrodynamics: Theory and application to non-spherical stars. Mon. Not. R. Astron. Soc. 1977, 181, 375–389. [Google Scholar] [CrossRef]
  42. Lucy, L.B. A numerical approach to the testing of the fission hypothesis. Astron. J. 1977, 82, 1013. [Google Scholar] [CrossRef]
  43. Wu, C.; Wu, Y.; Crawford, J.E.; Magallanes, J.M. Three-dimensional concrete impact and penetration simulations using the smoothed particle Galerkin method. Int. J. Impact Eng. 2017, 106, 1–17. [Google Scholar] [CrossRef]
  44. Islam, M.R.I.; Chakraborty, S.; Shaw, A. On consistency and energy conservation in smoothed particle hydrodynamics. Int. J. Numer. Methods Eng. 2018, 116, 601–632. [Google Scholar] [CrossRef]
  45. Chen, J.Y.; Peng, C.; Lien, F.S. Simulations for three-dimensional landmine detonation using the SPH method. Int. J. Impact Eng. 2019, 126, 40–49. [Google Scholar] [CrossRef]
  46. Monaghan, J.J. An introduction to SPH. Comput. Phys. Commun. 1988, 48, 89–96. [Google Scholar] [CrossRef]
  47. Monaghan, J.J. Smoothed Particle Hydrodynamics. Annu. Rev. Astron. Astrophys. 1992, 30, 543–574. [Google Scholar] [CrossRef]
  48. Liu, M.; Liu, G. Particle Methods for Multi-Scale and Multi-Physics; World Scientific: Singapore, 2016. [Google Scholar] [CrossRef]
  49. Zisis, I.; van der Linden, B.; Giannopapa, C. Towards a Smoothed Particle Hydrodynamics Algorithm for Shocks Through Layered Materials, Volume 4: Fluid-Structure Interaction. In Proceedings of the Pressure Vessels and Piping Conference, Paris, France, 14–18 July 2013; p. V004T04A005. [Google Scholar] [CrossRef] [Green Version]
  50. Stranex, T.; Wheaton, S. A new corrective scheme for SPH. Comput. Methods Appl. Mech. Eng. 2011, 200, 392–402. [Google Scholar] [CrossRef]
  51. Vignjevic, R.; Campbell, J.; Jaric, J.; Powell, S. Derivation of SPH equations in a moving referential coordinate system. Comput. Methods Appl. Mech. Eng. 2009, 198, 2403–2411. [Google Scholar] [CrossRef] [Green Version]
  52. Batra, R.C.; Zhang, G.M. SSPH basis functions for meshless methods, and comparison of solutions with strong and weak formulations. Comput. Mech. 2008, 41, 527–545. [Google Scholar] [CrossRef]
  53. Zhang, G.M.; Batra, R.C. Symmetric smoothed particle hydrodynamics (SSPH) method and its application to elastic problems. Comput. Mech. 2009, 43, 321–340. [Google Scholar] [CrossRef]
  54. Cueto-Felgueroso, L.; Colominas, I.; Mosqueira, G.; Navarrina, F.; Casteleiro, M. On the Galerkin formulation of the smoothed particle hydrodynamics method. Int. J. Numer. Methods Eng. 2004, 60, 1475–1512. [Google Scholar] [CrossRef] [Green Version]
  55. Dilts, G.A. Moving-Least-Squares-particle hydrodynamics—I. Consistency and stability. Int. J. Numer. Methods Eng. 1999, 44, 1115–1155. [Google Scholar] [CrossRef]
  56. Dilts, G.A. Moving least-squares particle hydrodynamics II: Conservation and boundaries. Int. J. Numer. Methods Eng. 2000, 48, 1503–1524. [Google Scholar] [CrossRef]
  57. Colagrossi, A.; Landrini, M. Numerical simulation of interfacial flows by smoothed particle hydrodynamics. J. Comput. Phys. 2003, 191, 448–475. [Google Scholar] [CrossRef]
  58. Liu, G.; Liu, M. Smoothed Particle Hydrodynamics: A Meshfree Particle Method; World Scientific: Singapore, 2003. [Google Scholar] [CrossRef]
  59. Danilewicz, A.; Sikora, Z. Numerical Simulation of Crater Creating Process in Dynamic Replacement Method by Smooth Particle Hydrodynamics. Stud. Geotech. Mech. 2015, 36, 3–8. [Google Scholar] [CrossRef] [Green Version]
  60. Barbosa, D.; Piccoli, F. Comparing the force due to the Lennard-Jones potential and the Coulomb force in the SPH Method. J. Ocean Eng. Sci. 2018, 3, 310–315. [Google Scholar] [CrossRef]
  61. Holzapfel, W.B. Equations of State and Thermophysical Properties of Solids Under Pressure. In High-Pressure Crystallography; Springer: Dordrecht, The Netherlands, 2004; pp. 217–236. [Google Scholar] [CrossRef]
  62. Meyers, M.A. Dynamic Behavior of Materials; Wiley: Hoboken, NJ, USA, 1994. [Google Scholar] [CrossRef]
  63. Roy, S.K.; Trabia, M.; O’Toole, B.; Hixson, R.; Becker, S.; Pena, M.; Jennings, R.; Somasoundaram, D.; Matthes, M.; Daykin, E.; et al. Study of Hypervelocity Projectile Impact on Thick Metal Plates. Shock Vib. 2016, 2016, 1–11. [Google Scholar] [CrossRef] [Green Version]
  64. Zocher, M.; Maudlin, P.; Chen, S.; Flower-Maudlin, E. An Evaluation of Several Hardening Models using Taylor Cylinder Impact Data. In Proceedings of the European Congress on Computational Methods in Applied Sciences and Engineering (ECCOMAS 2000), Barcelona, Spain, 11–14 September 2000; Volume 53, pp. 1–20. [Google Scholar] [CrossRef]
  65. Rice, M.H.; McQueen, R.G.; Walsh, J.M. Compression of Solids by Strong Shock Waves. Solid State Phys. Adv. Res. Appl. 1958, 6, 1–63. [Google Scholar] [CrossRef]
  66. Mandl, F. Statistical Physics, 2nd ed.; Wiley: Hoboken, NJ, USA, 1991. [Google Scholar]
  67. Marc, G.; McMillan, W.G. The Virial Theorem. In Advances in Chemical Physics; John Wiley & Sons, Inc.: Hoboken, NJ, USA, 2007; Volume 63, pp. 209–361. [Google Scholar] [CrossRef]
  68. Heuzé, O. General form of the Mie-Grüneisen equation of state. Comptes Rendus-Mec. 2012, 340, 679–687. [Google Scholar] [CrossRef]
  69. Goldstein, H.; Poole, C.; Safko, J. Classical Mechanics; Addison Wesley: Boston, MA, USA, 2002. [Google Scholar]
  70. Grüneisen, E. Theorie des festen Zustandes einatomiger Elemente. Ann. Phys. 1912, 344, 257–306. [Google Scholar] [CrossRef] [Green Version]
  71. Johnson, G.R.; Cook, W.H. Fracture characteristics of three metals subjected to various strains, strain rates, temperatures and pressures. Eng. Fract. Mech. 1985, 21, 31–48. [Google Scholar] [CrossRef]
  72. Cowan, R.; Winer, W. Frictional Heating Calculations. Frict. Lubr. Wear Technol. ASM Handb. 1992, 18, 39–44. [Google Scholar]
  73. Meyer, H.W.; Kleponis, D.S. Modeling the high strain rate behavior of titanium undergoing ballistic impact and penetration. Int. J. Impact Eng. 2001, 26, 509–521. [Google Scholar] [CrossRef]
  74. Wang, X.; Shi, J. Validation of Johnson-Cook plasticity and damage model using impact experiment. Int. J. Impact Eng. 2013, 60, 67–75. [Google Scholar] [CrossRef]
  75. Committee, A.H. Properties and Selection: Nonferrous Alloys and Special-Purpose Materials; ASM International: Almere, The Netherlands, 1990. [Google Scholar] [CrossRef]
  76. Johnson, G.R.; Holmquist, T.J. Test Data and Computational Strength and Fracture Model Constants for 23 Materials Subjected to Large Strains, High Strain Rates, and High Temperatures; Los Alamos National Laboratory: Los Alamos, NM, USA, 1989.
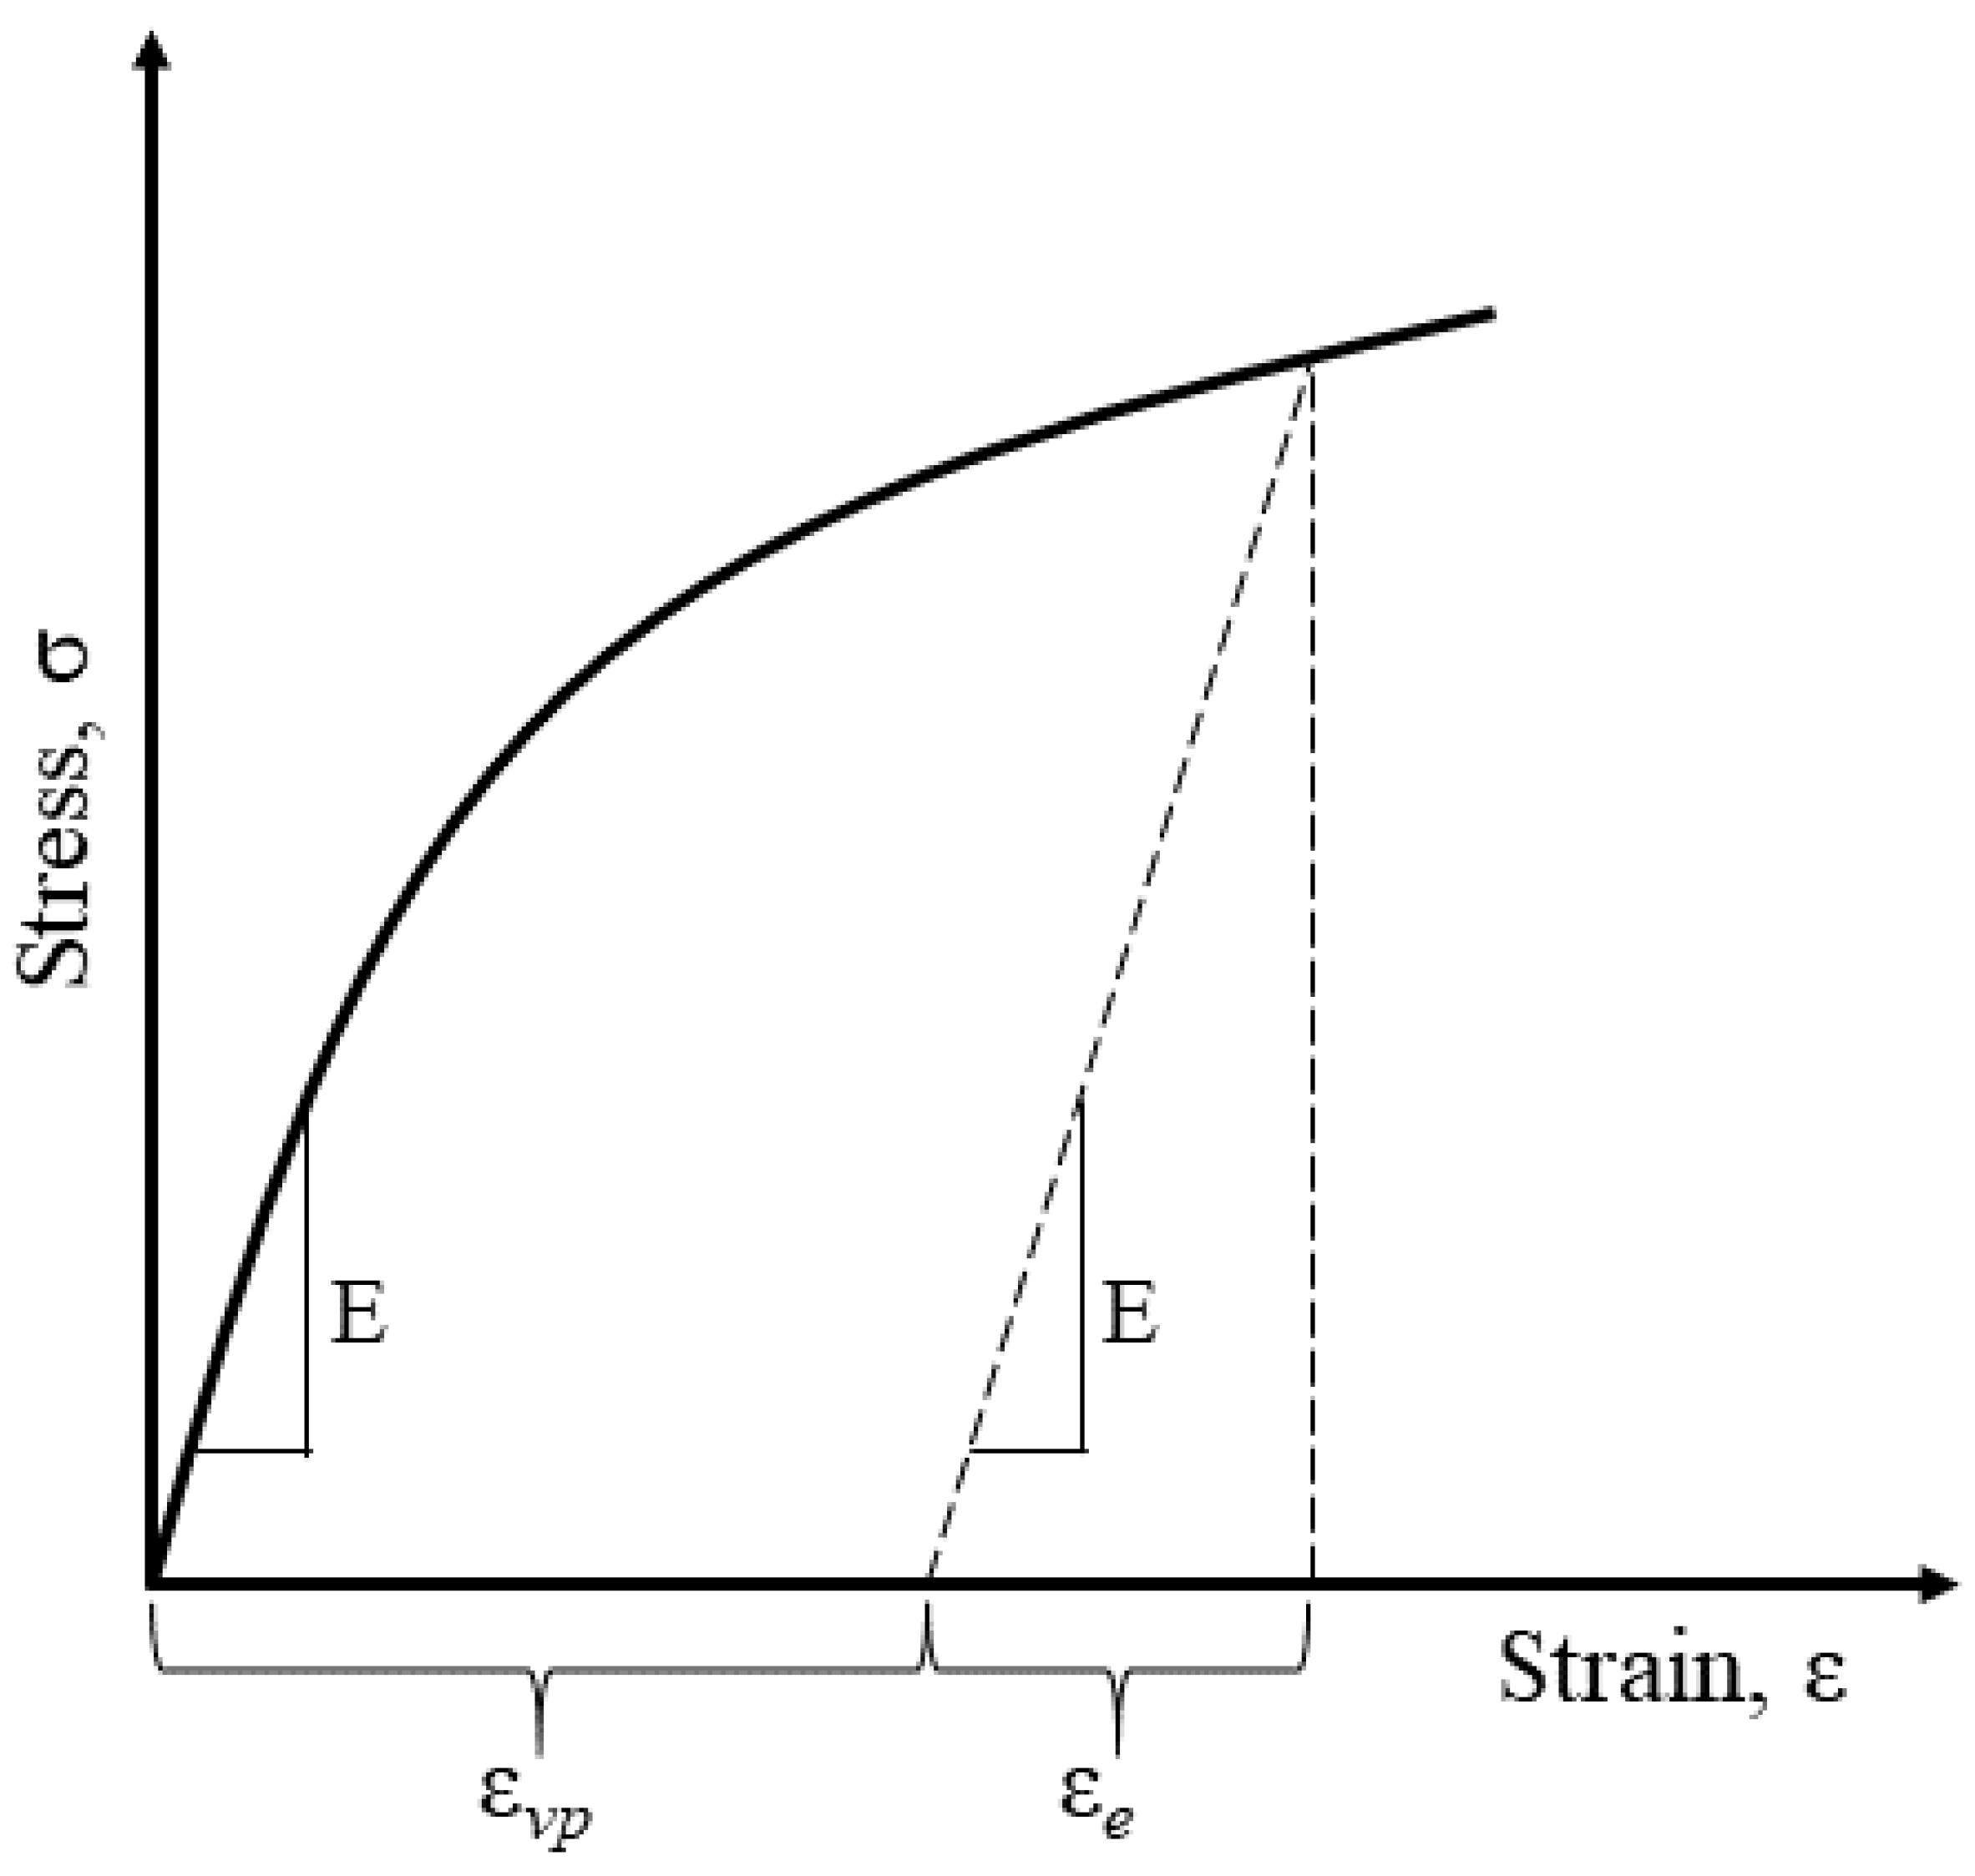
Figure 1. Typical Uniaxial Stress-Strain Response Curve.
Mathematics 09 00274 g001
Figure 2. Traditional Grid Mesh versus Smoothed Particle Hydrodynamics Discretization.
Mathematics 09 00274 g002
Figure 3. Visualization of the Cubic Spline Kernel Function.
Mathematics 09 00274 g003
Figure 4. Ghost Particle Formulation along a Lagrangian Boundary Surface.
Mathematics 09 00274 g004
Figure 5. Depiction of Impact Simulation Loading and Boundary Conditions.
Mathematics 09 00274 g005
Figure 6. Stress Colormap Scale: (a) Traditional Lagrangian Model, (b) Mixed Traditional-SPH Model.
Mathematics 09 00274 g006
Figure 7. Symmetry Reduced versus Full Scale Model Impact Model.
Mathematics 09 00274 g007
Figure 8. Visual Comparison of the Projectile with the Finite Element Results.
Mathematics 09 00274 g008
Figure 9. Visual Comparison of the Target with the Finite Element Results.
Mathematics 09 00274 g009
Figure 10. Visual Comparison of the Target with the Smoothed Particle Hydrodynamics Results.
Mathematics 09 00274 g010
Figure 11. Visual Comparison of the Projectile with the Smoothed Particle Hydrodynamics Results.
Mathematics 09 00274 g011
Figure 12. Comparison of Projectile Residual Velocity between Traditional Lagrangian Finite Element and Smoothed Particle Hydrodynamics Models.
Mathematics 09 00274 g012
Figure 13. Comparison of Impact-Axis Acceleration between Traditional Lagrangian Finite Element and Smoothed Particle Hydrodynamics Models.
Mathematics 09 00274 g013
Figure 14. Model Internal Energy versus Time Comparison: (a) Full Run Duration, (b) Initial Reaction.
Mathematics 09 00274 g014aMathematics 09 00274 g014b
Figure 15. Element Strain versus Time: (a) Projectile Impact Face, (b) Projectile Back Face.
Mathematics 09 00274 g015aMathematics 09 00274 g015b
Figure 16. Comparison of Plastic Strain along the Impact Axis between Traditional Lagrangian Finite Element and Smoothed Particle Hydrodynamics Models.
Mathematics 09 00274 g016
Figure 17. Model Kinetic Energy versus Time Comparison: (a) Full Run Duration, (b) Initial Reaction.
Mathematics 09 00274 g017
Table 1. Material properties of 6061-T6 Aluminum [75].
Material PropertyValue
Elastic Modulus, E69 GPa
Poisson’s Ratio, ν 0.33
Density, ρ 2700 g/m 3
Table 2. Johnson-Cook Model Parameters for 6061-T6 Aluminum [76].
Johnson-Cook ParameterValue
Yield Stress, A324.1 MPa
Strain Hardening Parameter, B113.8 MPa
Strain Rate Parameter, C0.002
Thermal Softening Exponent, m1.34
Strain Hardening Exponent, n0.42
Damage Constant, D 1 −0.77
Damage Constant, D 2 1.45
Damage Constant, D 3 −0.47
Damage Constant, D 4 0.0
Damage Constant, D 5 1.6
Table 3. Comparison of Computational Models.
ModelResidual Velocity
(m/s)
Residual Velocity
Error (%)
Processor Time
(h)
Experimental336.194--
Traditional, Full30.18691.0211.0
Traditional, Reduced30.18991.0200.3
SPH335.4060.2345.2
Publisher’s Note: MDPI stays neutral with regard to jurisdictional claims in published maps and institutional affiliations.