
Reliability and Validity of the Medical Outcomes Study Short Form-12 Version 2 (SF-12v2) in Adults with Non-Cancer Pain

Abstract
:1. Introduction
2. Materials and Methods
2.1. Data Source
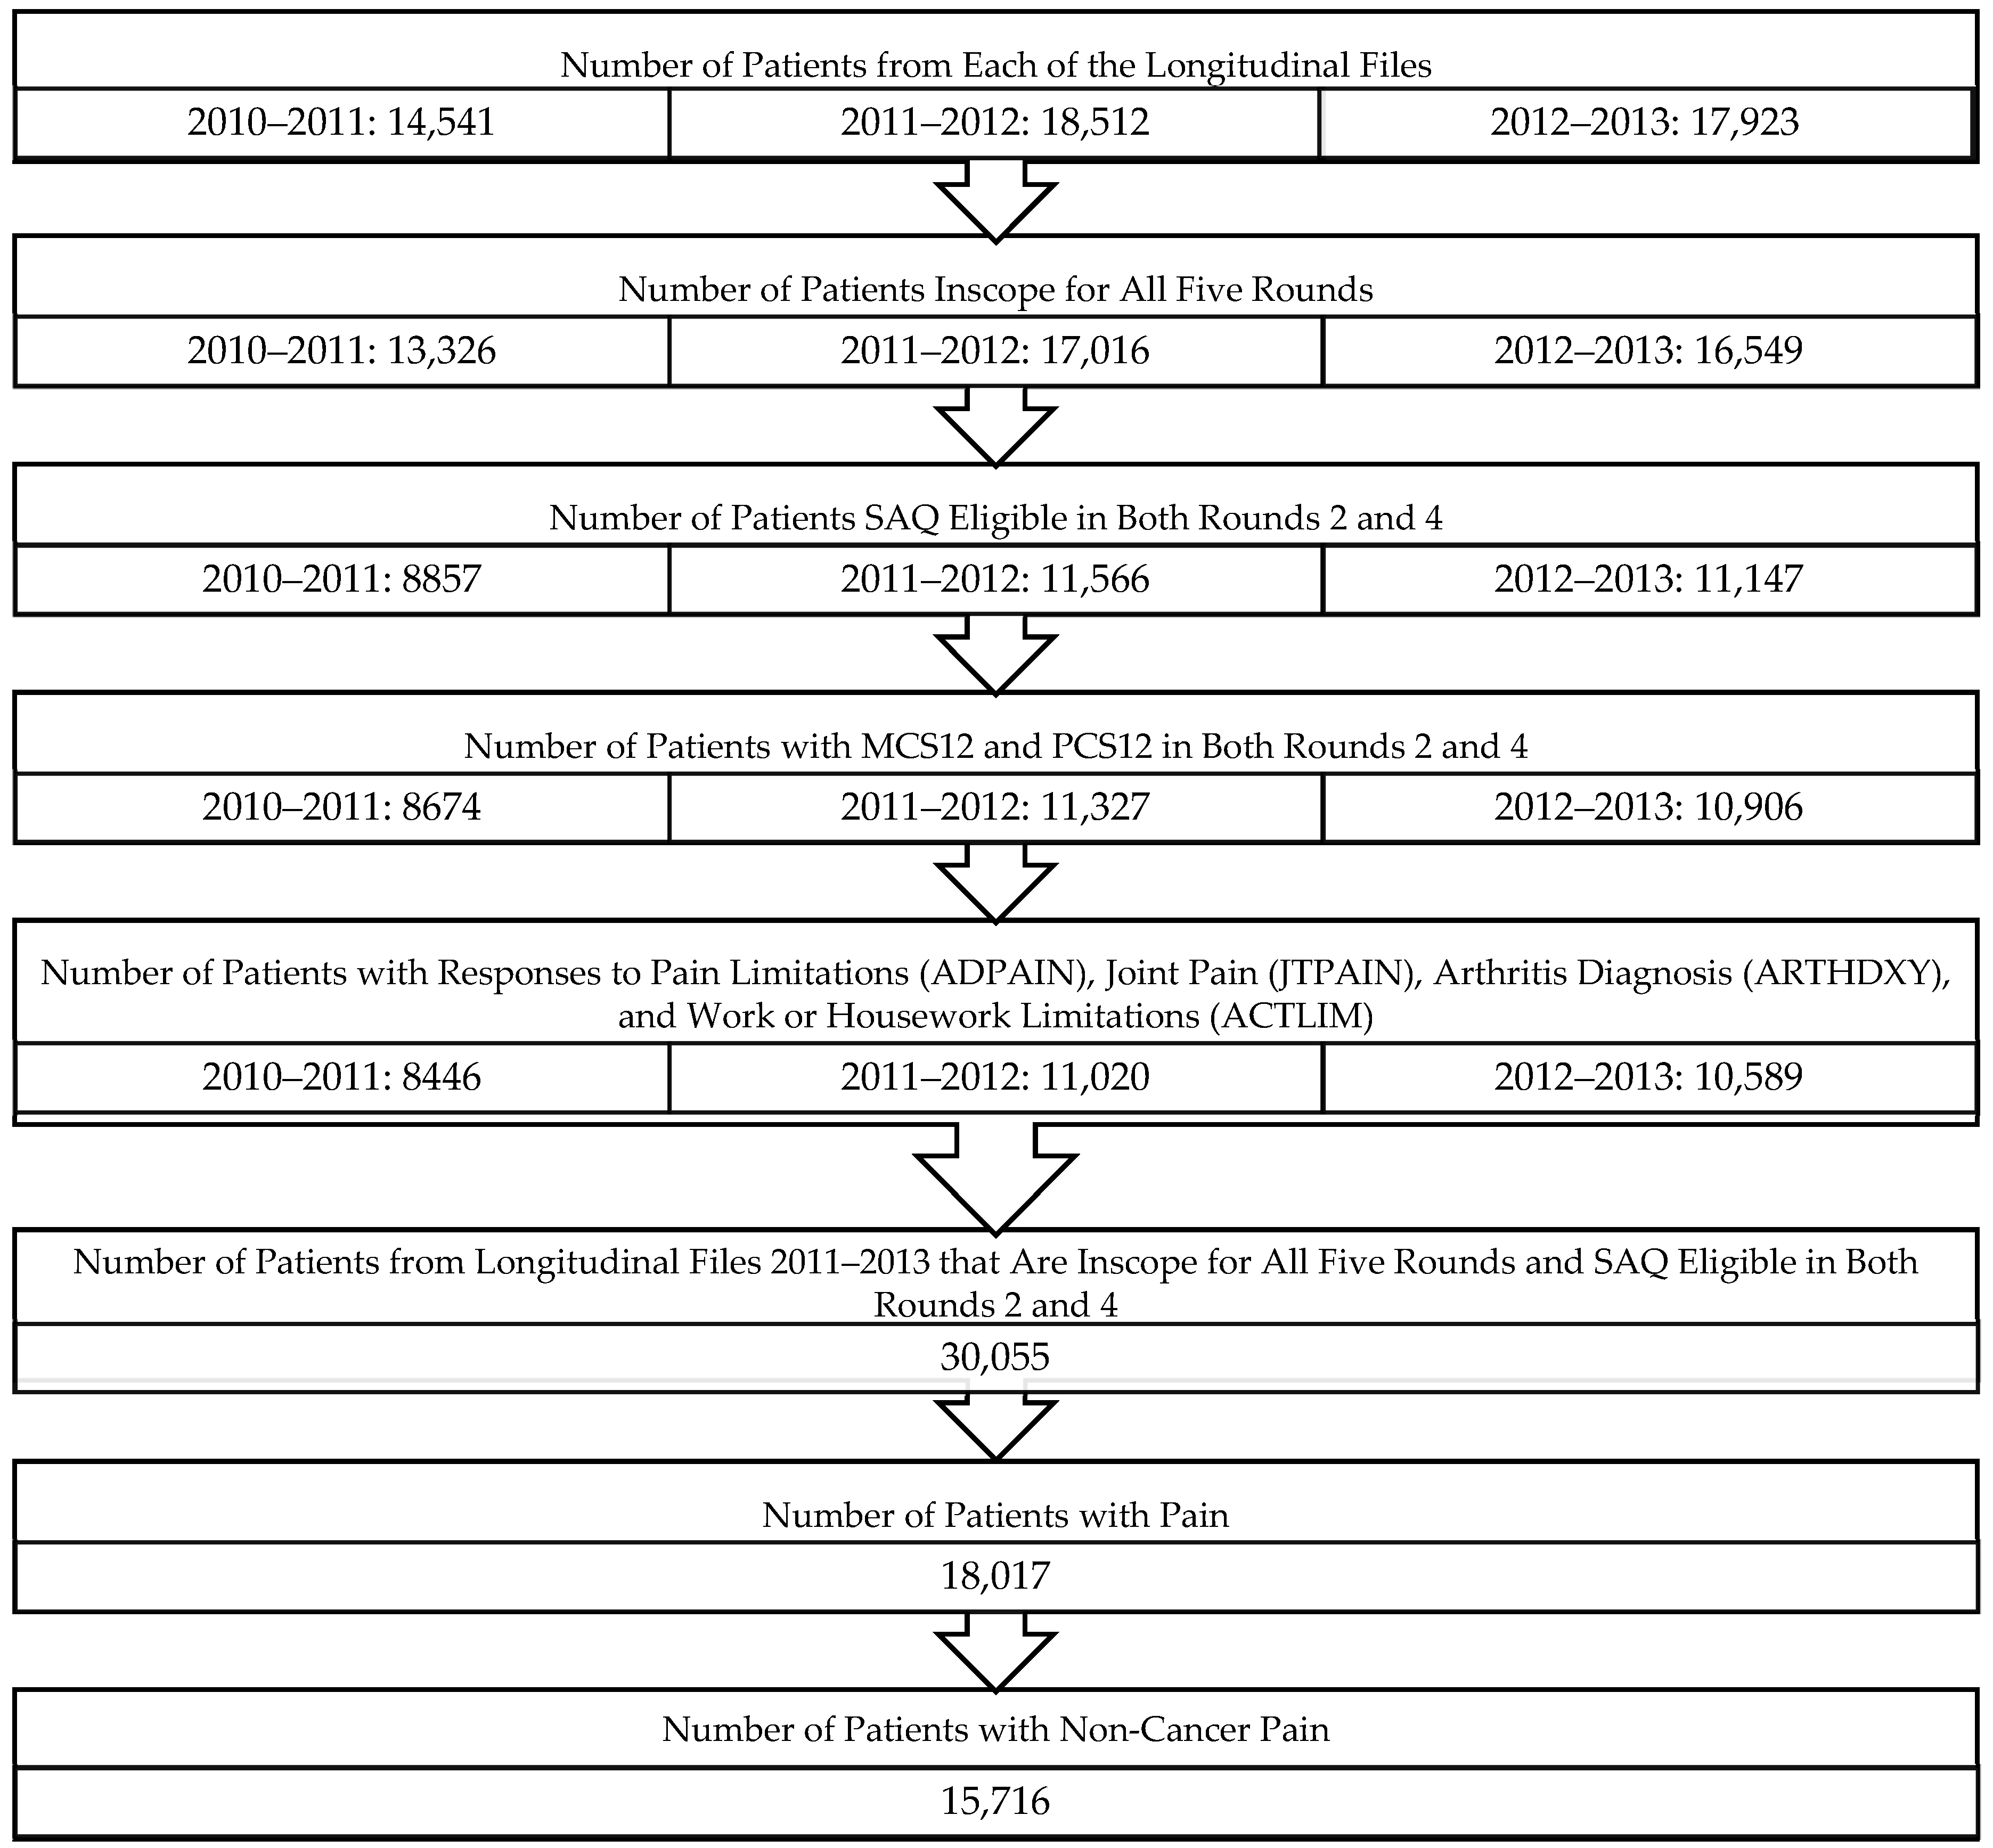
2.2. Study Sample
2.3. Primary Outcome Measure
SF-12v2
2.4. Other Measures
2.4.1. Perceived Health and Perceived Mental Health
2.4.2. Chronic Conditions
2.4.3. Physical and Cognitive Limitations
2.4.4. Pain Limitation Severity
2.5. Statistical Analysis
2.5.1. Reliability
2.5.2. Validity
3. Results
3.1. Participant Characteristics
3.2. Reliability
3.3. Construct Validity
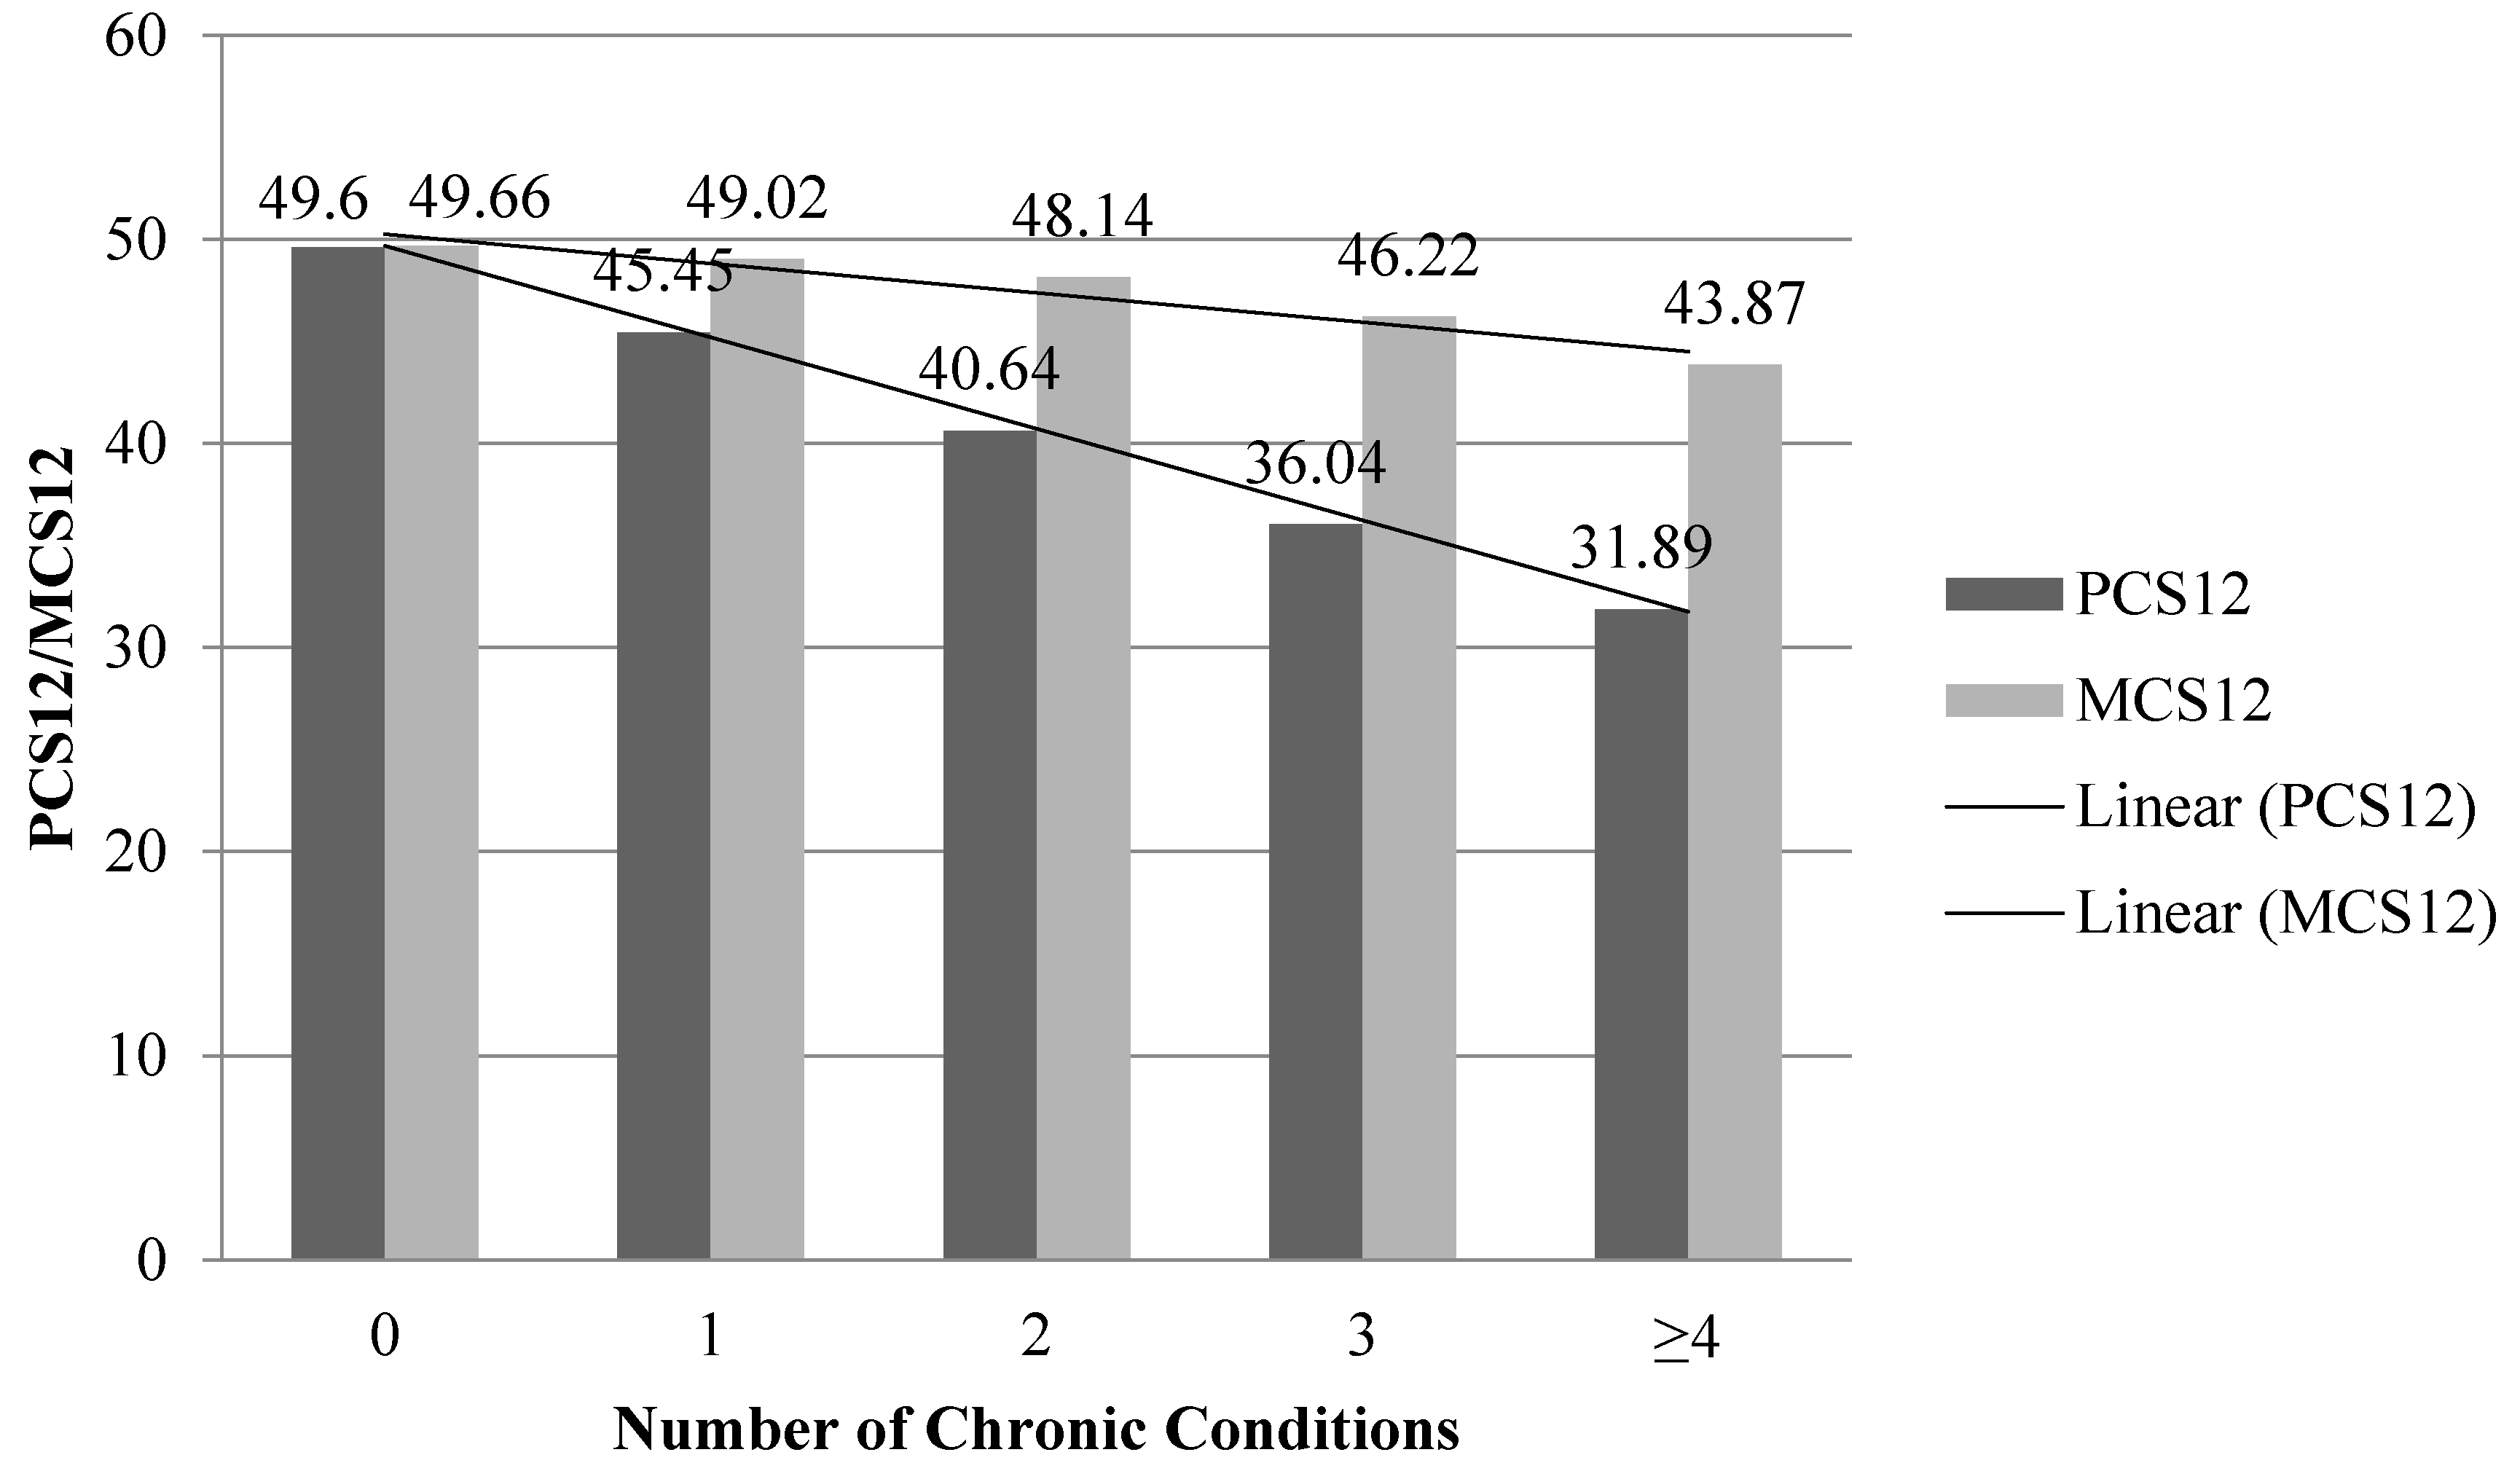
Convergent and Discriminant
3.4. Criterion Validity
3.4.1. Concurrent Validity
3.4.2. Predictive Validity
4. Discussion
5. Conclusions
Acknowledgments
Author Contributions
Conflicts of Interest
References
- Freburger, J.K.; Holmes, G.M.; Agans, R.P.; Jackman, A.M.; Darter, J.D.; Wallace, A.S.; Castel, L.D.; Kalsbeek, W.D.; Carey, T.S. The rising prevalence of chronic low back pain. Arch. Intern. Med. 2009, 169, 251–258. [Google Scholar] [CrossRef] [PubMed]
- Zondervan, K.T.; Yudkin, P.L.; Vessey, M.P.; Dawes, M.G.; Barlow, D.H.; Kennedy, S.H. Prevalence and incidence of chronic pelvic pain in primary care: Evidence from a national general practice database. Br. J. Obstet. Gynaecol. 1999, 106, 1149–1155. [Google Scholar] [CrossRef] [PubMed]
- Gran, J.T. The epidemiology of chronic generalized musculoskeletal pain. Best Pract. Res. Clin. Rheumatol. 2003, 17, 547–561. [Google Scholar] [CrossRef]
- (US) W (DC): NAP. Relieving Pain in America: A Blueprint for Transforming Prevention, Care, Education, and Research-PubMed-NCBI 2011. Available online: http://www.ncbi.nlm.nih.gov/pubmed/22553896 (accessed on 11 May 2016).
- Kowal, J.; Wilson, K.G.; McWilliams, L.A.; Péloquin, K.; Duong, D. Self-perceived burden in chronic pain: Relevance, prevalence, and predictors. Pain 2012, 153, 1735–1741. [Google Scholar] [CrossRef] [PubMed]
- Jones, S.L.; Hadjistavropoulos, H.D.; Janzen, J.A.; Hadjistavropoulos, T. The relation of pain and caregiver burden in informal older adult caregivers. Pain Med. 2011, 12, 51–58. [Google Scholar] [CrossRef] [PubMed]
- Jacobi, C.E.; van den Berg, B.; Boshuizen, H.C.; Rupp, I.; Dinant, H.J.; van den Bos, G.A.M. Dimension-specific burden of caregiving among partners of rheumatoid arthritis patients. Rheumatology 2003, 42, 1226–1233. [Google Scholar] [CrossRef] [PubMed]
- Ferreira-Valente, M.A.; Pais-Ribeiro, J.L.; Jensen, M.P. Validity of four pain intensity rating scales. Pain 2011, 152, 2399–2404. [Google Scholar] [CrossRef] [PubMed]
- Jensen, M.P.; Turner, J.A.; Romano, J.M.F.L. Comparative reliability and validity of chronic pain intensity measures. Pain 1999, 83, 157–162. [Google Scholar] [CrossRef]
- Jensen, M.P.; Miller, L.; Fisher, L.D. Assessment of pain during medical procedures: A comparison of three scales. Clin. J. Pain 1998, 14, 343–349. [Google Scholar] [CrossRef] [PubMed]
- Bryce, T.N.; Budh, C.N.; Cardenas, D.D.; Dijkers, M.; Felix, E.R.; Finnerup, N.B.; Kennedy, P.; Lundeberg, T.; Richards, J.S.; Rintala, D.H.; et al. Pain after spinal cord injury: An evidence-based review for clinical practice and research. Report of the National Institute on Disability and Rehabilitation Research Spinal Cord Injury Measures meeting. J. Spinal Cord Med. 2007, 30, 421–440. [Google Scholar] [CrossRef] [PubMed]
- Brady, K.T.; McCauley, J.L.; Back, S.E. Prescription Opioid Misuse, Abuse, and Treatment in the United States: An Update. Am. J. Psychiatry 2016, 173, 18–26. [Google Scholar] [CrossRef] [PubMed]
- Frenk, S.M.; Porter, K.S.; Paulozzi, L.J. Prescription opioid analgesic use among adults: United States, 1999–2012. NCHS Data Briefs 2015, 189, 1–8. [Google Scholar]
- Lee, S.; Chen, P.P.; Lee, A.; Ma, M.; Fong, C.M.; Gin, T. A prospective evaluation of health-related quality of life in Hong Kong Chinese patients with chronic non-cancer pain. Hong Kong Med. J. 2005, 11, 174–180. [Google Scholar] [PubMed]
- Jonsdottir, T.; Aspelund, T.; Jonsdottir, H.G.S. The relationship between chronic pain pattern, interference with life and health-related quality of life in a nationwide community sample. Pain Manag. Nurs. 2014, 15, 641–651. [Google Scholar] [CrossRef] [PubMed]
- Dysvik, E.; Lindstrøm, T.C.; Eikeland, O.J.N.G. Health-related quality of life and pain beliefs among people suffering from chronic pain. Pain Manag. Nurs. 2004, 5, 66–74. [Google Scholar] [CrossRef] [PubMed]
- Björnsdóttir, S.V.; Arnljótsdóttir, M.; Tómasson, G.; Triebel, J.; Valdimarsdóttir, U.A. Health-related quality of life improvements among women with chronic pain: Comparison of two multidisciplinary interventions. Disabil. Rehabil. 2016, 38, 828–836. [Google Scholar] [CrossRef] [PubMed]
- Karmakar, M.K.; Samy, W.; Li, J.W.; Lee, A.; Chan, W.C.; Chen, P.P.; Ho, A.M. Thoracic paravertebral block and its effects on chronic pain and health-related quality of life after modified radical mastectomy. Reg. Anesth. Pain Med. 2014, 39, 289–298. [Google Scholar] [CrossRef] [PubMed]
- Joos, B.; Uebelhart, D.; Michel, B.A.; Sprott, H. Influence of an outpatient multidisciplinary pain management program on the health-related quality of life and the physical fitness of chronic pain patients. J. Negat. Results Biomed. 2004, 3, 1. [Google Scholar] [CrossRef] [PubMed]
- Dysvik, E.; Kvaløy, J.T.; Stokkeland, R.; Natvig, G.K. The effectiveness of a multidisciplinary pain management programme managing chronic pain on pain perceptions, health-related quality of life and stages of change—A non-randomized controlled study. Int. J. Nurs. Stud. 2010, 47, 826–835. [Google Scholar] [CrossRef] [PubMed]
- Vartiainen, P.; Heiskanen, T.; Sintonen, H.; Roine, R.P.; Kalso, E. Health-related quality of life and burden of disease in chronic pain measured with the 15D instrument. Pain 2016, 157, 2269–2276. [Google Scholar] [CrossRef] [PubMed]
- Luo, X.; George, M.L.; Kakouras, I.; Edwards, C.L.; Pietrobon, R.; Richardson, W.; Hey, L. Reliability, validity, and responsiveness of the short form 12-item survey (SF-12) in patients with back pain. Spine 2003, 28, 1739–1745. [Google Scholar] [CrossRef] [PubMed]
- Fredheim, O.; Borchgrevink, P.; Saltnes, T.; Kaasa, S. Validation and comparison of the health-related quality-of-life instruments EORTC QLQ-C30 and SF-36 in assessment of patients with chronic nonmalignant pain. J. Pain Symptom Manag. 2007, 34, 657–665. [Google Scholar] [CrossRef] [PubMed]
- Younger, J.; McCue, R.; Mackey, S. Pain outcomes: A brief review of instruments and techniques. Curr. Pain Headache Rep. 2009, 13, 39–43. [Google Scholar] [CrossRef] [PubMed]
- Torrance, N.; Lawson, K.D.; Afolabi, E.; Bennett, M.I.; Serpell, M.G.; Dunn, K.M.; Smith, B.H. Estimating the burden of disease in chronic pain with and without neuropathic characteristics: Does the choice between the EQ-5D and SF-6D matter? Pain 2014, 155, 1996–2004. [Google Scholar] [CrossRef] [PubMed]
- Obradovic, M.; Lal, A.; Liedgens, H. Validity and responsiveness of EuroQol-5 dimension (EQ-5D) versus Short Form-6 dimension (SF-6D) questionnaire in chronic pain. Health Qual. Life Outcomes 2013, 11, 110. [Google Scholar] [CrossRef] [PubMed]
- Gandek, B.; Ware, J.E.; Aaronson, N.K.; Apolone, G.; Bjorner, J.B.; Brazier, J.E.; Bullinger, M.; Kaasa, S.; Leplege, A.; Prieto, L.; et al. Cross-validation of item selection and scoring for the SF-12 Health Survey in nine countries: Results from the IQOLA Project. International Quality of Life Assessment. J. Clin. Epidemiol. 1998, 51, 1171–1178. [Google Scholar] [CrossRef]
- Jenkinson, C.; Layte, R.; Jenkinson, D.; Lawrence, K.; Petersen, S.; Paice, C.; Stradling, J. A shorter form health survey: Can the SF-12 replicate results from the SF-36 in longitudinal studies? J. Public Health Med. 1997, 19, 179–186. [Google Scholar] [CrossRef] [PubMed]
- Lim, L.L.; Fisher, J.D. Use of the 12-item short-form (SF-12) Health Survey in an Australian heart and stroke population. Qual. Life Res. 1999, 8, 1–8. [Google Scholar] [CrossRef] [PubMed]
- Lundberg, L.; Johannesson, M.; Isacson, D.G.; Borgquist, L. The relationship between health-state utilities and the SF-12 in a general population. Med. Decis. Making 1999, 19, 128–140. [Google Scholar] [CrossRef] [PubMed]
- Sugar, C.A.; Sturm, R.; Lee, T.T.; Sherbourne, C.D.; Olshen, R.A.; Wells, K.B.; Lenert, L.A. Empirically defined health states for depression from the SF-12. Health Serv. Res. 1998, 33, 911–928. [Google Scholar] [PubMed]
- Ware, J.; Kosinski, M.; Keller, S.D. A 12-Item Short-Form Health Survey: Construction of scales and preliminary tests of reliability and validity. Med. Care 1996, 34, 220–233. [Google Scholar] [CrossRef] [PubMed]
- Lacson, E.; Xu, J.; Lin, S.-F.; Dean, S.G.; Lazarus, J.M.; Hakim, R.M. A comparison of SF-36 and SF-12 composite scores and subsequent hospitalization and mortality risks in long-term dialysis patients. Clin. J. Am. Soc. Nephrol. 2010, 5, 252–260. [Google Scholar] [CrossRef] [PubMed]
- Failde, I.; Medina, P.; Ramírez, C.; Arana, R. Assessing health-related quality of life among coronary patients: SF-36 vs. SF-12. Public Health 2009, 123, 615–617. [Google Scholar] [CrossRef] [PubMed]
- Agency for Healthcare Research and Quality. Medical Expenditure Panel Survey Home. Available online: http://meps.ahrq.gov/mepsweb/ (accessed on 3 May 2016).
- Ware, J. How to Score Version 2 of the SF-12 Health Survey (with a Supplement Documenting Version 1); Lincoln, R.I., Ed.; QualityMetric Inc.; Health Assessment Lab.: Boston, MA, USA, 2005. [Google Scholar]
- Cheak-Zamora, N.C.; Wyrwich, K.W.; McBride, T.D. Reliability and validity of the SF-12v2 in the medical expenditure panel survey. Qual. Life Res. 2009, 18, 727–735. [Google Scholar] [CrossRef] [PubMed]
- Agency for Healthcare Research and Quality. Medical Expenditure Panel Survey Questionnaire Sections. Available online: https://meps.ahrq.gov/survey_comp/survey_results_ques_sections.jsp?Section=CE&Year1=AllYear&Submit1=Search (accessed on 25 July 2016).
- Natarajan, S.; Nietert, P.J. Hypertension, diabetes, hypercholesterolemia, and their combinations increased health care utilization and decreased health status. J. Clin. Epidemiol. 2004, 57, 954–961. [Google Scholar] [CrossRef] [PubMed]
- Stockbridge, E.L.; Suzuki, S.; Pagán, J.A. Chronic pain and health care spending: An analysis of longitudinal data from the Medical Expenditure Panel Survey. Health Serv. Res. 2015, 50, 847–870. [Google Scholar] [CrossRef] [PubMed]
- Mosier, C.I. On the reliability of a weighted composite. Psychometrika 1943, 8, 161–168. [Google Scholar] [CrossRef]
- Chung, L.; Valenzuela, A.; Fiorentino, D.; Stevens, K.; Li, S.; Harris, J.; Hutchinson, C.; Assassi, S.; Beretta, L.; Lakshminarayanan, S.; et al. Validation of a novel radiographic scoring system for calcinosis affecting the hands of patients with systemic sclerosis. Arthritis Care Res. 2015, 67, 425–430. [Google Scholar] [CrossRef] [PubMed]
- Hoefman, R.J.; van Exel, N.J.A.; Looren de Jong, S.; Redekop, W.K.; Brouwer, W.B. A new test of the construct validity of the CarerQol instrument: Measuring the impact of informal care giving. Qual. Life Res. 2011, 20, 875–887. [Google Scholar] [CrossRef] [PubMed]
- Nelson, L.S.; Perrone, J. Curbing the opioid epidemic in the United States: The risk evaluation and mitigation strategy (REMS). JAMA 2012, 308, 457–458. [Google Scholar] [CrossRef] [PubMed]
- Smith, M.; Davis, M.A.; Stano, M.; Whedon, J.M. Aging baby boomers and the rising cost of chronic back pain: Secular trend analysis of longitudinal Medical Expenditures Panel Survey data for years 2000 to 2007. J. Manip. Physiol. Ther. 2013, 36, 2–11. [Google Scholar] [CrossRef] [PubMed]
- Blome, C.; Augustin, M. Measuring change in quality of life: Bias in prospective and retrospective evaluation. Value Health 2015, 18, 110–115. [Google Scholar] [CrossRef] [PubMed]


| N = 15,716 | Unweighted: N (%) | Weighted: % (SE) a |
|---|---|---|
| Age | ||
| 18–34 | 3589 (22.8%) | 21.7 (0.52) |
| 35–49 | 4412 (28.1%) | 27.1 (0.53) |
| 50–65 | 5174 (32.9%) | 34.0 (0.63) |
| 66–85 | 2541 (16.2%) | 17.1 (0.54) |
| Gender | ||
| Male | 6875 (43.8%) | 46.6 (0.41) |
| Female | 8841 (56.3%) | 53.4 (0.41) |
| Race | ||
| White | 10,720 (68.2%) | 80.7 (0.85) |
| Black | 3511 (22.3%) | 12.3 (0.69) |
| Other | 1485 (9.5%) | 7.0 (0.49) |
| Education Level | ||
| High School or Less | 8197 (52.2%) | 43.7 (0.72) |
| More than High School | 7384 (47.0%) | 55.8 (0.73) |
| Missing | 135 (0.9%) | 0.52 (0.07) |
| Marital Status | ||
| Married | 7748 (49.3%) | 52.6 (0.77) |
| Not Married | 4044 (25.7%) | 24.8 (0.52) |
| Never Married | 3924 (25.0%) | 22.6 (0.55) |
| Health Insurance | ||
| Public | 4084 (26.0%) | 20.5 (0.64) |
| Private | 8686 (55.3%) | 65.4 (0.81) |
| Uninsured | 2946 (18.8%) | 14.2 (0.45) |
| Prescription Insurance | ||
| Insured | 6941 (44.2%) | 52.8 (0.84) |
| Uninsured | 8775 (55.8%) | 47.2 (0.84) |
| Income Level | ||
| Poor/Near Poor | 4243 (27.0%) | 20.2 (0.58) |
| Low Income | 2705 (17.2%) | 14.4 (0.45) |
| Middle Income | 4556 (29.0%) | 30.2 (0.58) |
| High Income | 4212 (26.8%) | 35.2 (0.81) |
| Region | ||
| Northeast | 2549 (16.2%) | 17.7 (0.71) |
| Midwest | 3213 (20.4%) | 22.8 (0.72) |
| South | 5967 (38.0%) | 36.9 (0.88) |
| West | 3987 (25.4%) | 22.6 (0.69) |
| Number of Chronic Conditions | ||
| 0 | 7244 (46.1%) | 46.8 (0.57) |
| 1 | 4777 (30.4%) | 30.2 (0.46) |
| 2–3 | 3379 (21.5%) | 21.2 (0.42) |
| ≥4 | 316 (2.0%) | 1.8 (0.14) |
| Pain Limitation Severity | ||
| Mild | 2944 (18.7%) | 19.8 (0.41) |
| Moderate | 2023 (12.9%) | 12.8(0.33) |
| Severe | 2590 (16.5%) | 14.5 (0.38) |
| Mean (SD) d | Weighted Mean (SEM) e | |
| MCS b in Round 2 | 48.9 (10.9) | 49.6 (0.12) |
| PCS c in Round 2 | 45.8 (11.3) | 46.6 (0.14) |
| Reliability | PCS12 | MCS12 |
|---|---|---|
| Standardized Cronbach’s Alpha a | 0.85 | 0.84 |
| Mosier’s Alpha | 0.91 | 0.93 |
| ICC b | 0.72 (0.71–0.73) c | 0.62 (0.61–0.63) c |
| Domain | PCS12 in Round 2 | MCS12 in Round 2 | Perceived Health | Perceived Mental Health |
|---|---|---|---|---|
| PCS12 in Round 2 | 1.000 | 0.029 | 0.517 | 0.241 |
| MCS12 in Round 2 | 0.029 | 1.000 | 0.344 | 0.434 |
| Perceived Health | 0.517 | 0.344 | 1.000 | 0.546 |
| Perceived Mental Health | 0.241 | 0.434 | 0.546 | 1.000 |
© 2017 by the authors. Licensee MDPI, Basel, Switzerland. This article is an open access article distributed under the terms and conditions of the Creative Commons Attribution (CC BY) license (http://creativecommons.org/licenses/by/4.0/).
Share and Cite
Hayes, C.J.; Bhandari, N.R.; Kathe, N.; Payakachat, N. Reliability and Validity of the Medical Outcomes Study Short Form-12 Version 2 (SF-12v2) in Adults with Non-Cancer Pain. Healthcare 2017, 5, 22. https://doi.org/10.3390/healthcare5020022
Hayes CJ, Bhandari NR, Kathe N, Payakachat N. Reliability and Validity of the Medical Outcomes Study Short Form-12 Version 2 (SF-12v2) in Adults with Non-Cancer Pain. Healthcare. 2017; 5(2):22. https://doi.org/10.3390/healthcare5020022
Chicago/Turabian StyleHayes, Corey J., Naleen Raj Bhandari, Niranjan Kathe, and Nalin Payakachat. 2017. "Reliability and Validity of the Medical Outcomes Study Short Form-12 Version 2 (SF-12v2) in Adults with Non-Cancer Pain" Healthcare 5, no. 2: 22. https://doi.org/10.3390/healthcare5020022