
Electrochemiluminescence Detection and Imaging of Biomolecules at the Single-Cell Level

1
School of Pharmacy, Nanjing Medical University, Nanjing 211126, China
2
State Key Laboratory of Analytical Chemistry for Life Science, School of Chemistry and Chemical Engineering, Nanjing University, Nanjing 210023, China
*
Author to whom correspondence should be addressed.
Chemosensors 2023, 11(10), 538; https://doi.org/10.3390/chemosensors11100538
Submission received: 24 July 2023
/
Revised: 16 September 2023
/
Accepted: 26 September 2023
/
Published: 12 October 2023
(This article belongs to the Special Issue Bionic Recognition and Biosensors: A Theme Issue in Honor of Professor Hong-Yuan Chen)
Abstract
:Electrochemiluminescence (ECL) is an electrochemically induced light produced by the excitation of luminophores in redox reactions. For the past twenty years, ECL analysis has been continuously developed and applied for the sensitive detection of biomolecules at the single-cell level due to its low background interference and the resultant high sensitivity. In recent times, ECL-based microscopy has combined the elements of imaging and has thus emerged as a fast-developed imaging tool to visualize biomolecules in single cells. The surface-confined features of ECL imaging provide detailed information about cell membranes that is not easily obtained using classical fluorescence microscopy. In this review, we summarize the recent works on the detection and imaging of biomolecules at the single-cell level using ECL and discuss the development prospects and challenges in the biological application of this technology in the field of cell analysis.
1. Introduction
Electrochemiluminescence (ECL) is a kind of light emission triggered by electrochemical stimulation. Under the action of voltage, the luminophore near the electrode surface undergoes an electrochemical oxidation reaction and forms the corresponding reaction intermediates. After a subsequent chemical reaction, the intermediates are transformed into the luminescent excited state, which emits luminescence while returning to the ground state [1,2,3,4]. This ECL phenomenon was first observed in Grignard compounds in a high-electric-field experiment conducted by Dufford in 1927 [5]. The next year, Harvey et al. reported the chemiluminescence of luminol under electrolytic conditions [6]. Although much evidence on the ECL phenomenon was revealed in the following years, the first detailed report on ECL was presented by Hercules and Bard in the mid-1960s, which greatly advanced the development of ECL-related studies [7,8]. In the following 50 years, extensive research established ECL-based technology as an effective analytical method, whose applications range from immunoassays, environmental detection, and bioanalysis to commercial clinical diagnosis [9,10,11,12,13,14,15,16,17].
As a delicate combination of optical and electrochemical methods, ECL inputs the electrical signals into an optical reader, avoiding the interference of charging and discharging currents that occurred in the traditional electrochemical measurement. More importantly, ECL completes the measurement without the need for excitation light, and hence, the influence of background light during the measurement is removed. Therefore, compared with fluorescence and other optical methods, ECL has the advantage of a near-zero background that significantly improves the detection sensitivity [1,18,19,20,21,22,23]. In addition, the intermediates involved in the ECL high-energy electron transfer reaction are controlled by electrical signals and confined near to the electrode surface. The surface-confined feature allows for the precise modulation of the ECL duration and location with high spatiotemporal resolution. The integration of high-resolution imaging components enables ECL imaging technology to visualize the spatial distribution and quantitative information of molecules. Thus, ECL-based analysis exhibits significant characteristics, such as high sensitivity, strong versatility, and low detection cost, and becomes a dominant method in clinical tests.
In addition to ECL measurements of molecules in biofluids (e.g., serum and urine) and environmental samples, the application of ECL analysis has been recently expanded to cellular analysis, even at the single-cell level. The cell is the most basic unit of life and is the place where many biochemical reactions and physiological activities take place. Evidence has revealed that under the same physiological conditions, the same type of cells exhibit significant heterogeneity. For example, when cells are exposed to external stimuli or are in a state of disease, distinct differences in the expression of biomolecules within cells are observed, contributing to different cell fates [24,25,26,27]. Traditional analytical methods could only provide limited data about the cellular population, which masks these cellular heterogeneities, and thus, much important biological information is lost. Considering the low abundance of biomolecules in one cell, development of an accurate and highly sensitive detection tool to measure biomolecules at the single-cell level is urgently needed. The realization of single-cell analysis is not only a necessary means to prove cell heterogeneity, but it is also an effective way to extensively study the relationship among various molecules and their related signaling pathways in individual cells [28,29,30,31,32,33].
In view of the shortcomings of the current methods for single-cell analysis, the application of ECL-based analysis with low background, high sensitivity, and strong versatility is particularly promising (Table 1). Over the past 20 years, researchers have successfully established various ECL assays to measure and image many important biomolecules inside single living cells and at the sub-cellular structures. Although many reviews have summarized the studies on single-cell ECL imaging [34,35,36,37,38,39,40,41,42], most of them only list the advantages of ECL imaging application as a whole, and seldom illustrate the entire procedure, ranging from the measurements to the imaging processes. Also, the most recent breakthrough in single-molecule ECL imaging in single living cells is not included in these reviews, which is now considered as the most important direction in this field. In this review, we comprehensively introduce the development of single-cell ECL measurement and imaging, and emphasize the recent important progress in this field. Finally, the existing challenges and future prospects of ECL imaging in single-cell analysis ae discussed.

Table 1.
The advantages and disadvantages of single-cell ECL and fluorescence analysis.
| Method | Advantages | Disadvantages |
|---|---|---|
| ECL | High sensitivity Low background emission Restricted information on the cell-based membrane | Restricted on the electrode surface Weak luminescence intensity Low spatial–temporal resolution |
| Fluorescence | Strong fluorescence emission High spatial–temporal resolution Excellent biocompatibility | High background noise Fluorescence quenching |
2. ECL Measurement of Biomolecules at the Single-Cell Level
The first single-cell ECL measurement was reported by our group in 2013, which was used to measure active cholesterol in the plasma membrane [43]. The ECL detection strategy relies on the classic luminol-hydrogen peroxide ECL system, including the reaction between active cholesterol in the cellular membrane and cholesterol oxidase in the solution to generate hydrogen peroxide, and the following electrochemical reaction between luminol in the solution and hydrogen peroxide to emit ECL (Figure 1a). To realize single-cell analysis via ECL measurement, one pinhole (i.d. 100 μm) was added between an indium tin oxide (ITO) slide and a photomultiplier tube (PMT). The cells were then cultured on the ITO slide with a low density, and so only one cell was exposed to PMT. The increase in ECL intensity at a single-cell level was observed for the first time upon the addition of cholesterol oxidase, demonstrating the feasibility of detecting active membrane cholesterol in single living cells using ECL. Following the activation of inactive cholesterol at the plasma membrane, the ratio of the active and inactive membrane cholesterol at the single cell was obtained using the ECL measurement.
Considering that the reaction of cholesterol oxidase with membrane cholesterol does not cause the destruction of the cell membrane structure, this strategy can be further applied to analyze other biomolecules in the plasma membrane. For example, co-quantifying membrane cholesterol and lipids at the single cell level is important for understanding lipid interactions. However, due to the difficulty in synthesizing highly fluorescent probes that specifically bind to the desired lipid, this study cannot be easily addressed using fluorescence imaging. In 2019, our group introduced an enzyme cocktail consisting of sphingomyelinase, alkaline phosphatase, and choline oxidase after the ECL measurement of membrane cholesterol. This enzyme cocktail can react with membrane sphingomyelin (SM) to produce hydrogen peroxide for ECL detection (Figure 1b) [44]. The strategy allows for the simultaneous determination of membrane cholesterol and SM in a single cell. This strategy was used to gather fluctuation information about SM and cholesterol during SM-depletion-induced cholesterol efflux. The data obtained from this strategy could help resolve the debate surrounding the ABC transporter’s role in cholesterol efflux.
Since the concentration of most biomolecules in a single cell is low, amplifying the ECL signal to increase detection sensitivity is critical for the further application of this method in single-cell analysis. To achieve this, Yang et al. assembled solid zinc co-adsorbed carbon quantum dot (ZnCQDs) nanocomposites using gold nanoparticles and carboxyl functionalized magnetic beads as carriers. The introduction of gold nanoparticles provides a general strategy to enhance the electron-transfer process during the ECL reaction, resulting in a 120-fold increase in ECL compared to that of CQDs [45]. Then, the hyaluronic acid (HA) was functionalized on solid-state probes to enable the specific capture of single cells through the recognition of HA with CD44 on the cell surface. Additionally, the usage of Cu2+ ions as a bridge to connect gold nanoparticles and lead-adsorbed carbon quantum dots (PbCQDs) was reported to increase the ECL strength by 37.5 ± 3.9% [46]. Continuously incorporating new voltage modes and synthesizing highly luminescent ECL probes should be an effective strategy to increase the intensity and stability of ECL. This strategy is being pursued by many research groups [47,48,49,50,51,52,53,54,55,56,57,58,59]. These advancements will further advance single-cell ECL measurement in biological studies and potentially even in clinical tests in the near future.
3. ECL Imaging of Biomolecules at the Single-Cell Level
Intensity-based ECL measurement can provide information about single cells with a low detection limit. However, this measurement method does not provide spatial information within a single cell. Therefore, in order to achieve spatial studies of single cells for biological applications, the development of ECL imaging methods specifically designed for single cells is necessary [60,61]. At the end of the last century, researchers began developing ECL imaging techniques, which have been continuously improved over time [62,63,64,65,66,67]. In 2011, Su et al. made improvements to the ECL imaging setup and designed both negative and positive operation methods to selectively control ECL generation on the electrode surface space [68]. The power of ECL imaging in spatially studying fine features on electrodes was demonstrated by providing high-quality ECL imaging of fingerprints, which was previously unprecedented. In the following years, many research groups have continued to improve the setup of ECL microscopy and the voltage mode to enhance the generation and collection efficiency of ECL emission. Currently, widely used ECL microscopy typically consists of an electrochemical cell, a voltage generator, and a microscope equipped with an electron-multiplying CCD (EMCCD). During the ECL imaging process, the external light source is turned off, and a corresponding voltage is applied at the working electrode to initiate the ECL reaction. The ECL imaging of small molecules, membrane proteins, and intracellular molecules at single cells is summarized and listed in Table 2.
3.1. Imaging of Small Molecules at the Single-Cell Level
Small molecules play important roles in regulating cellular activities and imaging them can provide valuable information about cellular processes [69]. However, imaging small molecules inside cells is challenging due to the lack of specific probes for binding these molecules. A potential strategy to visualize small molecules at the single-cell level is the utilization of a luminol-based ECL assay. This assay relies on the reaction of oxidase with the corresponding small molecule to generate hydrogen peroxide, which then reacts with luminol to emit ECL. In 2015, our team reported the first ECL image of hydrogen peroxide and cholesterol at single living cells. To overcome the information of an inert layer on the electrode during the continuous application of a high positive potential, a voltage switching strategy between 1.0 and −1.0 V was employed. This strategy switching generated more ECL emission and improved the imaging process. In the presence of hydrogen peroxide released or generated from the cellular membrane, it electrochemically reacts with a small amount of L012 (a luminol analog with higher luminescence) beneath the cell to generate ECL. After subtracting the background intensity that was observed at the cell, a higher ECL intensity was observed at the cell, with a spatial resolution of 0.8 μm, which revealed the distribution of hydrogen peroxide efflux and active membrane cholesterol (Figure 2a) [70]. The results demonstrate that ECL can be a new tool for single-cell electrochemical imaging, offering advantages such as high spatiotemporal resolution (compared to scanning electrochemical microscopy), low background, and flexibility in electrode type (compared to surface-plasmon-resonance-based electrochemical imaging techniques).
Despite the advances in ECL imaging, this new strategy still faces several challenges. These challenges include improving the spatial resolution, directly visualizing small molecules, reducing the applied voltage, and achieving stable ECL intensity. Regarding spatial resolution, the initial approach using aqueous luminol to react with hydrogen peroxide leads to the diffusion of these species in the solution, resulting in poor spatial resolution. To improve the spatial resolution, Su’s group prepared an ECL nanocage array (ENA) consisting of vertically aligned silica nanoporous films (SNMs). This nanocage array only allowed small-sized coreactants or substances to enter, thereby generating or affecting ECL signals while minimizing lateral diffusion of ECL under the cell. As a result, vertically aligned microtube electrode ensembles were used to achieve highly spatial single-cell ECL imaging, revealing the subcellular heterogeneity of hydrogen peroxide efflux from individual cells [71,72].
Another challenge in the initial ECL imaging strategy is that the ECL emission originates from the reaction between L012 and hydrogen peroxide beneath the cell. The close adherence of the cell to the surface support results in a small amount of L012 under the cell, which generates less ECL intensity compared to the surrounding region with a bare electrode surface. As a result, the cell appears black throughout the imaging process, which does not allow for the direct imaging of small molecules within the cell. To solve this problem, Zhu’s group added a porous chitosan layer on the electrode to culture and image the cell [73]. Sufficient ECL reagent is retained under the cell, providing strong ECL emission in the image (Figure 2b). The direct visualization of hydrogen peroxide or some other small molecules facilitates the investigation of their distributions in single living cells.
During cellular analysis, it is important to minimize the stimulation of the cell by applying the lowest possible voltage. However, the voltage required to initiate the ECL process between L012 and hydrogen peroxide is set at 1.0 V, which is too high. To minimize this interruption, single lithium iron phosphate (LiFePO4, LFP) nanoparticles were modified on the electrode. Under a certain voltage, lithium ions from single LFP particles could be de-intercalated and then inserted into ITO to form LiSnO2. This process promotes the electrochemical oxidation of L012, allowing for visualization of the efflux of hydrogen peroxide from single living cells at a voltage as low as 0.5 V [74]. Decreasing the applied voltage in single-cell ECL imaging maximizes cellular activity and provides information that closely resembles the real cellular situation.
Meanwhile, small molecules move quickly within cells to regulate cellular activity. To achieve dynamic observation of small molecules in living cells, it is important to obtain stable ECL emission over a certain time period. To achieve this, Zhu and our groups chose single semiconductor titanium dioxide (TiO2) nanoparticles (Figure 2c). These nanoparticles have oxygen vacancies on their surface, which have a high affinity for hydrogen peroxides and resist passivation under voltage [75]. Therefore, the continuous electrochemical generation of superoxide and hydroxyl radicals by electrons and surface-trapped holes at the nanoparticles was achieved, resulting in constant ECL under physiological conditions for 90 min. This steady-state luminescence allows for electrochemical visualization of the efflux burst of hydrogen peroxide from single cells, which is not easily achieved with other electrochemical microscopies. The dynamic changes of small molecules are closely related to cellular life activities. Hiramoto’s group used the strategy of sequential potential to achieve ECL imaging of cell respiration [76]. The oxygen consumption of cells was dynamically visualized by inhibiting ECL through oxygen consumption in cell respiration, confirming the respiratory activities of cells. The result can distinguish the differences in respiratory activities of different globular cells and enable the visualization of dynamic changes in cell respiratory activities.
Figure 2.
Single-cell small-molecule ECL imaging. (a) ECL image of the distribution of hydrogen peroxide efflux and active membrane cholesterol in a single living cell [70]. Copyright 2015 Anal Chem. (b) Direct ECL imaging of single cells on a chitosan-modified electrode [73]. Copyright 2018 Anal Chem. (c) ECL imaging of local hydrogen peroxide efflux from single cells using TiO2 nanoparticles (* represents the excited state product) [75]. Copyright 2019 Anal Chem. (d) C3N4-nanosheet-modified microwell array for single-cell cholesterol ECL imaging analysis [77]. Copyright 2017 Anal Chem.

In addition to spatial imaging of small molecules in single living cells, high-throughput single-cell analysis is also an important direction in this field, as it provides statistical information to uncover cellular processes. Microwell array electrodes, which offer integration, miniaturization, and high analysis throughput, have been developed and applied in this study. On the ITO electrode, 30 μm sized microwells were fabricated to isolate single cells in individual microwells. By employing an oxidase-based assay strategy to convert the corresponding small molecule into hydrogen peroxide, the unique structure of the microwell slows down the diffusion of hydrogen peroxide away from the microwell. Consequently, the L012-hydrogen peroxide ECL reaction was performed to obtain quantitative information about small molecules in single cells. By including multiple microwell-cells in the microscopic field, small molecules from these 64 cells were analyzed using a single ECL image, significantly enhancing the analysis throughput [77] (Figure 2d). To increase the loading and measurement efficiency of single cells into the microwells, Ju et al. combined the advantages of microfluidic technology with ECL imaging to develop a quantitative detection ECL imaging microarray chip. In this method, a single or several cells were captured, and the released secretions were confined to the individual microwell to identify the corresponding ECL probe. As a result, the amount of dopamine release in different microwells was evaluated, providing a general strategy for the quantitative detection of single cell secretions [78].
3.2. ECL Imaging of Membrane Proteins
Membrane proteins are important components of the cellular plasma membrane and play a fundamental role in the functioning of biological cells. They are also targets for antibodies in immunoassays and immunohistochemistry [79]. Currently, the imaging of membrane proteins often involves labeling them with fluorescent tags attached on antibodies that specifically recognize the proteins [80,81,82]. However, this approach can be limited by autofluorescence and high-power laser irradiation, which generate high optical background signals that can affect imaging accuracy. To address this issue, the use of ECL technology, which offers a zero-background feature, has been explored as an alternative method for visualizing membrane proteins at the single-cell level with high sensitivity [83,84,85,86]. In this approach, the antibody is linked to an ECL tag, such as Ru(bpy)32+, to enable ECL imaging. The ECL mechanism of the Ru(bpy)32+/TPrA system is illustrated as follows:
TPrA − e− → TPrA·+
TPrA·+ ⇌ TPrA· + H+
TPrA· + [Ru(bpy)3]2+ → P1 + [Ru(bpy)3]+
TPrA·+ + [Ru(bpy)3]+ → TPrA + [Ru(bpy)3]2+*
[Ru(bpy)3]2+* → [Ru(bpy)3]2+ + hν
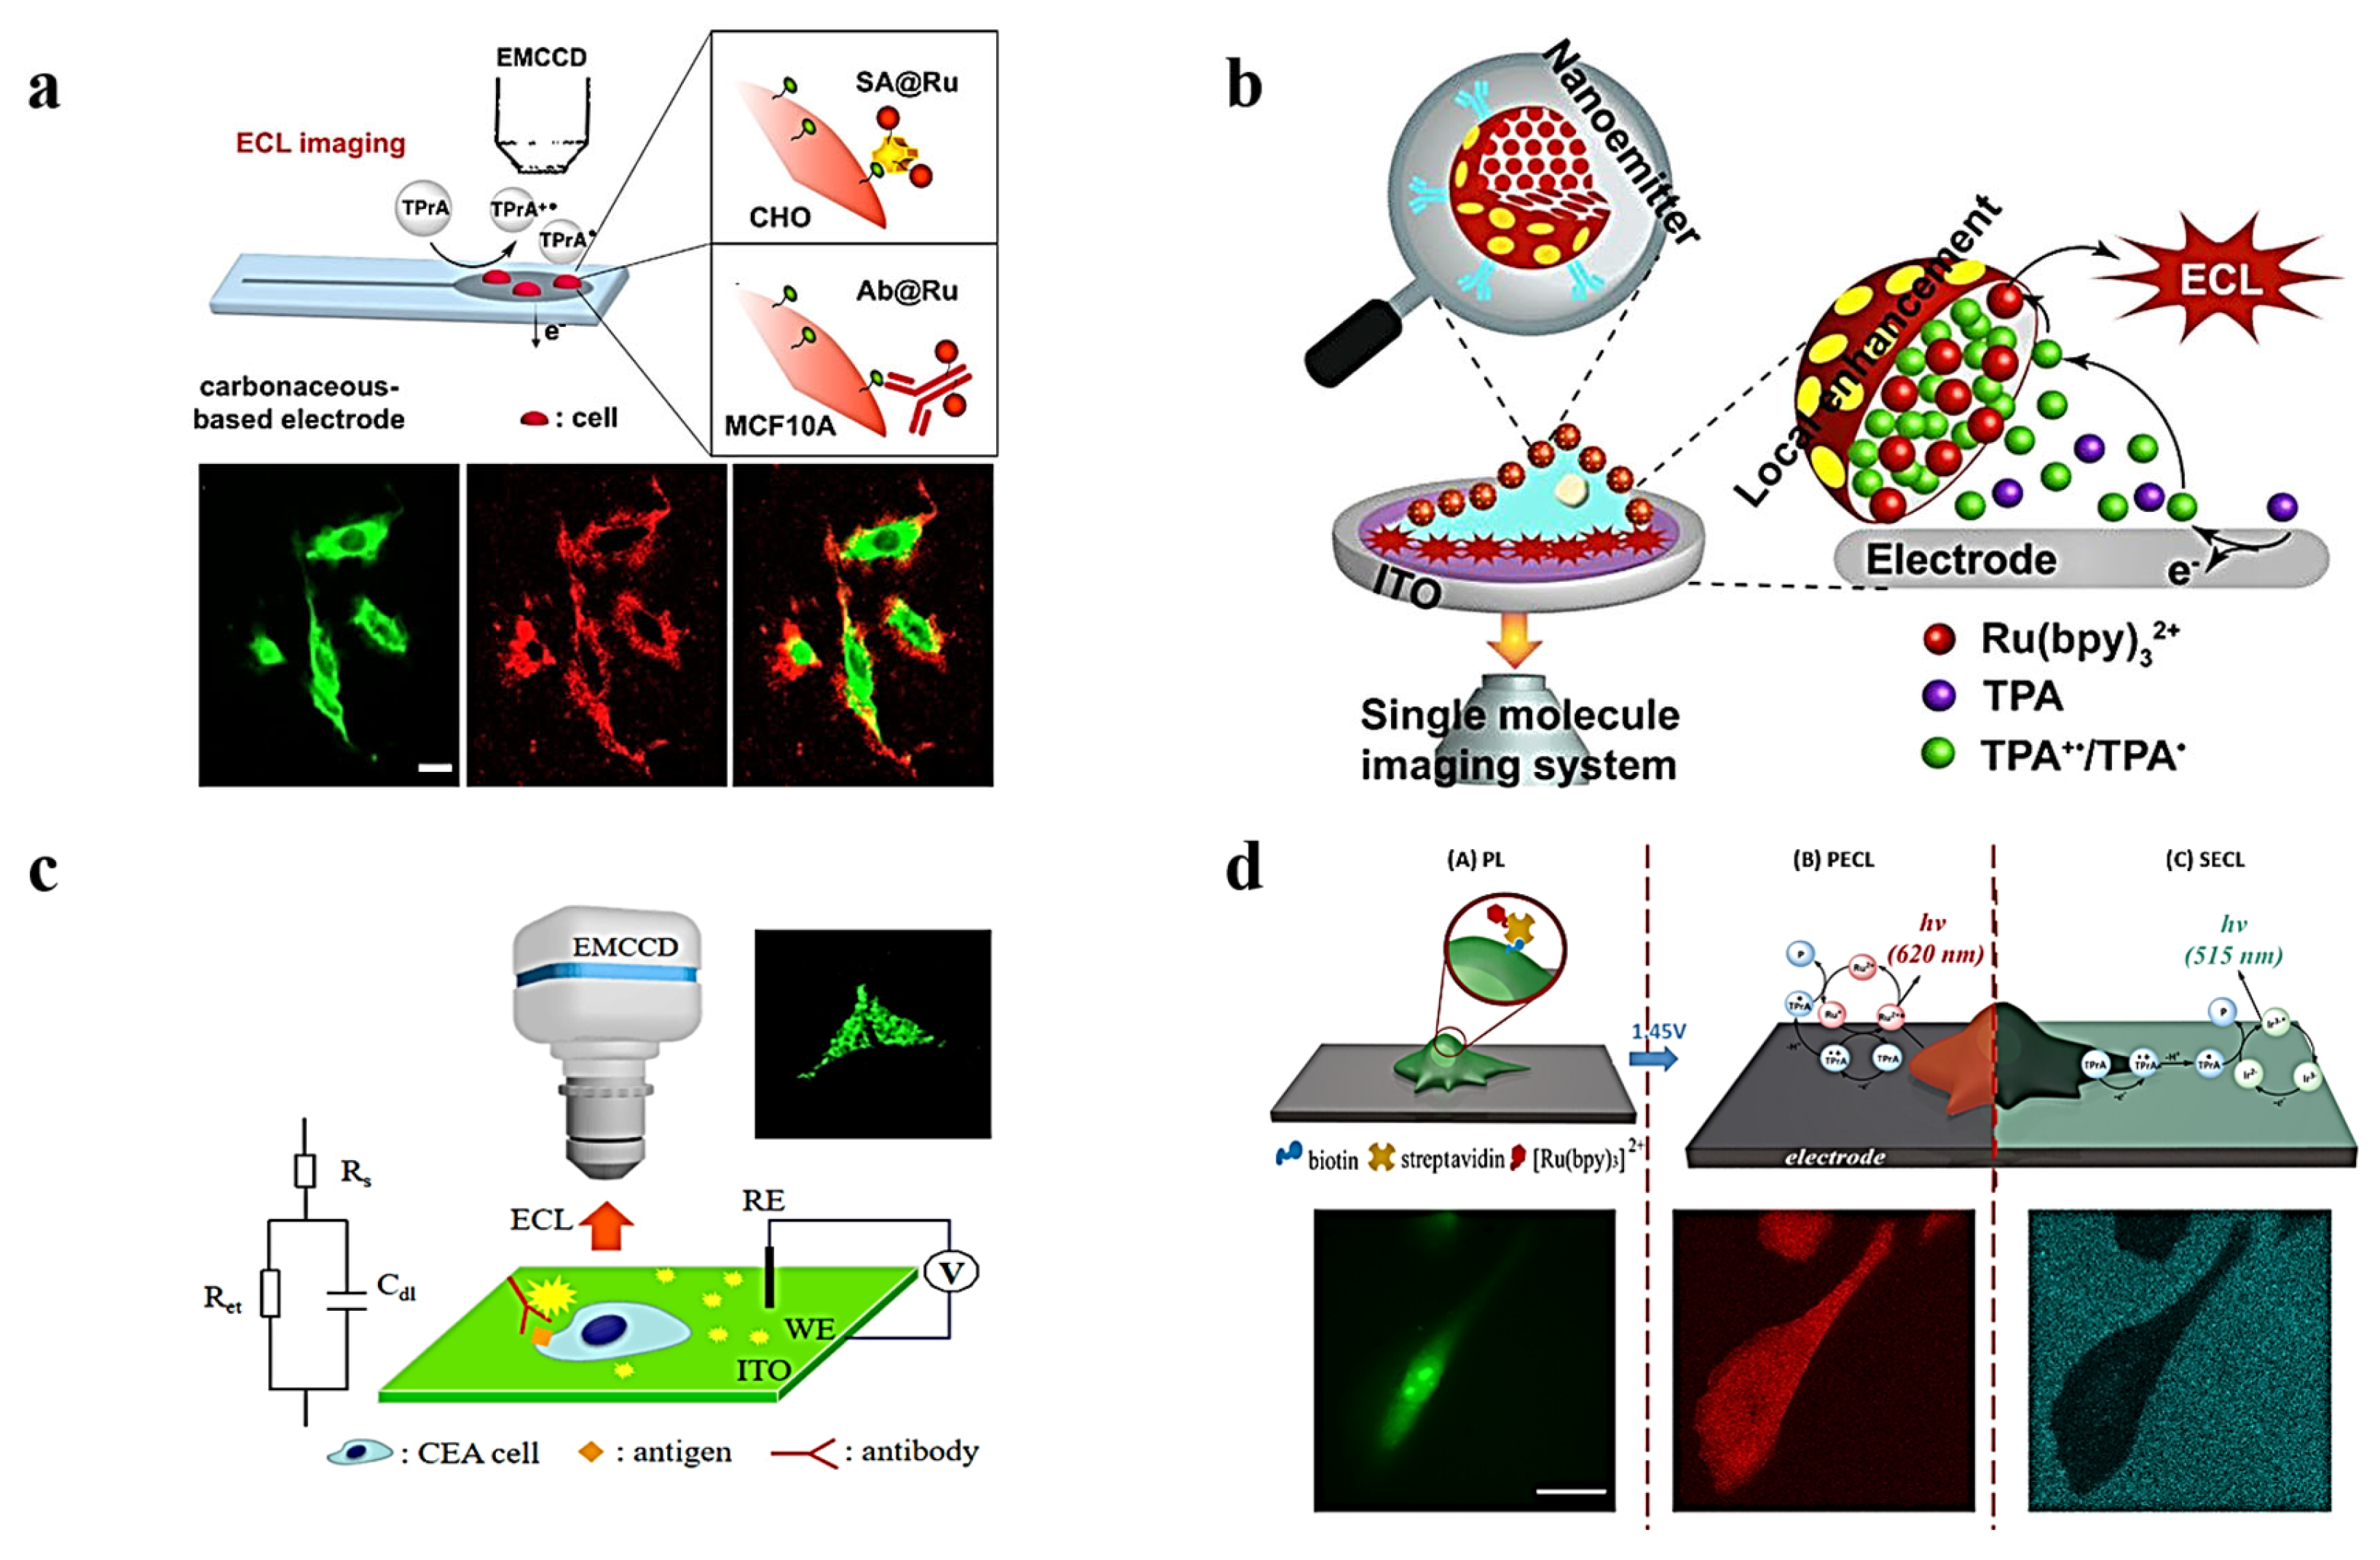
In 2017, Sojic’s group reported the development of an ECL-based surface-restricted microscope for spatially resolved single-cell ECL imaging [87]. They utilized disposable inkjet-printed carbon nanotube electrodes to culture individual cells and labeled membrane proteins with Ru(bpy)32+ through a biotin-streptavidin linkage. To facilitate sufficient redox reactions for the visual ECL signal, TPrA was introduced into the medium as an oxidative-reductive coreactant. The imaging process is believed to involve a heterogeneous ECL mechanism, where only TPrA undergoes direct oxidation on the electrode surface, followed by deprotonation to form the TPrA radical. This radical species plays a vital role in the generation of excited state Ru(bpy)32+*, ultimately leading to the in situ generation of protons on the membrane protein (Figure 3a). Later, Sojic’s group conducted further research on the vertical resolution of single-cell ECL imaging in both reflection and transmission configurations, which expanded the applications of ECL as a surface-confined microscope [88]. The results demonstrated that the ECL process involves short-lived electrogenerated radicals, leading to the emission confined to the immediate proximity (~500 nm) of the electrode surface. As a result, only the basal membrane of the cell exhibits luminescent characteristics in the ECL image. Such fine details observed in the ECL image cannot be resolved using conventional fluorescence microscopy techniques.
Surface-limited ECL microscopy offers the advantage of providing detailed information about cell membranes and the spatial extension of cells, surpassing the capabilities of conventional wide-field fluorescence microscopy. However, the ECL emission from the luminophore is typically weak, and the continuous imaging process can result in a significant loss of ECL intensity. These limitations make it challenging to visualize single biomolecules, particularly in live cells. To address this issue, the development of novel ECL emitters with high ECL intensity is critical. In 2021, Liu, Sojic, and our groups utilized Ru(bpy)32+-doped silica/gold nanoparticles (RuDSNs/AuNPs) as both the protein tag and ECL nanoemitter [89]. The local surface confinement effect leads to a notable enhancement in ECL at the nanoemitter, facilitating the visualization of individual proteins on the electrode surface and cell membrane (Figure 3b). To gain a deeper understanding of nanoconfinement and mass transport in single-molecule ECL imaging, Liu’s group developed a nanoreactor using Ru(bpy)32+-doped nanoporous zeolite nanoparticles. This allowed for direct visualization of in situ-nanoconfinement-enhanced electrochemical reactions at the single molecule level. This research helped establish the relationship between the design of porous electrochemical materials and their nanoconfinement performance in single cell ECL imaging [90]. Additionally, by leveraging the nanoconfinement effect and high reaction activity within metal–organic frameworks (MOFs), Ru(bpy)32+-embedded MOF complex (RuMOFs) were designed. These complexes exhibited a bright and consistent ECL emission for up to 1 h, enabling the in operando visualization of protein movements at the cellular membrane [91]. Compared to fluorescence observation, the near-zero ECL background surrounding the target protein with the ECL emitter provided better contrast for dynamic imaging of discrete protein distribution and movement. This advancement has the potential to greatly advance the field of single-cell protein imaging.
In the above work, TPrA acts as the coreactant that is toxic for the cells. To achieve a more biocompatible single-cell ECL co-reactant, Liu’s group developed a closed bipolar-electrode-based simple electrochemical luminescence (BPEs-ECL) imaging strategy. They used heterogeneous Ru(bpy)32+@SiO2/Au nanoparticles as functional nanoprobes, and successfully achieved the first wireless, sensitive visual immunoassay of single-cell prostate-specific antigen (PSA) through multiple amplification strategies [92]. In recent years, Zhu’s group prepared a guanine-rich single-stranded DNA (G-ssDNA)-loaded high-index multiplanar gold nanoflower (Hi-AuNF) as the co-reactant of Ru(bpy)32+. G-ssDNA, serving as a highly efficient and biocompatible coreactant, could accelerate the electrochemical catalytic pathway from Ru(bpy)33+ to Ru(bpy)32+*, and stabilize Hi-AuNF with a relatively sturdy Au-S bond. As a result, this assembly increases the loading capacity of G-ssDNA and promotes the enhancement of the ECL signal of Ru(bpy)32+ for better ECL visualization of carcinoembryonic antigen (CEA) at cell membranes [93]. To further reduce cytotoxicity and improve ECL imaging intensity, Ju’s group designed tertiary amine-conjugated polymer dots (TEA-Pdots) as a novel coreactant-embedded ECL tag at the protein. This design utilizes the superstructure and intramolecular electron transfer inside the probe to emit strong ECL without the coreactant, enabling the in situ imaging of membrane proteins at single cells without additional permeable treatment for transporting the coreactant [94]. This further development of the highly luminescent probe with the biocompatible coreactant or without the coreactant will be an important direction to better fit single-cell analysis in biological studies.
In addition to the labeling strategy mentioned earlier, our group has reported a capacitance imaging method based on ECL to visualize proteins on the cell membrane without the need for tagging the ECL probe to the antibodies [95]. This method relies on the reduction in local capacitance when the antibody binds to the membrane protein, leading to an increase in double-layer potential at the binding site. As the ECL intensity is strongly influenced by the double-layer potential, the binding of the protein–antibody complex enhances the ECL signal, enabling the visualization of the location of the target membrane protein (Figure 3c). This strategy utilizes the ECL reaction from the reagents in the solution and offers the advantages of label-free detection, simple setup, and high sensitivity. Additionally, Sojic’s group has developed a label-free shadow ECL (SECL) microscopy technique that confines the ECL emission layer spatially, allowing for the imaging of subcellular organelles and single cells on the electrode surface. By exploiting the local hindrance of ECL reagents by each mitochondrion, SECL enables the detection of mitochondria that are challenging to detect using traditional biomarkers [96]. Moreover, SECL achieves sharp negative contrast imaging at concentrations orders of magnitude lower than conventional methods, offering enhanced sensitivity and the potential for the imaging at the single molecule level. Currently, a bimodal and bicolor approach has been introduced in ECL microscopy, enabling the simultaneous recording of positive ECL (PECL) and SECL images of single cells [97] (Figure 3d). These advancements suggest the feasibility of development high-sensitivity, label-free ECL imaging at the single-cell level, which represents an important direction in this study.
Figure 3.
ECL imaging of membrane proteins. (a) Surface-confined microscopy based on electrochemical luminescence (ECL), imaging the ECL of the plasma membrane of a single cell at the interface of an electrode [87]. Copyright 2017 J Am Chem Soc. (b) Schematic diagram of Ru(bpy)32+-doped silica/gold nanoparticles (RuDSNs/AuNPs) used as ECL nanoemitters to image individual proteins on the electrode surface and cell membrane [89]. Copyright 2021 J Am Chem Soc. (c) Schematic diagram of capacitance microscope based on ECL [95]. Copyright 2019 J Am Chem Soc. (d) Multimodal imaging of cells fixed on a glassy carbon electrode (GCE) and imaging of the same CHO-K1 cell by PL, PECL, and SECL [97]. Copyright 2023 Anal Chem.
Cell–matrix adhesions play essential roles in the binding interactions between cells and the extracellular matrix, as well as in various biological processes. Su’s group utilized ECL microscopy for label-free imaging of cell–matrix adhesions and further investigated the migration tendencies of cells during collective migration. Their strategy involved using a modified indium tin oxide electrode as the substrate, with a silica nanochannel membrane that enhanced the ECL emission from freely diffusing luminophores. This enhancement provided a distinct visual contrast and non-contacted domains, enabling label-free imaging of cell–matrix adhesions [98]. They further modulated the ECL reaction pathway by adjusting the concentrations of luminophores and/or co-reactants to sequentially image cell–matrix and cell–cell connections at the bottom and near the top surface of the cells. This approach provided an opportunity for developing spatially selective micro-imaging strategies [99]. Recently, they successfully imaged cell–matrix adhesions and collective cell migration by introducing microgrooved electrodes and surface-sensitive ECL microscopy in the system (electrochemiluminescence imaging of cellular contact guidance on microfabricated substrates). Additionally, Xia’s group proposed a label-free, rapid method for imaging single-cell electrochemiluminescence using a bipolar nanoelectrode array. By utilizing a closed bipolar electrochemical system with a single-sided platinum-coated gold nanoelectrode array, they employed the dynamic concentration gradient of oxygen as an electroactive probe. This approach achieved label-free, rapid, and positive ECL imaging of single cells, allowing visualization of the local adhesion strength of individual cells [100].
Zhu’s group have developed a new dual ECL signaling system for evaluating cell surface receptors and analyzing disease cells at the single-cell level. In this strategy, two ECL probes, Au@L012 and g-C3N4, were used to specifically bind to epidermal growth factor (EGFR) and phosphatidylserine (PS) on the cell surface. By scanning the potential, two distinct ECL signals were observed, and the apoptosis rate of normal and cancer cell samples was visualized using ECL microscopy [101]. To enhance the ECL signal future, Ru(bpy)32+ was used as the luminophore and nitrogen-doped carbon dots (NCDs) were used as the nano-coreactant. This created a catalytic route for the ECL microscopy cell imaging strategy. The catalytic route between Ru(bpy)32+ and NCDs extended the ECL emitting layer, significantly improving the ECL signal intensity. This enhancement allowed for the vertical resolution imaging of the cell membrane and the imaging of phosphatidylserine (PS) on apoptotic cell membranes. These advancements expand the application of ECL in biological analysis [102].
An interesting phenomenon that must be mentioned in single-cell ECL imaging is the observation of the ECL photobleaching by Sojic’s group. Due to the weak luminescence from the ECL probe, it is not easy to observe ECL photobleaching. However, after the photobleaching through sequential stepwise illumination, a linear correlation between ECL reduction and PL loss was recorded in Ru(bpy)32+ derivatives labeled on the cellular membrane. These losses should be attributed to the photobleaching of the labels, which provide valuable information on the fundamentals of the ECL excited state. In the future, combining ECL microscopy with photobleaching techniques will provide new methods similar to fluorescence recovery after photobleaching (FRAP) or fluorescence loss in photobleaching (FLIP) methods, which can provide kinetic information about protein movement at the cellular membrane [103].
3.3. ECL Imaging of Intracellular Molecules
In the past ten years, most of the focus in single-cell ECL imaging has been on the visualization of biomolecules at the cellular membrane, as the ECL reaction can occur at the electrode surface. However, there has been a recent breakthrough in nanoelectrochemistry that allows for intracellular biomolecule analysis, providing more information about the cellular activity. Therefore, many groups are devoted to addressing the challenges in intracellular ECL imaging. In our early work, we fabricated a luminol-gold composite microelectrode that was inserted into the cell to react with intracellular hydrogen peroxide for visualization [104]. Later on, we decorated a Pt deposit on the inside walls of a nanopipette tip to create an open bipolar ECL device. Once positioned inside the cell, the porous structure of the Pt deposit allows for electrochemical loading of intracellular molecules. Coupled with enzymatic reactions and subsequent ECL reaction, we can visualize intracellular concentrations of hydrogen peroxide or glucose, as well as the intracellular sphingomyelinase activity [105].
Table 2.
Electrochemiluminescence detection and imaging of biomolecules at single cells.
| Single-Cell ECL Method | Category | Luminophore | Cell Type | Target | References |
|---|---|---|---|---|---|
| ECL Measurement | small molecules | Luminol | Raw264.7 | Cholesterol | [43] |
| macromolecule | ZnCQDs | MCF-7, MDA-MB-231 | CD44 | [45] | |
| Au@Cu-PbCQD | MCF-7 | CD44 | [46] | ||
| ECL Imaging | small molecules | L-012 | Hela | Cholesterol | [70,77] |
| (Ru(bpy)32+ | PC12 | Dopamine | [71,72] | ||
| Pdots | PC12 | Dopamine | [78] | ||
| L-012 | MCF-7, Hela | H2O2 | [73,74,75] | ||
| L-012 | HMSC-BM, MCF-7 | O2 | [76] | ||
| membrane proteins | (Ru(bpy)32+ | CHO-K1 | EGFR | [83] | |
| (Ru(bpy)32+ | L-02, MCF-7 | CK19 | [85] | ||
| (Ru(bpy)32+ | MCF-7 | EpCAM | [86] | ||
| (Ru(bpy)32+ | Hela, Ramos, CCRF-CEM | PTK7 | [87] | ||
| (Ru(bpy)32+ | MCF-7 | CEA | [89] | ||
| L-012 | MCF-7 | CEA | [91] | ||
| TEA-Pdots | SK-BR-3 | HER2 | [90] | ||
| L-012 | MCF-7 | EGFR, PS | [97] | ||
| (Ru(bpy)32+ | apoptotic | PS | [98] | ||
| intracellular molecules | Luminol | Hela | H2O2 | [100] | |
| L-012 | Hela | Glucose, H2O2 | [101] | ||
| Luminol | Hela | miRNA-21 | [102] | ||
| L-012 | MCF-7 | KDM1/LSD1 | [104] | ||
| L-012 | Hela | Glucose | [105] |
Additionally, Zhang’s group established a new ECL imaging technique for the parallel imaging of miRNA-21 in single cancer cells using a Phorbol-12-myristate-13-acetate (PMA)-loaded gold nanocage as a probe. In the cell, the PMA-supported gold nanocages (Au NCs) are sealed by DNA gates and recognized and opened by miRNA-21. PMA is then released, and HeLa cells are further induced to produce reactive oxygen species (ROS), enabling ECL imaging of miRNA-21 within a single HeLa cell [106]. Although this work can visualize the biomolecules inside the cell, the nanoelectrode-based measurement can only provide a visualized image of local information. Imaging the spatial distribution of biomolecules inside the whole cell remains a goal in this field.
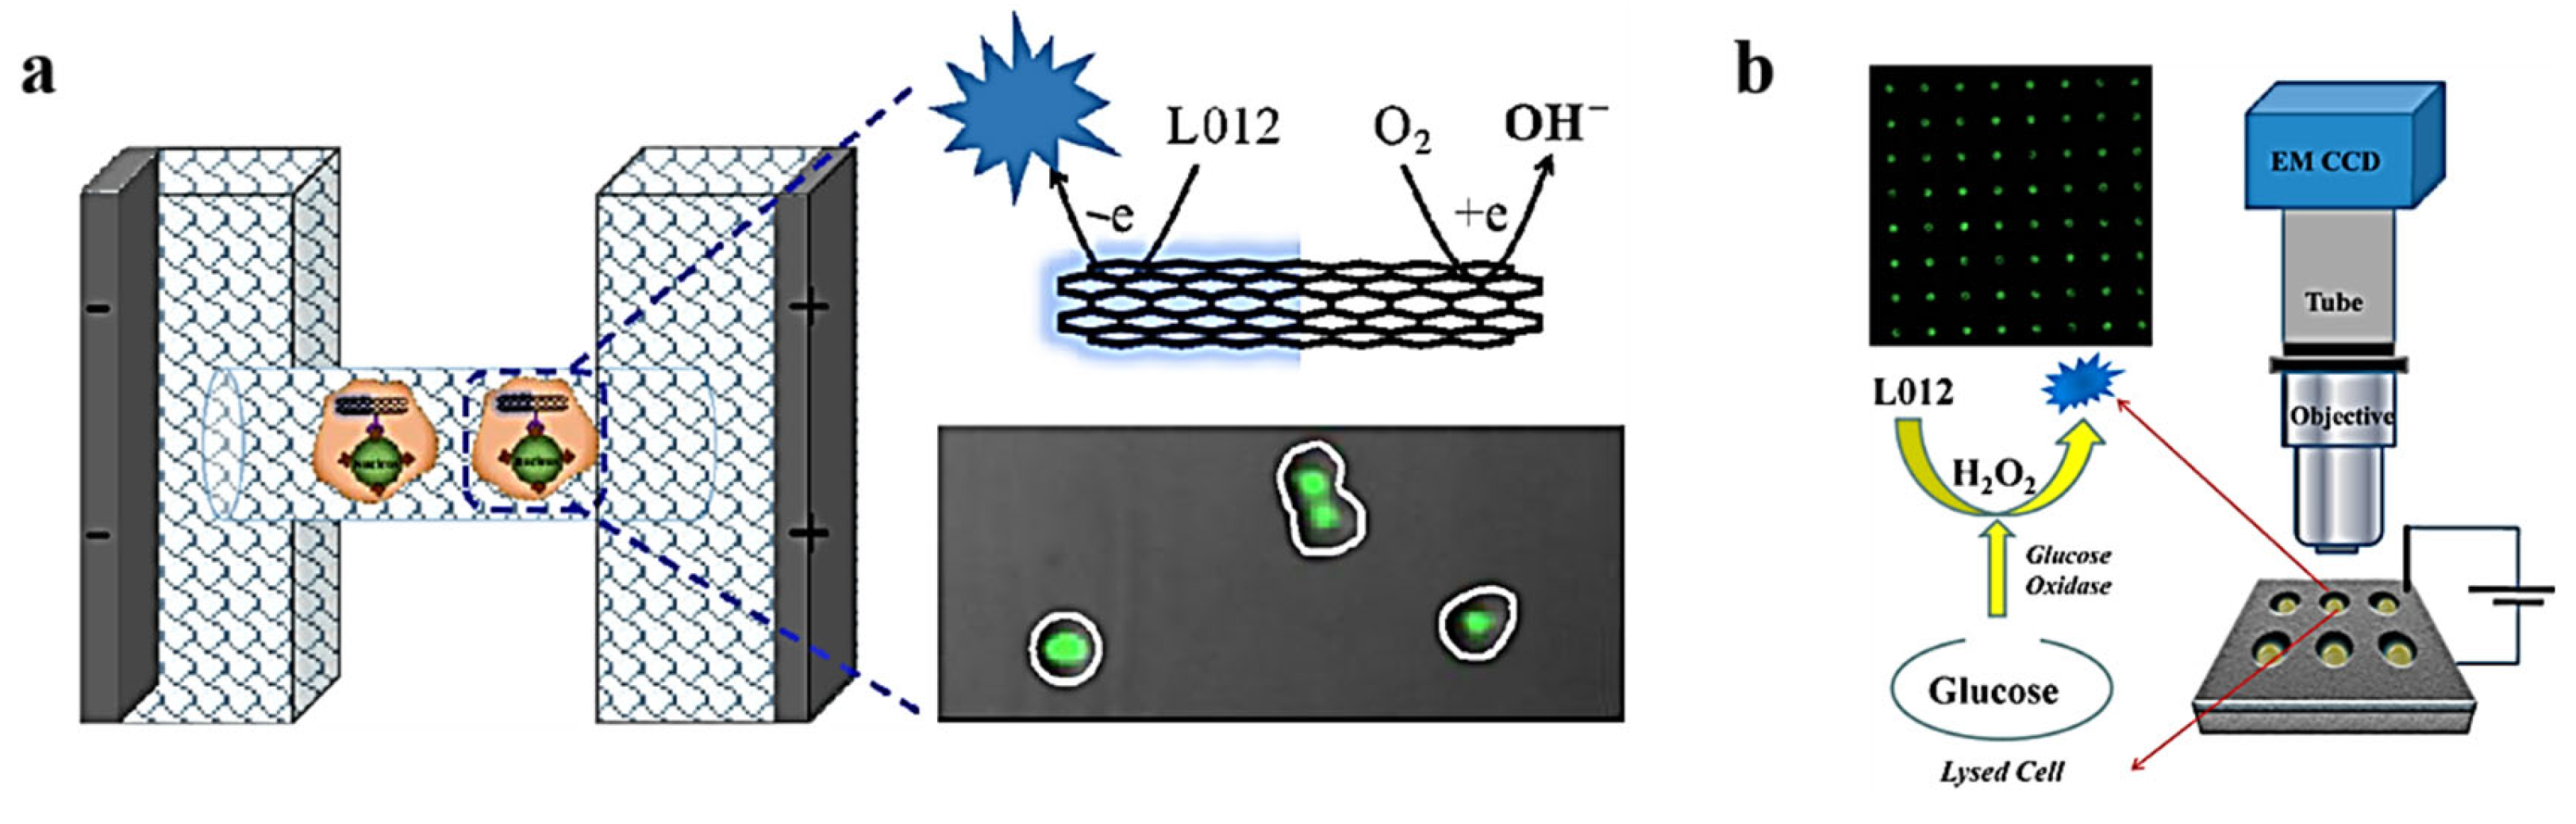
In 2021, Zhu’s group reported a bio-coreactant-enhanced ECL microscopy to realize the ECL imaging of intracellular structures and dynamic transport [107]. The key design in this strategy is to utilize the electrochemical oxidation of Ru(bpy)32+ into Ru(bpy)33+ at the electrode surface, which enters into the cell to react with intracellular biomolecules with reductive amine moieties, resulting in ECL emission. Consequently, intracellular structures and autophagy involving DNA oxidative damage are imaged using the ECL image for the first time. This strategy effectively employs Ru(bpy)33+ as the molecular antenna, connecting extracellular and intracellular environments and providing a solution for single-cell ECL imaging of intracellular structures and molecules. To further develop intracellular ECL imaging, our group immobilized the cell into agarose hydrogel and loaded antibody-modified single-walled carbon nanotubes into the cells to recognize the corresponding antigen (e.g., KDM1/LSD1 antigen). Typically, an order of tens of kilovolts should be applied to induce the ECL reaction at the nanotube, which is not easily achievable. However, thanks to the confined voltage drop in the micropores of the gel, a low electric field of 1000 V/cm was observed to electrochemically oxidize L012 at one end of the nanotube, resulting in ECL emission. The significant decrease in the applied voltage enables the observation of distinct ECL emission at the nucleus inside a single cell, reflecting the distribution and amount of intracellular KDM1/LSD1 antigen [108] (Figure 4a). As this early work progresses, further advancements in intracellular ECL imaging are expected in the near future.
Besides the acquisition of the spatial distribution of intracellular molecules, high-throughput analysis of these molecules at the single-cell level is also important. Following the previous protocol for the high-throughput ECL analysis of membrane molecules in single cells, the measurement of intracellular molecules only requires the introduction of Triton X-100 to disrupt the cellular membrane inside the microwells. For instance, our group exposed the cells in the microwells to the physiological buffer with glucose oxidase and Triton X-100. Triton X-100 breaks down the cell membrane, releasing glucose, which reacts with glucose oxidase to produce hydrogen peroxide for ECL detection (Figure 4b). By collecting the ECL intensities at the microwells in the image, the concentration of intracellular glucose in single cells was determined, revealing the high heterogeneity of glucose in cells [109]. The same protocol is also applied to measure intracellular cholesterol ester, and the obtained information is crucial for understanding cholesterol trafficking at the single-cell level.
4. Summary and Outlook
Over the past twenty years, single-cell ECL analysis has emerged as a rapidly developing field for determining various molecules at the plasma membrane and inside the cytosol. It has been widely applied in research areas such as cell heterogeneity, disease mechanisms, immunology, and drug response. This technology has brought significant breakthroughs to biomedical research and clinical practice [110,111,112,113,114,115,116]. The features of surface confinement, near-zero background, and high sensitivity enable this tool to provide valuable information that is not easily resolved by classic fluorescence microscopy. Despite the tremendous achievement in this field, single-cell ECL measurement and imaging still face some challenges that need to be addressed before their full application in biological and clinic studies. First, the spatial resolution in the image needs to be further improved. Super-resolution fluorescence microscopy has overcome optical diffraction and can provide a spatial resolution down to 20 nm. However, due to the poor luminescence efficiency from the ECL tag, it is difficult to acquire sufficient protons from one ECL molecule. Therefore, the current spatial resolution of a single-cell ECL image is still at the submicron level. The incorporation of super-resolution radial fluctuation (SRRF) algorithms has pushed the resolution down to 100 nm but is still limited in characterizing the electrocatalytic activity at single particles [107,108]. Further development of this super-resolution ECL microscopy is the most urgent direction in single-cell imaging. Second, the temporal resolution of ECL imaging should be improved. As a low-light-emission process, the exposure time for capturing one ECL image of a single cell requires at least a few hundred milliseconds, which may not satisfy the requirements for fast tracking of bioprocesses. Some early work has been conducted to increase the ECL intensity and shorten the exposure time through the usage of new conductive materials [117,118,119,120,121]. More principles and strategies should be established to achieve high-temporal-resolution single-cell ECL imaging. Moreover, obtaining new ECL reagents with high ECL efficiency, creating a more biocompatible environment to maximize cellular activity, and enabling multivariate assays on more biomolecules within a single cell are also important directions for the development of single-cell ECL imaging.
In summary, single-cell ECL analysis has become a research hotspot in the field of chemistry and bioelectrochemistry and has attracted wide attention from biomedical researchers. Compared to fluorescence methods, ECL single-cell analysis is still in its early stages and faces numerous challenges that need to be addressed. With the continuous application and development of new reagents, mechanisms, equipment, and research strategies, this field should be grown into a broad research prospect [122,123,124]. We believe that further innovations in ECL measurements will help enable spatiotemporal resolution and high-throughput analysis of single cells, allowing us to gain a deeper understanding of cell behavior and function.
Funding
This research was funded by the National Natural Science Foundation of China, grant number 22274078 and 21974071.
Institutional Review Board Statement
Not applicable.
Informed Consent Statement
Not applicable.
Data Availability Statement
The data are available upon request to the corresponding author.
Conflicts of Interest
The authors declare no conflict of interest.
References
- Miao, W. Electrogenerated chemiluminescence and its biorelated applications. Chem. Rev. 2008, 108, 2506–2553. [Google Scholar] [CrossRef] [PubMed]
- Hu, L.; Xu, G. Applications and trends in electrochemiluminescence. Chem. Soc. Rev. 2010, 39, 3275–3304. [Google Scholar] [CrossRef] [PubMed]
- Abdussalam, A.; Xu, G. Recent advances in electrochemiluminescence luminophores. Anal. Bioanal. Chem. 2022, 414, 131–146. [Google Scholar] [CrossRef] [PubMed]
- Zanut, A.; Fiorani, A.; Canola, S.; Saito, T.; Ziebart, N.; Rapino, S.; Rebeccani, S.; Barbon, A.; Irie, T.; Josel, H.P.; et al. Insights into the mechanism of coreactant electrochemiluminescence facilitating enhanced bioanalytical performance. Nat. Commun. 2020, 11, 2668. [Google Scholar] [CrossRef]
- Dufford, R.T.; Nightingale, D.; Gaddum, L.W. Luminescence of gridnard compounds in electric and magnetic fields, and related electrical phenomena. J. Am. Chem. Soc. 1927, 49, 1858–1864. [Google Scholar] [CrossRef]
- Harvey, N. Luminescence during Electrolysis. J. Phys. Chem. 1929, 33, 1456. [Google Scholar] [CrossRef]
- Hercules, D.M. Chemiluminescence Resulting from Electrochemically Generated Species. Science 1964, 145, 808–809. [Google Scholar] [CrossRef] [PubMed]
- Santhanam, K.S.V.; Bard, A.J. Chemiluminescence of electrogenerated 9,10-Diphenylanthracene anion radical. J. Am. Chem. Soc. 1965, 87, 139–140. [Google Scholar] [CrossRef]
- Ma, X.; Gao, W.; Du, F.; Yuan, F.; Yu, J.; Guan, Y.; Sojic, N.; Xu, G. Rational Design of Electrochemiluminescent Devices. Acc. Chem. Res. 2021, 54, 2936–2945. [Google Scholar] [CrossRef]
- Zanut, A.; Palomba, F.; Rossi Scota, M.; Rebeccani, S.; Marcaccio, M.; Genovese, D.; Rampazzo, E.; Valenti, G.; Paolucci, F.; Prodi, L. Dye-Doped Silica Nanoparticles for Enhanced ECL-Based Immunoassay Analytical Performance. Angew. Chem. Int. Ed. 2020, 59, 21858–21863. [Google Scholar] [CrossRef]
- Liu, X.; Zhao, S.; Tan, L.; Tan, Y.; Wang, Y.; Ye, Z.; Hou, C.; Xu, Y.; Liu, S.; Wang, G. Frontier and hot topics in electrochemiluminescence sensing technology based on CiteSpace bibliometric analysis. Biosens. Bioelectron. 2022, 201, 113932. [Google Scholar] [CrossRef] [PubMed]
- Chen, M.M.; Xu, C.H.; Zhao, W.; Chen, H.Y.; Xu, J.J. Single Cell Imaging of Electrochemiluminescence-Driven Photodynamic Therapy. Angew. Chem. Int. Ed. 2022, 61, e202117401. [Google Scholar] [CrossRef] [PubMed]
- Yoo, S.M.; Jeon, Y.M.; Heo, S.Y. Electrochemiluminescence Systems for the Detection of Biomarkers: Strategical and Technological Advances. Biosensors 2022, 12, 738. [Google Scholar] [CrossRef] [PubMed]
- Gou, X.; Xing, Z.; Ma, C.; Zhu, J.J. A Close Look at Mechanism, Application, and Opportunities of Electrochemiluminescence Microscopy. Chem. Biomed. Imaging 2023, 1, 414–433. [Google Scholar] [CrossRef]
- Guo, M.; Du, D.; Wang, J.; Ma, Y.; Yang, D.; Haghighatbin, M.A.; Shu, J.; Nie, W.; Zhang, R.; Bian, Z.; et al. Three-Biomarker Joint Strategy for Early and Accurate Diagnosis of Acute Myocardial Infarction via a Multiplex Electrochemiluminescence Immunoarray Coupled with Robust Machine Learning. Chem. Biomed. Imaging 2023, 1, 179–185. [Google Scholar] [CrossRef]
- Trad, F.B.; Delacotte, J.; Guille-Collignon, M.; Lemaître, F.; Arbault, S.; Sojic, N.; Burlina, F.; Labbé, E.; Burie, O. Electrochemiluminescence Imaging of Liposome Permeabilization by an Antimicrobial Peptide: Melittin. Chem. Biomed. Imaging 2023, 1, 58–65. [Google Scholar] [CrossRef]
- Zhu, W.; Dong, J.; Ruan, G.; Zhou, Y.; Feng, J. Quantitative Single-Molecule Electrochemiluminescence Bioassay. Angew. Chem. Int. Ed. 2023, 62, e202214419. [Google Scholar] [CrossRef]
- Hoebe, R.A.; Van Oven, C.H.; Gadella, T.W., Jr.; Dhonukshe, P.B.; Van Noorden, C.J.; Manders, E.M. Controlled light-exposure microscopy reduces photobleaching and phototoxicity in fluorescence live-cell imaging. Nat. Biotechnol. 2007, 25, 249–253. [Google Scholar] [CrossRef]
- Liu, Z.; Qi, W.; Xu, G. Recent advances in electrochemiluminescence. Chem. Soc. Rev. 2015, 44, 3117–3142. [Google Scholar] [CrossRef]
- Forster, R.J.; Bertoncello, P.; Keyes, T.E. Electrogenerated chemiluminescence. Annu. Rev. Anal. Chem. 2009, 2, 359–385. [Google Scholar] [CrossRef]
- Richter, M.M. Electrochemiluminescence (ECL). Chem. Rev. 2004, 104, 3003–3036. [Google Scholar] [CrossRef]
- Mostafa, I.M.; Abdussalam, A.; Zholudov, Y.T.; Snizhko, D.V.; Zhang, W.; Hosseini, M.; Guan, Y.; Xu, G. Recent Applications and Future Perspectives of Chemiluminescent and Bioluminescent Imaging Technologies. Chem. Biomed. Imaging 2023, 1, 297–314. [Google Scholar] [CrossRef]
- Wang, S.; Ren, W.X.; Hou, J.T.; Won, M.; An, J.; Chen, X.; Shu, J.; Kim, J.S. Fluorescence imaging of pathophysiological microenvironments. Chem. Soc. Rev. 2021, 50, 8887–8902. [Google Scholar] [CrossRef] [PubMed]
- Elowitz, M.B.; Levine, A.J.; Siggia, E.D.; Swain, P.S. Stochastic gene expression in a single cell. Science 2002, 297, 1183–1186. [Google Scholar] [CrossRef] [PubMed]
- Keller, L.; Pantel, K. Unravelling tumour heterogeneity by single-cell profiling of circulating tumour cells. Nat. Rev. Cancer 2019, 19, 553–567. [Google Scholar] [CrossRef] [PubMed]
- Pollen, A.A.; Nowakowski, T.J.; Shuga, J.; Wang, X.; Leyrat, A.A.; Lui, J.H.; Li, N.; Szpankowski, L.; Fowler, B.; Chen, P.; et al. Low-coverage single-cell mRNA sequencing reveals cellular heterogeneity and activated signaling pathways in developing cerebral cortex. Nat. Biotechnol. 2014, 32, 1053–1058. [Google Scholar] [CrossRef] [PubMed]
- Chen, H.H.; Chen, T. Probing Oxidant Effects on Superoxide Dismutase 1 Oligomeric States in Live Cells Using Single-Molecule Fluorescence Anisotropy. Chem. Biomed. Imaging 2023, 1, 49–57. [Google Scholar] [CrossRef] [PubMed]
- Stuart, T.; Satija, R. Integrative single-cell analysis. Nat. Rev. Genet. 2019, 20, 257–272. [Google Scholar] [CrossRef] [PubMed]
- Brandman, O.; Ferrell, J.E., Jr.; Li, R.; Meyer, T. Interlinked fast and slow positive feedback loops drive reliable cell decisions. Science 2005, 310, 496–498. [Google Scholar] [CrossRef]
- Piwecka, M.; Rajewsky, N.; Rybak-Wolf, A. Single-cell and spatial transcriptomics: Deciphering brain complexity in health and disease. Nat. Rev. Neurol. 2023, 19, 346–362. [Google Scholar] [CrossRef]
- Labib, M.; Kelley, S.O. Single-cell analysis targeting the proteome. Nat. Rev. Chem. 2020, 4, 143–158. [Google Scholar] [CrossRef] [PubMed]
- Yu, W.; Rush, C.; Tingey, M.; Junod, S.; Yang, W. Application of Super-resolution SPEED Microscopy in the Study of Cellular Dynamics. Chem. Biomed. Imaging 2023, 1, 356–371. [Google Scholar] [CrossRef] [PubMed]
- Ren, X.; Zhang, L.; Zhang, Y.; Li, Z.; Siemers, N.; Zhang, Z. Insights Gained from Single-Cell Analysis of Immune Cells in the Tumor Microenvironment. Annu. Rev. Immunol. 2021, 39, 583–609. [Google Scholar] [CrossRef] [PubMed]
- Knezevic, S.; Bouffier, L.; Liu, B.; Jiang, D.; Sojic, N. Electrochemiluminescence microscopy: From single objects to living cells. Curr. Opin. Electrochem. 2022, 35, 101096. [Google Scholar] [CrossRef]
- Rebeccani, S.; Zanut, A.; Santo, C.I.; Valenti, G.; Paolucci, F. A Guide Inside Electrochemiluminescent Microscopy Mechanisms for Analytical Performance Improvement. Anal. Chem. 2022, 94, 336–348. [Google Scholar] [CrossRef] [PubMed]
- He, Q.-N.; Ma, Z.-Y.; Yang, Y.-X.; Xu, C.-H.; Zhao, W. Recent Advances in Electrochemiluminescence-Based Single-Cell Analysis. Chemosensors 2023, 11, 281. [Google Scholar] [CrossRef]
- Zhang, S.; Liu, Y. Electrochemiluminescence Single-cell Analysis on Nanostructured Interface. Electroanalysis 2022, 34, 937. [Google Scholar]
- Ding, H.; Su, B.; Jiang, D. Recent Advances in Single Cell Analysis by Electrochemiluminescence. ChemistryOpen 2023, 12, e202200113. [Google Scholar] [CrossRef]
- Dong, J.; Feng, J. Electrochemiluminescence from Single Molecule to Imaging. Anal. Chem. 2023, 95, 374–387. [Google Scholar] [CrossRef]
- Yang, Q.; Huang, X.; Gao, B.; Gao, L.; Yu, F.; Wang, F. Advances in electrochemiluminescence for single-cell analysis. Analyst 2022, 148, 9–25. [Google Scholar] [CrossRef]
- Meng, C.; Knežević, S.; Du, F.X.; Guan, Y.R.; Kanoufi, F.; Sojic, N.; Xu, G.B. Recent advances in electrochemiluminescence imaging analysis. eScience 2022, 2, 591–605. [Google Scholar] [CrossRef]
- Zhang, Z.; Ma, C.; Xu, Q.; Zhu, J.J. Recent progress in electrochemiluminescence microscopy analysis of single cells. Analyst 2022, 147, 2884–2894. [Google Scholar] [CrossRef] [PubMed]
- Ma, G.; Zhou, J.; Tian, C.; Jiang, D.; Fang, D.; Chen, H. Luminol electrochemiluminescence for the analysis of active cholesterol at the plasma membrane in single mammalian cells. Anal. Chem. 2013, 85, 3912–3917. [Google Scholar] [CrossRef]
- Huang, S.; Liu, K.; Jiang, D.; Fang, D. Codetermination of Sphingomyelin and Cholesterol in Cellular Plasma Membrane in Sphingomyelin-Depletion-Induced Cholesterol Efflux. Anal. Chem. 2019, 91, 1501–1506. [Google Scholar] [CrossRef] [PubMed]
- Qiu, Y.; Zhou, B.; Yang, X.; Long, D.; Hao, Y.; Yang, P. Novel Single-Cell Analysis Platform Based on a Solid-State Zinc-Coadsorbed Carbon Quantum Dots Electrochemiluminescence Probe for the Evaluation of CD44 Expression on Breast Cancer Cells. ACS Appl. Mater. Interfaces 2017, 9, 16848–16856. [Google Scholar] [CrossRef] [PubMed]
- Long, D.; Chen, C.; Cui, C.; Yao, Z.; Yang, P. A high precision MUA-spaced single-cell sensor for cellular receptor assay based on bifunctional Au@Cu-PbCQD nanoprobes. Nanoscale 2018, 10, 18597–18605. [Google Scholar] [CrossRef]
- Dong, S.; Gao, X.; Fu, L.; Jia, J.; Zou, G. Low-Triggering-Potential Electrochemiluminescence from Surface-Confined CuInS2@ZnS Nanocrystals and their Biosensing Applications. Anal. Chem. 2021, 93, 12250–12256. [Google Scholar] [CrossRef] [PubMed]
- Song, X.; Zhao, L.; Zhang, N.; Liu, L.; Ren, X.; Ma, H.; Kuang, X.; Li, Y.; Luo, C.; Wei, Q. Ultrasensitive Electrochemiluminescence Biosensor with Silver Nanoclusters as a Novel Signal Probe and α-Fe2O3-Pt as an Efficient Co-reaction Accelerator for Procalcitonin Immunoassay. Anal. Chem. 2023, 95, 1582–1588. [Google Scholar] [CrossRef]
- Liu, L.; Yang, A.; Luo, W.; Liu, H.; Liu, X.; Zhao, W. Ultrasensitive detection of cyclin D1 by a self-enhanced ECL immunosensor based on Bi2S3 quantum dots. Analyst 2021, 146, 2057–2064. [Google Scholar] [CrossRef]
- Gao, X.; Jiang, G.; Gao, C.; Prudnikau, A.; Hübner, R.; Zhan, J.; Zou, G.; Eychmüller, A.; Cai, B. Interparticle Charge-Transport-Enhanced Electrochemiluminescence of Quantum-Dot Aerogels. Angew. Chem. Int. Ed. 2023, 62, e202214487. [Google Scholar] [CrossRef]
- Yang, Y.T.; Liu, J.L.; Sun, M.F.; Yuan, R.; Chai, Y.Q. Highly Efficient Electrochemiluminescence of MnS:CdS@ZnS Core-Shell Quantum Dots for Ultrasensitive Detection of MicroRNA. Anal. Chem. 2022, 94, 6874–6881. [Google Scholar] [CrossRef] [PubMed]
- Chen, C.; Wang, Y.L.; Lin, X.; Ma, S.H.; Cao, J.T.; Liu, Y.M. Cu-MOFs/GOx Bifunctional Probe-Based Synergistic Signal Amplification Strategy: Toward Highly Sensitive Closed Bipolar Electrochemiluminescence Immunoassay. ACS Appl. Mater. Interfaces 2023, 15, 22959–22966. [Google Scholar] [CrossRef] [PubMed]
- Peng, H.; Huang, Z.; Sheng, Y.; Zhang, X.; Deng, H.; Chen, W.; Liu, J. Pre-oxidation of Gold Nanoclusters Results in a 66% Anodic Electrochemiluminescence Yield and Drives Mechanistic Insights. Angew. Chem. Int. Ed. 2019, 58, 11691–11694. [Google Scholar] [CrossRef] [PubMed]
- Peng, H.; Huang, Z.; Deng, H.; Wu, W.; Huang, K.; Li, Z.; Chen, W.; Liu, J. Dual Enhancement of Gold Nanocluster Electrochemiluminescence: Electrocatalytic Excitation and Aggregation-Induced Emission. Angew. Chem. Int. Ed. 2020, 59, 9982–9985. [Google Scholar] [CrossRef] [PubMed]
- Hesari, M.; Ding, Z. Identifying Highly Photoelectrochemical Active Sites of Two Au21 Nanocluster Isomers toward Bright Near-Infrared Electrochemiluminescence. J. Am. Chem. Soc. 2021, 143, 19474–19485. [Google Scholar] [CrossRef] [PubMed]
- Wang, Y.; Ding, J.; Zhou, P.; Liu, J.; Qiao, Z.; Yu, K.; Jiang, J.; Su, B. Electrochemiluminescence Distance and Reactivity of Coreactants Determine the Sensitivity of Bead-Based Immunoassays. Angew. Chem. Int. Ed. 2023, 62, e202216525. [Google Scholar] [CrossRef] [PubMed]
- Ouyang, X.; Wu, Y.; Guo, L.; Li, L.; Zhou, M.; Li, X.; Liu, T.; Ding, Y.; Bu, H.; Xie, G.; et al. Self-assembly Induced Enhanced Electrochemiluminescence of Copper Nanoclusters Using DNA Nanoribbon Templates. Angew. Chem. Int. Ed. 2023, 62, e202300893. [Google Scholar] [CrossRef]
- Wu, Z.; Wen, J.; Qin, Y.; Ling, L.; Jiao, L.; Zhang, R.; Luo, Z.; Xi, M.; Hu, L.; Gu, W.; et al. Dual-Site Activation Coupling with a Schottky Junction Boosts the Electrochemiluminescence of Carbon Nitride. Angew. Chem. Int. Ed. 2023, 62, e202308257. [Google Scholar] [CrossRef]
- Han, D.; Goudeau, B.; Jiang, D.; Fang, D.; Sojic, N. Electrochemiluminescence Microscopy of Cells: Essential Role of Surface Regeneration. Anal. Chem. 2021, 93, 1652–1657. [Google Scholar] [CrossRef]
- Chong, Y.T.; Koh, J.L.; Friesen, H.; Duffy, S.K.; Cox, M.J.; Moses, A.; Moffat, J.; Boone, C.; Andrews, B.J. Yeast Proteome Dynamics from Single Cell Imaging and Automated Analysis. Cell 2015, 161, 1413–1424. [Google Scholar] [CrossRef]
- Valm, A.M.; Cohen, S.; Legant, W.R.; Melunis, J.; Hershberg, U.; Wait, E.; Cohen, A.R.; Davidson, M.W.; Betzig, E.; Lippincott-Schwartz, J. Applying systems-level spectral imaging and analysis to reveal the organelle interactome. Nature 2017, 546, 162–167. [Google Scholar] [CrossRef]
- Royce, C.; Kirk, W.; Scott, D. Characterization of electrode heterogeneity with electrogenerated chemiluminescence. Anal. Chem. 1987, 59, 670–673. [Google Scholar]
- Robert, J.; Richard, L.; Christine, M.; Royce, C. Observation of kinetic heterogeneity on highly ordered pyrolytic graphite using electrogenerated chemiluminescence. Anal. Chem. 1989, 61, 2763–2766. [Google Scholar]
- Shultz, L.L.; Stoyanoff, J.S.; Nieman, T.A. Temporal and Spatial Analysis of Electrogenerated Ru(bpy)33+ Chemiluminescent Reactions in Flowing Streams. Anal. Chem. 1996, 68, 349–354. [Google Scholar] [CrossRef]
- Zu, Y.; Ding, Z.; Zhou, J.; Lee, Y.; Bard, A.J. Scanning optical microscopy with an electrogenerated chemiluminescent light source at a nanometer tip. Anal. Chem. 2001, 73, 2153–2156. [Google Scholar] [CrossRef] [PubMed]
- Szunerits, S.; Tam, J.M.; Thouin, L.; Amatore, C.; Walt, D.R. Spatially resolved electrochemiluminescence on an array of electrode tips. Anal. Chem. 2003, 75, 4382–4388. [Google Scholar] [CrossRef] [PubMed]
- Amatore, C.; Pebay, C.; Servant, L.; Sojic, N.; Szunerits, S.; Thouin, L. Mapping electrochemiluminescence as generated at double-band microelectrodes by confocal microscopy under steady state. ChemPhysChem 2006, 7, 1322–1327. [Google Scholar] [CrossRef] [PubMed]
- Xu, L.; Li, Y.; Wu, S.; Liu, X.; Su, B. Imaging latent fingerprints by electrochemiluminescence. Angew. Chem. Int. Ed. 2012, 51, 8068–8072. [Google Scholar] [CrossRef]
- Rigolot, V.; Biot, C.; Lion, C. To View Your Biomolecule, Click inside the Cell. Angew. Chem. Int. Ed. 2021, 60, 23084–23105. [Google Scholar] [CrossRef]
- Zhou, J.; Ma, G.; Chen, Y.; Fang, D.; Jiang, D.; Chen, H.Y. Electrochemiluminescence imaging for parallel single-cell analysis of active membrane cholesterol. Anal. Chem. 2015, 87, 8138–8143. [Google Scholar] [CrossRef]
- Ding, H.; Guo, W.; Zhou, P.; Su, B. Nanocage-confined electrochemiluminescence for the detection of dopamine released from living cells. Chem. Commun. 2020, 56, 8249–8252. [Google Scholar] [CrossRef] [PubMed]
- Ding, H.; Guo, W.; Ding, L.; Su, B. Confined Electrochemiluminescence at Microtube Electrode Ensembles for Local Sensing of Single Cells. Chin. J. Chem. 2021, 39, 2911–2916. [Google Scholar] [CrossRef]
- Liu, G.; Ma, C.; Jin, B.K.; Chen, Z.; Zhu, J.J. Direct Electrochemiluminescence Imaging of a Single Cell on a Chitosan Film Modified Electrode. Anal. Chem. 2018, 90, 4801–4806. [Google Scholar] [CrossRef] [PubMed]
- Zhang, J.; Jin, R.; Chen, Y.; Fang, D.; Jiang, D. Enhanced electrochemiluminescence at single lithium iron phosphate nanoparticles for the local sensing of hydrogen peroxide efflux from single living cell under a low voltage. Sens. Actuators B 2021, 329, 129208. [Google Scholar] [CrossRef]
- Cui, C.; Chen, Y.; Jiang, D.; Chen, H.Y.; Zhang, J.; Zhu, J.J. Steady-State Electrochemiluminescence at Single Semiconductive Titanium Dioxide Nanoparticles for Local Sensing of Single Cells. Anal. Chem. 2019, 91, 1121–1125. [Google Scholar] [CrossRef] [PubMed]
- Hiramoto, K.; Ino, K.; Komatsu, K.; Nashimoto, Y.; Shiku, H. Electrochemiluminescence imaging of respiratory activity of cellular spheroids using sequential potential steps. Biosens. Bioelectron. 2021, 181, 113123. [Google Scholar] [CrossRef] [PubMed]
- Xu, J.; Qin, Y.; Xia, J.; Jiang, D.; Chen, H.Y. C3N4 Nanosheet Modified Microwell Array with Enhanced Electrochemiluminescence for Total Analysis of Cholesterol at Single Cells. Anal. Chem. 2017, 89, 2216–2220. [Google Scholar] [CrossRef] [PubMed]
- Wang, N.; Ao, H.; Xiao, W.; Chen, W.; Li, G.; Wu, J.; Ju, H. Confined electrochemiluminescence imaging microarray for high-throughput biosensing of single cell-released dopamine. Biosens. Bioelectron. 2022, 201, 113959. [Google Scholar] [CrossRef]
- Poudineh, M.; Sargent, E.H.; Pantel, K.; Kelley, S.O. Profiling circulating tumour cells and other biomarkers of invasive cancers. Nat. Biomed. Eng. 2018, 2, 72–84. [Google Scholar] [CrossRef]
- Swiecicki, J.M.; Santana, J.T.; Imperiali, B. A Strategic Approach for Fluorescence Imaging of Membrane Proteins in a Native-like Environment. Cell Chem. Biol. 2020, 27, 245–251. [Google Scholar] [CrossRef]
- Xu, H.; Cai, M.; Gao, J.; Shi, Y.; Chen, J.; Wu, Q.; Zhang, J.; Jiang, J.; Wang, H. Membrane protein density determining membrane fusion revealed by dynamic fluorescence imaging. Talanta 2021, 226, 122091. [Google Scholar] [CrossRef] [PubMed]
- Zhang, J.; Rakhimbekova, A.; Duan, X.; Yin, Q.; Foss, C.A.; Fan, Y.; Xu, Y.; Li, X.; Cai, X.; Kutil, Z.; et al. A prostate-specific membrane antigen activated molecular rotor for real-time fluorescence imaging. Nat. Commun. 2021, 12, 5460. [Google Scholar] [CrossRef] [PubMed]
- Zhou, X.; Zhu, D.; Liao, Y.; Liu, W.; Liu, H.; Ma, Z.; Xing, D. Synthesis, labeling and bioanalytical applications of a tris(2,2’-bipyridyl)ruthenium(II)-based electrochemiluminescence probe. Nat. Protoc. 2014, 9, 1146–1159. [Google Scholar] [CrossRef] [PubMed]
- Miao, W.; Choi, J.P.; Bard, A.J. Electrogenerated chemiluminescence 69: The tris(2,2’-bipyridine)ruthenium(II), (Ru(bpy)32+)/tri-n-propylamine (TPrA) system revisited-a new route involving TPrA*+ cation radicals. J. Am. Chem. Soc. 2002, 124, 14478–14485. [Google Scholar] [CrossRef] [PubMed]
- Sornambigai, M.; Bouffier, L.; Sojic, N.; Kumar, S.S. Tris(2,2’-bipyridyl)ruthenium (II) complex as a universal reagent for the fabrication of heterogeneous electrochemiluminescence platforms and its recent analytical applications. Anal. Bioanal. Chem. 2023, 415, 5875–5898. [Google Scholar] [CrossRef] [PubMed]
- Yuan, Y.; Han, S.; Hu, L.; Parveen, S.; Xu, G. Coreactants of tris(2,2′-bipyridyl)ruthenium(II) Electrogenerated Chemiluminescence. Electrochim. Acta 2012, 82, 484–492. [Google Scholar] [CrossRef]
- Valenti, G.; Scarabino, S.; Goudeau, B.; Lesch, A.; Jović, M.; Villani, E.; Sentic, M.; Rapino, S.; Arbault, S.; Paolucci, F.; et al. Single Cell Electrochemiluminescence Imaging: From the Proof-of-Concept to Disposable Device-Based Analysis. J. Am. Chem. Soc. 2017, 139, 16830–16837. [Google Scholar] [CrossRef] [PubMed]
- Voci, S.; Goudeau, B.; Valenti, G.; Lesch, A.; Jović, M.; Rapino, S.; Paolucci, F.; Arbault, S.; Sojic, N. Surface-Confined Electrochemiluminescence Microscopy of Cell Membranes. J. Am. Chem. Soc. 2018, 140, 14753–14760. [Google Scholar] [CrossRef]
- Liu, Y.; Zhang, H.; Li, B.; Liu, J.; Jiang, D.; Liu, B.; Sojic, N. Single Biomolecule Imaging by Electrochemiluminescence. J. Am. Chem. Soc. 2021, 143, 17910–17914. [Google Scholar] [CrossRef]
- Lu, Y.; Huang, X.; Wang, S.; Li, B.; Liu, B. Nanoconfinement-Enhanced Electrochemiluminescence for in Situ Imaging of Single Biomolecules. ACS Nano 2023, 17, 3809–3817. [Google Scholar] [CrossRef]
- Li, B.; Huang, X.; Lu, Y.; Fan, Z.; Li, B.; Jiang, D.; Sojic, N. High Electrochemiluminescence from Ru(bpy)32+ Embedded Metal-Organic Frameworks to Visualize Single Molecule Movement at the Cellular Membrane. Adv. Sci. 2022, 9, 2204715. [Google Scholar] [CrossRef] [PubMed]
- Cao, J.T.; Wang, Y.L.; Zhang, J.J.; Dong, Y.X.; Liu, F.R.; Ren, S.W.; Liu, Y.M. Immuno-Electrochemiluminescent Imaging of a Single Cell Based on Functional Nanoprobes of Heterogeneous Ru(bpy)32+@SiO2/Au Nanoparticles. Anal. Chem. 2018, 90, 10334–10339. [Google Scholar] [CrossRef] [PubMed]
- Chen, Y.; Gou, X.; Ma, C.; Jiang, D.; Zhu, J.J. A Synergistic Coreactant for Single-Cell Electrochemiluminescence Imaging: Guanine-Rich ssDNA-Loaded High-Index Faceted Gold Nanoflowers. Anal. Chem. 2021, 93, 7682–7689. [Google Scholar] [CrossRef] [PubMed]
- Wang, N.; Gao, H.; Li, Y.; Li, G.; Chen, W.; Jin, Z.; Lei, J.; Wei, Q.; Ju, H. Dual Intramolecular Electron Transfer for In Situ Coreactant-Embedded Electrochemiluminescence Microimaging of Membrane Protein. Angew. Chem. Int. Ed. 2021, 60, 197–201. [Google Scholar] [CrossRef] [PubMed]
- Zhang, J.; Jin, R.; Jiang, D.; Chen, H.Y. Electrochemiluminescence-Based Capacitance Microscopy for Label-Free Imaging of Antigens on the Cellular Plasma Membrane. J. Am. Chem. Soc. 2019, 141, 10294–10299. [Google Scholar] [CrossRef] [PubMed]
- Ma, Y.; Colin, C.; Descamps, J.; Arbault, S.; Sojic, N. Shadow Electrochemiluminescence Microscopy of Single Mitochondria. Angew. Chem. Int. Ed. 2021, 60, 18742–18749. [Google Scholar] [CrossRef] [PubMed]
- Knežević, S.; Kerr, E.; Goudeau, B.; Valenti, G.; Paolucci, F.; Francis, P.S.; Kanoufi, F.; Sojic, N. Bimodal Electrochemiluminescence Microscopy of Single Cells. Anal. Chem. 2023, 95, 7372–7378. [Google Scholar] [CrossRef]
- Ding, H.; Guo, W.; Su, B. Imaging Cell-Matrix Adhesions and Collective Migration of Living Cells by Electrochemiluminescence Microscopy. Angew. Chem. Int. Ed. 2020, 59, 449–456. [Google Scholar] [CrossRef]
- Ding, H.; Zhou, P.; Fu, W.; Ding, L.; Guo, W.; Su, B. Spatially Selective Imaging of Cell-Matrix and Cell-Cell Junctions by Electrochemiluminescence. Angew. Chem. Int. Ed. 2021, 60, 11769–11773. [Google Scholar] [CrossRef]
- Qin, X.; Jin, H.J.; Li, X.; Li, J.; Pan, J.B.; Wang, K.; Liu, S.; Xu, J.J.; Xia, X.H. Label-Free Electrochemiluminescence Imaging of Single-Cell Adhesions by Using Bipolar Nanoelectrode Array. Chemistry 2022, 28, e202103964. [Google Scholar] [CrossRef]
- Liu, G.; Jin, B.K.; Ma, C.; Chen, Z.; Zhu, J.J. Potential-Resolved Electrochemiluminescence Nanoprobes for Visual Apoptosis Evaluation at Single-Cell Level. Anal. Chem. 2019, 91, 6363–6370. [Google Scholar] [CrossRef] [PubMed]
- Ma, C.; Wang, M.X.; Wei, H.F.; Wu, S.; Zhang, J.R.; Zhu, J.J.; Chen, Z. Catalytic route electrochemiluminescence microscopy of cell membranes with nitrogen-doped carbon dots as nano-coreactants. Chem. Commun. 2021, 57, 2168–2171. [Google Scholar] [CrossRef] [PubMed]
- Han, D.; Goudeau, B.; Manojlovic, D.; Jiang, D.; Fang, D.; Sojic, N. Electrochemiluminescence Loss in Photobleaching. Angew. Chem. Int. Ed. 2021, 60, 7686–7690. [Google Scholar] [CrossRef] [PubMed]
- He, R.; Tang, H.; Jiang, D.; Chen, H.Y. Electrochemical Visualization of Intracellular Hydrogen Peroxide at Single Cells. Anal. Chem. 2016, 88, 2006–2009. [Google Scholar] [CrossRef] [PubMed]
- Wang, Y.; Jin, R.; Sojic, N.; Jiang, D.; Chen, H.Y. Intracellular Wireless Analysis of Single Cells by Bipolar Electrochemiluminescence Confined in a Nanopipette. Angew. Chem. Int. Ed. 2020, 59, 10416–10420. [Google Scholar] [CrossRef]
- Zhang, H.; Gao, W.; Liu, Y.; Sun, Y.; Jiang, Y.; Zhang, S. Electrochemiluminescence-Microscopy for microRNA Imaging in Single Cancer Cell Combined with Chemotherapy-Photothermal Therapy. Anal. Chem. 2019, 91, 12581–12586. [Google Scholar] [CrossRef] [PubMed]
- Ma, C.; Wu, S.; Zhou, Y.; Wei, H.F.; Zhang, J.; Chen, Z.; Zhu, J.J.; Lin, Y.; Zhu, W. Bio-Coreactant-Enhanced Electrochemiluminescence Microscopy of Intracellular Structure and Transport. Angew. Chem. Int. Ed. 2021, 60, 4907–4914. [Google Scholar] [CrossRef] [PubMed]
- Wang, Y.; Jiang, D.; Chen, H.Y. Wireless Electrochemical Visualization of Intracellular Antigens in Single Cells. CCS Chem. 2022, 4, 2221–2227. [Google Scholar] [CrossRef]
- Xu, J.; Huang, P.; Qin, Y.; Jiang, D.; Chen, H.Y. Analysis of Intracellular Glucose at Single Cells Using Electrochemiluminescence Imaging. Anal. Chem. 2016, 88, 4609–4612. [Google Scholar] [CrossRef]
- Li, L.; Chen, Y.; Zhu, J.J. Recent Advances in Electrochemiluminescence Analysis. Anal. Chem. 2017, 89, 358–371. [Google Scholar] [CrossRef]
- Bard, A.J. A life in electrochemistry. Annu. Rev. Anal. Chem. 2014, 7, 1–21. [Google Scholar] [CrossRef] [PubMed]
- Zhang, H.; Liu, Y.; Yao, M.; Han, W.; Zhang, S. Cathodic Electrochemiluminesence Microscopy for Imaging of Single Carbon Nanotube and Nucleolin at Single Tumor Cell. Anal. Chem. 2023, 95, 570–574. [Google Scholar] [CrossRef] [PubMed]
- Valenti, G.; Fiorani, A.; Li, H.; Sojic, N.; Paolucci, F. Essential Role of Electrode Materials in Electrochemiluminescence Applications. ChemElectroChem 2016, 3, 1990–1997. [Google Scholar] [CrossRef]
- Gao, W.; Liu, Y.; Zhang, H.; Wang, Z. Electrochemiluminescence Biosensor for Nucleolin Imaging in a Single Tumor Cell Combined with Synergetic Therapy of Tumor. ACS Sens. 2020, 5, 1216–1222. [Google Scholar] [CrossRef] [PubMed]
- Fu, Y.; Ma, Q. Recent developments in electrochemiluminescence nanosensors for cancer diagnosis applications. Nanoscale 2020, 12, 13879–13898. [Google Scholar] [CrossRef] [PubMed]
- Wu, K.; Zheng, Y.; Chen, R.; Zhou, Z.; Liu, S.; Shen, Y.; Zhang, Y. Advances in electrochemiluminescence luminophores based on small organic molecules for biosensing. Biosens. Bioelectron. 2023, 223, 115031. [Google Scholar] [CrossRef] [PubMed]
- Chen, M.M.; Xu, C.H.; Zhao, W.; Chen, H.Y.; Xu, J.J. Super-Resolution Electrogenerated Chemiluminescence Microscopy for Single-Nanocatalyst Imaging. J. Am. Chem. Soc. 2021, 143, 18511–18518. [Google Scholar] [CrossRef] [PubMed]
- Dong, J.; Lu, Y.; Xu, Y.; Chen, F.; Yang, J.; Chen, Y.; Feng, J. Direct imaging of single-molecule electrochemical reactions in solution. Nature 2021, 596, 244–249. [Google Scholar] [CrossRef]
- Zhao, T.; Zhou, Q.; Lv, Y.; Han, D.; Wu, K.; Zhao, L.; Shen, Y.; Liu, S.; Zhang, Y.J. Ultrafast Condensation of Carbon Nitride on Electrodes with Exceptional Boosted Photocurrent and Electrochemiluminescence. Angew. Chem. Int. Ed. 2020, 59, 1139–1143. [Google Scholar] [CrossRef]
- Gu, W.; Wang, H.; Jiao, L.; Wu, Y.; Chen, Y.; Hu, L.; Gong, J.; Du, D.; Zhu, C. Single-Atom Iron Boosts Electrochemiluminescence. Angew. Chem. Int. Ed. 2020, 59, 3534–3538. [Google Scholar] [CrossRef]
- Chen, M.M.; Zhao, W.; Zhu, M.J.; Li, X.L.; Xu, C.H.; Chen, H.Y.; Xu, J.J. Spatiotemporal imaging of electrocatalytic activity on single 2D gold nanoplates via electrogenerated chemiluminescence microscopy. Chem. Sci. 2019, 10, 4141–4147. [Google Scholar] [CrossRef]
- Guo, W.; Ding, H.; Zhou, P.; Wang, Y.; Su, B. Electrochemiluminescence Waveguide in Single Crystalline Molecular Wires. Angew. Chem. Int. Ed. 2020, 59, 6745–6749. [Google Scholar] [CrossRef]
- Gao, N.; Zeng, H.; Wang, X.; Zhang, Y.; Zhang, S.; Cui, R.; Zhang, M.; Mao, L. Graphdiyne: A New Carbon Allotrope for Electrochemiluminescence. Angew. Chem. Int. Ed. 2022, 61, e202204485. [Google Scholar] [CrossRef]
- Chinnadayyala, S.R.; Park, J.; Le, H.T.N.; Santhosh, M.; Kadam, A.N.; Cho, S. Recent advances in microfluidic paper-based electrochemiluminescence analytical devices for point-of-care testing applications. Biosens. Bioelectron. 2019, 126, 68–81. [Google Scholar] [CrossRef] [PubMed]
Figure 1.
ECL measurement of biomolecules at the single-cell level. (a) ECL analysis of active cholesterol at the single-cell level [43]. Copyright 2013 Anal Chem. (b) Schematic for co-detection of cholesterol and sphingomyelin in the plasma membrane at the single-cell level [44]. Copyright 2019 Anal Chem.
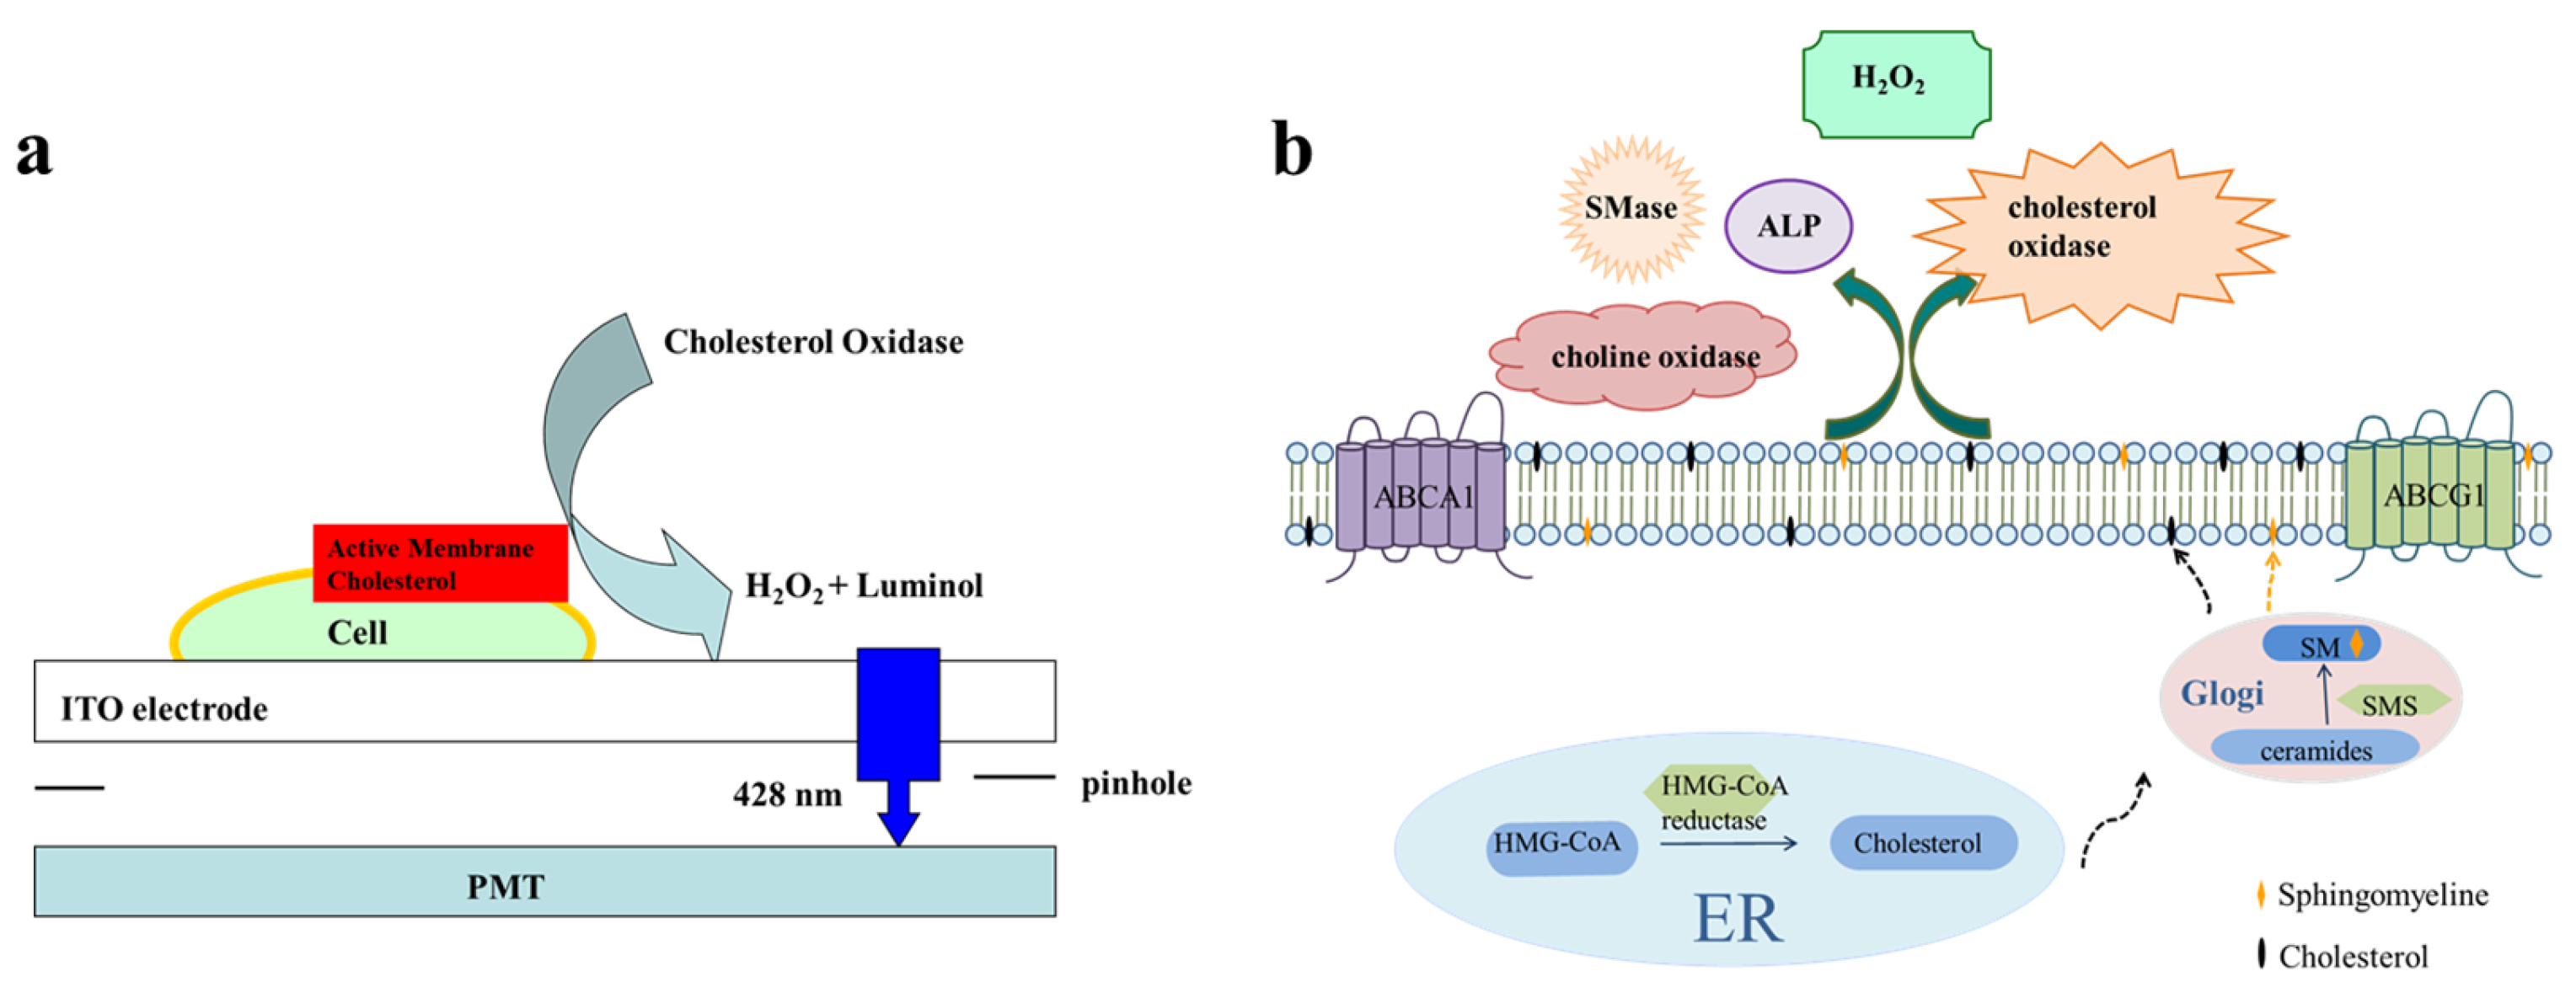
Figure 4.
(a) Schematic diagram of a BPE-ECL wireless device for the electrochemical visualization of the KDM1/LSD1 antigen in the nucleus [108]. Copyright 2022 CCS Chem. (b) Electrochemical luminescence imaging device and detection strategy for rapid analysis of intracellular glucose in single cells [109]. Copyright 2016 Anal Chem.
Disclaimer/Publisher’s Note: The statements, opinions and data contained in all publications are solely those of the individual author(s) and contributor(s) and not of MDPI and/or the editor(s). MDPI and/or the editor(s) disclaim responsibility for any injury to people or property resulting from any ideas, methods, instructions or products referred to in the content. |
© 2023 by the authors. Licensee MDPI, Basel, Switzerland. This article is an open access article distributed under the terms and conditions of the Creative Commons Attribution (CC BY) license (https://creativecommons.org/licenses/by/4.0/).
Share and Cite
MDPI and ACS Style
He, X.; Deng, Y.; Jiang, D.; Fang, D. Electrochemiluminescence Detection and Imaging of Biomolecules at the Single-Cell Level. Chemosensors 2023, 11, 538. https://doi.org/10.3390/chemosensors11100538
AMA Style
He X, Deng Y, Jiang D, Fang D. Electrochemiluminescence Detection and Imaging of Biomolecules at the Single-Cell Level. Chemosensors. 2023; 11(10):538. https://doi.org/10.3390/chemosensors11100538
Chicago/Turabian StyleHe, Xiaofan, Yufei Deng, Dechen Jiang, and Danjun Fang. 2023. "Electrochemiluminescence Detection and Imaging of Biomolecules at the Single-Cell Level" Chemosensors 11, no. 10: 538. https://doi.org/10.3390/chemosensors11100538
Note that from the first issue of 2016, this journal uses article numbers instead of page numbers. See further details here.