
Olfactory Evaluation of Geisha Coffee from Panama Using Electronic Nose
by
 , , , and
Nohely Santamaría
1,
Félix Meléndez
1 ,
,
Patricia Arroyo
1,
Patricia Calvo
2,
Francisco Sánchez
2,
Jesús Lozano
1,* and
and
Ramiro Sánchez
2,* 1
Industrial Engineering School, University of Extremadura, 06006 Badajoz, Spain
2
Centro de Investigaciones Científicas y Tecnológicas de Extremadura (CICYTEX), 06007 Badajoz, Spain
*
Authors to whom correspondence should be addressed.
Chemosensors 2023, 11(11), 559; https://doi.org/10.3390/chemosensors11110559
Submission received: 5 October 2023
/
Revised: 21 October 2023
/
Accepted: 27 October 2023
/
Published: 7 November 2023
(This article belongs to the Special Issue 10th Anniversary of Chemosensors—Section ‘Electrochemical Devices and Sensors’)
Abstract
:Geisha arabica coffee from Panama is featured in the world specialty coffee market. Its quality is assessed by sensory analysis with a panel of experts over several days. However, there is a risk of commercial fraud where cheaper coffees are mixed with pure specialty coffees. For these reasons, having an electronic nose (EN) device proves advantageous in supporting the cupping panel. It allows a greater number of fragrance and aroma analyses to be conducted per day, providing more objective results. In this study, an experimental EN equipped with a metal oxide semiconductor (MOS) gas sensor array was used. Olfactory evaluation of ground and infused Geisha coffee of different roast levels, brewing process, and purity was studied by EN, sensory analysis and chromatography. The sensory analysis perceived significant differences in fragrance and aromas in the light and dark roast levels of the samples. A total of 57 volatile organic compounds (VOC) were studied by gas chromatography. The EN data were analyzed chemometrically with principal component analysis (PCA) and predictive partial least squares (PLS). The data variances for two components were explained with values greater than 82%. The EN demonstrated its ability to differentiate the three levels of roasting, two production processes, and adulteration in the analyzed samples.
1. Introduction
The cultivation of coffee holds significant economic importance worldwide [1]. According to the World Coffee Organization (WCO), exports in 2021/22 were 66,534 thousand 60 kg bags [2]. Brazil has more than a third of this crop, thus being the largest producer and exporter globally, followed by Indonesia, Vietnam, and Colombia [3]. A total of 70% of world coffee production is grown on plots smaller than 10 hectares, typically operated as family businesses. This sector sustains the livelihoods of approximately 25 million people. However, the management of coffee, from cultivation to cup consumption of this drink, involves around 500 million people worldwide [4].
The two most cultivated species globally are Coffea arabica or arabica with 70% and Coffea canephora or robusta with 30% [5]. Robusta grows at low altitudes compared to arabica, is less susceptible to pests, has a higher caffeine level, and is the most commercialized [6]. This variety is marketed in soluble coffees, prepared espresso, or in blends with arabica [7]. However, the arabica variety is of higher quality, with very aromatic fragrances and more pleasant flavors [8]. Its greatest production occurs at high altitudes and tropical climates. Arabica varieties such as Catuai, Catimor, Typica, Bourbon, and Geisha are the most recognized. According to World Coffee Research, the Geisha variety is classified as a specialty coffee with exceptionally high quality at high altitudes [9].
In 2022, coffee exports in Panama increased by 6.6%, amounting to approximately 17.5 million dollars [10]. The humid tropical climate and the high altitudes typical of the districts of Renacimiento and Boquete are the perfect home for this coffee. Its cup stands out for its aromas of flowers, jasmine, and peach. These characteristics have placed it in the global specialty market, and in 2021 it was offered at prices of $2065.00 per pound on The Best of Panama platform [11]. Specialty coffee is defined by the Specialty Coffee Association (SCA) as those green coffee beans without primary defects (pits, sticks, blacks), uniform in size and drying, as well as possessing unique sensory attributes that are different from others [12]. The quality of the coffee is influenced by the variety, the post-harvest process, and the degree of roasting. Specific fragrances and notes are developed in the post-harvest process [13]. The three most common post-harvest methods are wet or washed, semi-wet, and dry or natural [14].
Currently, producers and consumers worldwide follow the SCA regulations to evaluate the quality of coffee, which is based on a sensory analysis focused on ten attributes: fragrance in dry ground coffee and infusion, aroma, sweetness, acidity, flavor, residual taste or aftertaste, body, balance, uniformity, clean cup, and general analysis [15,16]. An expert tasting panel carries out this rigorous analysis over several days to prevent tasters from olfactory fatigue. For this reason, it would be convenient to have an electronic device to support the tasting panel and quality control that allows a more significant number of analyses per day.
On the other hand, commercially, it is common to come across products that lack identification of their variety or origin or are marketed as pure when they are mixtures. The most frequent occurrence is the inclusion of portions of robusta, a less expensive variety, in products labeled as 100% arabica [17]. There are multiple studies to recognize the quality of coffee and fraud either using near-infrared spectrometers (NIR) or gas spectrometry [18,19]. However, they are very expensive procedures, and the results are obtained over a long period.
In the recent literature, proper abbreviations for electronic nose include EN [20]. The EN is a device whose analysis is objective, low-cost, and can perform a greater number of measurements without causing fatigue. It is also a useful tool to support the tasting panel and to detect possible adulterations in coffee.
The first EN was designed in 1980 by Persaud and Dodd, who developed an EN using semiconductor transducers. It was observed that they could discriminate a wide range of odors [21]. Over the years, many EN prototypes and sensors have been developed for multiple applications. ENs based on MOS gas sensors have been designed to classify and identify different volatile essential oils from edible herbs and fruits and avoid adulterated or counterfeit vegetables in commerce [22]. MOS sensors have also been applied to detect dangerous gases such as carbon monoxide, nitrogen dioxide, and hydrocarbons in hostile environments [23]. Sensors to detect ammonia have been applied in monitoring food spoilage [24]. The application of ENs in different fields will continue to grow thanks to its low cost, efficiency, and reproducibility of assays [21,25].
ENs have been used in applications for the pharmaceutical industry [20]. The EN used in this study is a prototype that has already obtained excellent results in the sensory analysis of table olives [26,27]. It has also been used in other environmental analysis applications [28]. However, the application of ENs presents some obstacles, such as sensor drift, variation in humidity and temperature conditions, interference from the matrix, or temporal validity of the calibration models.
In this work, the objective is to evaluate the capacity of the EN to classify ground and infused Panama Geisha coffee according to the post-harvest process and roasting level, as well as to examine its effectiveness in detecting the presence of small portions of commercial robusta coffee in ground Geisha specialty coffee.
2. Materials and Methods
The research was carried out in the Center for Scientific Research and Technologies of Extremadura (CICYTEX) laboratory in collaboration with the University of Extremadura (UEx).
2.1. Sample Preparation
A total of eight samples of Geisha coffee were supplied vacuum-packaged by the Panamanian Coffee Company T&T from its Mi Finquita farm, located 1650 m above sea level in the Chiriquí province of Panama, harvested in the 2022 season [24,29]. Prior to the analysis, samples were transported and stored at room temperature for a peri-od of 30 days. Once the packaging was opened, the samples were analyzed. Among these samples, four were Geisha coffees with Natural preparation, including one of green beans (N) and three of roasted beans at three different levels: light (NL), medium (NM), and dark (NO). The remaining four samples were of Washed Geisha coffee, comprising one of green beans (W) and three of roasted beans at three different levels: light (WL), medium (WM), and dark (WO). Figure 1 shows Geisha coffee samples. Additionally, a sample of robusta coffee was purchased in the store.
The preparation of the samples for analysis was carried out following the SCA Standard. An amount of 8.25 g of roasted coffee beans from each sample were weighed and ground with a mechanical grinder. To verify the size of the grind, a number 20 mesh was used. The fragrance of the ground coffee was evaluated for a period no longer than 15 min after grinding. To prepare the ground coffee infusion, 150 mL of water at 93 °C were added.
The ground samples of Natural Geisha (NL, NM, ND), Washed Geisha (WL, WM, WD), Natural Geisha infusion coffee (NLI, NMI, NDI), and Washed Geisha infusion coffee (WLI, WMI, WDI) were used for sensory, chromatographic, and EN analysis.
The adulterated coffee samples were prepared by adding robusta coffee to arabica, in the following proportions: 100% Natural Geisha (G100), 90% Natural Geisha and 10% robusta (G90R10), 80% Natural Geisha and 20% robusta (G80R20), 50% Natural Geisha and 50% robusta (G50R50), and 100% robusta (R100). All the samples have been analyzed and classified using the EN. The results obtained from the EN were correlated with gas chromatography and sensory analysis with a tasting panel.
2.2. Physical and Chemical Characteristics of Coffee
2.2.1. Green Coffee Beans
The green beans were characterized based on the Regulations of the Coffee Quality Analysis Protocol of the Regional Cooperative Program for the Technological Development and Modernization of Coffee Cultivation (PROMECAFE) in Central America [30].
Olfactory and Visual Examination
A 10 g sample of N and W was placed on a black tray. The sample was brought from the tray to the nose (as close as possible) and sniffed. Subsequently, normal odors (characteristic smell of green coffee) or abnormal odors (ferment, mold, humidity) were evaluated. The visual examination was carried out after the olfactory examination. It was performed under natural daylight or indirect artificial light, and the general appearance of the sample (color, botanical origin, uniformity, defects) was evaluated.
Humidity
A 10 g sample of N and W was placed in a container with a known mass. Using an analytical balance, the sample plus the container was weighed. The sample was then placed into an oven maintained at a constant temperature of 105 °C for a period of 16 ± 0.5 h. The sample was then cooled to room temperature in a desiccator and weighed again. Using Equation (1), the percentage of humidity was calculated, which can be interpreted as moisture content. This procedure was performed in triplicate.
where m0 is the mass of the container, m1 is the mass of the container plus the sample before drying, and m2 is the mass of the container plus the sample after drying.
H = [(m1 − m2)/(m1 − m0)] 100
Apparent Density
An analytical balance and a container with known mass and volume were utilized in this process. The container was filled with coffee until it overflows. With the help of a leveler, the excess was removed. The sample contained in the container was weighed. Subsequently, the apparent density was calculated using Equation (2). This procedure was performed in triplicate.
where m1 is the mass of the empty container, m2 is the mass of the container with the sample, and V is the volume of the container.
ρ = (m1−m2)/V
2.2.2. Coffee Infusion
The pH measurements of the coffee infusions were carried out in triplicate using a pH-meter (HACH SensION+ PH3 meter, Barcelona, Spain) following the AOAC International Regulations. Three buffer solutions were used for the initial calibration of the equipment: 4.0, 7.0, and 9.0 [31].
The Brix Degree (°Brix) measurements of the coffee infusions were carried out in triplicate using a refactormeter (POCKET REFACTORMETER PAL-1, Saitama, Japan) following the AOAC International Regulations. Distilled water solutions were used as a baseline [32].
2.3. Chromatographic Analysis
Liquid chromatography analyses were used to determine caffeine content, and gas chromatography to determine the profile of VOC.
The caffeine determination was carried out according to DIN 20481 [26,33]. A 0.5 g sample was weighed and then diluted in 200 mL of water at 90 °C, followed by a subsequent 1 to 10 dilution. The calibration line used was within the range of 0.25 to 20 ppm. Samples were analyzed on an Agilent 1100 series HPLC system (Hewlett-Packard, Waldbronn, Germany) equipped with a diode array detector (DAD). The chromatography parameters consisted of an Isocratic H2O analysis: MeOH 75:25, flow 0.5 mL/min, injection volume 25 µL, column temperature 30 °C, Zorbax Eclipse XDB-C18 column of 4.6 × 150 mm and 5 µm pore size, DAD detection: 273 nm.
The volatile profile of 2 g of each ground sample was determined. In addition, a sample of the light roast of Geisha Natural and another of Washed in coffee infusion (0.55 g in 10 mL of hot water) were determined. The volatile compounds were analyzed in triplicate with a Bruker Scion 456-GC triple quadrupole gas chromatograph (Bruker, Falkenried, Hamburg, Germany). The chromatographic technique with SPME was used [32,34], using a 1 cm long fiber and a 65 μm film of polydimethylsiloxane/divinylbenzene (PDMS/DVD)) with Stable Flex. An amount of 2 g of ground and infused sample was incubated at 60 °C for 10 min. The fiber was then exposed to the headspace for 60 min. Subsequently, the volatiles were thermally desorbed at the injection port for 15 min at 250 °C. The compounds were separated on a 30 m, 0.25 mm, 0.25 µm VF-5MS column. The analysis began at 45 °C for 1 min, moving to 200 °C at a rate of 5 °C/min to finish at 250 °C at 20 °C/min, maintaining this last temperature for 5 min. The recording was carried out with a full scan and the compounds were identified by comparing the mass spectra obtained with the references from the NIST library.
2.4. Sensory Evaluation
The sensory analysis of the coffee samples was carried out by a tasting panel made according to the SCA protocol [16]. Participants rated 7 sensory attributes (fragrance, aroma, flavor, aftertaste, acidity, body, sweetness) on a scale of 6 to 10. This analysis was carried out by a panel of eight expert tasters at the CICYTEX. The tasting area was kept at a temperature of 25 °C and in a quiet environment to ensure the concentration of the tasters. The olfactory pattern is defined by the fragrance and aroma attributes. The fragrance (dry) of the samples was evaluated within 15 min after grinding, while the aroma (brew) was assessed once boiling water was added. The infusion was then analyzed for flavor, residual flavor, acidity, body and sweetness. The perceived descriptors were used to score these attributes. Also, some samples of Geisha coffee adulterated with robusta coffee were evaluated.
2.5. Electronic Nose Analysis
A low-cost portable EN developed by the UEx was used to evaluate the coffee samples. This device has previously been used for analyzing air quality and table olives [23,28,35]. The EN comprises four metal oxide semiconductors (MOS) gas sensors: (1) BM680 (Bosch Sensortech GmbH, Reutlingen, Germany), (2) SGP30 (Sensirion AG, Stäfa, Switzerland), (3) CCS811 (ScioSense B.V., Eindhoven, The Netherlands), (4) iAQ-Core (ScioSense, Eindhoven, The Netherlands). These sensors emit a total of 11 signals, shown in Table 1.
The EN sensors were placed in contact with the headspace of the samples in the same glasses in which the tasting was carried out, following the same recommendations of the SCA for the sensory analysis. In this way, the EN was used under the same conditions as the tasting panel. The EN was configured to perform adsorption (or sampling) and desorption (or cleanup) phases, running five measurement cycles, each lasting 60 s. Five measurement cycles were executed for each sample at a temperature of 25 °C to analyze ground samples. Therefore, each data acquisition cycle involved two stages. First, 8.25 g of the sample was placed in a glass, and the EN was positioned over the headspace of the coffee samples. Then, the EN was placed over an empty glass to obtain baseline air readings. This procedure was repeated for all the ground coffee samples, including those with different roasts and adulterated coffee samples. This procedure was repeated for all the ground coffee samples, including those with different roasts and adulterated coffee samples. When analyzing infused coffee samples, the same procedure was employed. However, the temperature of the water used for infusion (93 °C) was allowed to drop to 40 °C to mitigate the impact of steam on the measurements. This temperature was maintained using a heating block.
Equation (3) was employed to characterize the data acquired from the sensors.
where Xmax represents average of the last 5 values during exposure to the reference gas (clean air) and Xmin represents average of the last 5 values during exposure to the coffee headspace. This calculation resulted in a vector comprising 11 rows, each corresponding to the readings of the individual sensors. The microprocessor embedded within the EN reads the signals from each sensor and transmits them to a Smartphone via Bluetooth using an application developed by the UEx. Subsequently, these readings are exported to a computer for further processing.
[(Xmax − Xmin) 100] − 1
2.6. Statistical and Multivariate Analysis of the Data
A one-way ANOVA was conducted for the statistical analysis of the physicochemical and sensory analysis results, followed by Tukey’s post hoc test. A Student’s t-test was also employed to determine statistically significant differences between two distinct samples. The significance level was set at p < 0.05. The software utilized for these analyses was SPSS 18.0 (SPSS Inc., Chicago, IL, USA). Data were presented as mean and standard deviation.
To analyze the results obtained with the EN, unsupervised exploratory analysis tools such as PCA were used to reduce data dimensionality and generate graphs based on two principal components. Additionally, PLS analysis was utilized to establish relationships between the results obtained from the tasting panel and those obtained from the EN. For these tasks, the Matlab R2023a Software version 9.14.0.2206163 (The Mathworks Inc. Natick, MA, USA) with the PLS_Toolbox 8.2.1 (Eigenvector Research Inc., Wenatchee, WA, USA) has been used.
3. Results and Discussion
3.1. Physical and Chemical Characteristics of Coffee
The physical characteristics of green beans are quality parameters evaluated by PROMECAFE when purchasing or selling green coffee. The results of the physical and chemical characteristics of Geisha coffee from Panama are shown in Table 2.
Visually, the green beans of Geisha coffee did not present defects, such as black beans, dried cherries, broken beans, sticks, or stones. These qualities are indicative of excellent coffee quality [36]. The Geisha Natural green coffee beans have a yellowish color and an aroma of fresh green coffee with an herbaceous touch, while the Geisha Washed coffee beans have a grayish color and a very herbaceous aroma. The maximum humidity that a dry green coffee should have is 12% to avoid fermentation [37]. The humidity is lower than this threshold for both post-harvest processes (Natural and Washed). Apparent density is an important parameter for coffee packaging, storage, research, and transportation.
The pH and °Brix values did not present significant differences (p > 0.05) for the different roasting levels of the two preparations. Significant differences (p < 0.05) were found in the Brix of different preparations, specifically in ND and WD.
3.2. Determination of Caffeine and Volatile Compounds in Coffee by Chromatography
Caffeine is a methylxanthine that contributes to the bitter taste of coffee and whose quantity varies depending on the species of coffee [38]. A liquid chromatographic analysis was carried out for the determination of caffeine in samples of Geisha specialty coffee roasted in natural and washed processing.
This caffeine determination yielded similar values for both post-harvest processing methods (dry and wet) of Geisha coffee. The results are shown in Table 3.
Gas chromatography was used to identify VOC in dry and infused samples. The identification of the VOC of specialty Geisha ground coffee with three roasting levels and two elaboration processes, natural and washed, as well as their respective infusions, was carried out. On the other hand, the VOC of a commercial roasted ground coffee of the robusta variety were identified to compare its volatile profile with the specialty Geisha coffee. The results obtained are shown in Table 4.
A total of 57 different VOC were identified among all the analyzed samples. Common compounds found in all of them included Acetic acid, 2-Furancarboxaldehyde (with the characteristic odors of toast, caramel, and coffee), 2-Furanmethanol, acetate (with a fruity banana odor), and 1H-Pyrrole, 1-(2-furanylmethyl)- (with vegetable, potato, or mushroom odors). Acetic acid is noteworthy in coffee; besides its characteristic vinegar taste, at low levels, it can give rise to pleasant lime flavors, and at high concentrations, it emits a fermentative odor.
However, some compounds were only found in the commercial robusta coffee, contributing distinctive aromas. These compounds include 2,3-Butanediol (with creamy and buttery aromas), Phenol, 2-methoxy- and 4-ethyl guaiacol (imparting smoky and woody odors), Pyrazine, (1-methylethenyl)- (with chocolate and nutty notes), 5H-5-Methyl-6,7-dihydrocyclopentapyrazine (evoking the aroma of roasted coffee beans), Pyrazine, 3,5-diethyl-2-methyl- (with a green nutty scent), Pyridine (featuring an ammoniacal and sour fishy aroma), and Indole (exhibiting a fecal and musty odor). Among these mentioned compounds, some have unpleasant aromas that are not found in the specialty Geisha coffee; therefore, their presence and aromas could raise doubts about the purity of the analyzed Geisha coffee. The results of the VOC of Geisha coffee are shown in Figure 2.
The presence of acidic compounds in ground coffee diminishes as the roast level increases, with a higher roast level resulting in fewer acids. Additionally, depending on the post-harvest treatment, their quantity is higher in natural Geisha than in washed Geisha. Furthermore, the robusta variety contains fewer acidic compounds than the arabica variety. Once the coffee is brewed, these quantities decrease drastically in the headspace, possibly due to the dilution effect of the water. Although these compounds are associated with sour, rancid aromas and vinegar or cheese odors, in small quantities they give Geisha coffee aromas of fresh, lime-like coffee.
Regarding aldehydes, they are compounds of intermediate polarity and are only found in infused Geisha coffee, with chocolate, nutty, and spicy aromas. However, the higher polarity group of alcohols only appears in ground coffee with herbal fragrances, possibly because they remain soluble in water and evaporate less.
The furans in Geisha coffee increase with the degree of roasting and contribute aromas of toasted bread, almonds, walnuts, and caramel, among others. These results agree with authors who stated that furans are the major compounds in roasted coffee [39]. With respect to post-harvest treatment, they are found in greater proportion in washed Geisha than in natural coffee. These volatiles also appear in robusta coffee and, in much smaller quantities, in Geisha infusion.
Ketones with sweet, herbal, floral, and licorice-like aromas, as well as phenols with medicinal, woody, and smoky scents, do not appear to be significantly influenced by post-harvest treatment or roasting degree. Instead, their presence depends on the coffee variety, with notably higher levels in the robusta variety compared to arabica Geisha. Ketones such as phenols only appear in ground coffee and are not present when Geisha coffee is prepared as an infusion.
Pyrazines, which contribute roasted, chocolate, and sometimes musty and potato-like aromas, are significantly influenced by the post-harvest process, with notably higher levels in the dry process. They are also influenced to a lesser degree by the coffee variety or degree of roasting. These compounds do not appear in the infusion of arabica coffee.
The pyridine compound with sour fish and ammoniacal aromas is exclusive to the robusta coffee sample and is not detected in the studied arabica variety, whether in ground or infusion. Therefore, it can be regarded as a key compound for identifying the presence of robusta coffee mixed with arabica specialty coffee.
On the other hand, the number of pyrroles with burnt, smoked, and cooked potato aromas is not modified by variety, post-harvest treatment, or roasting degree. However, their quantity decreases greatly in infused coffee.
Terpenes with floral, herbal, citrus, and fresh aromas appear in much more significant quantities in Geisha coffee infusions and do not change in quantity depending on the processing or degree of roasting. These compounds are not found in the robusta variety.
3.3. Sensory Analysis of Coffee
Sensory analysis of ground and brewed coffee was carried out following the SCA protocol. The attributes evaluated included fragrance, aroma, flavor, aftertaste, residual flavor, acidity, body, and sweetness. Perceived descriptors were used to score these attributes. Most descriptors were related to the fragrance and aroma of Geisha Natural coffee: NL fragrance—caramel, barley, lemon, and NL aroma—honey, chocolate cereal; for the NM fragrance, fruity, biscuit and malt, and NM aroma—red fruits, cereal, citrus; ND fragrance—toasted bread and chocolate; and ND aroma—roasted, biscuit, citrus. In the case of Geisha Washed coffee, the descriptors identified were WL fragrance—caramel, barley, cereal, and WL aroma—roasted, malt, citrus; WM fragrance—bread, malt, lemon, and WM aroma—roasted bread, chocolate;, WD fragrance—fruity, cereal, biscuit, and WD aroma-roasted, floral, caramel.
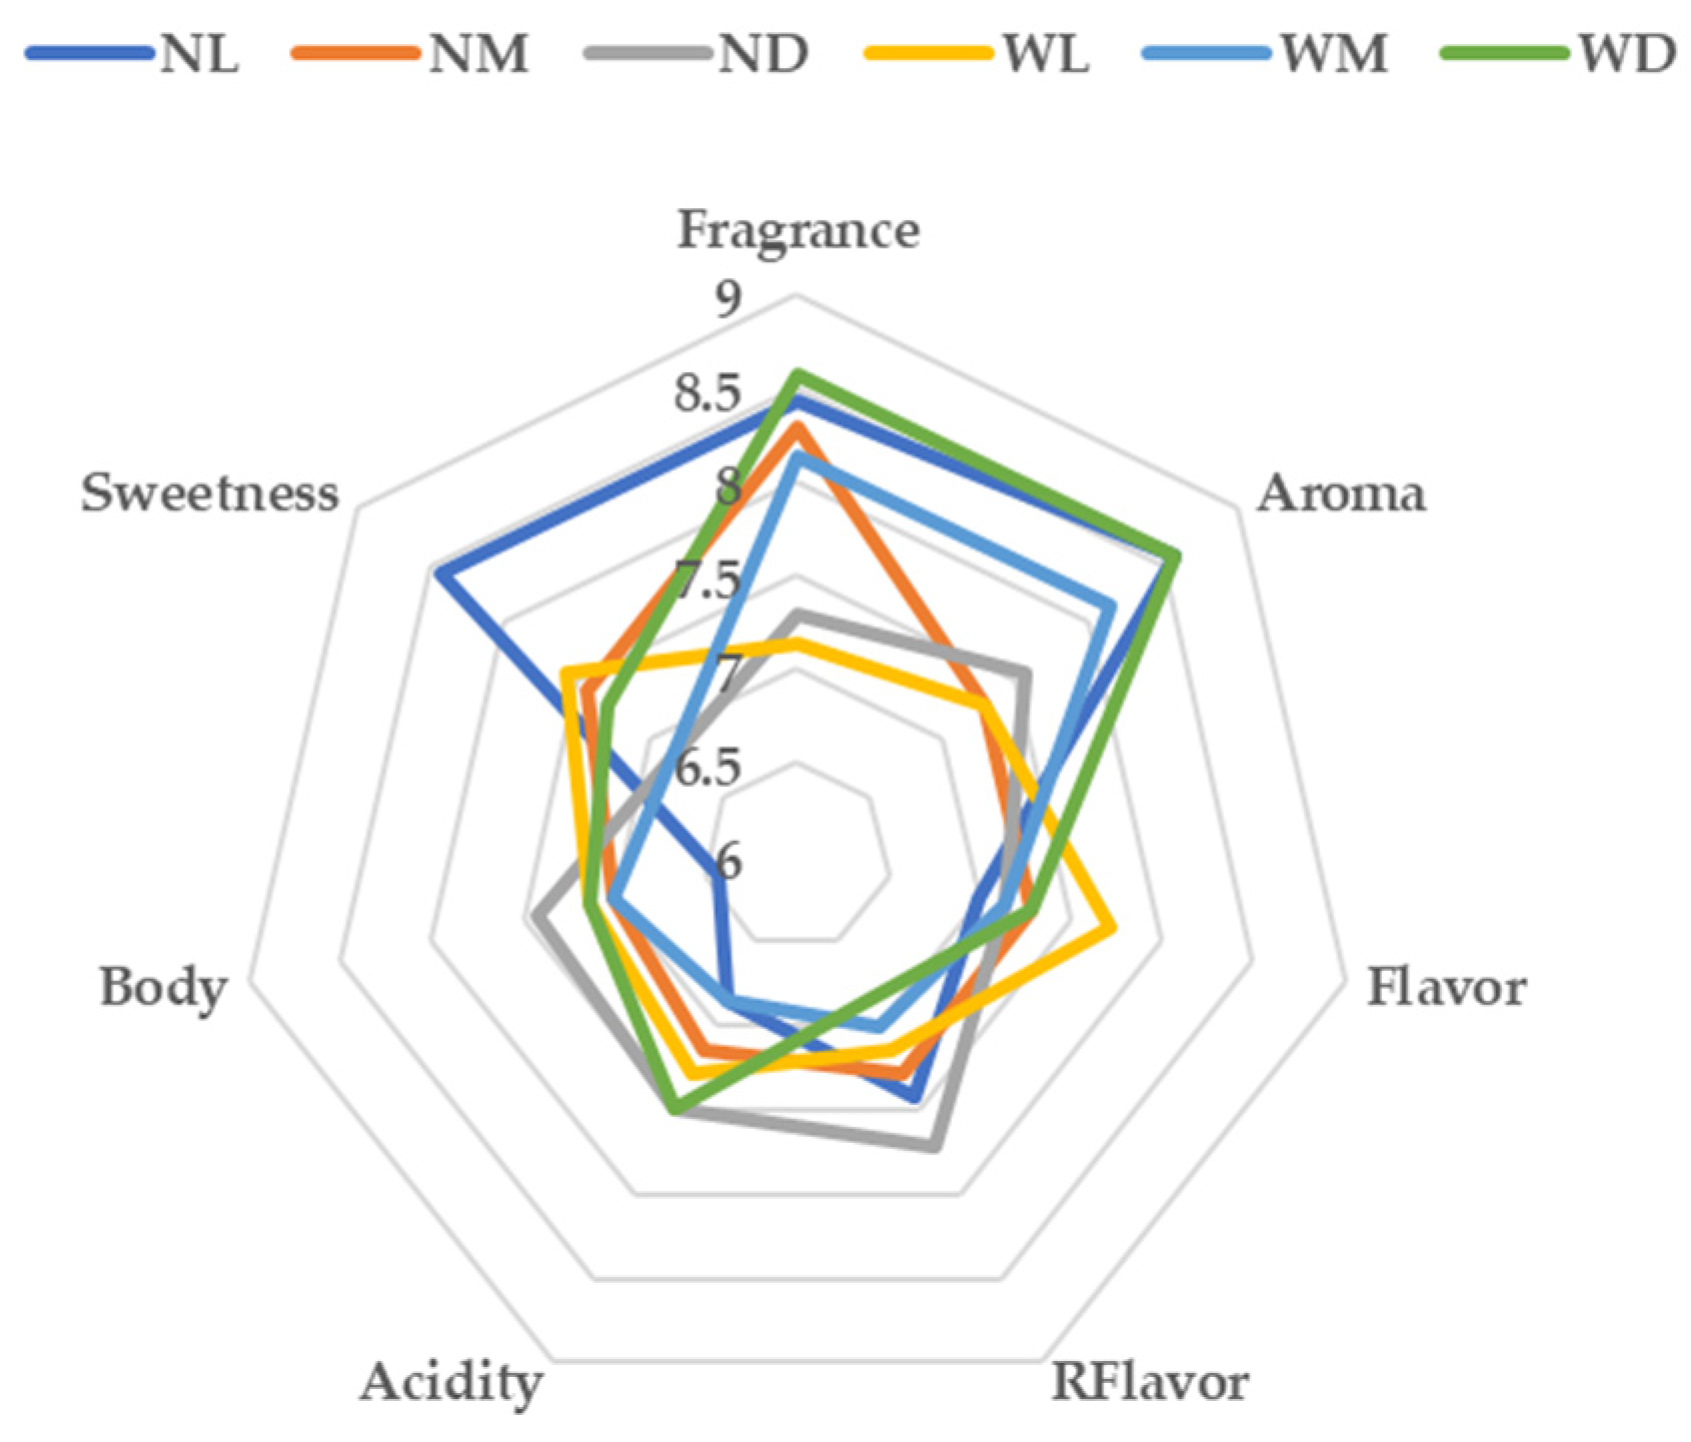
The results of the sensory analysis of Geisha Natural and Washed coffee at the three roasting levels are shown graphically in Figure 3.
The graph shows different sensory profiles for the six Geisha coffee samples. The highest acidity values correspond to the dark roasts. In terms of flavor, the highest score was for the WL, while the values were similar for the rest of the samples. Regarding residual flavor, the highest score was obtained for ND coffee. The score for fragrance and aroma was highest for the NC and WD samples.
To determine the significant differences between roasting levels within the same processing, a one-factor ANOVA was applied. To see the significant differences between roasting levels within each type of processing, a Student’s t-test was used (Table 5).
When comparing the three roast levels of Natural coffee, there were significant differences in fragrance between light and dark roasts, but not between light and medium roast levels. Regarding aroma, significant differences were found between light roast and medium and dark roasts, but not between medium and dark roasts. Flavor, residual flavor, and body did not exhibit significant differences. For acidity and sweetness, there were only significant differences between light and dark roast.
For the three roast levels of Washed coffee, significant differences were found in fragrance between light roast and medium and dark roast, but not between medium and dark roast. For aroma, there are significant differences between light and dark roast. There are no significant differences for the other attributes flavor, residual flavor, acidity, body, and sweetness.
If we compare the three roasting levels of the two processes, Natural and Washed, the only significant differences between the two processes are in fragrance between light and dark roasts and in aroma at all three levels. There were no significant differences between flavor, residual flavor, acidity, body, and sweetness.
In addition, sensory analysis of the fragrance of pure samples of specialty Geisha coffee and commercial robusta coffee was conducted. Furthermore, Geisha coffee was adulterated with 10%, 20%, and 50% robusta coffee to assess whether the cupping panel and EN could differentiate between them. The ANOVA results of the sensory analysis of pure and blended samples are shown in Table 6.
In the sensory analysis, the ANOVA results for fragrance show no significant difference between N100 and N90R10, but there are significant differences with the other proportions. Therefore, the cupping panel was only able to detect the addition of 20% or more coffee to Geisha coffee.
Robusta coffee is known for its very strong fragrance. However, it may not be readily perceived when blended in small concentrations. Nevertheless, as the concentration of robusta coffee increases, its strong fragrance can overpower that of Geisha Natural, especially in the 50% blend.
3.4. Evaluation of the Olfactory Pattern of Coffee with an Electronic Nose
The olfactory pattern was evaluated by the EN using three samples each of light, medium, and dark roasted natural dry-ground Geisha coffee, as well as three samples each of light, medium, and dark roasted wet-ground or washed Geisha coffee. Additionally, the olfactory pattern of these infused coffee samples was evaluated. The data and graphs of the sensor signals whose processed data give rise to the graphs in Figure 4, Figure 5, Figure 6 and Figure 7 have been added to the Supplementary Materials section.
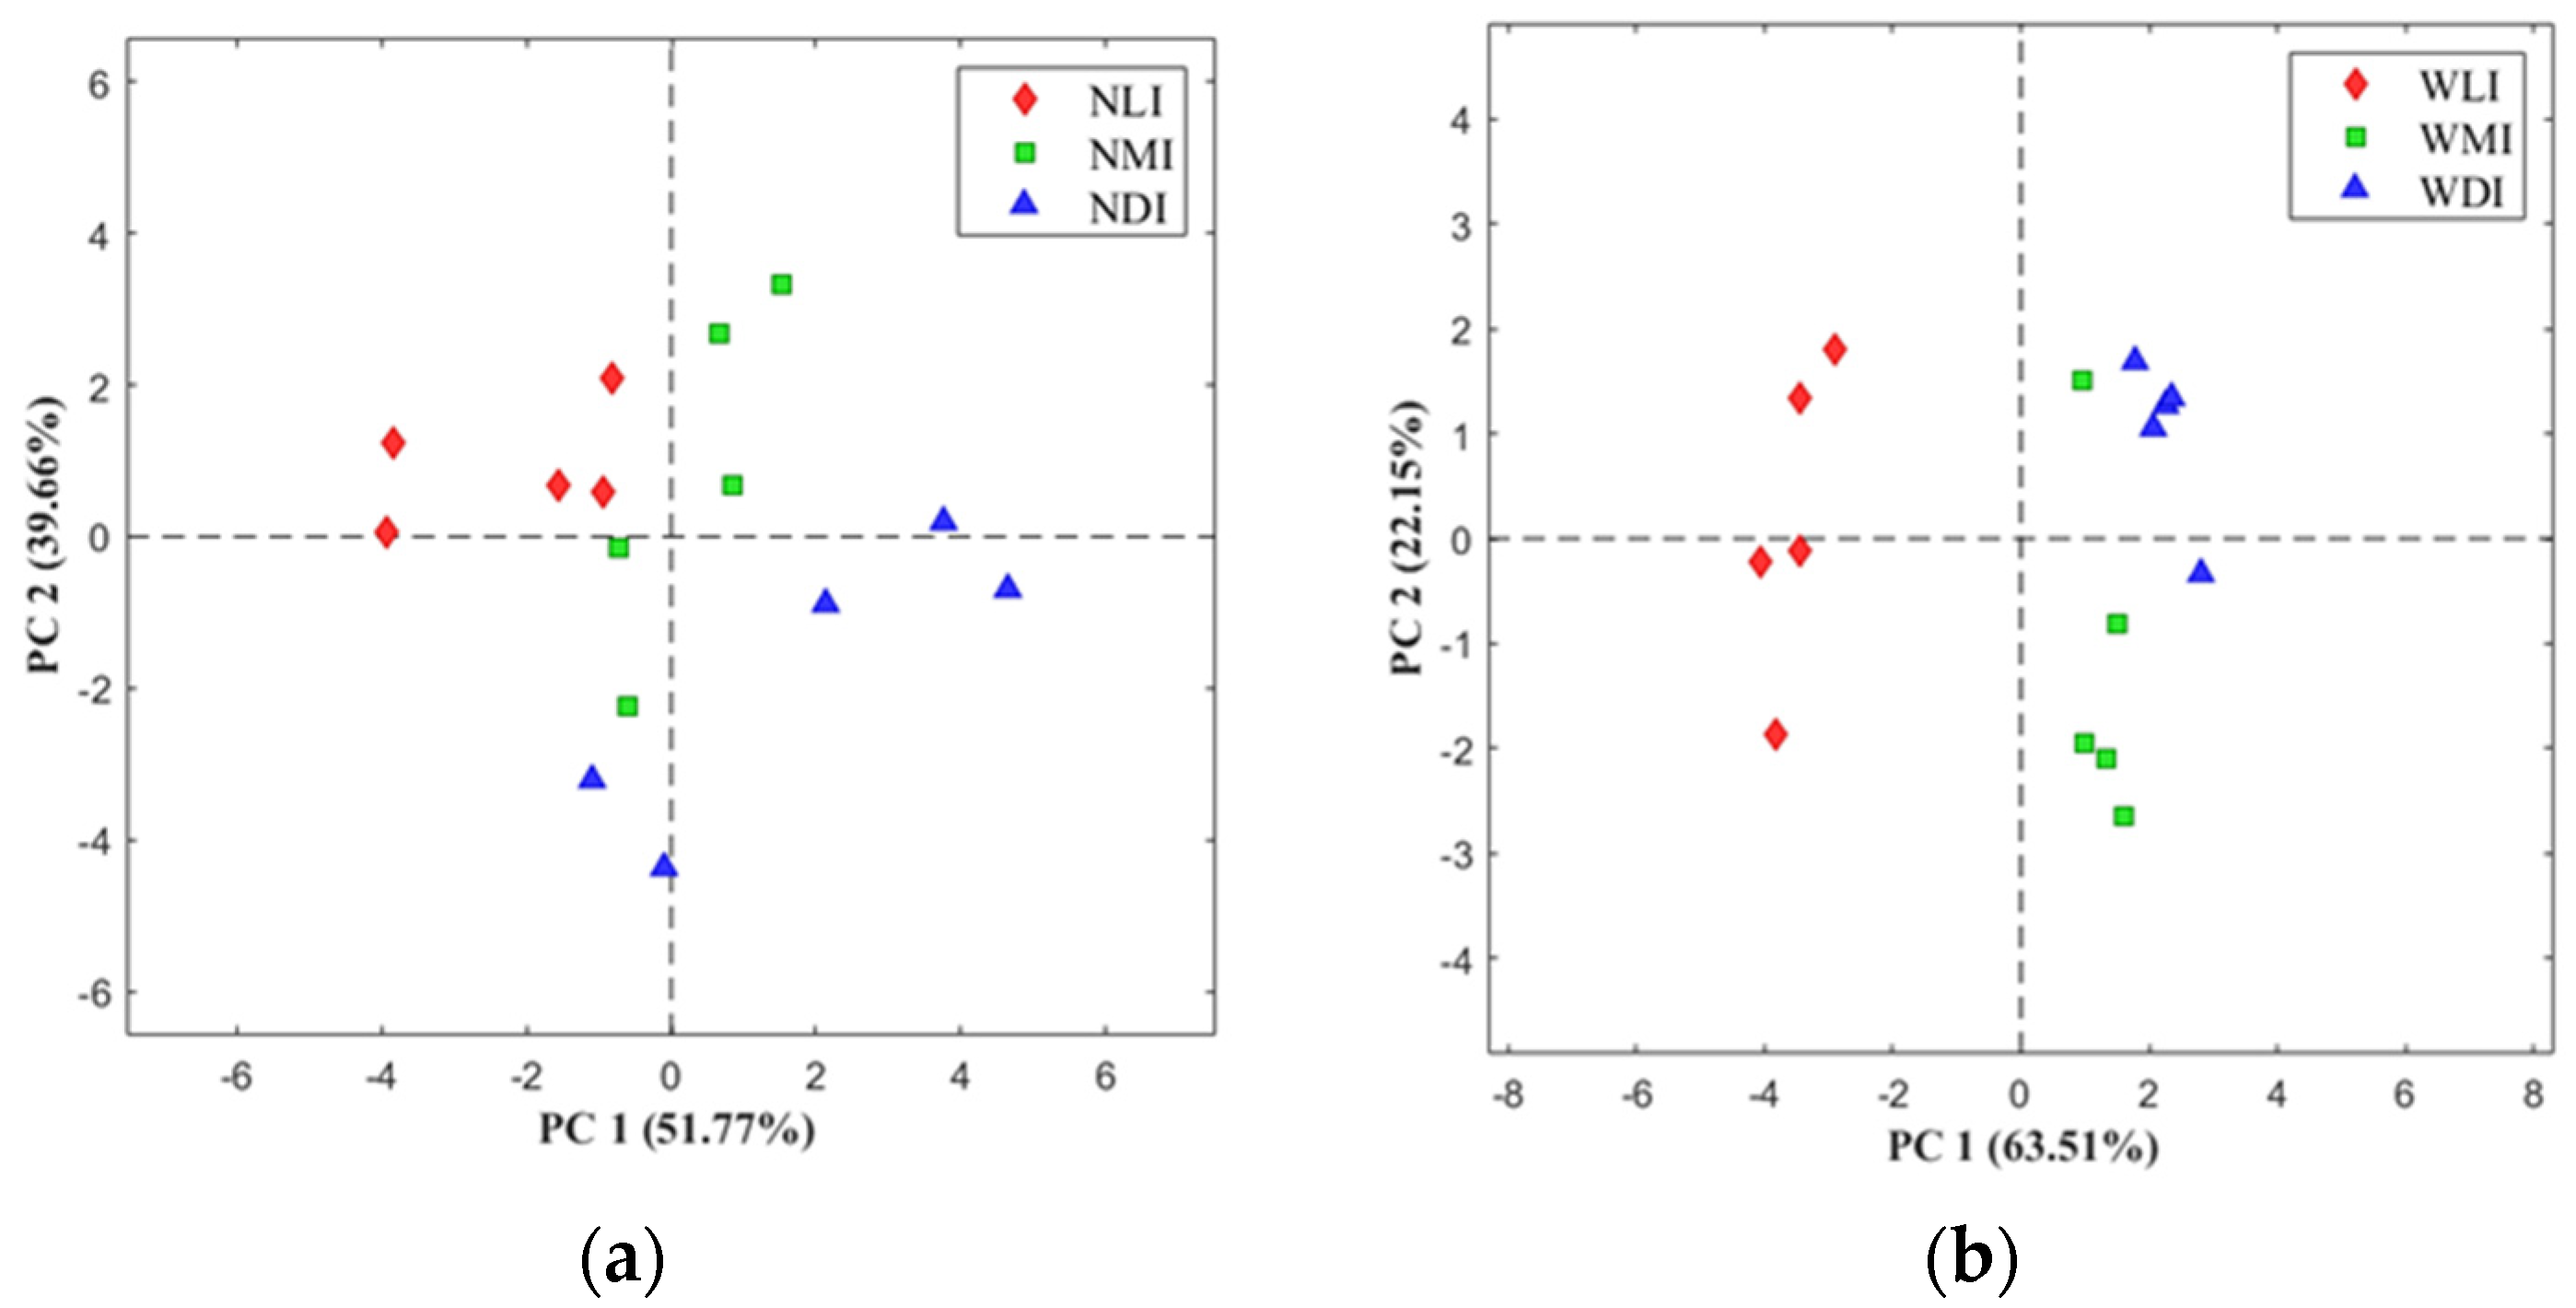
The data obtained from the EN measurements were subjected to exploratory principal component analysis to group the samples according to their olfactory pattern for different roast levels. Figure 4 shows the graphs of the first two principal components. Graphs (a) and (b) correspond to Natural and Washed roasted ground coffee.
The results showed that the EN could differentiate three groups of coffee with good resolution in separation according to their roast level, with the medium roast in the center. In (a) and (b), the total variance of the data was explained by 85.8% and 90.1%, respectively.
In Figure 5, graphs (a) and (b) correspond to infused coffee. The PCA results for the brewed coffee, like those for ground coffee, exhibited good resolution, with data from the various coffee roasts clustering similarly. In (a) and (b), the total variance of the data was explained by 91.43% and 85.66%, respectively.
On the other hand, Figure 6 shows the data according to the type of brewing. A clear resolution is observed for Geisha Natural and Washed coffees. Graph (a) shows the values for ground coffee, and graph (b) for brewed coffee. The first two principal components explain 82.9% and 94.9% of the total variance of the data in (a) and (b), respectively.
In addition, the olfactory pattern of blended arabica and robusta coffee was evaluated with the EN. Figure 7 shows in graph (a) a sample of specialty Geisha coffee to which different portions of a commercial robusta coffee were added: 0% (G100), 10% (G90R10), 20% (G80R20), 50% (G50R50), and pure robusta (R100). It can be seen how the pure Geisha coffee, depicted in green, forms an isolated group that is distinct from the robusta variety coffees. The robusta coffee variety is also clustered separately, represented in red, and is closely situated to the 50% blend, represented by the pink color.
The same samples were also subjected to a PLS analysis to evaluate the prediction of adulteration of Geisha coffee with robusta portions with the EN. Figure 7b shows a good correlation between the actual values obtained from the cupping panel and the values predicted by the EN.
Furthermore, Figure 8 shows a radial graph where the different olfactory patterns can be observed according to the proportions of the coffee blends.
The sensors exhibited the highest response amplitudes for Geisha coffee, depicted in green. In contrast, for robusta coffee, the responses were the lowest among most of the sensors. The blends displayed intermediate response amplitudes between the two coffee varieties.
4. Discussion
Physical characteristics (Table 2) such as humidity, density, odor, and color are crucial factors for coffee industries when procuring green beans, ensuring they meet minimum quality standards [30]. Excess moisture and temperature changes can lead to fungal growth during storage or transportation, resulting in defects and reduced quality [40]. Bean uniformity is essential for consistent roasting, as smaller beans roast more quickly, and larger beans take longer. Therefore, uniformity enables efficient control of the roasting process. Visual and olfactory examination of the green beans makes it possible to find various defects and evaluate production quality. In this case, Natural and Washed Geisha beans, which also have different smells, can be clearly identified.
The evaluated chemical parameters (Table 1) such as pH indicate the degree of acidity the infusion has. Previous studies suggest that coffees subjected to the Washed (fermented) post-harvest process tend to exhibit lower pH levels than Natural (non-fermented or dry) coffees. This difference can be attributed to the microorganisms present during fermentation, which can act on the reducing and non-reducing sugars found in coffee mucilage, producing acids like butyric, lactic, and acetic acids [41]. There are different types of controlled fermentation used by producers in which yeasts are used to degrade the coffee mucilage without affecting the quality of the bean. However, the pH of coffee is also influenced by factors such as the coffee variety and the geographical location of production [42]. The measurement of °Brix is an indication of the concentration of soluble solids; most of these soluble solids are sucrose. Brix is a measurement considered by coffee growers as an indicator of the degree of ripeness of the cherry trees and used to harvest at the right time. For crops grown at altitudes higher than 1500 m above sea level, the Brix of the cherry tree must be in the range of 16 to 19 to obtain excellent cup quality. At lower altitudes of around 1000 m above sea level, a Brix of 18.5 to 20 is sought. In regions with lower altitudes, cherry trees ripen more slowly to enhance acidity levels [43]. Additionally, in some coffee varieties, Brix are related to increased sensory attributes such as aroma intensity, body, flavor, roasted flavor, bitterness, or astringency [44].
The results for caffeine in the Geisha coffee analyzed (Table 3) were 0.8% for dry and wet processing. These results are similar to those obtained by other authors who quantified caffeine levels in commercial arabica coffees from Panama, which range between 0.9% and 1.3% [36]. On the other hand, studies on arabica coffee of Mexican origin reported a caffeine content of 0.4% and found no significant differences between different roasting levels [37]. Therefore, it can be said that the caffeine levels obtained for Geisha coffee do not vary depending on the post-harvest process and, according to the literature, do not depend on the roasting level but on the origin of the arabica variety.
The fragrance and aromas of the coffee will depend on the variety, the post-harvest treatment, the degree of roasting, and whether it is dry-ground or washed. The composition of furans, pyrazines, aldehydes, ketones, phenolic compounds, pyrroles, alcohols, and pyridines found in roasted coffee influence its aroma [39].
The profile of VOC of ground coffee found in Geisha ground coffee changes when it comes into contact with hot water. This fact has been contrasted in the literature, which also indicated that the most polar aromas are found in the infusion [45]. While some compounds like 2-Furancarboxaldehyde, 5-methyl-, 2-furanmethanol, 1H-Pyrrole acetate, 1-(2-furanylmethyl)-, Ethanone, 1-(2-hydroxy-5-methylphenyl)-, and Acetic acid are present in both ground and brewed coffee volatiles, new compounds from the terpenes group emerge in the infusion that were not originally present in the ground coffee.
The profile of VOC will depend on whether the coffee is arabica or robusta and whether it is specialty or commercial. Geisha specialty coffee from Panama does not contain volatiles such as pyridine with an ammonia and fishy acid aroma and indole with a fecal and musty odor, which were found in the commercial robusta variety analyzed.
Pyrazines are mainly produced from the Maillard reaction, caramelization, Strecker degradation, and pyrolysis during roasting [46]. The levels of pyrazines that contribute to roasted, chocolate, as well as moldy, fermented coffee, and potato aromas are significantly higher in the Natural process than in the Washed process.
Different coffee varieties, geographical origins, or post-harvest treatments produce different aromas even when roasted under identical conditions [2]. The fragrance and aroma of coffee are mainly generated during roasting through complex reactions that form hundreds of VOC [1]. However, when analyzing the Geisha coffee, the scores may not give significant differences between coffees. Nevertheless, the various perceived descriptors of these attributes can make a difference, especially considering that all samples are of the same variety and from the same harvesting area [14,46]. The tasting panel found it difficult to differentiate fragrance, aroma, and intermediate roasts within the same brew. However, they were able to distinguish the aroma of the same roast in the Natural and Washed brew. On the other hand, the cupping panel was able to differentiate the adulteration of specialty Geisha coffee with 20% commercial robusta coffee.
In the literature, studies can be found on the identification of adulterations in roasted coffee using gas chromatography coupled to mass spectrometry [47], as well as the use of differential EN systems with two cameras with identical sensors for the detection of counterfeiting [48]. In our study, it was possible to identify the different proportions of robusta coffee added to specialty Geisha coffee with a nose with a single array of MOS sensors. The EN alternates between adsorption cycles, where it measures the odor of the sample, and desorption cycles, where it cleans with ambient filtered air.
One of the obstacles to the use of ENs has to do with the effects of drift due to the alterations that the sensors may suffer during the operation of the sensor and the variations of environmental conditions [20]. Furthermore, the relative humidity of the brewed coffee could substantially affect the composition of the gas phase in both quantitative and qualitative terms. With respect to the short-term drift of the EN used, it turns out to be low since it has new intelligent technology sensors compared to the drift of analog sensors, which are integrated with the signal conditioning circuit, thus reducing noise effects. In addition, these sensors incorporate algorithms from the manufacturers themselves to correct for temperature and humidity. The architecture of the EN used is explained in the article [23,28] where it can be observed in the PCAs that this short-term drift is low.
Electronic noses are increasingly implemented as support of traditional sensory analysis techniques. ENs have advantages in the speed of analysis and cost reduction. However, they are in an early stage of development and many research teams must contribute to improve the usefulness of these devices in coffee quality control.
5. Conclusions
In Geisha coffee, specific VOC from the headspace were only detected in the brew, such as aldehydes, while others were only found in the dry ground coffee, like ketones and phenols. Terpenes appeared in much higher amounts in the infusions than in ground Geisha coffee. The remaining compounds’ levels were lower in the infusion than in the ground coffee.
The tasting panel found it difficult to differentiate fragrance and aroma and the intermediate roasts within the same brew. However, they were able to distinguish the aroma of the same roast in the Natural and Washed roasts. On the other hand, the panel successfully detected adulteration when specialty Geisha coffee was blended with 20% commercial robusta coffee.
The EN prototype designed in our laboratories is small, portable, and uses innovative MOS sensor chips with low energy consumption. It communicates via Bluetooth to a mobile application, and was able to clearly differentiate the three roast levels in both Geisha coffee brews. It also successfully differentiated coffee samples based on their processing methods in dry ground and brewed forms. Moreover, it could detect the addition of up to 10% commercial robusta coffee to the specialty Geisha. The EN, with the help of chemometric algorithms, could predict the presence of commercial robusta coffee with a high level of correlation in the specialty Geisha coffee samples.
In future research, challenges such as compensating for long-term sensor drift, ensuring repeatability, and addressing the limited temporal validity of multivariate calibration models that necessitate frequent sensor recalibration need to be tackled. However, the advent of new sensor types with reduced short-term drift, their miniaturization, and their capability to conduct rapid and precise analyses without the need for highly qualified personnel position ENs as a promising alternative to expensive and slow traditional techniques.
Supplementary Materials
The following supporting information can be downloaded at: https://www.mdpi.com/article/10.3390/chemosensors11110559/s1, Primary EN Signals in TXT of Figure 4, Figure 5, Figure 6 and Figure 7.
Author Contributions
Conceptualization, N.S., R.S. and J.L.; methodology, N.S., R.S. and J.L.; software, R.S. and N.S.; validation, R.S., N.S. and F.M.; formal analysis, R.S., N.S. and J.L.; investigation, N.S., R.S. and F.S.; resources, J.L. and R.S.; data curation, N.S., P.C. and R.S.; writing—original draft preparation, N.S. and R.S.; writing—review and editing, F.M., P.A., F.S. and P.C.; visualization, F.M., P.A. and P.C.; supervision, R.S. and J.L.; project administration, R.S. and J.L.; funding acquisition, J.L. and R.S. All authors have read and agreed to the published version of the manuscript.
Funding
This research was financed by grants to research groups from the Regional Government of Extremadura through the Perception and Intelligent Systems group (GR21045).
Institutional Review Board Statement
Not applicable.
Informed Consent Statement
Informed consent was obtained from all subjects involved in the study.
Data Availability Statement
Not applicable.
Acknowledgments
Tessie Hartmann, owner of T&T Panamanian Coffee, for supplying us with the coffee samples and all her contributions to this research project.
Conflicts of Interest
The authors declare no conflict of interest. The funders had no role in the design of the study; in the collection, analyses, or interpretation of data; in the writing of the manuscript; or in the decision to publish the results.
References
- Bastian, F.; Hutabarat, O.S.; Dirpan, A.; Nainu, F.; Harapan, H.; Emran, T.B.; Simal-Gandara, J. From Plantation to Cup: Changes in Bioactive Compounds during Coffee Processing. Foods 2021, 10, 2827. [Google Scholar] [CrossRef] [PubMed]
- International Coffee Organization Informe del Mercado del Café. Available online: http://www.ico.org/ (accessed on 1 September 2023).
- Hall, R.D.; Trevisan, F.; de Vos, R.C.H. Coffee Berry and Green Bean Chemistry—Opportunities for Improving Cup Quality and Crop Circularity. Food Res. Int. 2022, 151, 110825. [Google Scholar] [CrossRef] [PubMed]
- Batista, L.R.; Chalfoun de Souza, S.M.; Silva e Batista, C.F.; Schwan, R.F. Coffee: Types and Production. Encycl. Food Health 2015, 2015, 244–251. [Google Scholar] [CrossRef]
- Geromel, C.; Ferreira, L.P.; Guerreiro, S.M.C.; Cavalari, A.A.; Pot, D.; Pereira, L.F.P.; Leroy, T.; Vieira, L.G.E.; Mazzafera, P.; Marraccini, P. Biochemical and Genomic Analysis of Sucrose Metabolism during Coffee (Coffea Arabica) Fruit Development. J. Exp. Bot. 2006, 57, 3243–3258. [Google Scholar] [CrossRef]
- Rojo Jiménez, E. Café I (G. Coffea). Reduca Biol. Ser. Bot. 2014, 7, 113–132. [Google Scholar]
- Sepúlveda, W.S.; Chekmam, L.; Maza, M.T.; Mancilla, N.O. Consumers’ Preference for the Origin and Quality Attributes Associated with Production of Specialty Coffees: Results from a Cross-Cultural Study. Food Res. Int. 2016, 89, 997–1003. [Google Scholar] [CrossRef]
- Romano, R.; Santini, A.; Le Grottaglie, L.; Manzo, N.; Visconti, A.; Ritieni, A. Identification Markers Based on Fatty Acid Composition to Differentiate between Roasted Arabica and Canephora (Robusta) Coffee Varieties in Mixtures. J. Food Compos. Anal. 2014, 35, 1–9. [Google Scholar] [CrossRef]
- World Coffee Research|Geisha (Panama). Available online: https://varieties.worldcoffeeresearch.org/es/variedades/geisha-panama (accessed on 2 May 2023).
- Ministerio de Comercio e Industrias. Análisis de Indicadores Económicos. Available online: https://mici.gob.pa/ (accessed on 14 June 2023).
- Best of Panama Eauction—Specialty Coffee. 2021. Available online: https://auction.bestofpanama.org/en/lots/auction/best-of-panama-2021 (accessed on 20 June 2023).
- Magalhães Júnior, A.I.; de Carvalho Neto, D.P.; de Melo Pereira, G.V.; da Silva Vale, A.; Medina, J.D.C.; de Carvalho, J.C.; Soccol, C.R. A Critical Techno-Economic Analysis of Coffee Processing Utilizing a Modern Fermentation System: Implications for Specialty Coffee Production. Food Bioprod. Process. 2021, 125, 14–21. [Google Scholar] [CrossRef]
- Bagus Widodo, P.; Endy Yulianto, M.; Dwi Ariyanto, H.; Paramita, V. Efficacy of Natural and Full Washed Post-Harvest Processing Variations on Arabica Coffee Characteristics. Mater. Today Proc. 2023, 87, 79–85. [Google Scholar] [CrossRef]
- Toledo, P.R.A.B.; Pezza, L.; Pezza, H.R.; Toci, A.T. Relationship Between the Different Aspects Related to Coffee Quality and Their Volatile Compounds. Compr. Rev. Food Sci. Food Saf. 2016, 15, 705–719. [Google Scholar] [CrossRef]
- Ceballos, D.A.C.; Meneses, J.A.M.; Luna, D.A.R.; Lopez, C.A.G.; Garcia, J.H.; Narvaez, J.A.G. Estudio de Fragancia y Aroma Del Café Tostado Con La Nariz Electrónica Coffee-NOSE. In Proceedings of the 2020 9th International Congress of Mechatronics Engineering and Automation, CIIMA 2020, Cartagena de Indias, Colombia, 4–6 November 2020; Institute of Electrical and Electronics Engineers Inc.: Cartagena de Indias, Colombia, 2020. [Google Scholar]
- Specialty Coffee Association. Available online: https://sca.coffee/ (accessed on 7 May 2023).
- Defernez, M.; Wren, E.; Watson, A.D.; Gunning, Y.; Colquhoun, I.J.; Le Gall, G.; Williamson, D.; Kemsley, E.K. Low-Field 1H NMR Spectroscopy for Distinguishing between Arabica and Robusta Ground Roast Coffees. Food Chem. 2017, 216, 106–113. [Google Scholar] [CrossRef] [PubMed]
- Rocha Baqueta, M.; Coqueiro, A.; Henrique Março, P.; Mandrone, M.; Poli, F.; Valderrama, P. Integrated 1H NMR Fingerprint with NIR Spectroscopy, Sensory Properties, and Quality Parameters in a Multi-Block Data Analysis Using ComDim to Evaluate Coffee Blends. Food Chem. 2021, 355, 129618. [Google Scholar] [CrossRef] [PubMed]
- De Luca, S.; De Filippis, M.; Bucci, R.; Magrì, A.D.; Magrì, A.L.; Marini, F. Characterization of the Effects of Different Roasting Conditions on Coffee Samples of Different Geographical Origins by HPLC-DAD, NIR and Chemometrics. Microchem. J. 2016, 129, 348–361. [Google Scholar] [CrossRef]
- Wasilewski, T.; Migoń, D.; Gębicki, J.; Kamysz, W. Critical Review of Electronic Nose and Tongue Instruments Prospects in Pharmaceutical Analysis. Anal. Chim. Acta 2019, 1077, 14–29. [Google Scholar] [CrossRef] [PubMed]
- Gonzalez Viejo, C.; Tongson, E.; Fuentes, S. Integrating a Low-cost Electronic Nose and Machine Learning Modelling to Assess Coffee Aroma Profile and Intensity. Sensors 2021, 21, 2016. [Google Scholar] [CrossRef] [PubMed]
- Rasekh, M.; Karami, H.; Wilson, A.D.; Gancarz, M. Classification and Identification of Essential Oils from Herbs and Fruits Based on a Mos Electronic-Nose Technology. Chemosensors 2021, 9, 142. [Google Scholar] [CrossRef]
- Vincent, T.A.; Xing, Y.; Cole, M.; Gardner, J.W. Investigation of the Response of High-Bandwidth MOX Sensors to Gas Plumes for Application on a Mobile Robot in Hazardous Environments. Sens. Actuators B Chem. 2019, 279, 351–360. [Google Scholar] [CrossRef]
- Van Duy, L.; Nguyet, T.T.; Le, D.T.T.; Van Duy, N.; Nguyen, H.; Biasioli, F.; Tonezzer, M.; Di Natale, C.; Hoa, N.D. Room Temperature Ammonia Gas Sensor Based on P-Type-like V2O5 Nanosheets towards Food Spoilage Monitoring. Nanomaterials 2023, 13, 146. [Google Scholar] [CrossRef] [PubMed]
- Mohd Ali, M.; Hashim, N.; Abd Aziz, S.; Lasekan, O. Principles and Recent Advances in Electronic Nose for Quality Inspection of Agricultural and Food Products. Trends Food Sci. Technol. 2020, 99, 1–10. [Google Scholar] [CrossRef]
- Sánchez, R.; Martín-tornero, E.; Lozano, J.; Boselli, E.; Arroyo, P.; Meléndez, F.; Martín-vertedor, D. E-nose Discrimination of Abnormal Fermentations in Spanish-style Green Olives. Molecules 2021, 26, 5353. [Google Scholar] [CrossRef]
- Sánchez, R.; Pérez-Nevado, F.; Montero-Fernández, I.; Lozano, J.; Meléndez, F.; Martín-Vertedor, D. Application of Electronic Nose to Discriminate Species of Mold Strains in Synthetic Brines. Front. Microbiol. 2022, 13, 897178. [Google Scholar] [CrossRef] [PubMed]
- Arroyo, P.; Meléndez, F.; Suárez, J.I.; Herrero, J.L.; Rodríguez, S.; Lozano, J. Electronic Nose with Digital Gas Sensors Connected via Bluetooth to a Smartphone for Air Quality Measurements. Sensors 2020, 20, 786. [Google Scholar] [CrossRef]
- Panamanian Coffee|Company. Available online: https://panamaniancoffeeco.com/ (accessed on 2 May 2023).
- Fúnez, N.O.; Canet, G.; García, A. Protocolo de Análisis de Calidad del Café; Instituto Interamericano de Cooperación para la Agricultura: Guatemala de la Asunción, Guatemala, 2010; ISBN 9789292482367. [Google Scholar]
- AOAC International AOAC Official Method 981.12. Official Methods of Analysis of the Association of the Analytical Chemists. Available online: https://www.aoac.org/ (accessed on 19 October 2023).
- AOAC International AOAC Official Method 932.12 (Soluble) in Fruits and Fruit Products: Refractometer Method. Available online: https://www.aoac.org/ (accessed on 19 October 2023).
- Naegele, E. Determination of Caffeine in Coffee Products According to DIN 20481. In Food Testing and Agriculture—Food Authenticity; Agilent Technologies, Inc.: Waldbronn, Germany, 2016. [Google Scholar]
- Rodrigues, C.; Portugal, F.C.M.; Nogueira, J.M.F. Static Headspace Analysis Using Polyurethane Phases—Application to Roasted Coffee Volatiles Characterization. Talanta 2012, 89, 521–525. [Google Scholar] [CrossRef] [PubMed]
- Sánchez Baltasar, R. Aplicación de La Nariz Electrónica Para La Evaluación de Aceitunas de Mesa. Ph.D. Thesis, Universidad de Extremadura, Badajoz, Extremadura, Spain, 2022. [Google Scholar]
- Tolessa, K.; Rademaker, M.; De Baets, B.; Boeckx, P. Prediction of Specialty Coffee Cup Quality Based on near Infrared Spectra of Green Coffee Beans. Talanta 2016, 150, 367–374. [Google Scholar] [CrossRef] [PubMed]
- Palacios-Cabrera, H.; Taniwaki, M.H.; Menezes, H.C.; Iamanaka, B.T. The Production of Ochratoxin A by Aspergillus Ochraceus in Raw Coffee at Different Equilibrium Relative Humidity and under Alternating Temperatures. Food Control 2004, 15, 531–535. [Google Scholar] [CrossRef]
- Eldalawy, R.; Kutaif, R.H.; Tawfeeq, T.A.; Fayyadh, M.S. Quantitative Analysis of Caffeine in Different Commercial Kinds of Coffee in Iraq. Res. J. Pharm. Technol. 2023, 16, 3358–3362. [Google Scholar] [CrossRef]
- Cao, X.; Wu, H.; Viejo, C.G.; Dunshea, F.R.; Suleria, H.A.R. Effects of Postharvest Processing on Aroma Formation in Roasted Coffee—A Review. Int. J. Food Sci. Technol. 2023, 58, 1007–1027. [Google Scholar] [CrossRef]
- Palacios-Cabrera, H.A.; Menezes, H.C.; Iamanaka, B.T.; Canepa, F.; Teixeira, A.A.; Carvalhaes, N.; Santi, D.; Leme, P.T.Z.; Yotsuyanagi, K.; Taniwaki, M.H. Effect of Temperature and Relative Humidity during Transportation on Green Coffee Bean Moisture Content and Ochratoxin a Production. J. Food Prot. 2007, 70, 164–171. [Google Scholar] [CrossRef] [PubMed]
- Wu, H.; Viejo, C.G.; Fuentes, S.; Dunshea, F.R.; Suleria, H.A.R. The Impact of Wet Fermentation on Coffee Quality Traits and Volatile Compounds Using Digital Technologies. Fermentation 2023, 9, 68. [Google Scholar] [CrossRef]
- Grassi, S.; Giraudo, A.; Novara, C.; Cavallini, N.; Geobaldo, F.; Casiraghi, E.; Savorani, F. Monitoring Chemical Changes of Coffee Beans During Roasting Using Real-Time NIR Spectroscopy and Chemometrics. Food Anal. Methods 2023, 16, 947–960. [Google Scholar] [CrossRef]
- Vidal Villeda, M.A. Rango Ideal de Concentración de Sólidos Solubles Durante La Maduración Del Café y Su Influencia Sobre La Calidad de Taza, En Dos Variedades y Tres Niveles Altitudinales. Ph.D. Thesis, Universidad Rafael Landívar, Guatemala de la Asunción, Guatemala, 2014. Available online: http://biblio3.url.edu.gt/Tesario/2014/06/14/Vidal-Marco.pdf (accessed on 19 October 2023).
- Gloess, A.N.; Schönbächler, B.; Klopprogge, B.; D’Ambrosio, L.; Chatelain, K.; Bongartz, A.; Strittmatter, A.; Rast, M.; Yeretzian, C. Comparison of Nine Common Coffee Extraction Methods: Instrumental and Sensory Analysis. Eur. Food Res. Technol. 2013, 236, 607–627. [Google Scholar] [CrossRef]
- Cui, D.D.; Liu, Y.; Chen, Y.P.; Feng, X.; Lu, Y.; Yu, B. Application of SPME-GC-TOFMS, E-Nose, and Sensory Evaluation to Investigate the Flavor Characteristics of Chinese Yunnan Coffee at Three Different Conditions (Beans, Ground Powder, and Brewed Coffee). Flavour Fragr. J. 2020, 35, 541–560. [Google Scholar] [CrossRef]
- Zakidou, P.; Plati, F.; Matsakidou, A.; Varka, E.M.; Blekas, G.; Paraskevopoulou, A. Single Origin Coffee Aroma: From Optimized Flavor Protocols and Coffee Customization to Instrumental Volatile Characterization and Chemometrics. Molecules 2021, 26, 4609. [Google Scholar] [CrossRef] [PubMed]
- León, J.D.C.; Santín, K.; Figueroa, J.G. Identification of Adulterations in Roasted Coffee by Gas Chromatography Coupled with Mass Spectrometry. Cienc. Tecnol. Agropecu. 2022, 23, e2265. [Google Scholar] [CrossRef]
- Brudzewski, K.; Osowski, S.; Dwulit, A. Recognition of Coffee Using Differential Electronic Nose. IEEE Trans. Instrum. Meas. 2012, 61, 1803–1810. [Google Scholar] [CrossRef]
Figure 1.
Geisha coffee samples.

Figure 2.
Representation of the volatile compounds of Table 3 grouped in families.
Figure 2.
Representation of the volatile compounds of Table 3 grouped in families.

Figure 3.
Representation of the sensory analysis score of the coffee attributes.

Figure 4.
PCA graphs of dried ground samples. (a) Natural Geisha dried coffee; (b) Washed Geisha dried coffee.
Figure 4.
PCA graphs of dried ground samples. (a) Natural Geisha dried coffee; (b) Washed Geisha dried coffee.

Figure 5.
PCA graphs of infused samples. (a) Natural Geisha infused coffee; (b) Washed Geisha infused coffee.
Figure 5.
PCA graphs of infused samples. (a) Natural Geisha infused coffee; (b) Washed Geisha infused coffee.

Figure 6.
PCA graphs of dried ground and infused Geisha samples. (a) Natural and Washed dried ground; (b) Natural and Washed infused coffee.
Figure 6.
PCA graphs of dried ground and infused Geisha samples. (a) Natural and Washed dried ground; (b) Natural and Washed infused coffee.

Figure 7.
Results of blends of different portions of a coffee with arabica coffee. (a) PCA graph and (b) PLS graph with values predicted by the EN versus actual values of the fragrance rated by the tasting panel.
Figure 7.
Results of blends of different portions of a coffee with arabica coffee. (a) PCA graph and (b) PLS graph with values predicted by the EN versus actual values of the fragrance rated by the tasting panel.

Figure 8.
Response of the sensors to the presence of coffees of different varieties and their blends.
Figure 8.
Response of the sensors to the presence of coffees of different varieties and their blends.


Table 1.
Electronic nose signals.
| Signals | Description | Sensor |
|---|---|---|
| 1 | Gas Measurement (Ω) | BME680 |
| 2 | eCO2 (ppm) | SGP30 |
| 3 | TVOC (ppb) | SGP30 |
| 4 | H2 (see note 1) | SGP30 |
| 5 | Ethanol (see note 1) | SGP30 |
| 6 | eCO2 (ppm) | CCS811 |
| 7 | TVOC (ppb) | CCS811 |
| 8 | Sensor Resistance (Ω) | CCS811 |
| 9 | eCO2 (ppm) | iAQ-Core |
| 10 | TVOC (ppb) | iAQ-Core |
| 11 | Sensor Resistance (Ω) | iAQ-Core |
1 Concentration can be computed from measurement with a reference.
Table 2.
Physical characteristics of coffee beans and chemical characteristics of coffee infusion. Mean values and Standard Deviation are shown. Different capital letters indicate significant differences (p value < 0.05) between the two manufacturing processes.
Table 2.
Physical characteristics of coffee beans and chemical characteristics of coffee infusion. Mean values and Standard Deviation are shown. Different capital letters indicate significant differences (p value < 0.05) between the two manufacturing processes.
| Characteristics | Physical of Green Beans | Chemical of Infusion | ||||
|---|---|---|---|---|---|---|
| Post-Harvest Process | Odor/Color | % Humidity | Density (g/L) | Roast Level | pH | °Brix |
| Natural | yellowish/ | light | 4.86 ± 0.02 | 1.40 ± 0.36 | ||
| fresh, green | 9.39 ± 0.13 | 726.4 ± 0.67 | medium | 4.87 ± 0.05 | 1.56 ± 0.05 | |
| coffee aroma | Dark | 4.89 ± 0.01 | 1.90 ± 0.20 A | |||
| Washed | grayish/ | Light | 4.87 ± 0.01 | 1.33 ± 0.05 | ||
| fresh, very | 8.91 ± 0.12 | 718.6 ± 0.50 | Medium | 4.82 ± 0.02 | 1.56 ± 0.15 | |
| herbaceous | Dark | 4.89 ± 0.01 | 1.56 ± 0.05 B | |||
Table 3.
Percentage of caffeine in the two types of processing. Mean values and Standard Deviation are shown. No significant differences (p-value < 0.05) present.
Table 3.
Percentage of caffeine in the two types of processing. Mean values and Standard Deviation are shown. No significant differences (p-value < 0.05) present.
| Post-Harvest Process | Caffeine (%) |
|---|---|
| Natural | 0.84 ± 0.03 |
| Washed | 0.87 ± 0.03 |
Table 4.
Volatile compounds found in the headspace of natural and washed Geisha roast and commercial robusta ground coffee, and in Geisha coffee infusions.
Table 4.
Volatile compounds found in the headspace of natural and washed Geisha roast and commercial robusta ground coffee, and in Geisha coffee infusions.
| Peak Area (×107) | ||||||||||||
|---|---|---|---|---|---|---|---|---|---|---|---|---|
| Name | * RT (min) | Nº CAS | * Odor Descriptor | NL | NM | ND | WL | WM | WD | NLI | WLI | R |
| Acids | ||||||||||||
| Acetic acid | 2.278 | 64-19-7 | Sharp vinegar | 90.00 | 81.90 | 79.60 | 69.80 | 71.70 | 59.80 | 2.00 | 1.18 | 27.30 |
| Butanoic acid, 3-methyl- | 6.870 | 503-74-2 | Rancid/Cheese | 6.59 | 7.03 | 7.70 | 7.11 | 6.44 | 5.16 | nd | nd | 6.31 |
| Aldheydes | ||||||||||||
| Butanal, 2-methyl- | 2.235 | 96-17-3 | Chocolate/nutty | * nd | nd | nd | nd | nd | nd | 0.43 | 0.41 | nd |
| 3-Cyclohexene-1-acetaldehyde, alpha 4-dimethyl- | 14.960 | 29548-14-9 | Spicy herbal | nd | nd | nd | nd | nd | nd | 1.08 | 1.09 | nd |
| Alcohols | ||||||||||||
| 3-Buten-2-ol | 2.496 | 598-32-3 | Herbal | 7.96 | 9.70 | 10.42 | 7.95 | 10.76 | 9.26 | nd | nd | 4.32 |
| 2,3-Butanediol | 4.253 | 513-85-9 | Fruity/creamy/buttery | nd | nd | nd | nd | nd | nd | nd | nd | 0.53 |
| Furans | ||||||||||||
| 3(2H)-Furanone, dihydro-2-methyl- | 4.033 | 3188-00-9 | Bready/nutty | 6.25 | 7.59 | 10.16 | 7.14 | 7.73 | 8.73 | nd | nd | 3.24 |
| 3-Furaldehyde | 4.567 | 498-60-2 | Almond-like odor | nd | nd | nd | nd | nd | nd | 5.63 | 4.28 | 3.96 |
| Furfural | 4.601 | 98-01-1 | Bready/caramellic | 13.50 | 15.23 | 16.34 | 37.87 | 41.79 | 28.71 | nd | nd | nd |
| 2-Furanmethanol | 5.381 | 98-00-0 | Sweet/caramel/coffee | 4.91 | 3.54 | 4.86 | 63.30 | 70.90 | 72.60 | nd | nd | 91.60 |
| 2-Furancarboxaldehyde, 5-methyl- | 7.806 | 620-02-0 | Caramellic/bready/coffee | 3.81 | 3.26 | 4.00 | 25.68 | 28.34 | 32.18 | 5.02 | 0.77 | 14.85 |
| 2-Furanmethanol, acetate | 8.675 | 623-17-6 | Fruity/banana-like | 16.80 | 16.90 | 17.50 | 10.61 | 11.60 | 16.24 | 3.21 | 1.90 | 20.34 |
| 2,2′-Bifuran | 9.886 | 5905-00-0 | Bitter almond | nd | nd | nd | nd | nd | nd | 0.98 | 0.45 | nd |
| Furan, 2,2′-methylenebis- | 11.203 | 1197-40-6 | Rich roasted | nd | nd | nd | nd | nd | nd | 0.89 | 0.48 | nd |
| Furan, 2-(2-furanylmethyl)-5-methyl- | 13.987 | 13678-51-8 | Like coffee | nd | nd | nd | nd | nd | nd | 0.74 | 0.39 | nd |
| 2-Acetyl-5-methylfuran | 14.139 | 1193-79-9 | Nutty/caramellic nuance | 1.68 | 2.38 | 3.46 | 2.27 | 2.70 | 3.61 | nd | nd | 2.30 |
| 5-Hydroxymethylfurfural | 16.256 | 67-47-0 | Buttery/musty/caramellic | 9.89 | 9.88 | 6.19 | 13.60 | 9.65 | 1.98 | nd | nd | nd |
| 5-Acetoxymethyl-2-furaldehyde | 17.598 | 10551-58-3 | Baked bread | 1.83 | 2.26 | 2.25 | 2.69 | 2.55 | 1.85 | nd | nd | nd |
| Ketones | ||||||||||||
| Acetoin | 2.714 | 513-86-0 | Milky fatty | 5.22 | 5.03 | 5.63 | 4.32 | 4.78 | 4.78 | nd | nd | 3.26 |
| 1-Propanone, 1-(2-furanyl)- | 9.036 | 3194-15-8 | Fruity | 2.04 | 2.49 | 2.99 | 0.68 | 0.84 | 0.90 | nd | nd | 0.72 |
| Ethanone, 1-(1H-pyrrol-2-yl)- | 10.892 | 1072-83-9 | Licorice bready/walnut | 2.44 | 2.93 | 3.31 | 4.60 | 5.61 | 7.68 | nd | nd | 10.50 |
| 2-Cyclopenten-1-one, 3-ethyl-2-hydroxy- | 12.360 | 21835-01-8 | Caramelized/brown sugar | 1.97 | 2.08 | 2.71 | 1.36 | 1.99 | 2.24 | nd | nd | 2.31 |
| 4H-Pyran-4-one, 2,3-dihydro-3,5-dihydroxy-6-methyl- | 13.357 | 28564-83-2 | Herbal | 16.89 | 12.52 | 6.29 | 16.81 | 13.20 | 4.91 | nd | nd | nd |
| Ethanone, 1-(2-hydroxy-5-methylphenyl)- | 17.805 | 1450-72-2 | Sweet floral herbal | 14.06 | 15.36 | 14.83 | 12.88 | 15.60 | 13.56 | nd | nd | 64.07 |
| Maltol | 12.092 | 118-71-8 | Burnt with bready nuances | 7.73 | 8.75 | 12.79 | 7.71 | 9.45 | 13.16 | nd | nd | 14.10 |
| Phenols | ||||||||||||
| Phenol, 3-methyl- | 4.501 | 108-39-4 | Medicinal/woody/ethereal | nd | nd | nd | nd | nd | nd | 1.27 | 0.39 | nd |
| Phenol, 2-methoxy- | 11.494 | 90-05-1 | Phenolic/smoky/vanilla | nd | nd | nd | nd | nd | nd | nd | nd | 7.45 |
| Phenol, 4-ethyl-2-methoxy- | 16.759 | 2785-89-9 | Medicinal/woody/sweet | 3.79 | 4.99 | 6.23 | 4.69 | 5.45 | 6.06 | nd | nd | 16.40 |
| Pirazines | ||||||||||||
| Pyrazine, methyl- | 4.332 | 109-08-0 | Nutty/cocoa/chocolate | 3.18 | 2.73 | 3.67 | 14.65 | 15.41 | 15.60 | nd | nd | 22.85 |
| Pyrazine, 2,6-dimethyl- | 6.368 | 108-50-9 | Cocoa/nutty/roasted/coffee | 38.16 | 37.87 | 42.24 | 24.10 | 24.90 | 25.41 | nd | nd | 24.21 |
| Pyrazine, ethyl- | 6.449 | 13925-00-3 | Fermented coffee/cocoa | 64.20 | 73.40 | 87.20 | 6.40 | 7.36 | 6.85 | nd | nd | 9.88 |
| Pyrazine, 2,3-dimethyl- | 6.536 | 5910-89-4 | Musty/roasted potato | 19.74 | 21.49 | 23.52 | 3.33 | 4.13 | 3.28 | nd | nd | nd |
| Pyrazine, 2-ethyl-5-methyl- | 8.774 | 13360-64-0 | Coffee/beany/grassy | 23.06 | 27.01 | 33.20 | 4.58 | 4.67 | 4.59 | nd | nd | 6.48 |
| Pyrazine, trimethyl- | 8.818 | 14667-55-1 | Powdery/cocoa/musty | 10.38 | 13.34 | 17.36 | 2.41 | 2.40 | 2.83 | nd | nd | 5.06 |
| Pyrazine, 2-ethyl-3-methyl- | 8.864 | 15707-23-0 | Musty/corn raw/earthy | 3.59 | 3.99 | 4.07 | 3.37 | 2.42 | 3.73 | nd | nd | 4.76 |
| Pyrazinamide | 9.404 | 98-96-4 | Ammonia | 0.53 | 0.80 | 0.97 | 2.45 | 2.86 | 3.45 | nd | nd | 4.27 |
| Pyrazine, 3-ethyl-2,5-dimethyl- | 11.039 | 13360-65-1 | Potato/cocoa/roasted nutty | 4.78 | 5.22 | 7.28 | 2.72 | 2.91 | 3.98 | nd | nd | 7.41 |
| Pyrazine, (1-methylethenyl)- | 11.829 | 38713-41-6 | Chocolate/nutty/roasted | nd | nd | nd | nd | nd | nd | nd | nd | 2.48 |
| 2-Acetyl-3-methylpyrazine | 12.198 | 23787-80-6 | Toasted grain/caramellic | 2.68 | 2.60 | 3.17 | 2.62 | 2.84 | 2.98 | nd | nd | 3.62 |
| 5H-5-Methyl-6, 7-dihydrocyclopentapyrazine | 12.783 | 23747-48-0 | Toasted grain coffee | nd | nd | nd | nd | nd | nd | nd | nd | 1.87 |
| Pyrazine, 3,5-diethyl-2-methyl- | 13.301 | 18138-05-1 | Green nutty | nd | nd | nd | nd | nd | nd | nd | nd | 2.15 |
| Pyridines | ||||||||||||
| Pyridine | 3.102 | 110-86-1 | Sour fishy/ammoniacal | nd | nd | nd | nd | nd | nd | nd | nd | 18.30 |
| Pyrroles | ||||||||||||
| 1H-Pyrrole-1-methyl- | 8.930 | 96-54-8 | Smoky/woody/herbal | 1.95 | 2.42 | 5.43 | 1.89 | 2.49 | 3.03 | nd | nd | 3.82 |
| 1H-Pyrrole-2-carboxaldehyde, 1-methyl- | 17.057 | 1192-58-1 | Roasted odor burnt | 1.43 | 1.67 | 1.77 | 2.18 | 1.94 | 1.88 | nd | nd | 0.81 |
| 1H-Pyrrole, 1-(2-furanylmethyl)- | 14.060 | 1438-94-4 | Vegetable/mushroom/potato | 2.58 | 2.89 | 3.19 | 3.20 | 3.17 | 3.13 | 1.92 | 1.62 | 3.58 |
| 1H-Pyrrole-1-methyl- | 13.105 | 96-54-8 | Smoky/woody/herbal | 1.86 | 2.41 | 2.86 | 2.12 | 2.41 | 3.16 | nd | nd | 2.57 |
| Terpenes | ||||||||||||
| .beta-Pinene | 8.494 | 127-91-3 | Eucalyptus/camphoraceous | nd | nd | nd | nd | nd | nd | 2.69 | 1.08 | nd |
| D-Limonene | 9.548 | 5989-27-5 | Citrus/orange fresh sweet | nd | nd | nd | nd | nd | nd | 2.16 | 1.32 | nd |
| trans-beta-Ocimene | 9.839 | 3779-61-1 | Floral/herbal and woody | nd | nd | nd | nd | nd | nd | 1.02 | 0.60 | nd |
| (z)-beta-Ocimene | 10.135 | 3338-55-4 | Floral/herbal | nd | nd | nd | nd | nd | nd | 1.79 | 1.41 | nd |
| Terpinolene | 11.286 | 586-62-9 | Pine/citrus/woody/lemon | nd | nd | nd | nd | nd | nd | 1.03 | 0.75 | nd |
| Linalool | 11.799 | 78-70-6 | Floral/citrus | 2.53 | 2.24 | 3.11 | 2.32 | 2.56 | 2.77 | 2.04 | 1.82 | nd |
| alpha-Terpineol | 14.397 | 98-55-5 | Lemon/lime/citrus/floral | nd | nd | nd | nd | nd | nd | 0.79 | 0.46 | nd |
| trans-beta-damascenone | 19.521 | 23696-85-7 | Earthy/green floral | nd | nd | nd | nd | nd | nd | 0.58 | 0.39 | nd |
| Others | ||||||||||||
| Índole | 17.682 | 120-72-9 | Fecal/animal/musty | nd | nd | nd | nd | nd | nd | nd | nd | 2.94 |
| Bis(2-furfuryl) disulfide | 20.296 | 4437-20-1 | Sulfurous/roasted/onion | 1.68 | 1.78 | 2.52 | 2.21 | 2.45 | 3.41 | nd | nd | 2.52 |
* RT: retention time. Odor descriptors from the Good Scent Company Information System (www.thegoodscentscompany.com, accessed on 21 August 2023). nd: not detected.
Table 5.
Mean values and Standard Deviation of the sensory analysis score.
| Samples | Fragrance | Aroma | Flavor | Residual Flavor | Acidity | Body | Sweetness |
|---|---|---|---|---|---|---|---|
| NL | 8.43 ± 0.53 aA* | 8.57± 0.53 aA | 7.00 ± 1.00 | 7.43 ± 0.97 | 6.86 ± 0.69 b | 6.43 ± 0.53 | 8.43 ± 0.97 a |
| NM | 8.29 ± 0.75 ab | 7.29 ± 0.48 bB | 7.29 ± 0.48 | 7.29 ± 0.48 | 7.14 ± 0.37 ab | 7.00 ± 0.57 | 7.43 ± 1.27 ab |
| ND | 7.29 ± 0.48 bB | 7.57 ± 0.53 bA | 7.14 ± 0.69 | 7.71 ± 0.75 | 7.50 ± 0.81 a | 7.43 ± 0.97 | 6.86 ± 0.90 b |
| WL | 7.14 ± 0.69 bB | 7.29 ± 0.48 bB | 7.71 ± 0.75 | 7.14 ± 0.69 | 7.29 ± 0.75 | 7.14 ± 0.69 | 7.57 ± 0.78 |
| WM | 8.14 ± 0.69 a | 8.14 ± 0.69 abA | 7.14 ± 0.37 | 7.00 ± 0.57 | 6.86 ± 0.69 | 7.00 ± 0.57 | 6.86 ± 0.37 |
| WD | 8.57 ± 0.53 aA | 8.57 ± 0.53 aA | 7.29 ± 0.75 | 6.86 ± 1.06 | 7.50 ± 0.54 | 7.14 ± 0.90 | 7.29 ± 1.11 |
* Different lower-case letters represent significant differences (p < 0.05) between roast levels within the same processing. Different capital letters represent significant differences between roasting levels within each type of processing.
Table 6.
Mean values and Standard Deviation of the sensory analysis score of adulterated coffee.
| Samples | Fragrance |
|---|---|
| N100 | 9.00 ± 0.75 a |
| N90R10 | 7.75 ± 0.58 ab* |
| N80R20 | 6.62 ± 1.30 bc |
| N50R50 | 5.75 ± 1.48 cd |
| R100 | 4.37 ± 1.50 d |
* Different lower-case letters represent significant differences (p < 0.05) between roast levels within the same processing.
Disclaimer/Publisher’s Note: The statements, opinions and data contained in all publications are solely those of the individual author(s) and contributor(s) and not of MDPI and/or the editor(s). MDPI and/or the editor(s) disclaim responsibility for any injury to people or property resulting from any ideas, methods, instructions or products referred to in the content. |
© 2023 by the authors. Licensee MDPI, Basel, Switzerland. This article is an open access article distributed under the terms and conditions of the Creative Commons Attribution (CC BY) license (https://creativecommons.org/licenses/by/4.0/).
Share and Cite
MDPI and ACS Style
Santamaría, N.; Meléndez, F.; Arroyo, P.; Calvo, P.; Sánchez, F.; Lozano, J.; Sánchez, R. Olfactory Evaluation of Geisha Coffee from Panama Using Electronic Nose. Chemosensors 2023, 11, 559. https://doi.org/10.3390/chemosensors11110559
AMA Style
Santamaría N, Meléndez F, Arroyo P, Calvo P, Sánchez F, Lozano J, Sánchez R. Olfactory Evaluation of Geisha Coffee from Panama Using Electronic Nose. Chemosensors. 2023; 11(11):559. https://doi.org/10.3390/chemosensors11110559
Chicago/Turabian StyleSantamaría, Nohely, Félix Meléndez, Patricia Arroyo, Patricia Calvo, Francisco Sánchez, Jesús Lozano, and Ramiro Sánchez. 2023. "Olfactory Evaluation of Geisha Coffee from Panama Using Electronic Nose" Chemosensors 11, no. 11: 559. https://doi.org/10.3390/chemosensors11110559
Note that from the first issue of 2016, this journal uses article numbers instead of page numbers. See further details here.