Article

Advances in a Microwave Sensor-Type Interdigital Capacitor with a Hexagonal Complementary Split-Ring Resonator for Glucose Level Measurement

by
Supakorn Harnsoongnoen
1,* and
Benjaporn Buranrat
2
1
The Biomimicry for Sustainable Agriculture, Health, Environment and Energy Research Unit, Department of Physics, Faculty of Science, Mahasarakham University, Kantarawichai District, Maha Sarakham 44150, Thailand
2
Faculty of Medicine, Mahasarakham University, Muang District, Maha Sarakham 44000, Thailand
*
Author to whom correspondence should be addressed.
Chemosensors 2023, 11(4), 257; https://doi.org/10.3390/chemosensors11040257
Submission received: 10 March 2023 / Revised: 11 April 2023 / Accepted: 19 April 2023 / Published: 20 April 2023

Abstract

:
This study involved the creation and assessment of a microwave sensor to measure glucose levels in aqueous solutions without invasiveness. The sensor design utilized a planar interdigital capacitor (IDC) loaded with a hexagonal complementary split-ring resonator (HCSRR). The HCSRR was chosen for its ability to generate a highly intense electric field that is capable of detecting variations in the dielectric characteristics of the specimen. A chamber tube was used to fill glucose solutions at the sensor’s sensitive area, and changes in the device’s resonance frequency (Fr) and reflection coefficient (S11) were used to measure glucose levels. Fitting formulas were developed to analyze the data, and laboratory tests showed that the sensor could accurately measure glucose levels within a range of 0–150 mg/dL. At a concentration of 37.5 mg/dL, the sensitivity based on S11 and Fr reached maximum values of 10.023 dB per mg/dL and 1.73 MHz per mg/dL, respectively. This implies that the sensor put forward has the possibility of being utilized in medical settings for the monitoring of glucose levels.

1. Introduction

The World Health Organization (WHO) states that there are over 400 million individuals suffering from diabetes globally, and the number has been increasing in recent years. Developing countries are disproportionately affected by diabetes, which has become a leading cause of death, resulting in an estimated 1.6 million fatalities annually [1,2]. Diabetes is a chronic condition caused by inadequate control of blood sugar levels. If left at a chronic high level (hyperglycemia), serious and life-threatening complications can develop; it can lead to severe complications, such as stroke, heart attack, heart failure, kidney failure, and blindness in adults [3]. Additionally, numerous patients experience seriously low blood sugar levels (hypoglycemia), which, if not treated promptly, can be life-threatening [4]. The most widely used glucose sensing technology today is the index finger glucose strip, which requires multiple daily sampling and the use of single-use and continuous consumption strips. This can make it difficult for patients to consistently comply with regular glucose testing. Furthermore, utilizing continuous, real-time monitoring of blood glucose levels can assist in detecting variations in blood sugar levels for individuals with diabetes [5,6]. In order to tackle this problem, recent advancements in glucose detection by implanting a needle sensor under the skin for the accurate measurement of body glucose has been proposed [7]. However, the sensors are expensive and need to be replaced every 10–14 days [8]. As a result, many patients are unable to take advantage of this technology due to its cost and the frequent replacement requirements.
Diabetes can cause numerous disorders in the body and treatment can be painful. Therefore, people with diabetes require painless, accurate blood glucose measurement technology that can be displayed in real time [9]. There has been significant research focused on developing the most effective non-invasive real-time glucose detection technologies [10,11]. Detection in [12,13] is based on near-infrared and impedance spectroscopy. In [14,15,16], the proposed methods are Raman spectroscopy, tomography, and photoacoustic. Measurement of glucose using reverse iontophoresis has also been proposed, where a chemical sensor is used to measure the concentration of glucose [17,18]. While these systems are non-invasive, the sensors are expensive and may deteriorate over time. In addition, a heat-emitting infrared temperature measurement technique that uses the body temperature to estimate blood sugar levels is also expensive and not very accurate in measuring blood sugar levels [19]. Attempts are currently being made to use alternative techniques such as saliva [20], breath [21], sweat [22,23,24], and tear analysis [25] for glucose measurement. However, each of these methods has its own set of problems and limitations. Monitoring blood glucose using electromagnetic (EM) methods has been proposed as a promising option [26,27]. This technique is based on the fact that when blood sugar levels change, the electrical conductivity of blood or muscle tissue also changes. The EM wave method has several advantages, including ease of design, fabrication, and use; durability, and cost-effectiveness. Research has proposed using electromagnetic waves in the microwave frequency range for glucose sensing [28,29]. Glucose monitoring techniques were standardized in the 1960s and conventional glucose detection methods were divided into point-of-care and continuous methods [30,31]. Point-of-care testing involves an enzymatic method that uses a fingerstick to obtain a blood sample or a urine sample. Microwave responses are sensitive to changes in the permittivity and conductivity of blood samples as the glucose concentration changes. It is possible to use the measurement of the changing electromagnetic signals to assess blood glucose levels. At microwave frequencies, a variety of non-invasive and invasive methods have been used to estimate blood sugar levels.
Non-invasive methods for estimating aqueous and blood glucose levels include patch resonators [32,33,34,35,36,37], microstrip band pass filters, open-ended patch resonators, microstrip lines with a complementary split-ring resonator (CSRR), oval-shaped patches with sandwiched T strips inside, and microstrip patch antennas. Cavity resonators [38], such as discrete double split-ring resonators, rectangular waveguide cavity resonators, and cylindrical cavity resonators, have also been used for non-invasive glucose estimation. Microstrip-loaded resonators have additionally been used for non-invasive glucose estimation [39,40,41,42,43], as well as coplanar waveguide (CPW)-loaded resonators [44,45,46,47]. Other non-invasive methods for estimating glucose levels include ultrawideband [48], dielectric resonators [49], IDC with a quarter wave-length stub [50], distributed MEM transmission lines (DMTL) [51], open-ended coaxial probes [52], epsilon negative (ENG) resonators [53], IDC with intertwined spiral inductors [54], T-shaped stub-loaded symmetric square open loops [55], inductively coupled resonators [56], dual-mode microstrip sensors [57], glucometers [58], center-loaded circular finger-based IDC [59], closed-loop enclosed split-ring resonators [60], Hilbert-shaped resonators [61], cross-coupled stub-loaded meandered-line SIRs [62], rectangular meandered line (RML) resonators [63], ground signal ground (GSG) patterns [64], CSRR driven by an ISM radar [65], triple-pole CSRR [66], WGM [67], circular CSRR [68], millimeter-wave metamaterial-inspired resonators [69], and NSRR with PLL [70]. It is evident from the above research review that microwave sensors have the potential to detect glucose levels, but further study and development is needed to increase their accuracy and precision.
In this work, a sensor-type IDC added to a HCSRR was constructed. The properties and parameters of this sensor were investigated using an aqueous solution of glucose. The precision of values and sensitivity are discussed. The proposed sensor structure is characterized by its simplicity, compactness, and ease of manufacture, as well as its ability to achieve high sensitivity with small specimens. Notably, it is capable of measuring in the liquid phase without the need for an acceptor molecule. Simulation results show that the IDC with a HCSRR structure can produce strong electric fields, leading to increased sensitivity. The proposed sensor has potential for use in medical applications due to its non-destructive, non-invasive, and non-contact nature; non-chemical reaction; real-time measurement capabilities; low cost; small size, and the ability to work with small-volume specimens.

2. Materials and Methods

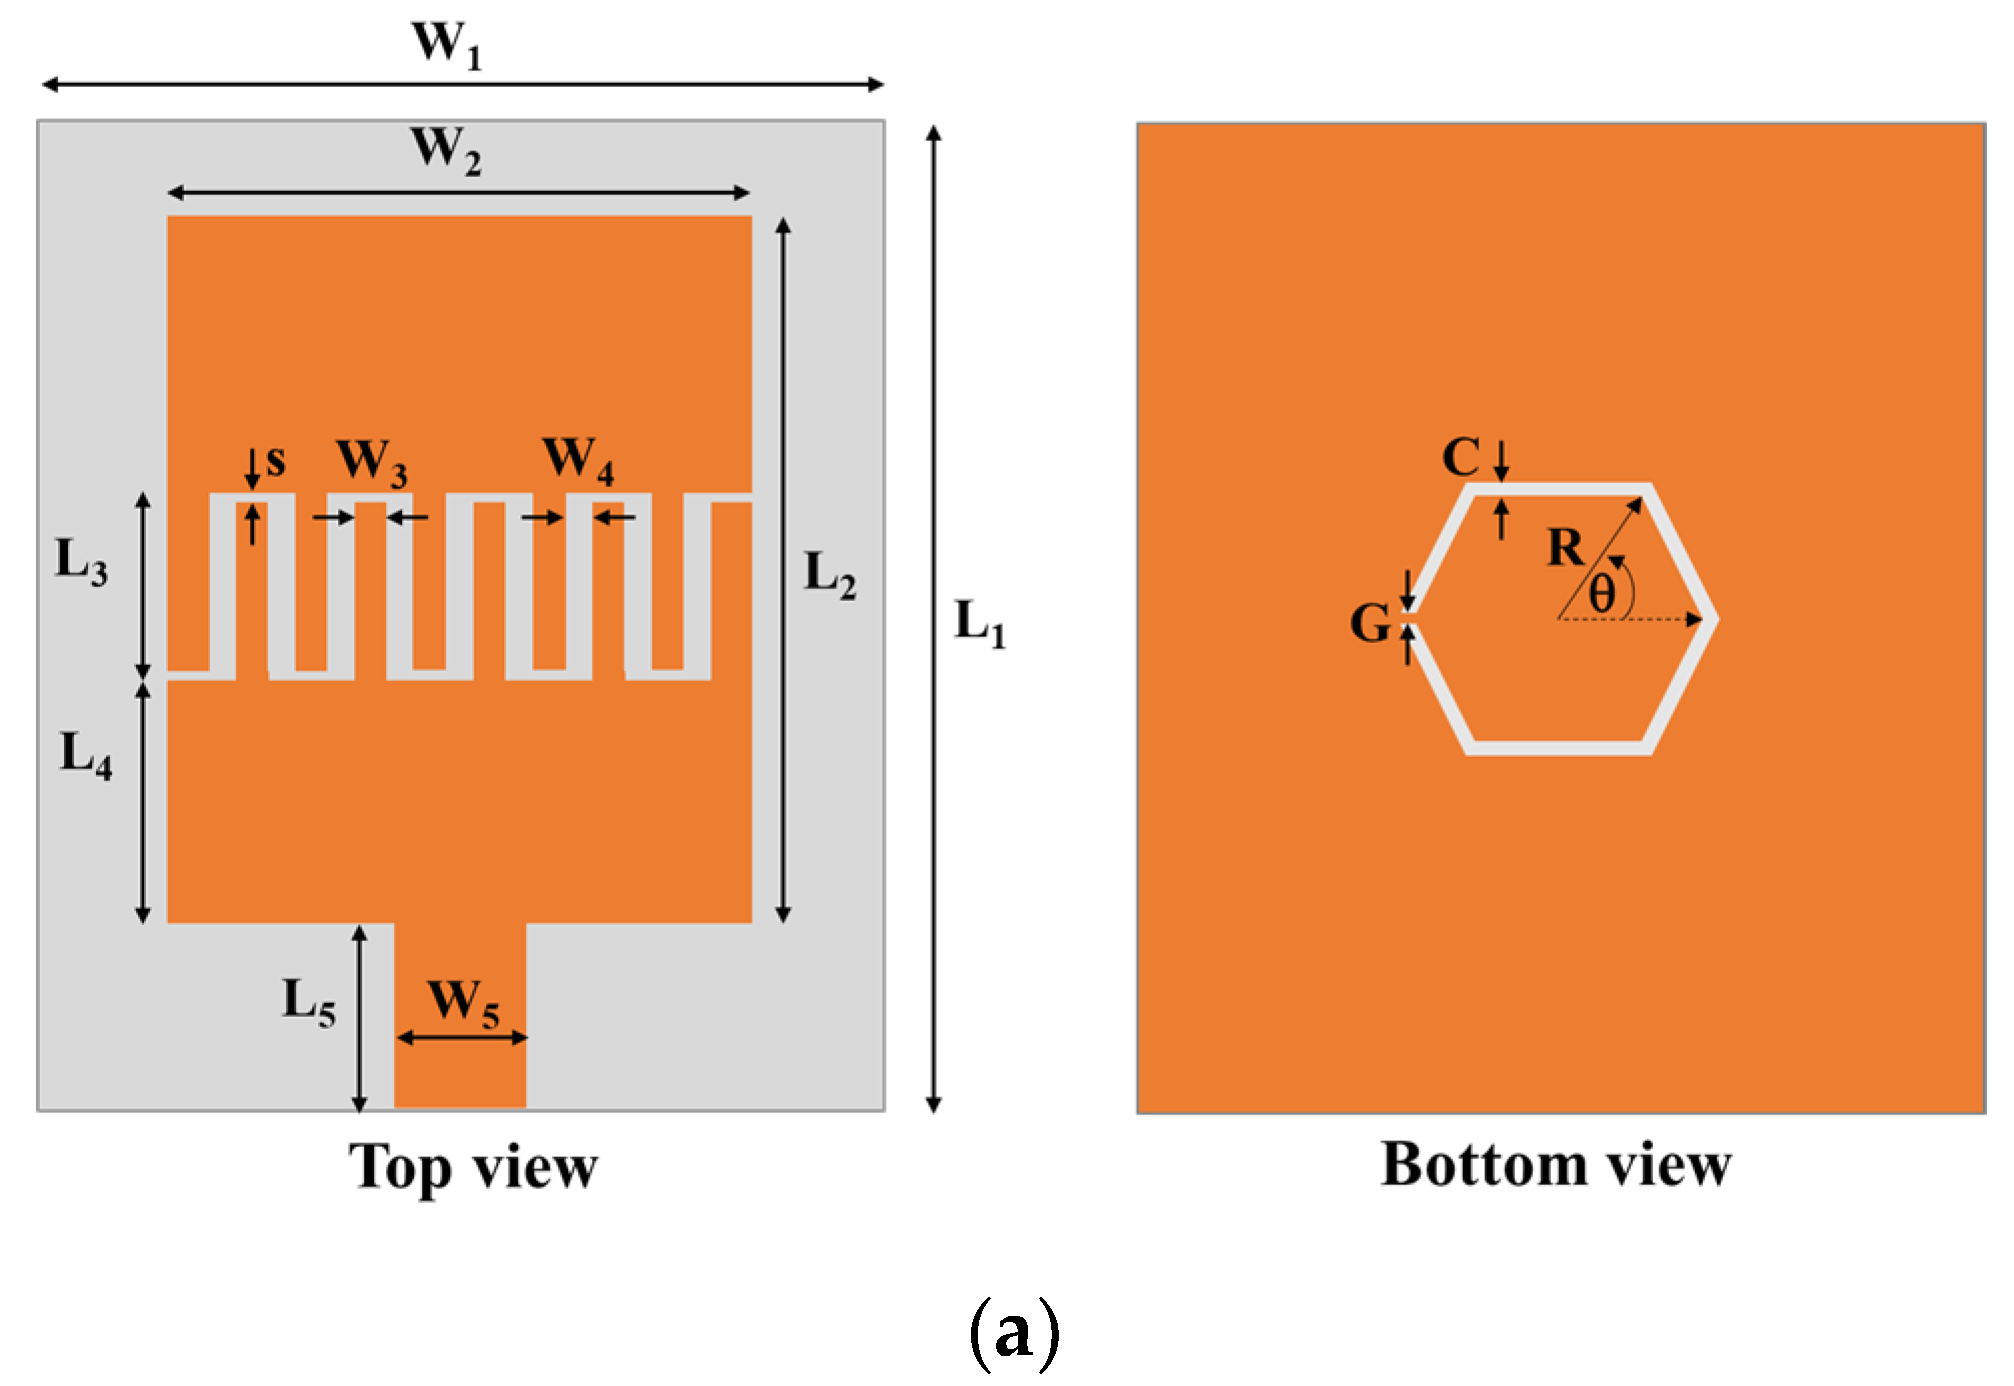
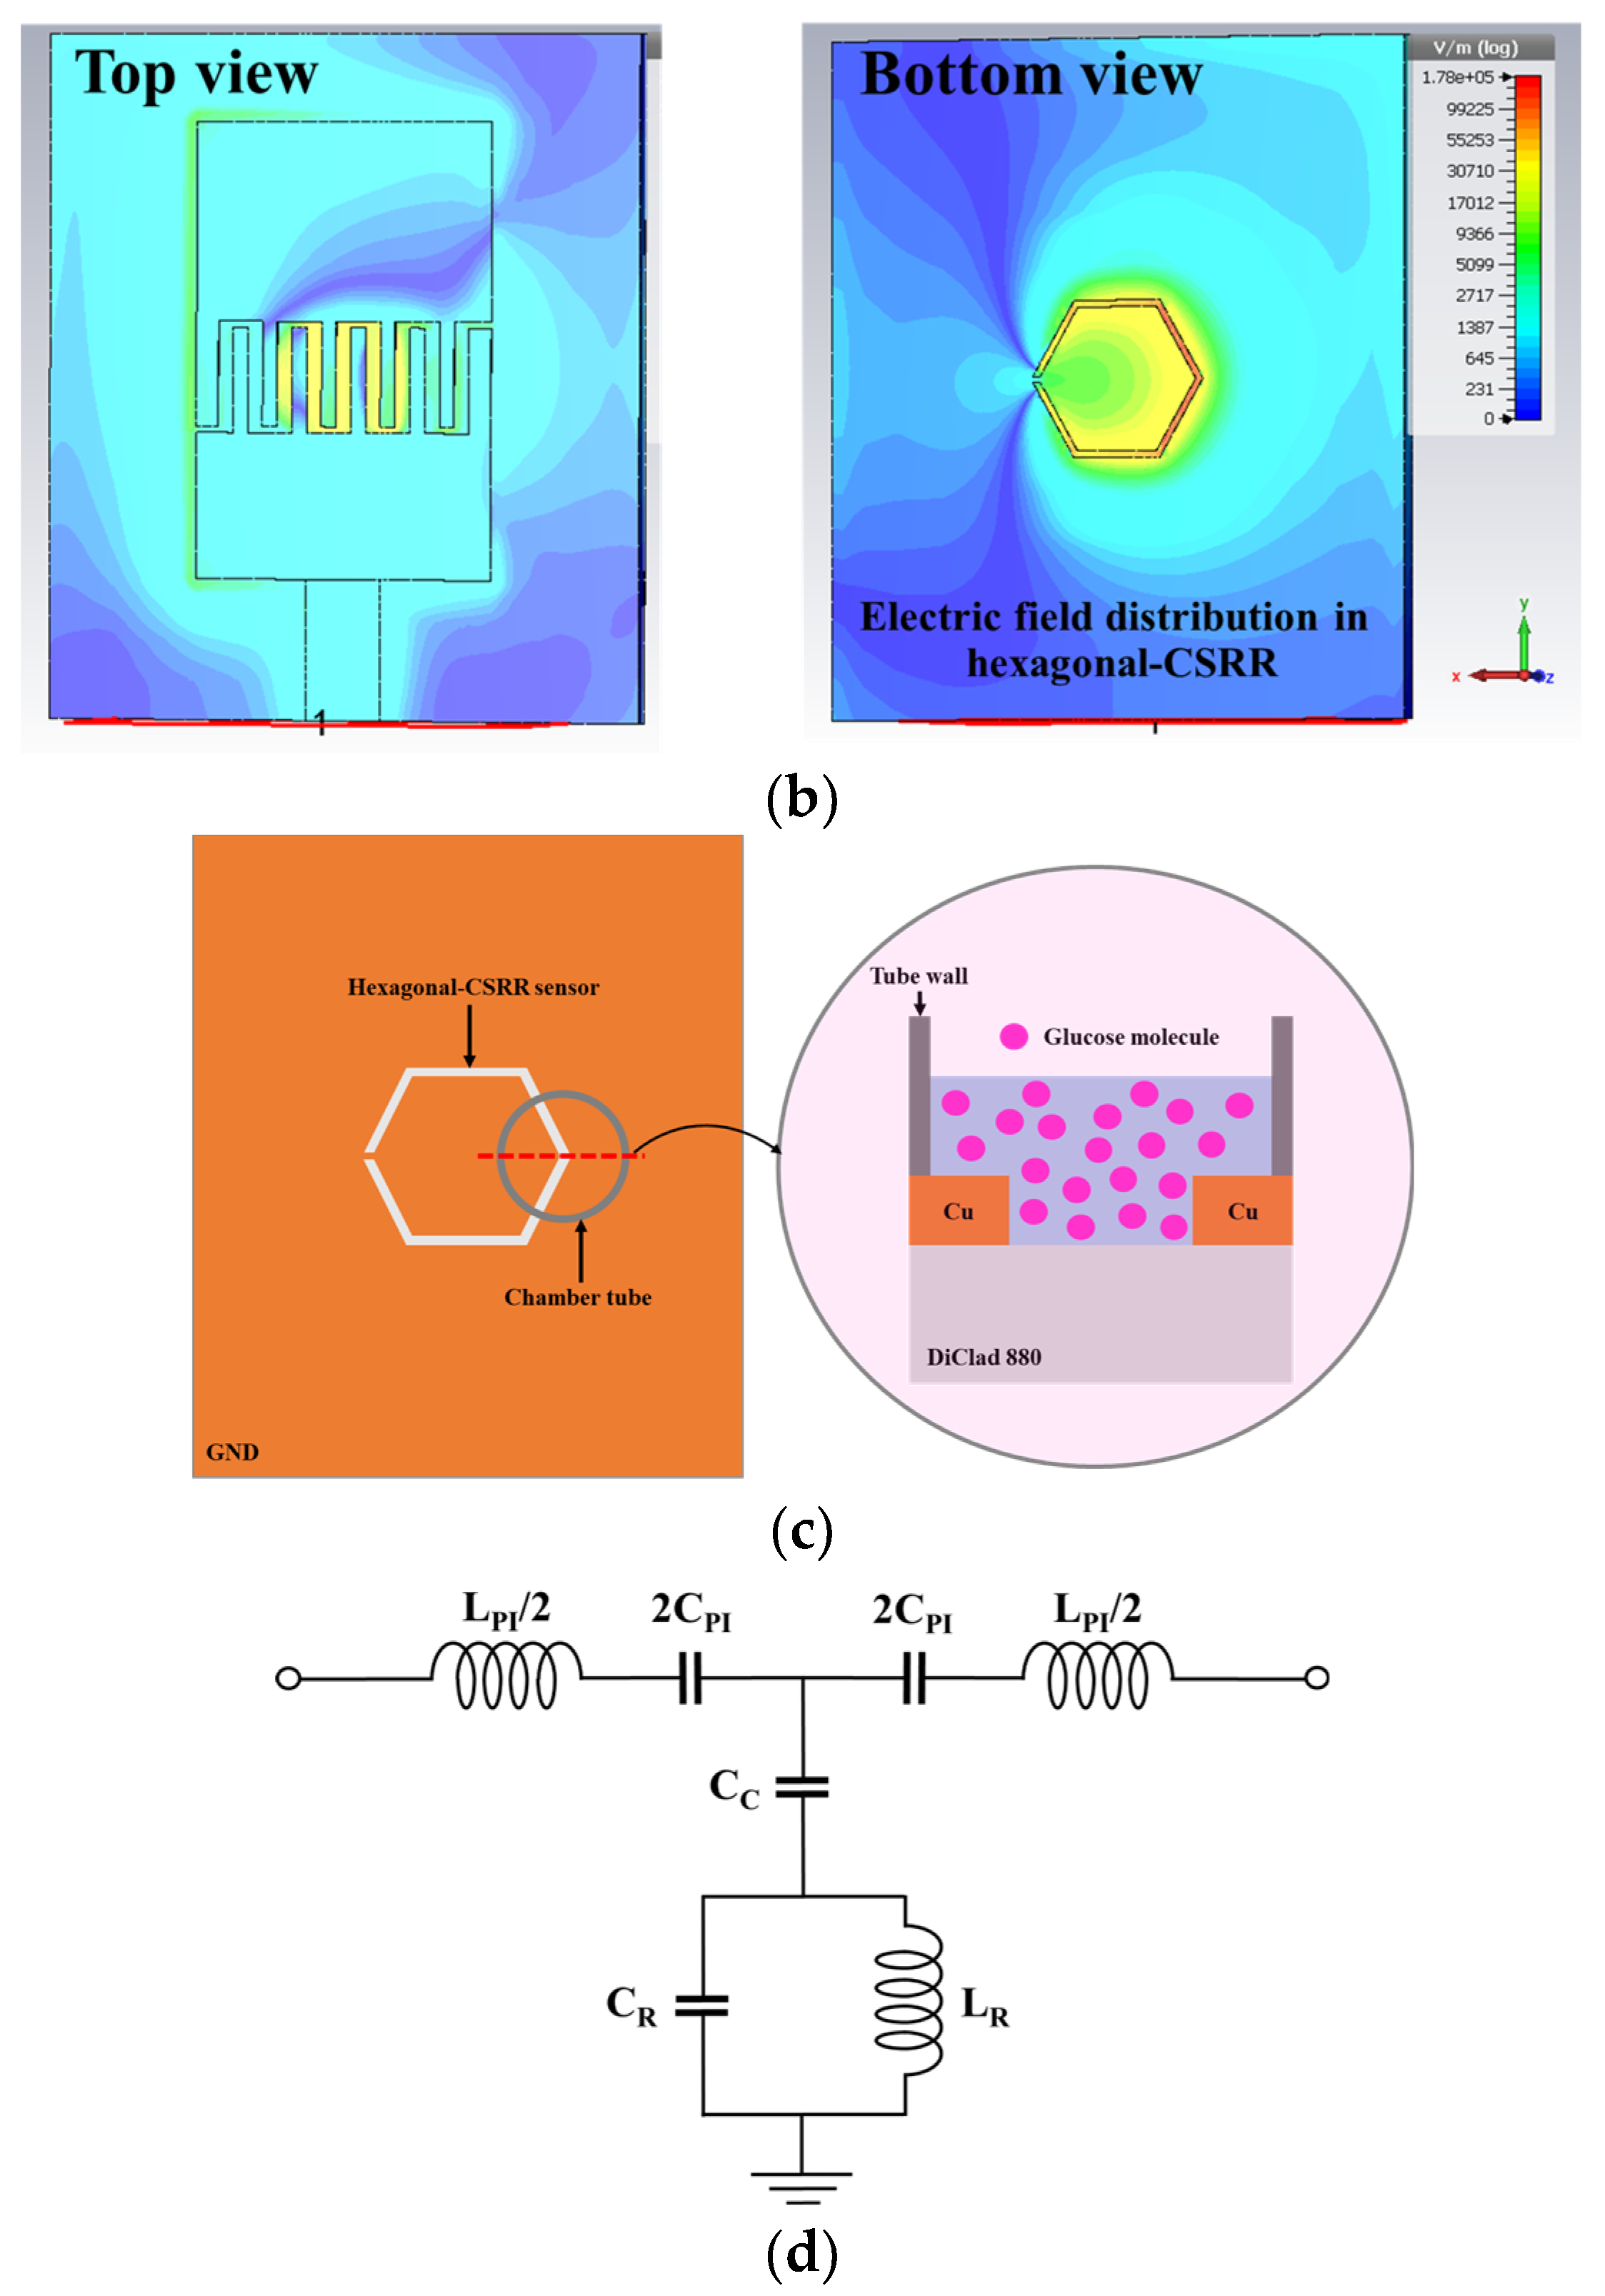
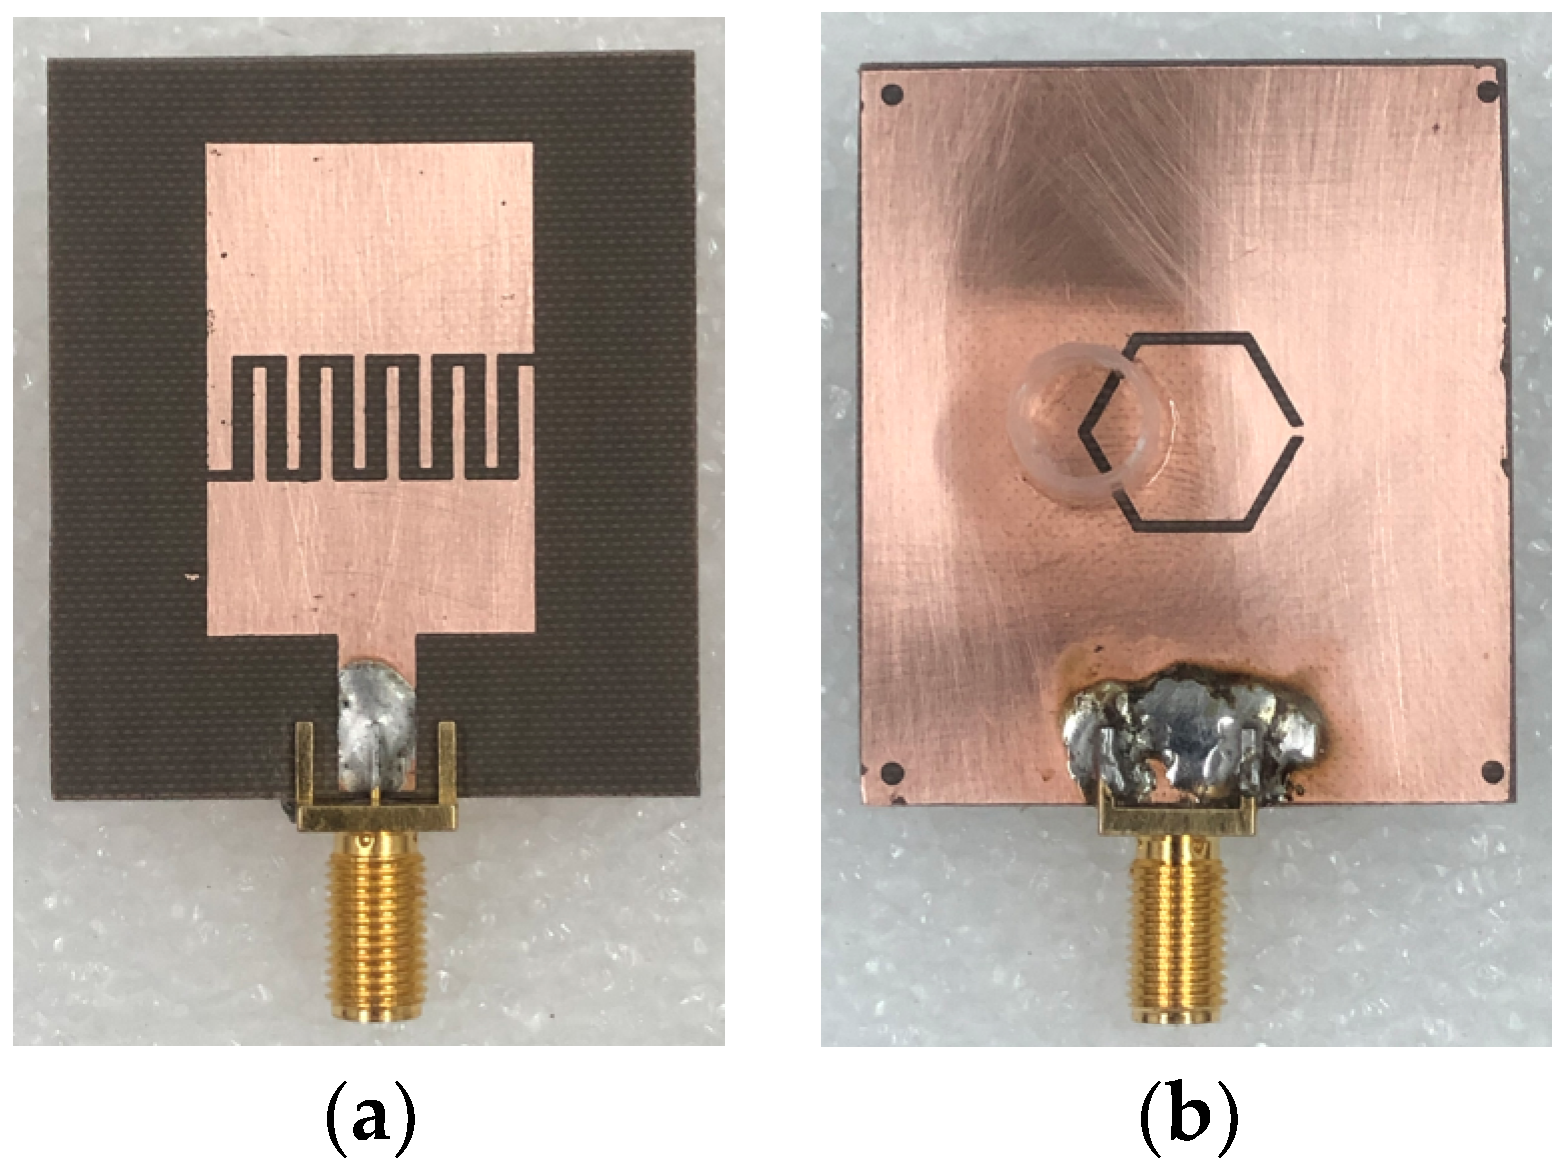
2.1. Design and Fabrication of Prototype Sensors

The proposed planar microwave sensor using an IDC loaded with a HCSRR is shown in Figure 1a. The IDC generated in the patch region is depicted on the left side of Figure 1a, while the HCSRR generated in the ground region is shown on the right side. The right side of the HCSRR has a high concentration of fringing electric fields at resonance, as shown in Figure 1b. A cylindrical polypropylene chamber tube with a diameter of 8.8 mm is installed to cover the sensor’s maximum sensitive area, as shown in Figure 1c. Glucose aqueous solution is introduced into the cylindrical polypropylene chamber, where it is measured by the proposed sensor. This figure also shows a cross-sectional view of the sensor, and the chamber tube is filled with a sample. Figure 1d shows the equivalent circuit model of the proposed microwave sensor [71]. The patch with the interdigital capacitor and feed line can be modeled as a series LC circuit (LPI and CPI). The hexagonal-shaped CSRR slot is modeled as a parallel LC circuit (LR and CR). CC represents the coupling capacitance between the patch with IDC and the hexagonal-shaped CSRR slot ground plane. The resonance frequency (Fr) of the proposed device is determined by the following equation:
F r = 1 2 π L R ( C R + C C )
The sensor is fabricated on a DiClad880 substrate (εr = 2.2, tan δ = 0.0009) with a thickness of 1.6 mm. The dimensions of the sensor structures are as follows: W1 = 40 mm, W2 = 20 mm, W3 = 0.8 mm, W4 = 1.2 mm, W5 = 5 mm, L1 = 45 mm, L2 = 30 mm, L3 = 7.3 mm, L4 = 9.6 mm, L5 = 9.25 mm, S = 0.6, R = 6.4 mm, C = 0.6 mm, G = 0.4 mm, and θ = 60°.
The input of the sensor is attached to an SMA connector for microwave excitation and measurement. A printed circuit board (PCB) method was used to fabricate the sensor at room temperature in a research unit laboratory, which is a low-cost and simple process, as shown in Figure 2a,b.

2.2. Sample Preparation

A range of water–glucose solutions of varying concentrations were created by blending D-glucose powder from Sigma-Aldrich (Saint Louis, MO, USA) with distilled water. Four sets of glucose solutions were prepared, containing concentrations of 35.7, 50, 75, and 150 mg/dL, respectively. The normal range for the blood glucose concentration, or blood sugar, in the body is between 70 and 120 mg/dL. This value can vary slightly depending on the specific laboratory that performs the test and the time of day at which the test is taken. It is worth noting that the concentration of glucose in the body can also vary depending on the time of day and whether or not a person has recently eaten. For example, blood glucose levels tend to be higher after eating a meal. Additionally, the glucose concentration in the body can be affected by various medical conditions, such as diabetes, which can cause abnormal fluctuations in blood sugar levels. Our choice of glucose concentration range was based on covering the levels present in normal, latent, and diabetic subjects. Glucose solutions were prepared in triplicate for each concentration.

2.3. Setup of the Sensor and Measurement Equipment

The setup of the sensor and measuring device is depicted in Figure 3. The sensor is mounted on a foam base and connected to a Vector Network Analyzer (VNA) using a high-frequency cable. The S11 value is then measured and recorded. Before taking measurements, Port 1 of the VNA is calibrated using the short-open-load (SOL) calibration procedure. The measurements were taken at room temperature, starting with a low glucose concentration and gradually increasing it to higher levels.
The test solution is filled into the chamber tube using a micro-pipette. The results are then measured and recorded. After each measurement is completed, the chamber tube is washed and cleaned with DI water. In this study, to ensure reliability and consistency, three measurements were taken for each glucose solution sample at every concentration. For each measurement, 1601 data points were used in the frequency range of 1–5 GHz under different sample tests, such as free space, an empty tube, DI water, and various glucose concentrations. In the measurements, this resulted in a frequency resolution of 2.5 MHz. The measurement results were drawn to compare the Fr and S11 magnitudes at different glucose concentrations and for DI water in the frequency range of 2.9–3.3 GHz.

3. Results

3.1. Reflection Coefficient of Sensor
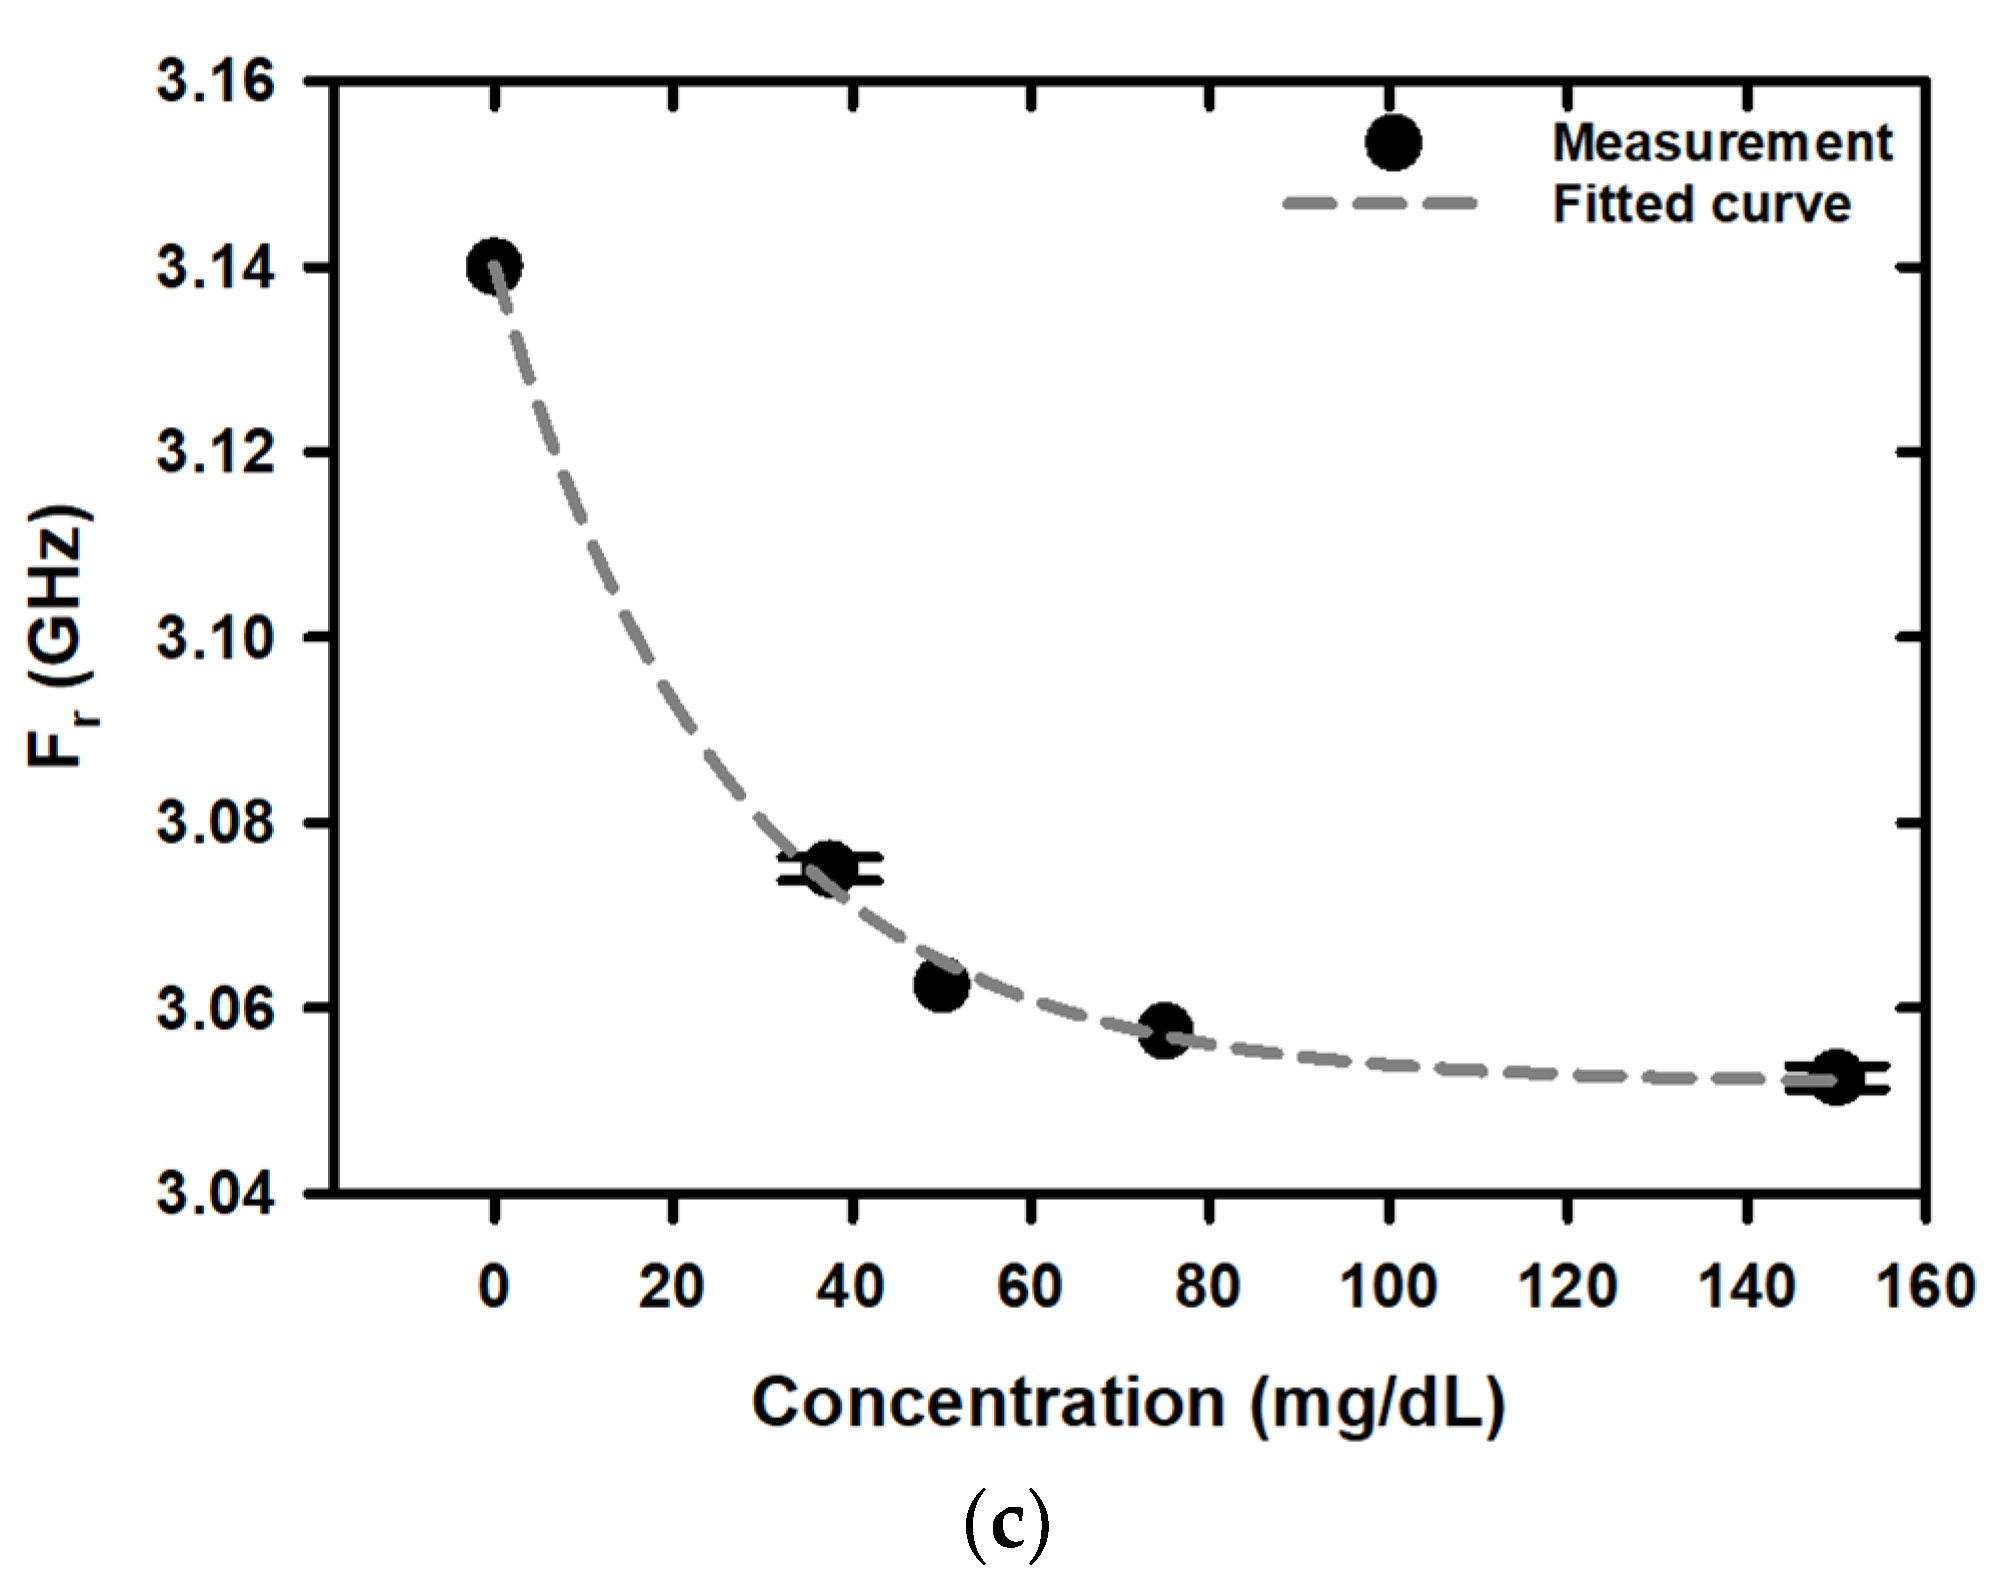
The proposed microwave sensor’s S11 spectra, as depicted in Figure 4, were found to be in good agreement with both simulations and measurements across the frequency range of 1–5 GHz. At the first resonance frequency, the experimental and simulated magnitudes of S11 were −12.30 dB and −9.77 dB, respectively, with a difference of −2.53 dB, representing 20.55%. The experimental and simulation values of resonance frequency are 2.48 GHz and 2.49 GHz, respectively, which is a 0.0125 GHz difference, representing 0.50%. At the second resonance frequency, the magnitudes of S11 in both experimental and simulated data were −15.70 dB and −9.52 dB, respectively, indicating a difference of −6.18 dB, which represents 39.37% of the experimental value. The resonance frequencies obtained from the experimental and simulation data were 3.67 GHz and 3.69 GHz, respectively, showing a difference of 0.02 GHz or 0.55%. The first resonance frequency depends on the values of radian (R) and gap width (C) in the HCSRR, whereas the second resonance frequency is determined by the IDT structure. Figure 5 shows the S11 spectra under different sample tests, such as in free space, an empty tube, DI water, and various glucose concentrations.
The attachment of the chamber tube to the sensor leads to a slight alteration in the magnitude and resonance frequency of peaks 1 and 2, as shown by the measurement results. The magnitude of S11 at peak 1 (2.48 GHz and 2.40 GHz) was −12.30 dB in free space and −16.10 dB in the empty tube test, indicating a difference of −3.80 dB or 30.89%. Additionally, the magnitude of S11 at peak 2 was −15.70 dB in free space and −15.00 dB in the empty tube test, indicating a difference of −0.70 dB or 4.46%. The resonance frequencies obtained from the free space and empty tube at peak 1 were 2.48 GHz and 2.40 GHz, respectively, showing a difference of 0.08 GHz or 3.53%. The resonance frequencies obtained from the free space and empty tube at peak 2 were 3.67 GHz and 3.64 GHz, respectively, showing a difference of 0.03 GHz or 0.82%. The results clearly show that peak 1 has changed significantly more than peak 2, likely because peak 1 is generated by the HCSRR and is more strongly influenced by the chamber tube contact in the gap region of the HCSRR compared to the IDT. As shown in the gray circle in Figure 5, the resonance frequency and magnitude of S11 at peaks 1 and 2 were shifted when measuring DI water and glucose solutions at various concentrations. The results clearly indicate that the resonance frequency at peaks 1 and 2 decreases when the sensor measures the test liquid, as compared to the case of an empty space and empty chamber tube. The measurement results reveal that peak 1 is characterized by a smooth signal, whereas peak 2 exhibits ripple characteristics. This is because both peaks are primarily influenced by the responses of the different sensors. Peak 1 is predominantly influenced by the HCSRR response to the sample solution, while peak 2 is mainly influenced by the response of the IDT to the sample.
Figure 6 displays the response of the sensor signal in the form of the reflection coefficient for peak 1 when measuring DI water and glucose solutions at concentrations of 0, 37.5, 50, 75, and 150 mg/dL. Figure 6a shows the reflection coefficient spectra of the sensor when detecting glucose solutions at various concentrations. The designed microwave sensor uses mathematical sensing models developed through regression analysis to relate the measured S11 level and resonance frequency to the glucose concentration at the peak 1. The magnitude of S11, determined from glucose solution measurements in the 0–150 mg/dL range, was correlated with a three-parameter nonlinear regression model using the power equation. The resulting fitting formula is
S 11 ( dB ) = 1.5404 + 0.0507 ρ 0.1728
A nonlinear relation (R2 = 0.9861) of S11 with the glucose concentration (ρ) in the solution with respect to the reference sample (DI water) is shown in Figure 6b. Meanwhile, the Fr-based fitting formula was correlated with a three-parameter nonlinear regression model using the exponential decay equation, resulting in the following fitting formula:
F r ( GHz ) = 1.0247 E 9 + 42.7617 E 6 e 0.0559 ρ
with R2 = 0.9998, as shown in Figure 6c.
Upon filling the liquid sample into the chamber tube, peak 2 exhibited a marked change in magnitude and resonance frequency in relation to changes in glucose concentration, as shown in Figure 7a. However, the signal of peak 2 (2.9–3.3 GHz) was uneven, so we applied a smoothing method based on robust quadratic regression to smooth it out, as shown in Figure 7a. The method involved dividing the input data into windows and performing a separate regression on each one. This process was carried out to improve the signal’s evenness. The S11 level and resonant frequency at various concentrations of glucose were extracted from the smoothed signal and are plotted in Figure 7b,c, respectively.
The developed microwave sensor utilizes mathematical sensing models, created via regression analysis, to establish the relationship between the measured S11 level and resonance frequency in peak 2, and the concentration of glucose. The fitting formula based on the S11 level is
S 11 ( dB ) = 5.4641 + 0.4842 ρ 0.1705
Figure 7b displays a nonlinear relationship (R2 = 0.9956) between S11 and the glucose concentration (ρ) in the solution, relative to the reference sample of DI water.
The fitting formula derived from the Fr value in peak 2 was correlated with a three-parameter nonlinear regression model using the exponential decay equation. The resulting fitting formula is
F r ( GHz ) = 3.0519 E 9 + 88.1908 E 6 e 0.0380 ρ
with R2 = 0.9979, as shown in Figure 7c.
The measurement results suggest that there is a similar fitting formula describing the relationship between the glucose concentration with the magnitude of S11 and the resonance frequency is obtained from peaks 1 and 2. Peak 1 exhibits a smoother signal compared to peak 2. However, it has a lower signal magnitude and a narrower measurement range when compared to peak 2. Thus, the researchers decided to utilize peak 2 as a basis for analyzing the shift in the S11 magnitude and resonance frequency, as well as the sensor’s sensitivity.
Figure 8a,b show the effect of the glucose concentration on the change in S11 and Fr from their reference values in the range of 0–150 mg/dL, with DI water serving as the reference sample. When examining the relationship between the changes in S11 and Fr from their reference values and the glucose concentration in the range of 0–150 mg/dL, it was found that the resulting relationship equations for both values had the same equation, as shown in Equations (6) and (7), respectively.
S 11 = 0.4792 ρ 0.1718
with R2 = 0.9955.
F r ( MHz ) = 36.7121 E 6 ρ 0.1781
with R2 = 0.9893.
The shifts in the magnitude of both the S11 and Fr parameters, as derived from glucose solution characterization in the range of 0–150 mg/dL, were correlated with a two-parameter nonlinear regression model under the power equation. This indicated that the two parameters changed in the same direction, meaning that as the glucose concentration increased, the shift in the magnitudes of S11 and Fr also increased correspondingly. Therefore, it is possible to select one of the analytical parameters to assess the glucose concentration. The measurement results clearly indicate that the concentration range from 0 mg/dL (pure DI water) to 37.5 mg/dL exhibits the largest shift in the magnitudes of S11 and Fr, compared to the other concentration ranges. This may be due to the comparatively higher variation in the complex dielectric constant of the glucose solution within this concentration range. These findings provide clear evidence of the hydrogen bond (HB) destructuring effect that glucose solutes have on aqueous solutions. Moreover, the complex dielectric constant is subject to change in response to variations in frequency; the frequency-dependent shift of the complex dielectric constant can be attributed to various mechanisms, including glucose tumbling, the rotational polarization of the hydrated water, the reorientation of the HB network water, the rotation of the non-HB water, the hindered translation of water, and intermolecular liberation [72]. However, in this case, the shift in the magnitude of S11 is slightly more accurate than using the shift in Fr due to its higher R2 value. The sensor’s response to the S11 and Fr magnitude values is affected by the complex relative permittivity ( ε r ) of the sample. At resonance, the shift in the magnitude of S11 is a result of changes in the sensor impedance, which, in turn, are influenced by the imaginary component of the complex relative permittivity ( ε r ). Conversely, the change in Fr is influenced by variations in CR, as shown in Figure 1d, which, in turn, result from changes in the real component of the sample solution’s complex relative permittivity ( ε r ). The relationship between the complex relative permittivity and the concentration of the glucose solution at different frequencies (f) can be expressed as follows: ε r ( f ) = ε r ( f ) ε r ( f ) . The equation uses the following variables: ε r for the complex relative permittivity, ε r for the real part of the complex relative permittivity, and ε r for the imaginary part of the complex relative permittivity. The imaginary component of the complex relative permittivity of conducting samples can be decomposed into two contributions, as described by the following equation: ε r ( f ) = ε r d ( f ) ε r σ ( f ) . The two contributions are ε r d , which represents the dielectric relaxation in glucose/loss, and ε r σ , which corresponds to the loss caused by ion drift. At lower frequencies, the loss caused by ion drift can obscure the dielectric contribution, as shown by the following equation: ε r σ = σ / ( ε 0 2 π f ) , where σ represents the conductivity, ε 0 represents the electric constant, and f represents the frequency. The dielectric constants of electrolyte–water solutions can be described by the following equation: ε r = ε r w α c , where ε r w represents the dielectric constant of deionized (DI) water, c is the concentration of the electrolyte solution, and α is a phenomenological ion-specific parameter.

3.2. Sensitivity

Sensitivity is a critical factor in determining the response capability of a sensor, and it can be calculated as the ratio of the change in the magnitude of S11 and Fr to the change in glucose concentration. The higher the ratio, the better the sensor’s sensitivity. A high ratio indicates that the sensor is highly sensitive and can detect even small changes in glucose concentrations. The sensitivity calculations in this work, based on the S11 and Fr values, are presented in Equations (8) and (9), respectively.
Sensitivity   ( S S 11 ) = S 11 ρ
Sensitivity   ( S F r ) = F r ρ
We found that the sensor’s sensitivity, obtained by measuring S11 and Fr at varying glucose concentrations, displays a nonlinear relationship, as depicted in Figure 9. The fitting formulas for sensitivity based on S11 and Fr were correlated with three-parameter nonlinear regression models using the exponential decay equation, as presented in Equations (10) and (11), respectively. The R2 values for the models were 0.9921 and 0.9934, respectively.
S S 11 = 0.6986 e 0.0935 ρ + 0.0018
S F r = 11.81 E 6 e 0.0512 ρ + 24.3433 E 3

3.3. Comparison of the Microwave Sensor for Glucose Sensing

In order to provide a clearer understanding of the performance data for the proposed microwave sensors, we have included a comparison of their performance with that of various other structural microwave sensors, as outlined in Table 1. The majority of microwave sensors proposed for glucose sensing are based on measurements of varying S11, the transmission coefficient (S21), and Fr. The performance data being compared include information on the sensor’s structure, concentration range (ρ), operating frequency, sensitivity (S), and number of ports. The sensor structures in [32,33,36,65,66,67,68,69,70] are two-port structures, with a resonator being utilized for sensing. Based on the data, the sensitivity of the microwave sensor in measuring the glucose concentration ranges from 0.005 dB to 17.2 dB for the magnitude of the S-parameter, and from 5 Hz to 1.73 MHz for the resonant frequency. However, these values vary depending on the operating frequency and specific concentration range of the sample being measured. The NSRR structure with PLL and triple-pole CSRR, as described in [66,70], exhibits high sensitivity while utilizing a low sample volume. However, both structures require two ports and the NSRR structure with PLL necessitates active control, which results in increased equipment and system complexity. In contrast, the microwave sensors described in [34,35,37] operate using a single port, which simplifies the system setup and reduces the overall complexity, but these sensors still have low sensitivity and certain sensors still possess a lump component, making the construction of the device more complicated. Compared to single-port-based structural sensors, the sensors presented in this paper exhibit higher sensitivity, while also boasting a simpler process and operation than two-port sensor structures.

4. Conclusions

This research presents the design and evaluation of a microwave sensor for the measurement of glucose levels in aqueous solutions. The sensor utilizes a planar interdigital capacitor that is loaded with a hexagonal complementary split-ring resonator, enabling the generation of an intense electric field that can effectively detect changes in the dielectric characteristics of the specimen being analyzed. The simulation and measured results of the S11 spectra were in good agreement over the frequency range of 1 GHz to 5 GHz. The research showed a nonlinear relationship between the glucose concentrations and both S11 and Fr, with maximum sensitivity of 0.023 dB and 1.73 MHz per mg/dL, respectively. The proposed microwave sensor operates using a single port, featuring a simple structure and operation, small size, and high sensitivity, making it well-suited for measuring glucose levels and other medical substances.

Author Contributions

Conceptualization, S.H.; methodology, S.H. and B.B.; software, S.H.; validation, S.H.; formal analysis, S.H.; investigation, S.H.; resources, S.H. and B.B.; data curation, S.H.; writing—original draft preparation, S.H. and B.B.; writing—review and editing, S.H. and B.B.; visualization, S.H.; supervision, S.H.; project administration, S.H.; funding acquisition, S.H. All authors have read and agreed to the published version of the manuscript.

Funding

This project is funded by the National Research Council of Thailand (NRCT) and Mahasarakham University: N42A650337.

Institutional Review Board Statement

Not applicable.

Informed Consent Statement

Not applicable.

Data Availability Statement

Not applicable.

Conflicts of Interest

The authors declare no conflict of interest.

References

  1. World Health Organization. World Health Statistics 2020: Monitoring Health for the SDGs, Sustainable Development Goals. Available online: https://apps.who.int/iris/rest/bitstreams/1277753/retrieve (accessed on 10 April 2023).
  2. Scully, T. Diabetes in numbers. Nature 2012, 485, S2–S3. [Google Scholar] [CrossRef] [PubMed]
  3. Godsland, I.F.; Walton, C. Maximizing the success rate of minimal model insulin sensitivity measurement in humans: The importance of basal glucose levels. Clin. Sci. 2001, 101, 1–9. [Google Scholar] [CrossRef]
  4. McLachlan, K.; Jenkins, A.; O’Neal, D. The role of continuous glucose monitoring in clinical decision-making in diabetes in pregnancy. Aust. N. Z. J. Obstet. Gynaecol. 2007, 47, 186–190. [Google Scholar] [CrossRef] [PubMed]
  5. Lin, T.; Gal, A.; Mayzel, Y.; Horman, K.; Bahartan, K. Non-invasive glucose monitoring: A review of challenges and recent advances. Curr. Trends Biomed. Eng. Biosci. 2017, 6, 555696. [Google Scholar] [CrossRef]
  6. Burt, M.G.; Roberts, G.W.; Aguilar-Loza, N.R.; Stranks, S.N. Brief report: Comparison of continuous glucose monitoring and finger-prick blood glucose levels in hospitalized patients administered basal-bolus insulin. Diabetes Technol. 2013, 15, 241–245. [Google Scholar] [CrossRef]
  7. Boyd, R.; Leigh, B.; Stuart, P. Capillary versus venous bedside blood glucose estimations. Emerg. Med. J. 2005, 22, 177–179. [Google Scholar] [CrossRef]
  8. Tierney, M.J.; Tamada, J.A.; Potts, R.O.; Jovanovic, L.; Garg, S.; Cygnus Research Team. Clinical evaluation of the GlucoWatch biographer: A continual, non-invasive glucose monitor for patients with diabetes. Biosens. Bioelectron. 2001, 16, 621–629. [Google Scholar] [CrossRef]
  9. Wang, G.; Mintchev, M.P. Development of wearable semi-invasive blood sampling devices for continuous glucose monitoring: A survey. Engineering 2013, 5, 42. [Google Scholar] [CrossRef]
  10. Gingras, V.; Smaoui, M.R.; Cameli, C.; Messier, V.; Ladouceur, M.; Legault, L.; Rabasa-Lhoret, R. Impact of erroneous meal insulin bolus with dual-hormone artificial pancreas using a simplified bolus strategy—A randomized controlled trial. Sci. Rep. 2018, 8, 2621. [Google Scholar] [CrossRef]
  11. Phillip, M.; Battelino, T.; Atlas, E.; Kordonouri, O.; Bratina, N.; Miller, S.; Biester, T.; Stefanija, M.A.; Muller, I.; Nimri, R.; et al. Nocturnal glucose control with an artificial pancreas at a diabetes camp. N. Engl. J. Med. 2013, 368, 824–833. [Google Scholar] [CrossRef]
  12. Yadav, J.; Rani, A.; Singh, V.; Murari, B.M. Prospects and limitations of non-invasive blood glucose monitoring using nearinfrared spectroscopy. Biomed. Signal Process. 2015, 18, 214–227. [Google Scholar] [CrossRef]
  13. Goodarzi, M.; Saeys, W. Selection of the most informative near infrared spectroscopy wavebands for continuous glucose monitoring in human serum. Talanta 2016, 146, 155–165. [Google Scholar] [CrossRef] [PubMed]
  14. Spegazzini, N.; Barman, I.; Dingari, N.C.; Pandey, R.; Soares, J.S.; Ozaki, Y.; Dasari, R.R. Spectroscopic approach for dynamic bioanalyte tracking with minimal concentration information. Sci. Rep. 2014, 4, 7013. [Google Scholar] [CrossRef] [PubMed]
  15. Kuroda, M.; Shinke, T.; Otake, H.; Sugiyama, D.; Takaya, T.; Takahashi, H.; Terashita, D.; Uzu, K.; Tahara, N.; Kashiwagi, D.; et al. Effects of daily glucose fluctuations on the healing response to everolimus-eluting stent implantation as assessed using continuous glucose monitoring and optical coherence tomography. Cardiovasc. Diabetol. 2016, 15, 79. [Google Scholar] [CrossRef]
  16. Sim, J.Y.; Ahn, C.G.; Jeong, E.J.; Kim, B.K. In vivo microscopic photoacoustic spectroscopy for non-invasive glucose monitoring invulnerable to skin secretion products. Sci. Rep. 2018, 8, 1059. [Google Scholar] [CrossRef]
  17. Lipani, L.; Dupont, B.G.R.; Doungmene, F.; Marken, F.; Tyrrell, R.M.; Guy, R.H.; Ilie, A. Non-invasive, transdermal, path-selective and specific glucose monitoring via a graphene-based platform. Nat. Nanotechnol. 2018, 13, 504–511. [Google Scholar] [CrossRef]
  18. Kim, J.; Campbell, A.S.; Wang, J. Wearable non-invasive epidermal glucose sensors: A review. Talanta 2018, 177, 163–170. [Google Scholar] [CrossRef]
  19. Malchoff, C.D.; Shoukri, K.; Landau, J.I.; Buchert, J.M. A novel noninvasive blood glucose monitor. Diabetes Care 2002, 25, 2268–2275. [Google Scholar] [CrossRef]
  20. de Castro, L.F.; de Freitas, S.V.; Duarte, L.C.; de Souza, J.A.C.; Paixão, T.R.L.C.; Coltro, W.K.T. Salivary diagnostics on paper microfluidic devices and their use as wearable sensors for glucose monitoring. Anal. Bioanal. Chem. 2019, 411, 4919–4928. [Google Scholar] [CrossRef]
  21. Karyakin, A.A.; Nikulina, S.V.; Vokhmyanina, D.V.; Karyakina, E.E.; Anaev, E.K.H.; Alexander, G.; Chuchalin, A.G. Non-invasive monitoring of diabetes through analysis of the exhaled breath condensate (aerosol). Electrochem. Commun. 2017, 83, 81–84. [Google Scholar] [CrossRef]
  22. Karpova, E.V.; Shcherbacheva, E.V.; Galushin, A.A.; Vokhmyanina, D.V.; Karyakina, E.E.; Karyakin, A.A. Noninvasive diabetes monitoring through continuous analysis of sweat using flow-through glucose biosensor. Anal. Chem. 2019, 91, 3778–3783. [Google Scholar] [CrossRef] [PubMed]
  23. Bhide, A.; Muthukumar, S.; Saini, A.; Prasad, S. Simultaneous lancet-free monitoring of alcohol and glucose from low-volumes of perspired human sweat. Sci. Rep. 2018, 8, 6507. [Google Scholar] [CrossRef] [PubMed]
  24. Bariya, M.; Nyein, H.Y.Y.; Javey, A. Wearable sweat sensors. Nat. Electron. 2018, 1, 160–171. [Google Scholar] [CrossRef]
  25. Sempionatto, J.R.; Brazaca, L.C.; García-Carmona, L.; Bolat, G.; Campbell, A.S.; Martin, A.; Tang, G.; Shah, R.; Mishra, R.K.; Kim, J.; et al. Eyeglasses-based tear biosensing system: Non-invasive detection of alcohol, vitamins and glucose. Biosens. Bioelectron. 2019, 137, 161–170. [Google Scholar] [CrossRef] [PubMed]
  26. Ishimaru, A. Electromagnetic Wave Propagation, Radiation, and Scattering: From Fundamentals to Applications; John Wiley and Sons: Hoboken, NJ, USA, 2017. [Google Scholar]
  27. Karacolak, T.; Moreland, E.C.; Topsakal, E. Cole cole model for glucose dependent dielectric properties of blood plasma for continuous glucose monitoring. Microw. Opt. Technol. Lett. 2013, 55, 1160–1164. [Google Scholar] [CrossRef]
  28. Jang, C.; Park, J.K.; Lee, H.J.; Yun, G.H.; Yook, J.G. Temperature-corrected fluidic glucose sensor based on microwave resonator. Sensors 2018, 18, 3850. [Google Scholar] [CrossRef]
  29. Yilmaz, T.; Foster, R.; Hao, Y. Towards accurate dielectric property retrieval of biological tissues for blood glucose monitoring. IEEE Trans. Microw. Theory Tech. 2014, 62, 3193–3204. [Google Scholar] [CrossRef]
  30. Takeuchi, K.; Kim, B. Functionalized microneedles for continuous glucose monitoring. Nano Converg. 2018, 5, 28. [Google Scholar] [CrossRef]
  31. Pai, P.P.; De, A.; Banerjee, S. Accuracy enhancement for noninvasive glucose estimation using dual-wavelength photoacoustic measurements and kernel-based calibration. IEEE Trans. Instrum. Meas. 2018, 67, 126–136. [Google Scholar] [CrossRef]
  32. Yilmaz, T.; Foster, R.; Hao, Y. Broadband tissue mimicking phantoms and a patch resonator for evaluating noninvasive monitoring of blood glucose levels. IEEE Trans. Antennas Propag. 2014, 62, 3064–3075. [Google Scholar] [CrossRef]
  33. Baghbani, R.; Rad, M.A.; Pourziad, A. Microwave sensor for non-invasive glucose measurements design and implementation of a novel linear. IET Wirel. Sens. Syst. 2015, 5, 51–57. [Google Scholar] [CrossRef]
  34. Turgul, V.; Kale, I. Simulating the effects of skin thickness and fingerprints to highlight problems with non-invasive RF blood glucose sensing from fingertips. IEEE Sens. J. 2017, 17, 7553–7560. [Google Scholar] [CrossRef]
  35. Ebrahimi, A.; Scott, J.; Ghorbani, K. Microwave reflective biosensor for glucose level detection in aqueous solutions. Sens. Actuators A Phys. 2020, 301, 111662. [Google Scholar] [CrossRef]
  36. Islam, M.T.; Hoque, A.; Almutairi, A.F.; Amin, N. Left-handed metamaterial-inspired unit cell for S-band glucose sensing application. Sensors 2019, 19, 169. [Google Scholar] [CrossRef]
  37. Vrba, J.; Karch, J.; Vrba, D. Phantoms for Development of Microwave Sensors for Noninvasive Blood Glucose Monitoring. Inter. J. Antenna Propag. 2015, 2015, 570870. [Google Scholar] [CrossRef]
  38. Choi, H.; Naylon, J.; Luzio, S.; Beutler, J.; Birchall, J.; Martin, C.; Porch, A. Design and in vitro interference test of microwave noninvasive blood glucose monitoring sensor. IEEE Trans. Microw. Theory Tech. 2015, 63 Pt 1, 3016–3025. [Google Scholar] [CrossRef] [PubMed]
  39. Govind, G.; Akhtar, M.J. Metamaterial-inspired microwave microfluidic sensor for glucose monitoring in aqueous solutions. IEEE Sens. J. 2019, 19, 11900–11907. [Google Scholar] [CrossRef]
  40. Baghelani, M.; Abbasi, Z.; Daneshmand, M. Light, non-invasive continuous-time glucose monitoring system using a chipless printable sensor based on split ring microwave resonators. Sci. Rep. 2020, 10, 12980. [Google Scholar] [CrossRef] [PubMed]
  41. Mohammadi, S.; Nadaraja, A.V.; Roberts, D.J.; Zarifi, M.H. Real-time and hazard-free water quality monitoring based on microwave planar resonator sensor. Sens. Actuators A Phys. 2020, 303, 111663. [Google Scholar] [CrossRef]
  42. Govind, G.; Akhtar, M.J. Design of an ELC resonator-based reusable RF microfluidic sensor for blood glucose estimation. Sci. Rep. 2020, 10, 18842. [Google Scholar] [CrossRef]
  43. Reyes-Vera, E.; Acevedo-Osorio, G.; Arias-Correa, M.; Senior, D.E. Submersible printed sensor based on a monopole-coupled split ring resonator for permittivity characterization. Sensors 2019, 19, 1936. [Google Scholar] [CrossRef] [PubMed]
  44. Abedeen, Z.; Agarwal, P. Microwave sensing technique-based label-free and real-time planar glucose analyzer fabricated on FR4. Sens. Actuators A Phys. 2018, 279, 132–139. [Google Scholar] [CrossRef]
  45. Harnsoongnoen, S.; Wanthong, A.; Charoen-In, U.; Siritaratiwat, A. Planar microwave sensor for detection and discrimination of aqueous organic and inorganic solutions. Sens. Actuators B Chem. 2018, 271, 300–305. [Google Scholar] [CrossRef]
  46. Harnsoongnoen, S.; Wanthong, A. Real-time monitoring of sucrose, sorbitol, D-glucose and D-fructose concentration by electromagnetic sensing. Food Chem. 2017, 232, 566–570. [Google Scholar] [CrossRef]
  47. Harnsoongnoen, S.; Wanthong, A. Coplanar waveguide transmission line loaded with electric-LC resonator for determination of glucose concentration sensing. IEEE Sens. J. 2017, 17, 1635–1640. [Google Scholar] [CrossRef]
  48. Sethi, W.; Ibrahim, A.; Issa, K.; Albishi, A.; Alshebeili, S. A new approach to determining liquid concentration using multiband annular ring microwave sensor and polarity correlator. Electronics 2020, 9, 1616. [Google Scholar] [CrossRef]
  49. Xiao, X.; Li, Q. A noninvasive measurement of blood glucose concentration by UWB microwave spectrum. IEEE Antennas Wirel. Propag. Lett. 2017, 16, 1040–1043. [Google Scholar] [CrossRef]
  50. Babajanyan, A.; Melikyan, H.; Kim, S.; Kim, J.; Lee, K.; Friedman, B. Real-time noninvasive measurement of glucose concentration using a microwave biosensor. J. Sens. 2010, 2010, 452163. [Google Scholar]
  51. Chretiennot, T.; Dubuc, D.; Grenier, K. Microwave-based microfuidic sensor for non-destructive and quantitative glucose monitoring in aqueous solution. Sensors 2016, 16, 1733. [Google Scholar] [CrossRef]
  52. Hofmann, M.; Fischer, G.; Weigel, R.; Kissinger, D. Microwave-based noninvasive concentration measurements for biomedical applications. IEEE Trans. Microw. Theory Tech. 2013, 61, 2195–2204. [Google Scholar] [CrossRef]
  53. Kumari, R.; Patel, P.N.; Yadav, R. An ENG resonator-based microwave sensor for the characterization of aqueous glucose. J. Phys. D Appl. Phys. 2018, 51, 075601. [Google Scholar] [CrossRef]
  54. Kim, N.Y.; Adhikari, K.K.; Dhakal, R.; Chuluunbaatar, Z.; Wang, C.; Kim, E.S. Rapid, sensitive, and reusable detection of glucose by a robust radiofrequency integrated passive device biosensor chip. Sci. Rep. 2015, 5, 7807. [Google Scholar] [CrossRef] [PubMed]
  55. Adhikari, K.K.; Kim, E.S.; Kim, N.Y. Multiparameter microwave characterization and probing of ultralow glucose concentration using a microfabricated biochip. Micromachines 2016, 7, 93. [Google Scholar] [CrossRef] [PubMed]
  56. Karnaushenko, D.; Baraban, L.; Ye, D.; Uguz, I.; Mendes, R.G.; Rümmeli, M.H.; de Visser, J.A.; Schmidt, O.G.; Cuniberti, G.; Makarov, D. Monitoring microbial metabolites using an inductively coupled resonance circuit. Sci. Rep. 2015, 5, 12878. [Google Scholar] [CrossRef] [PubMed]
  57. Abduljabar, A.A.; Clark, N.; Lees, J.; Porch, A. Dual mode microwave microfluidic sensor for temperature variant liquid characterization. IEEE Trans. Microw. Theory Tech. 2017, 65, 2572–2582. [Google Scholar] [CrossRef]
  58. Pfützner, A.; Schipper, C.; Ramljak, S.; Flacke, F.; Sieber, J.; Forst, T.; Musholt, P.B. Evaluation of the effects of insufficient blood volume samples on the performance of blood glucose self-test meters. J. Diabetes Sci. Technol. 2013, 7, 1522–1529. [Google Scholar] [CrossRef]
  59. Kumar, A.; Wang, C.; Meng, F.-Y.; Zhou, Z.-L.; Zhao, M.; Yan, G.-F.; Kim, E.-S.; Kim, N.-Y. High-sensitivity, quantified, linear and mediator-free resonator-based microwave biosensor for glucose detection. Sensors 2020, 20, 4024. [Google Scholar] [CrossRef]
  60. Kandwal, A.; Igbe, T.; Li, J.; Liu, Y.; Li, S.; Liu, L.W.Y.; Nie, Z. Highly sensitive closed loop enclosed split ring biosensor with high field confinement for aqueous and blood-glucose measurements. Sci. Rep. 2020, 10, 4081. [Google Scholar] [CrossRef]
  61. Odabashyan, L.; Babajanyan, A.; Baghdasaryan, Z.; Kim, S.; Kim, J.; Friedman, B.; Lee, J.-H.; Lee, K. Real-time noninvasive measurement of glucose concentration using a modified Hilbert shaped microwave sensor. Sensors 2019, 19, 5525. [Google Scholar] [CrossRef]
  62. Adhikari, K.K.; Kim, N.Y. Ultrahigh-sensitivity mediator-free biosensor based on a microfabricated microwave resonator for the detection of micromolar glucose concentrations. IEEE Trans. Microw. Theory Tech. 2016, 64, 319–327. [Google Scholar] [CrossRef]
  63. Kim, N.; Dhakal, R.; Adhikari, K.; Kim, E.; Wang, C. A reusable robust radio frequency biosensor using microwave resonator by integrated passive device technology for quantitative detection of glucose level. Biosens. Bioelectron. 2015, 67, 687–693. [Google Scholar] [CrossRef] [PubMed]
  64. Park, H.; Seo Yoon, H.; Patil, U.; Anoop, R.; Lee, J.; Lim, J.; Lee, W.; Chan Jun, S. Radio frequency based label-free detection of glucose. Biosens. Bioelectron. 2014, 54, 141–145. [Google Scholar] [CrossRef] [PubMed]
  65. Omer, A.E.; Shaker, G.; Safavi-Naeini, S.; Kokabi, H.; Alquié, G.; Deshours, F.; Shubair, R.M. Low-cost portable microwave sensor for non-invasive monitoring of blood glucose level: Novel design utilizing a four-cell CSRR hexagonal configuration. Sci. Rep. 2020, 10, 15200. [Google Scholar] [CrossRef] [PubMed]
  66. Omer, A.E.; Shaker, G.; Safavi-Naeini, S.; Alquie, G.; Deshours, F.; Kokabi, H.; Shubair, R.M. Non-invasive real-time monitoring of glucose level using novel microwave biosensor based on triple-pole CSRR. IEEE Trans. Biomed. Circuits Syst. 2020, 14, 1407–1420. [Google Scholar] [CrossRef]
  67. Omer, A.E.; Gigoyan, S.; Shaker, G.; Safavi-Naeini, S. WGM-based sensing of characterized glucose- aqueous solutions at mm-waves. IEEE Access 2020, 8, 38809–38825. [Google Scholar] [CrossRef]
  68. Omer, A.E.; Shaker, G.; Safavi-Naeini, S.; Ngo, K.; Shubair, R.M.; Alquié, G.; Deshours, F.; Kokabi, H. Multiple-cell microfluidic dielectric resonator for liquid sensing applications. IEEE Sens. J. 2021, 21, 6094–6104. [Google Scholar] [CrossRef]
  69. Qureshi, S.A.; Abidin, Z.Z.; Elamin, N.I.M.; Majid, H.A.; Ashyap, A.Y.I.; Nebhen, J.; Kamarudin, M.R.; See, C.H.; Abd-Alhameed, R.A. Glucose level detection using millimetre-wave metamaterial-inspired resonator. PLoS ONE 2022, 17, e0269060. [Google Scholar] [CrossRef]
  70. Fu, X.; Wu, J.; Wang, X.; Gu, X.; Wang, C.; Wu, Y.; Liang, J. NSRR microwave sensor based on PLL technology for glucose detection. IEEE Trans. Microw. Theory Tech. 2023, 71, 763–772. [Google Scholar] [CrossRef]
  71. Gupta, A.; Sharma, S.K.; Chaudhary, R.K. A compact dual-mode metamaterial-inspired antenna using rectangular type CSRR. Prog. Electromagn. Res. C. 2015, 57, 35–42. [Google Scholar] [CrossRef]
  72. Shiraga, K.; Suzuki, T.; Kondo, N.; Tajima, T.; Nakamura, M.; Togo, H.; Hirata, A.; Ajito, K.; Ogawa, Y. Broadband dielectric spectroscopy of glucose aqueous solution: Analysis of the hydration state and the hydrogen bond network. J. Chem. Phys. 2015, 142, 234504. [Google Scholar] [CrossRef]
Figure 1. The proposed sensor: (a) geometry, (b) an electric field distribution, (c) a cross-sectional view at sensing area, and (d) an equivalent circuit model.
Chemosensors 11 00257 g001aChemosensors 11 00257 g001b
Figure 2. The fabricated hexagonal CSRR microwave sensor is shown in (a) the top view and (b) the bottom view.
Chemosensors 11 00257 g002
Figure 3. Measurement setup.
Chemosensors 11 00257 g003
Figure 4. Comparison of simulated and measured S11 spectra.
Chemosensors 11 00257 g004
Figure 5. The reflection coefficients of the microwave sensor were measured for free space, an empty tube, DI water, and glucose concentrations of 37.5, 50, 75, and 150 mg/dL in the solution.
Chemosensors 11 00257 g005
Figure 6. Sensor response signal in peak 1 (a) reflection coefficient spectra, and (b) S11 and (c) Fr of the microwave sensor, as measured by the reflection coefficient for glucose concentrations of 0, 37.5, 50, 75, and 150 mg/dL in the solution.
Chemosensors 11 00257 g006
Figure 7. Sensor response signal in peak 2. (a) Smooth data and effect of glucose concentration on (b) S11 and (c) resonant frequency on of the microwave sensor, as measured by the reflection coefficient for glucose concentrations of 0, 37.5, 50, 75, and 150 mg/dL in the solution.
Chemosensors 11 00257 g007aChemosensors 11 00257 g007b
Figure 8. Plot of glucose concentration versus (a) ΔS11 and (b) ΔFr.
Chemosensors 11 00257 g008
Figure 9. Sensitivity of proposed microwave sensor.
Chemosensors 11 00257 g009
Table 1. The comparison of microwave sensors for glucose level detection.
Ref.Structureρ (mg/dL)Freq. (GHz)S (dB per mg/dL)
(MHz per mg/dL)
No. Ports
[32]Patch resonator (S11)72–2160.3–20N.A.2
[33]Patch resonator (S11, S21)N.A.0.5–2.5N.A.2
[34]Patch resonator (S11, Fr)0–10001–6N.A.1
[35]CSRR resonator (S11, Fr)0–5002.4–2.6S11: 0.005 1
Fr: 5 × 10⁻⁶
[36]Metamaterial sensor (S21, Fr)0–1502–5Fr: 1.23 2
[37]Microstrip antenna (S11, Fr)0–5001–3N.A.1
[65]CSRR
driven by an ISM radar (Fr)
40–1402.45Fr: 0.45–0.95 (dispersed)2
Fr: 0.63–1.25 (compact)
[66]Triple-pole CSRR (S11, S21)70–1201–6S21: 1.7–6.22
S11: 0.6–3.45
[67]WGM (S21)70–12050–70S21: 0.8–1
[68]Circular CSRR (S11, S21, Fr)70–1501–6S11: 0.005–0.0212
S21: 0.003–0.01
Fr (S11): 0.274–0.334
Fr (S21): 0.067–0.11
[69]Millimeter-wave
metamaterial-inspired resonator (S21)
50–12025.56S21: 0.0272
[70]NSRR with PLL (S21)0–2500.743S21: 17.22
This
work
HCSRR (S11, Fr)0–1501–5S11: 0.0231
Fr: 1.73
Disclaimer/Publisher’s Note: The statements, opinions and data contained in all publications are solely those of the individual author(s) and contributor(s) and not of MDPI and/or the editor(s). MDPI and/or the editor(s) disclaim responsibility for any injury to people or property resulting from any ideas, methods, instructions or products referred to in the content.

