
Handheld Near-Infrared Spectroscopy: State-of-the-Art Instrumentation and Applications in Material Identification, Food Authentication, and Environmental Investigations
 , ,
, ,
Abstract
:1. Introduction
2. Instrumentation
- (a)
- Linear-variable filter instruments with array detectors.
- (b)
- MEMS-based FT-NIR instruments with an opto-electro-mechanical structure.
- (c)
- Spectrometers with Texas Instruments’ digital micro-mirror device (DMD™) as wavelength selector.
- (d)
- Spectrometers with a Fabry-Perot etalon acting as a tunable wavelength filter.
- (e)
- NIR grating micro spectrometers.
- (f)
- Individual NIR scanner based on 16 organic solar cells as detectors, that absorb only a limited wavelength range in the NIR and does not require a monochromator.
3. Applications
3.1. Textiles
3.1.1. Qualitative Analysis
3.1.2. Quantitative Analysis
3.2. Polymers
3.3. Food
3.3.1. Edible Oil
Qualitative Analysis
Quantitative Analysis
3.3.2. Flour
Adulteration
Quantitative Analysis
3.3.3. Hazelnut
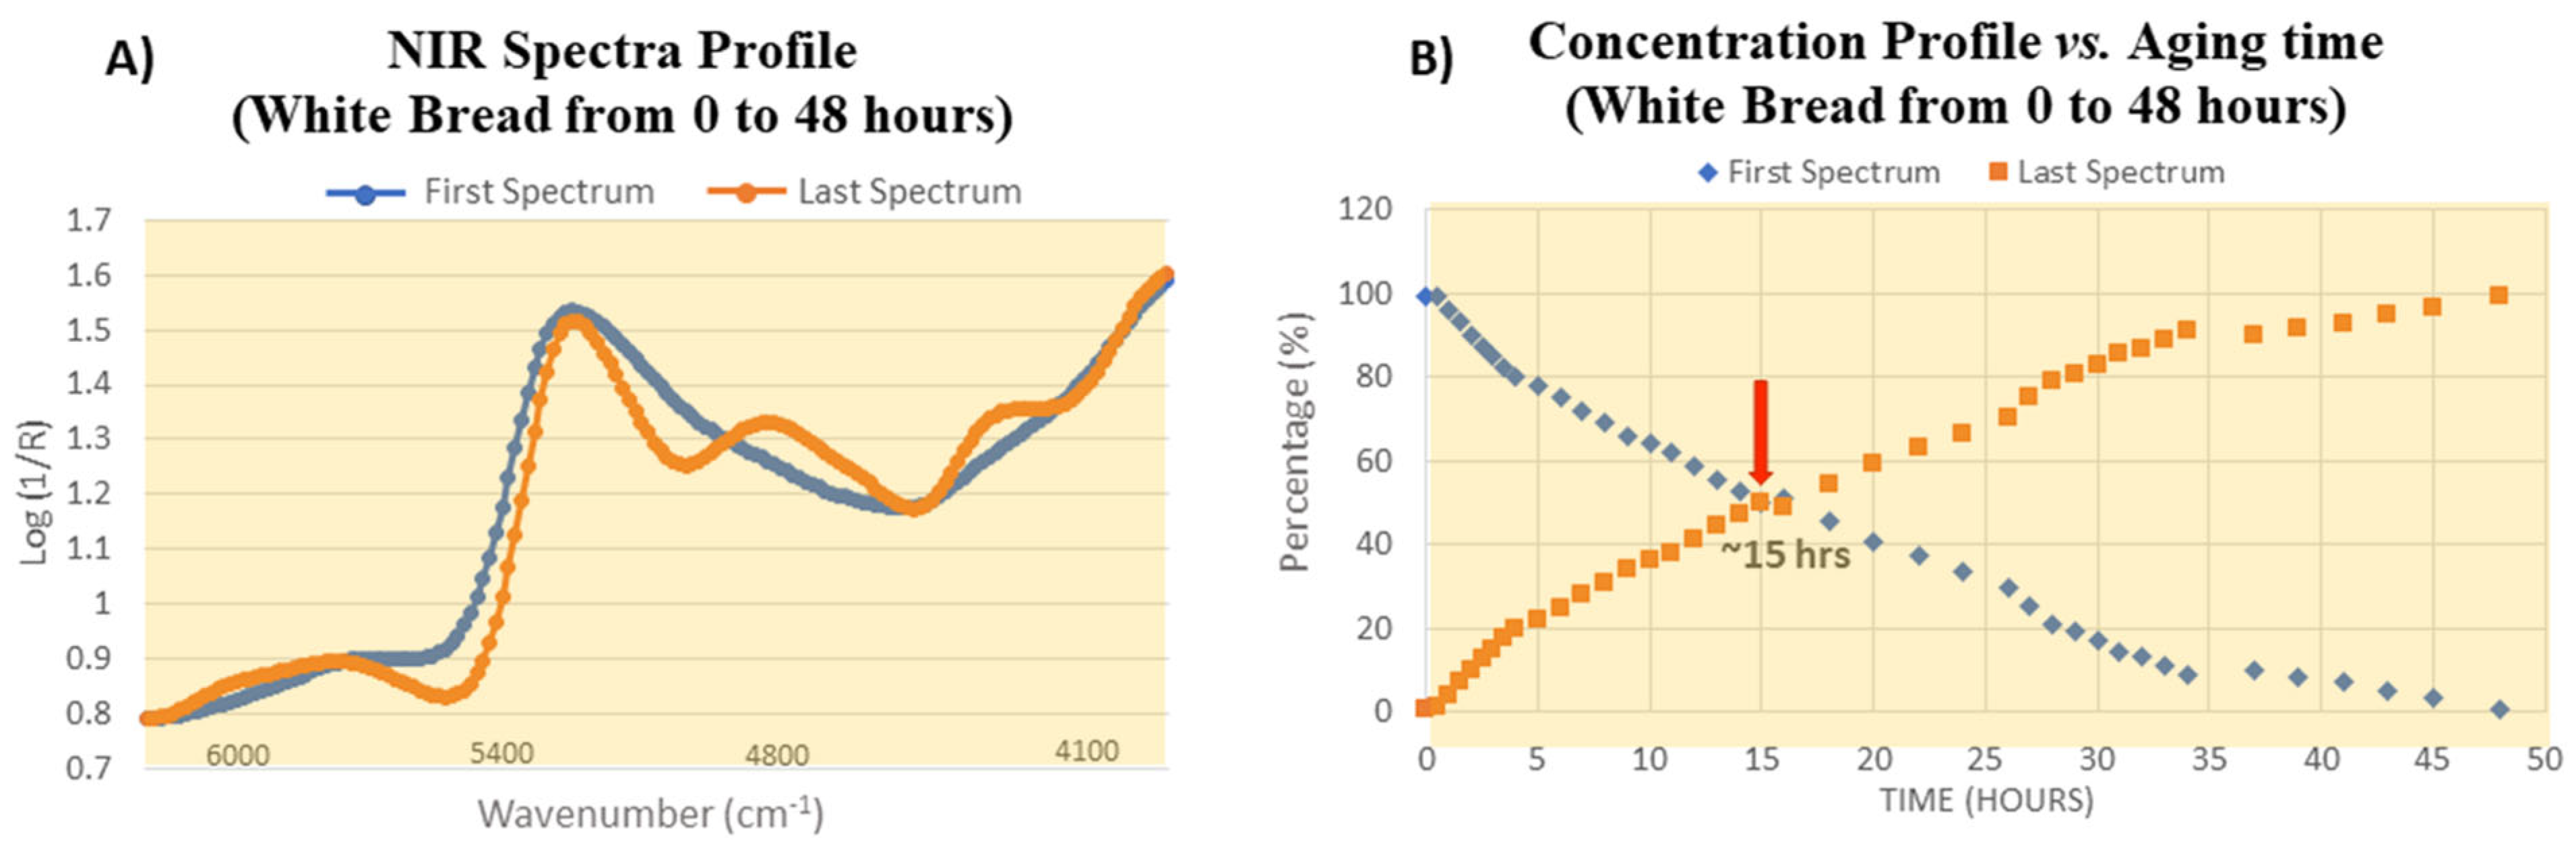
3.3.4. Bread Staling
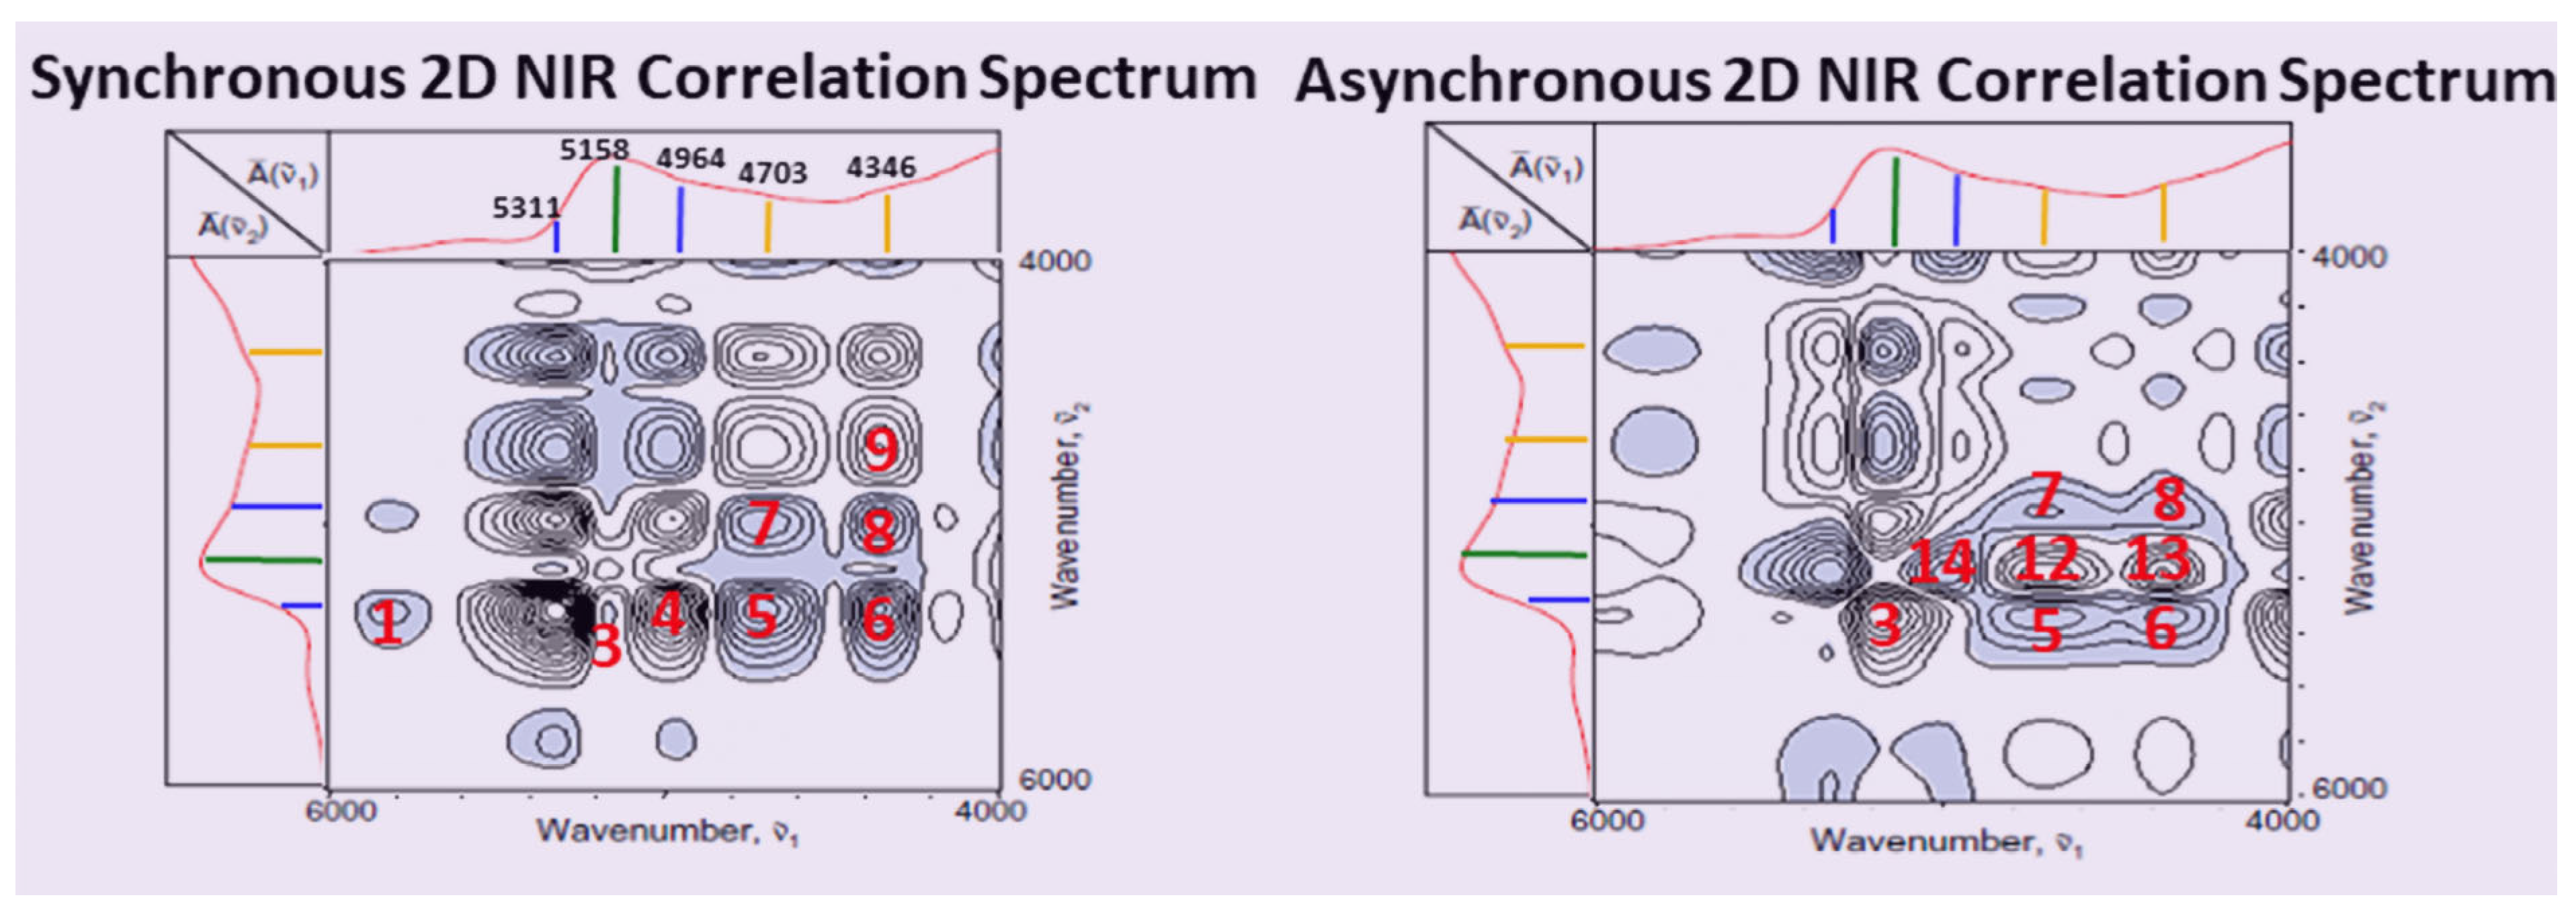
Two-Dimensional Correlation Spectroscopy (2D-COS)
Multivariate Curve Resolution—Alternating Least Squares (MCR-ALS)
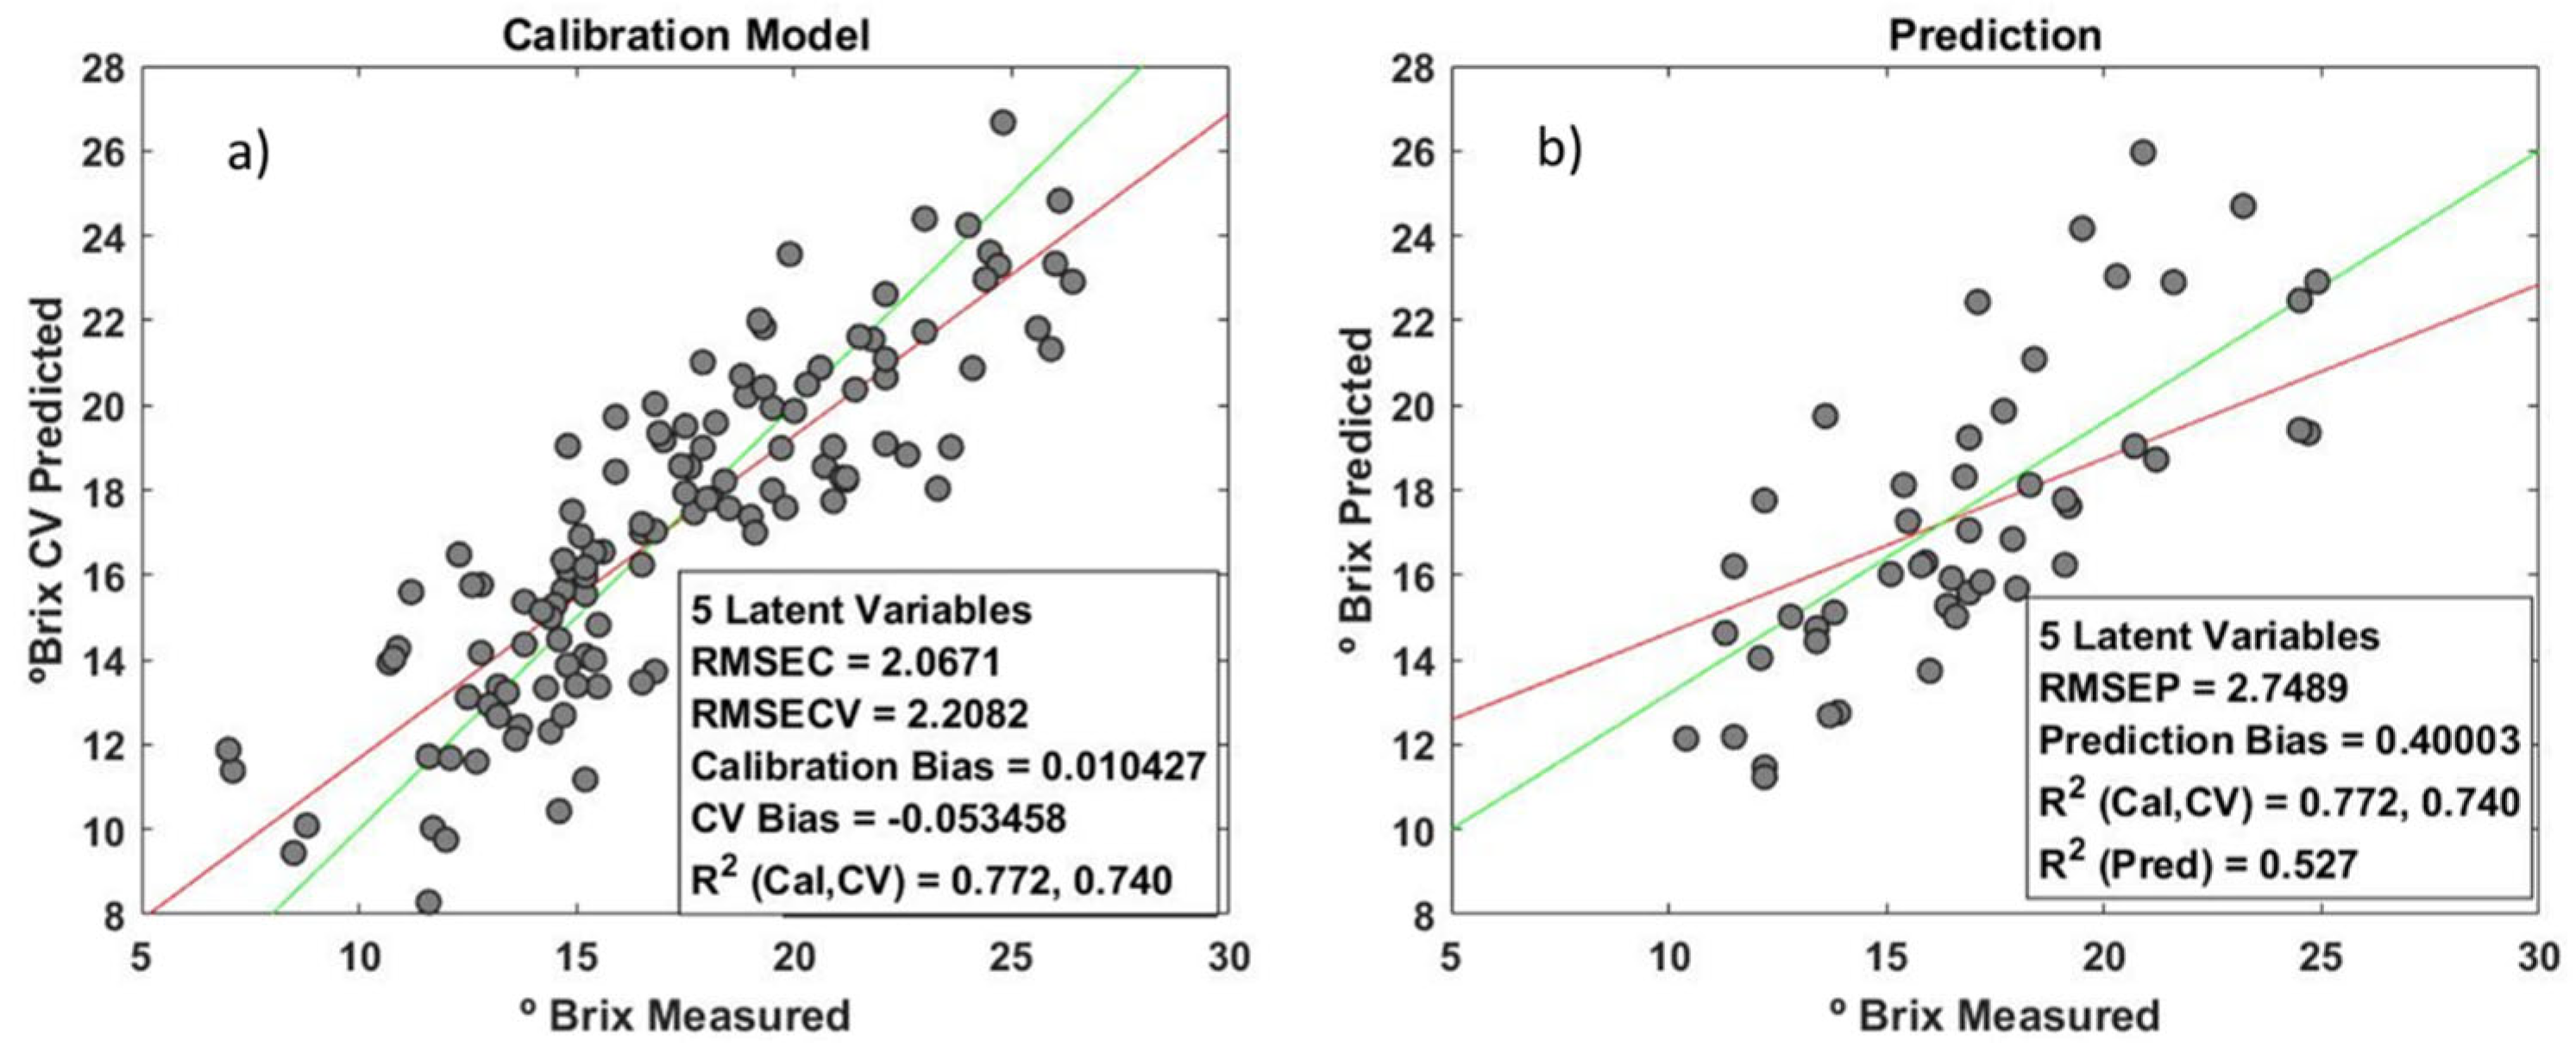
3.3.5. Grapes
- (a)
- Automate the processing of spectroscopic data in the database.
- (b)
- Integrate the information collected in the field and in the laboratory in the field image, using augmented reality techniques.
- (c)
- Visualize, based on the image of the field, the different classifications of the quality of the grape, and the chemical composition of the grape obtained either based on an estimate or based on laboratory analysis.
- (d)
- Visualization of the results of the various wine management strategies.
Materials and Methods
Results and Discussion
- (1)
- Building the Base Calibration
- (2)
- Building the Orthogonally Corrected Calibration
3.4. Environmental and Exploration Studies
- (a)
- Soil investigations in remote sites for the exploration of bauxite deposits.
- (b)
- Soil testing to quantify the total petroleum hydrocarbon (TPH) content for exploration purposes and to determine decontamination measures.
3.4.1. Detection of Bauxite Deposits
3.4.2. Total Petroleum Hydrocarbons (TPH) in Soil
4. Conclusions
Author Contributions
Funding
Institutional Review Board Statement
Informed Consent Statement
Data Availability Statement
Acknowledgments
Conflicts of Interest
References
- Sorak, D.; Herberholz, L.; Iwascek, S.; Altinpinar, S.; Pfeifer, F.; Siesler, H.W. New developments and applications of handheld Raman, mid-infrared, and near-infrared spectrometers. Appl. Spectrosc. Rev. 2012, 47, 83–115. [Google Scholar] [CrossRef]
- Crocombe, R.A. Portable spectroscopy. Appl. Spectrosc. 2018, 72, 1701–1751. [Google Scholar] [CrossRef] [PubMed]
- Rodionova, O.Y.; Titova, A.V.; Pomerantsev, A.L. Discriminant analysis is an inappropriate method of authentication. TrAC Trends Anal. Chem. 2016, 78, 17–22. [Google Scholar] [CrossRef]
- Pomerantsev, A.L.; Rodionova, O.Y. New trends in qualitative analysis: Performance, optimization, and validation of multi-class and soft models. TrAC Trends Anal. Chem. 2021, 143, 116372. [Google Scholar] [CrossRef]
- Bec, K.B.; Grabska, J.; Huck, C.W. Miniaturized NIR Spectroscopy in Food Analysis and Quality Control: Promises, Challenges, and Perspectives. Foods 2022, 11, 1465. [Google Scholar] [CrossRef]
- Sedjoah, R.-C.A.-A.; Ma, Y.; Xiong, M.; Yan, H. Fast monitoring total acids and total polyphenol contents in fermentation broth of mulberry vinegar using MEMS and optical fiber near-infrared spectrometers. Spectrochim. Acta Part A 2021, 260, 119938. [Google Scholar] [CrossRef] [PubMed]
- Yan, H.; Siesler, H.W. Identification Performance of Different Types of Handheld Near-Infrared (NIR) Spectrometers for the Recycling of Polymer Commodities. Appl. Spectrosc. 2018, 72, 1362–1370. [Google Scholar] [CrossRef] [PubMed]
- Yan, H.; Xu, Y.-C.; Siesler, H.W.; Han, B.-X.; Zhang, G.-Z. Hand-Held Near-Infrared Spectroscopy for Authentication of Fengdous and Quantitative Analysis of Mulberry Fruits. Front. Plant Sci. 2019, 10, 1548. [Google Scholar] [CrossRef]
- Yang, S.; Zhao, Z.-N.; Yan, H.; Siesler, H.W. Fast detection of cotton content in silk/cotton textiles by handheld near-infrared spectroscopy: A performance comparison of four different instruments. Text. Res. J. 2022, 92, 147–153. [Google Scholar] [CrossRef]
- Wang, F.; Jia, B.; Dai, J.; Song, X.; Li, X.; Gao, H.; Yan, H.; Han, B. Qualitative classification of Dendrobium huoshanense (Feng dou) using fast non-destructive hand-held near infrared spectroscopy. J. Near Infrared Spectrosc. 2022, 30, 147–153. [Google Scholar] [CrossRef]
- Yan, H.; Han, B.; Siesler, H.W. Handheld Near-Infrared Spectrometers: Reality and Empty Promises. Spectroscopy 2020, 35, 15–18. [Google Scholar]
- Yan, H.; Siesler, H.W. Quantitative analysis of a pharmaceutical formulation: Performance comparison of different handheld near-infrared spectrometers. J. Pharm. Biomed. Anal. 2018, 160, 179–186. [Google Scholar] [CrossRef] [PubMed]
- Reinig, P.; Grüger, H.; Knobbe, J.; Pügner, T.; Meyer, S. Bringing NIR spectrometers into mobile phones. In MOEMS and Miniaturized Systems XVII; SPIE: Bellingham, WA, USA, 2018; pp. 97–104. [Google Scholar]
- Pozzi, F.; Basso, E.; Rizzo, A.; Cesaratto, A.; Tague, T.J., Jr. Evaluation and optimization of the potential of a handheld Raman spectrometer: In situ, noninvasive materials characterization in artworks. J. Raman Spectrosc. 2019, 50, 861–872. [Google Scholar] [CrossRef]
- Workman, J.; Weyer, L. Practical Guide and Spectral Atlas for Interpretive Near-Infrared; CRC: Boca Raton, FL, USA, 2012. [Google Scholar]
- Siesler, H.W. Near Infrared Spectra, Interpretation. In Encyclopedia of Spectroscopy and Spectrometry, 3rd ed.; Lindon, J.C., Tranter, G.E., Koppenaal, D.W., Eds.; Academic Press: Oxford, UK, 2016; pp. 30–39. [Google Scholar]
- Siesler, H.; Ozaki, S.K.; Heise, H. Near Infrared Spectroscopy; Wiley VCH: Weinheim, Germany, 2002. [Google Scholar]
- Ozaki, Y.; Huck, C.; Tsuchikawa, S.; Engelsen, S.B. Near-Infrared Spectroscopy: Theory, Spectral Analysis, Instrumentation, and Applications; Springer: Berlin/Heidelberg, Germany, 2021. [Google Scholar]
- Beć, K.B.; Grabska, J.; Huck, C.W. Principles and applications of miniaturized near-infrared (NIR) spectrometers. Chem. Eur. J. 2021, 27, 1514–1532. [Google Scholar] [CrossRef] [PubMed]
- Pasquini, C. Near infrared spectroscopy: A mature analytical technique with new perspectives—A review. Anal. Chim. Acta 2018, 1026, 8–36. [Google Scholar] [CrossRef] [PubMed]
- Beć, K.B.; Grabska, J.; Siesler, H.W.; Huck, C.W. Handheld near-infrared spectrometers: Where are we heading? NIR News 2020, 31, 28–35. [Google Scholar] [CrossRef]
- Yan, H.; Siesler, H.W. Hand-held near-infrared spectrometers: State-of-the-art instrumentation and practical applications. NIR News 2018, 29, 8–12. [Google Scholar] [CrossRef]
- Antila, J.; Tuohiniemi, M.; Rissanen, A.; Kantojärvi, U.; Lahti, M.; Viherkanto, K.; Kaarre, M.; Malinen, J. MEMS-and MOEMS-based Near-Infrared Spectrometers; Wiley: Hoboken, NJ, USA, 2014; pp. 1–36. [Google Scholar]
- Schuler, L.P.; Milne, J.S.; Dell, J.M.; Faraone, L. MEMS-based microspectrometer technologies for NIR and MIR wavelengths. J. Phys. D Appl. Phys. 2009, 42, 133001. [Google Scholar] [CrossRef]
- Chen, C.; Li, X.; Zhu, S.; Cui, P.; Lei, H.; Yan, H. Detection of the alcohol fermentation process in vinegar production with a digital micro-mirror based NIR spectra set-up and chemometrics. J. Food Compos. Anal. 2023, 115, 105036. [Google Scholar] [CrossRef]
- Wiedemair, V.; Huck, C.W. Evaluation of the performance of three hand-held near-infrared spectrometer through investigation of total antioxidant capacity in gluten free grains. Talanta 2018, 189, 233–240. [Google Scholar] [CrossRef]
- Li, M.; Qian, Z.; Shi, B.; Medlicott, J.; East, A. Evaluating the performance of a consumer scale SCiO (TM) molecular sensor to predict quality of horticultural products. Postharvest Biol. Technol. 2018, 145, 183–192. [Google Scholar] [CrossRef]
- Wang, T.; Chen, J.; Fan, Y.; Qiu, Z.; He, Y. SeeFruits: Design and evaluation of a cloud-based ultra-portable NIRS system for sweet cherry quality detection. Comput. Electron. Agric. 2018, 152, 302–313. [Google Scholar] [CrossRef]
- Grassi, S.; Casiraghi, E.; Alamprese, C. Handheld NIR device: A non-targeted approach to assess authenticity of fish fillets and patties. Food Chem. 2018, 243, 382–388. [Google Scholar] [CrossRef]
- de Lima, G.F.; Cardoso Andrade, S.A.; da Silva, V.H.; Honorato, F.A. Multivariate Classification of UHT Milk as to the Presence of Lactose Using Benchtop and Portable NIR Spectrometers. Food Anal. Methods 2018, 11, 2699–2706. [Google Scholar] [CrossRef]
- Liu, N.; Parra, H.A.; Pustjens, A.; Hettinga, K.; Mongondry, P.; van Ruth, S.M. Evaluation of portable near-infrared spectroscopy for organic milk authentication. Talanta 2018, 184, 128–135. [Google Scholar] [CrossRef]
- Correia, R.M.; Tosato, F.; Domingos, E.; Rodrigues, R.R.T.; Aquino, L.F.M.; Filgueiras, P.R.; Lacerda, V., Jr.; Romao, W. Portable near infrared spectroscopy applied to quality control of Brazilian coffee. Talanta 2018, 176, 59–68. [Google Scholar] [CrossRef]
- Prieto, N.; Pawluczyk, O.; Dugan, M.E.R.; Aalhus, J.L. A Review of the Principles and Applications of Near-Infrared Spectroscopy to Characterize Meat, Fat, and Meat Products. Appl. Spectrosc. 2017, 71, 1403–1426. [Google Scholar] [CrossRef]
- Malegori, C.; Nascimento Marques, E.J.; de Freitas, S.T.; Pimentel, M.F.; Pasquini, C.; Casiraghi, E. Comparing the analytical performances of Micro-NIR and Ft-NIR spectrometers in the evaluation of acerola fruit quality, using PLS and SVM regression algorithms. Talanta 2017, 165, 112–116. [Google Scholar] [CrossRef]
- Basri, K.N.; Hussain, M.N.; Bakar, J.; Sharif, Z.; Khir, M.F.A.; Zoolfakar, A.S. Classification and quantification of palm oil adulteration via portable NIR spectroscopy. Spectrochim. Acta Part A 2017, 173, 335–342. [Google Scholar] [CrossRef]
- Nascimento Marques, E.J.; de Freitas, S.T.; Pimentel, M.F.; Pasquini, C. Rapid and non-destructive determination of quality parameters in the ‘Tommy Atkins’ mango using a novel handheld near infrared spectrometer. Food Chem. 2016, 197, 1207–1214. [Google Scholar] [CrossRef]
- Killeen, D.P.; Andersen, D.H.; Beatson, R.A.; Gordon, K.C.; Perry, N.B. Vibrational Spectroscopy and Chemometrics for Rapid, Quantitative Analysis of Bitter Acids in Hops (Humulus lupulus). J. Agric. Food. Chem. 2014, 62, 12521–12528. [Google Scholar] [CrossRef]
- Wilson, B.K.; Kaur, H.; Allan, E.L.; Lozama, A.; Bell, D. A New Handheld Device for the Detection of Falsified Medicines: Demonstration on Falsified Artemisinin-Based Therapies from the Field. Am. J. Trop. Med. Hyg. 2017, 96, 1117–1123. [Google Scholar] [CrossRef]
- Vakili, H.; Wickstrom, H.; Desai, D.; Preis, M.; Sandler, N. Application of a handheld NIR spectrometer in prediction of drug content in inkjet printed orodispersible formulations containing prednisolone and levothyroxine. Int. J. Pharm. 2017, 524, 414–423. [Google Scholar] [CrossRef]
- Guillemain, A.; Degardin, K.; Roggo, Y. Performance of NIR handheld spectrometers for the detection of counterfeit tablets. Talanta 2017, 165, 632–640. [Google Scholar] [CrossRef]
- da Silva, V.H.; da Silva, J.J.; Pereira, C.F. Portable near-infrared instruments: Application for quality control of polymorphs in pharmaceutical raw materials and calibration transfer. J. Pharm. Biomed. Anal. 2017, 134, 287–294. [Google Scholar] [CrossRef]
- Zontov, Y.V.; Balyklova, K.S.; Titova, A.V.; Rodionova, O.Y.; Pomerantsev, A.L. Chemometric aided NIR portable instrument for rapid assessment of medicine quality. J. Pharm. Biomed. Anal. 2016, 131, 87–93. [Google Scholar] [CrossRef]
- Sun, L.; Hsiung, C.; Pederson, C.G.; Zou, P.; Smith, V.; von Gunten, M.; O’Brien, N.A. Pharmaceutical Raw Material Identification Using Miniature Near-Infrared (MicroNIR) Spectroscopy and Supervised Pattern Recognition Using Support Vector Machine. Appl. Spectrosc. 2016, 70, 816–825. [Google Scholar] [CrossRef]
- Rodgers, J.; Zumba, J.; Fortier, C. Measurement comparison of cotton fiber micronaire and its components by portable near infrared spectroscopy instruments. Text. Res. J. 2017, 87, 57–69. [Google Scholar] [CrossRef]
- Oliveira, V.d.S.; Honorato, R.S.; Honorato, F.A.; Pereira, C.F. Authenticity assessment of banknotes using portable near infrared spectrometer and chemometrics. Forensic Sci. Int. 2018, 286, 121–127. [Google Scholar] [CrossRef]
- Risoluti, R.; Gregori, A.; Schiavone, S.; Materazzi, S. “Click and Screen” Technology for the Detection of Explosives on Human Hands by a Portable MicroNIR-Chemometrics Platform. Anal. Chem. 2018, 90, 4288–4292. [Google Scholar] [CrossRef]
- Pereira, J.F.Q.; Silva, C.S.; Vieira, M.J.L.; Pimentel, M.F.; Braz, A.; Honorato, R.S. Evaluation and identification of blood stains with handheld NIR spectrometer. Microchem. J. 2017, 133, 561–566. [Google Scholar] [CrossRef]
- Yan, H.; Siesler, H.W. Identification of textiles by handheld near infrared spectroscopy: Protecting customers against product counterfeiting. J. Near Infrared Spectrosc. 2018, 26, 311–321. [Google Scholar] [CrossRef]
- Kumagai, M.; Matsuura, N.; Li, H.; Ohisa, N.; Amano, T.; Ogawa, N. Application of a portable near infrared spectrometer for the manufacturing of noodle products. J. Near Infrared Spectrosc. 2004, 12, 127–131. [Google Scholar] [CrossRef]
- Guifang, W.; Hai, M.; Xin, P. Identification of varieties of natural textile fiber based on Vis/NIR spectroscopy technology. In Proceedings of the 2015 IEEE Advanced Information Technology, Electronic and Automation Control Conference (IAEAC), Chongqing, China, 19–20 December 2015; pp. 585–589. [Google Scholar]
- Liu, L.; Yan, L.; Xie, Y.; Xu, J. Determination of Fiber Contents in Blended Textiles by NIR Combined with BP Neural Network. ISRN Text. 2013, 2013, 546481. [Google Scholar] [CrossRef]
- Yan, H.; Shen, Y.; Siesler, H.W. Nah-Infrarot-Spektrometer für Alltagsanwendungen. GIT Labor Fachz. 2020, 10, 1–4. [Google Scholar]
- Xiong, Z.; Pfeifer, F.; Siesler, H.W. Evaluating the molecular interaction of organic liquid mixtures using near-infrared spectroscopy. Appl. Spectrosc. 2016, 70, 635–644. [Google Scholar] [CrossRef]
- Bin Irfan, U.; Pui, L.P.; Solihin, M.I. Feasibility Study of Detecting Palm Oil Adulteration with Recycled Cooking Oil Using A Handheld NIR Spectroscopy. In Proceedings of the 7th International Conference on Electronic Devices, Systems and Applications (ICEDSA), Kuala Lumpur, Malaysia, 28–29 March 2020. [Google Scholar]
- de Oliveira Moreira, A.C.; Batista Braga, J.W. Authenticity Identification of Copaiba Oil Using a Handheld NIR Spectrometer and DD-SIMCA. Food Anal. Methods 2021, 14, 865–872. [Google Scholar] [CrossRef]
- Yan, J.; van Stuijvenberg, L.; van Ruth, S.M. Handheld Near-Infrared Spectroscopy for Distinction of Extra Virgin Olive Oil from Other Olive Oil Grades Substantiated by Compositional Data. Eur. J. Lipid Sci. Technol. 2019, 121, 1900031. [Google Scholar] [CrossRef]
- Yao, S.; Aykas, D.P.; Rodriguez-Saona, L. Rapid Authentication of Potato Chip Oil by Vibrational Spectroscopy Combined with Pattern Recognition Analysis. Foods 2020, 10, 42. [Google Scholar] [CrossRef]
- Yan, H.; Siesler, H.W. Handheld Near-Infrared Spectrometers: On-Site Quality Control and Protection Against Product Counterfeiting. Available online: https://www.etextonline.org/articlepdfs/Handheld-Near-Infrared-Spectrometers:-On-Site-Quality-Control-and-Protection-Against-Product-Counterfeiting.pdf (accessed on 20 April 2021).
- Yang, R.; Zhang, L.; Li, P.; Yu, L.; Mao, J.; Wang, X.; Zhang, Q. A review of chemical composition and nutritional properties of minor vegetable oils in China. Trends Food Sci. Technol. 2018, 74, 26–32. [Google Scholar] [CrossRef]
- Chen, F.; Zhang, X.; Zhang, Q.; Du, X.; Yang, L.; Zu, Y.; Yang, F. Simultaneous synergistic microwave–ultrasonic extraction and hydrolysis for preparation of trans-resveratrol in tree peony seed oil-extracted residues using imidazolium-based ionic liquid. Ind. Crops Prod. 2016, 94, 266–280. [Google Scholar] [CrossRef]
- Mao, S.; Li, X. Progress in peony seed oil and comprehensive utilization value of oil peony. China Oils Fats 2017, 42, 123–126. [Google Scholar]
- Barthet, V.J.; Petryk, M.W.P.; Siemens, B. Rapid Nondestructive Analysis of Intact Canola Seeds Using a Handheld Near-Infrared Spectrometer. J. Am. Oil Chem. Soc. 2020, 97, 577–589. [Google Scholar] [CrossRef]
- Grassi, S.; Jolayemi, O.S.; Giovenzana, V.; Tugnolo, A.; Squeo, G.; Conte, P.; De Bruno, A.; Flamminii, F.; Casiraghi, E.; Alamprese, C. Near Infrared Spectroscopy as a Green Technology for the Quality Prediction of Intact Olives. Foods 2021, 10, 1042. [Google Scholar] [CrossRef]
- MacArthur, R.L.; Teye, E.; Darkwa, S. Predicting adulteration of Palm oil with Sudan IV dye using shortwave handheld spectroscopy and comparative analysis of models. Vib. Spectrosc. 2020, 110, 103129. [Google Scholar] [CrossRef]
- Nieto-Ortega, S.; Olabarrieta, I.; Saitua, E.; Arana, G.; Foti, G.; Melado-Herreros, A. Improvement of Oil Valorization Extracted from Fish By-Products Using a Handheld near Infrared Spectrometer Coupled with Chemometrics. Foods 2022, 11, 1092. [Google Scholar] [CrossRef]
- Zhang, N.; Li, Y.; Wen, S.; Sun, Y.; Chen, J.; Gao, Y.; Sagymbek, A.; Yu, X. Analytical methods for determining the peroxide value of edible oils: A mini-review. Food Chem. 2021, 358, 129834. [Google Scholar] [CrossRef]
- Mariana, R.R.; Susanti, E.; Hidayati, L.; Wahab, R.A. Analysis of Peroxide Value, Free Fatty Acid, and Water Content Changes in Used Cooking Oil from Street Vendors in Malang; AIP Publishing LLC.: Melville, NY, USA, 2020; Volume 2231, p. 040057. [Google Scholar]
- Zhao, Z.; Yan, H.; Siesler, H. Rapid Determination of the Peroxide Value of Edible Oil by Handheld NIR Spectroscopy in Combination with Wavelength Variables Selection and PLS Calibration. Spectroscopy 2022, 37, 30–33. [Google Scholar] [CrossRef]
- Popper, L.; Schäfe, W.; Freund, W. A Compendium of Flour Improvement; Agrimedia GmbH, ERLING Verlag GmbH & Co. KG: Clence, Germany, 2006. [Google Scholar]
- Myhrvold, N.; Migoya, F. Modernist Bread; Phaidon Verlag GmbH: Berlin, Germany, 2007; Volume 1–5. [Google Scholar]
- Atwell, W.A.; Finnie, S. Wheat Flour, 2nd ed.; Elsevier BV: Amsterdam, Netherlands, 2016. [Google Scholar]
- Hamelman, J. Bread: A Baker’s Book of Techniques and Recipes; John Wiley & Sons Ltd: Chichester, UK, 2016. [Google Scholar]
- Netto, J.M.; Honorato, F.A.; Celso, P.G.; Pimentel, M.F. Authenticity of almond flour using handheld near infrared instruments and one class classifiers. J. Food Compos. Anal. 2023, 115, 104981. [Google Scholar] [CrossRef]
- Wang, Z.; Wu, Q.; Kamruzzaman, M. Portable NIR spectroscopy and PLS based variable selection for adulteration detection in quinoa flour. Food Control 2022, 138, 108970. [Google Scholar] [CrossRef]
- Tao, F.; Liu, L.; Kucha, C.; Ngadi, M. Rapid and non-destructive detection of cassava flour adulterants in wheat flour using a handheld MicroNIR spectrometer. Biosyst. Eng. 2021, 203, 34–43. [Google Scholar] [CrossRef]
- Albanell, E.; Minarro, B.; Carrasco, N. Detection of low-level gluten content in flour and batter by near infrared reflectance spectroscopy (NIRS). J. Cereal Sci. 2012, 56, 490–495. [Google Scholar] [CrossRef]
- Armstrong, P.R.; Maghirang, E.B.; Xie, F.; Dowell, F.E. Comparison of dispersive and Fourier-transform NIR instruments for measuring grain and flour attributes. Appl. Eng. Agric. 2006, 22, 453–457. [Google Scholar] [CrossRef]
- Anjum, F.M.; Walker, C.E. Grain, flour and bread-making properties of eight Pakistani hard white spring wheat cultivars grown at three different locations for 2 years. Int. J. Food Sci. Technol. 2000, 35, 407–416. [Google Scholar] [CrossRef]
- Hernandez, O.M.; Fraga, J.M.G.; Jimenez, A.I.; Jimenez, F.; Arias, J.J. Characterization of toasted cereal flours from the Canary Islands (gofios). Food Chem. 2014, 151, 133–140. [Google Scholar] [CrossRef]
- Chen, X.; Siesler, H.W.; Yan, H. Rapid analysis of wheat flour by different handheld near-infrared spectrometers: A discussion of calibration model maintenance and performance comparison. Spectrochim. Acta, Part A 2021, 252, 119504. [Google Scholar] [CrossRef]
- Ceylan, F.D.; Adrar, N.; Bolling, B.W.; Capanoglu, E. Valorisation of hazelnut by-products: Current applications and future potential. Biotechnol. Genet. Eng. Rev. 2022, 38, 1–36. [Google Scholar] [CrossRef]
- Intelligence, M. Hazelnut Market—Rowth, Trends, COVID-19 Impact, and Forecasts (2023–2028). Available online: https://www.mordorintelligence.com/industry-reports/global-hazelnut-market (accessed on 25 January 2023).
- Shafiei, G.; Ghorbani, M.; Hosseini, H.; Sadeghi Mahoonak, A.; Maghsoudlou, Y.; Jafari, S.M. Estimation of oxidative indices in the raw and roasted hazelnuts by accelerated shelf-life testing. J. Food Sci. Technol. 2020, 57, 2433–2442. [Google Scholar] [CrossRef]
- United Nations Environment Programme. Food Waste Index; United Nations Environment Programme: Nairobi, Kenya, 2021. [Google Scholar]
- Chinachoti, P.; Vodovotz, Y. Bread Staling; Chinachoti, P., Vodovotz, Y., Eds.; CRC Press: Boca Raton, FL, USA, 2001. [Google Scholar]
- Noda, I.; Ozaki, Y. Two-Dimensional Correlation Spectroscopy: Applications in Vibrational and Optical Spectroscopy; John Wiley & Sons: Hoboken, NJ, USA, 2005. [Google Scholar]
- Jaumot, J.; Gargallo, R.; De Juan, A.; Tauler, R. A graphical user-friendly interface for MCR-ALS: A new tool for multivariate curve resolution in MATLAB. Chemom. Intell. Lab. Syst. 2005, 76, 101–110. [Google Scholar] [CrossRef]
- Jaumot, J.; de Juan, A.; Tauler, R. MCR-ALS GUI 2.0: New features and applications. Chemom. Intell. Lab. Syst. 2015, 140, 1–12. [Google Scholar] [CrossRef]
- Arp, C.G.; Correa, M.J.; Ferrero, C. Kinetic study of staling in breads with high-amylose resistant starch. Food Hydrocoll. 2020, 106, 105879. [Google Scholar] [CrossRef]
- Curti, E.; Carini, E.; Cobo, M.; Bocher, T.; Vittadini, E. The use of two-dimensional NMR relaxometry in bread staling: A valuable tool? Food Chem. 2017, 237, 766–772. [Google Scholar] [CrossRef] [PubMed]
- Dong, Y.; Karboune, S. A review of bread qualities and current strategies for bread bioprotection: Flavor, sensory, rheological, and textural attributes. Compr. Rev. Food Sci. Food Saf. 2021, 20, 1937–1981. [Google Scholar] [CrossRef] [PubMed]
- Ringsted, T.; Siesler, H.W.; Engelsen, S.B. Monitoring the staling of wheat bread using 2D MIR-NIR correlation spectroscopy. J. Cereal Sci. 2017, 75, 92–99. [Google Scholar] [CrossRef]
- Neves, M.D.G.; Noda, I.; Siesler, H.W. Investigation of bread staling by handheld NIR spectroscopy in tandem with 2D-COS and MCR-ALS analysis. Microchem. J. 2023, 190, 108578. [Google Scholar] [CrossRef]
- Afseth, N.K.; Kohler, A. Extended multiplicative signal correction in vibrational spectroscopy, a tutorial. Chemom. Intell. Lab. Syst. 2012, 117, 92–99. [Google Scholar] [CrossRef]
- Olivieri, A.C.; Omidikia, N. Initialization effects in two-component second-order multivariate calibration with the extended bilinear model. Anal. Chim. Acta 2020, 1125, 169–176. [Google Scholar] [CrossRef]
- Mazivila, S.J.; Santos, J.L. A review on multivariate curve resolution applied to spectroscopic and chromatographic data acquired during the real-time monitoring of evolving multi-component processes: From process analytical chemistry (PAC) to process analytical technology (PAT). TrAC Trends Anal. Chem. 2022, 157, 116698. [Google Scholar] [CrossRef]
- Ye, W.; Xu, W.; Yan, T.; Yan, J.; Gao, P.; Zhang, C. Application of Near-Infrared Spectroscopy and Hyperspectral Imaging Combined with Machine Learning Algorithms for Quality Inspection of Grape: A Review. Foods 2023, 12, 132. [Google Scholar] [CrossRef]
- Roger, J.-M.; Chauchard, F.; Bellon-Maurel, V. EPO–PLS external parameter orthogonalisation of PLS application to temperature-independent measurement of sugar content of intact fruits. Chemom. Intell. Lab. Syst. 2003, 66, 191–204. [Google Scholar] [CrossRef]
- Zhu, Y.; Fearn, T.; Samuel, D.; Dhar, A.; Hameed, O.; Bown, S.G.; Lovat, L.B. Error removal by orthogonal subtraction (EROS): A customised pre-treatment for spectroscopic data. J. Chemom. J. Chemom. Soc. 2008, 22, 130–134. [Google Scholar] [CrossRef]
- Herrera, J.; Guesalaga, A.; Agosin, E. Shortwave–near infrared spectroscopy for non-destructive determination of maturity of wine grapes. Meas. Sci. Technol. 2003, 14, 689. [Google Scholar] [CrossRef]
- Larraín, M.; Guesalaga, A.R.; Agosín, E. A multipurpose portable instrument for determining ripeness in wine grapes using NIR spectroscopy. IEEE Trans. Instrum. Meas. 2008, 57, 294–302. [Google Scholar] [CrossRef]
- Urraca, R.; Sanz-Garcia, A.; Tardaguila, J.; Diago, M.P. Estimation of total soluble solids in grape berries using a hand-held NIR spectrometer under field conditions. J. Sci. Food Agric. 2016, 96, 3007–3016. [Google Scholar] [CrossRef] [PubMed]
- Roger, J.M.; Boulet, J.C. A review of orthogonal projections for calibration. J. Chemom. 2018, 32, e3045. [Google Scholar] [CrossRef]
- Gennadiev, A.; Pikovskii, Y.I.; Tsibart, A.; Smirnova, M. Hydrocarbons in soils: Origin, composition, and behavior. Eurasian Soil Sci. 2015, 48, 1076–1089. [Google Scholar] [CrossRef]
- Webster, G.T.; Soriano-Disla, J.M.; Kirk, J.; Janik, L.J.; Forrester, S.T.; McLaughlin, M.J.; Stewart, R.J. Rapid prediction of total petroleum hydrocarbons in soil using a hand-held mid-infrared field instrument. Talanta 2016, 160, 410–416. [Google Scholar] [CrossRef] [PubMed]
- Inagaki, T.; Watanabe, T.; Tsuchikawa, S. The effect of path length, light intensity and co-added time on the detection limit associated with NIR spectroscopy of potassium hydrogen phthalate in aqueous solution. PLoS ONE 2017, 12, e0176920. [Google Scholar] [CrossRef] [PubMed]
- Miao, T.; Sihota, N.; Pfeifer, F.; McDaniel, C.; De Gea Neves, M.; Siesler, H.W. Rapid determination of the total petroleum hydrocarbon content of soils by handheld Fourier transform near-infrared spectroscopy. Anal. Chem. 2023. in print. [Google Scholar] [CrossRef]
- Lesnoff, M.; Metz, M.; Roger, J.M. Comparison of locally weighted PLS strategies for regression and discrimination on agronomic NIR data. J. Chemom. 2020, 34, e3209. [Google Scholar] [CrossRef]


| NeoSpectra | NIR One | |||||||
|---|---|---|---|---|---|---|---|---|
| PET | PP | PS | PVC | PET | PP | PS | PVC | |
| PE | 24.3 | 23.1 | 17.6 | 25.3 | 8.4 | 7.0 | 8.1 | 2.4 |
| PET | 21.1 | 28.1 | 20.9 | 10.0 | 9.6 | 8.1 | ||
| PP | 17.8 | 23.6 | 8.9 | 5.9 | ||||
| PS | 17.7 | 9.5 | ||||||
| ∅ | 21.9 | 7.8 | ||||||
| Peak # | Peaks (cm−1) | Syn | Asyn | Peak Sign | Sequence |
|---|---|---|---|---|---|
| 5 | 4703/5311 | - | - | + | 4703 < 5311 |
| 6 | 4346/5311 | - | - | + | 4346 < 5311 |
| 3 | 5158/5311 | - | + | - | 5311 < 5158 |
| 14 | 4964/5158 | no | - | - | 5158 < 4964 |
| 7 | 4703/4964 | - | - | + | 4703 < 4964 |
| 8 | 4346/4964 | - | - | + | 4346 < 4964 |
| 12 | 4703/5158 | no | + | + | 4703 < 5158 |
| 13 | 4346/5158 | no | + | + | 4346 < 5158 |
| Spectrometer | # Calibration Samples | Pretreatment | # LVs | RMSEC % (w/w) | RMSECV % (w/w) | R2C | R2CV |
|---|---|---|---|---|---|---|---|
| Benchtop | 83 | 2nd derivative 8250–4050 cm−1 | 6 | 3.34 | 3.88 | 0.945 | 0.925 |
| Handheld | 82 | 2nd derivative 8000–6150 cm−1 | 2 | 4.35 | 4.49 | 0.908 | 0.901 |
| Site | # Calibration Samples | Range of TPH Reference Content (ppm) | # Test Samples | Range of TPH Reference Content (ppm) |
|---|---|---|---|---|
| Site#1 | 89 | 420–20,000 | 9 | 480–18,000 |
| Site#2 | 58 | 350–30,000 | 6 | 760–18,000 |
Disclaimer/Publisher’s Note: The statements, opinions and data contained in all publications are solely those of the individual author(s) and contributor(s) and not of MDPI and/or the editor(s). MDPI and/or the editor(s) disclaim responsibility for any injury to people or property resulting from any ideas, methods, instructions or products referred to in the content. |
© 2023 by the authors. Licensee MDPI, Basel, Switzerland. This article is an open access article distributed under the terms and conditions of the Creative Commons Attribution (CC BY) license (https://creativecommons.org/licenses/by/4.0/).
Share and Cite
Yan, H.; De Gea Neves, M.; Noda, I.; Guedes, G.M.; Silva Ferreira, A.C.; Pfeifer, F.; Chen, X.; Siesler, H.W. Handheld Near-Infrared Spectroscopy: State-of-the-Art Instrumentation and Applications in Material Identification, Food Authentication, and Environmental Investigations. Chemosensors 2023, 11, 272. https://doi.org/10.3390/chemosensors11050272
Yan H, De Gea Neves M, Noda I, Guedes GM, Silva Ferreira AC, Pfeifer F, Chen X, Siesler HW. Handheld Near-Infrared Spectroscopy: State-of-the-Art Instrumentation and Applications in Material Identification, Food Authentication, and Environmental Investigations. Chemosensors. 2023; 11(5):272. https://doi.org/10.3390/chemosensors11050272
Chicago/Turabian StyleYan, Hui, Marina De Gea Neves, Isao Noda, Gonçalo M. Guedes, António C. Silva Ferreira, Frank Pfeifer, Xinyu Chen, and Heinz W. Siesler. 2023. "Handheld Near-Infrared Spectroscopy: State-of-the-Art Instrumentation and Applications in Material Identification, Food Authentication, and Environmental Investigations" Chemosensors 11, no. 5: 272. https://doi.org/10.3390/chemosensors11050272