
Graphene-Based Electrodes for Monitoring of Estradiol

1
Institute of Bio-Sensing Technology (IBST), University of the West of England, Bristol BS16 1QY, UK
2
Centre for Research in Biosciences (CRIB), School of Applied Sciences, University of the West of England, Bristol BS16 1QY, UK
*
Author to whom correspondence should be addressed.
Chemosensors 2023, 11(6), 337; https://doi.org/10.3390/chemosensors11060337
Submission received: 28 April 2023
/
Revised: 15 May 2023
/
Accepted: 22 May 2023
/
Published: 6 June 2023
(This article belongs to the Special Issue Advances in Screen-Printed Electrode & Electrochemical Sensor Applications)
Abstract
:This study explores the potential use of graphene-based electrodes in the electrochemical determination of estradiol using amperometric techniques as a simple, enzyme-free approach. Graphene, a carbon-based nanomaterial, has been extensively investigated in materials science as a sensing material. Its remarkable properties, such as its high electron mobility and conductivity, robust mechanical characteristics, and good surface-to-volume ratio, have led to its adoption in numerous applications, including electrochemical sensing. Estradiol is a crucial sex hormone that affects metabolism and reproduction. However, excessive amounts may disrupt endocrine functions. Electrochemical sensors suffer from electrode fouling, leading to passivation that ultimately affects performance. We exploit the inherent properties of various types of graphene-based electrodes, including graphene screen-printed electrodes (GHSPE), electrochemically exfoliated graphene-modified electrodes (EEFGHSPE), and 3D graphene foam screen-printed electrodes (3D-GFSPE), for the amperometric studies. The electrochemical properties and structural characteristics of these sensors are evaluated using cyclic voltammetry and scanning electron microscopy. The analytical performance of these sensors is at an applied potential of +0.65 V (vs. Ag/AgCl) over the concentration range 0.83 to 4.98 μM estradiol. Sensitivities of 0.151 µAµM−1 cm−2, 0.429 µAµM−1 cm−2, and 0.273 µA µM−1 cm−2, with detection limits of 0.0041 µM, 0.097 µM, and 0.018 µM (S/N = 3), are found for GHPSPE, 3D-GFSPE and EEFGHSPE, respectively. The possibility of amperometrically determining the estradiol levels in a potable tap water sample are then investigated over the concentration range 0.83–4.98 µM.
1. Introduction
Estradiol is a crucial sex hormone that affects metabolism and reproduction. However, excessive amounts may disrupt endocrine functions [1,2,3,4]. Estradiol (E2) has been included in the Water Framework Directive’s Watch List (2013/39/E.U.) owing to its presence in European water bodies and potential endocrine-disrupting properties, necessitating real-time monitoring [5]. It is imperative to monitor drinking water sources for this compound. Research studies have employed diverse analytical techniques to determine estrogenic hormone levels [5]. Presently, measurement methods necessitate costly equipment that can only be obtained from specialized facilities and require well-trained professionals. Thus, there is a crucial demand for techniques capable of conducting swift assessments of intricate samples with the prospect of operation at remote sites [5,6]. Monitoring and detecting contaminants in the environment have become vital to ensuring the safety and health of living beings. There are several techniques available for contaminant monitoring [6]. The novel metal–organic framework (MOF) derivatives-based materials are paving the way for new opportunities in detecting and monitoring harmful gas pollutants [6]. Voltammetric sensors are widely favored within the field of electrochemical sensors and offer noteworthy benefits such as rapid response times, affordability, convenient miniaturization capabilities, uncomplicated operation and maintenance procedures, reliability in terms of performance accuracy and precision, and high levels of sensitivity to specific target analytes [7]. Additionally, the disposable electrodes commonly utilized in such systems provide an expedient approach for mass-producing disposable analytical platforms, fulfilling the demand for on-site environmental monitoring without requiring the extensive resources typically associated with conventional analytical approaches [8,9,10].
Disposable electrodes have been identified as appropriate options for pollution monitoring in field settings [9,10].
Numerous studies in the literature have explored the analysis of E2 via various types of modified electrodes utilizing a range of materials [6]. However, it is recognized that electrochemical oxidation, which includes E2 and phenolic compounds generally, can lead to fouling and passivation on electrode surfaces [11,12]. To achieve precise and sensitive pollutant detection, a resilient design and detection approach is imperative to effectively address this challenge [13].
Graphene-based carbon materials have been researched extensively because they have advantageous features and properties as electrode materials [14,15]. Graphene’s distinctive thermal, electronic, mechanical, and electrochemical properties render it an alluring material for sensing applications [15,16,17,18].
Previous studies, such as that conducted by Barton et al. [16], have shown promising results in measuring E2 levels by implementing a polyaniline/graphene-modified screen-printed electrode. Santos et al. reported a study detailing the development of screen-printed electrodes (SPEs) that are enhanced with graphene, graphene quantum dots (GQDs), and magnetic nanoparticles coated with molecularly imprinted polymers (mag@MIP) for ethinylestradiol sensing [17]. Similarly, Zhao et al. have designed screen-printed carbon electrodes (SPCEs) containing reduced graphene oxide/silver nanoparticle composites (RGO/AgNPs) to detect estriol [18]. Table 1 reports the use of graphene-based electrodes for detecting E2 and the detection techniques employed.
Many approaches are available to generate graphene of diverse sizes and qualities. These techniques encompass bottom-up synthesis methods and top-down exfoliation methodologies [18]. While mechanical exfoliation can produce graphene with adequate physical features, scaling up is a significant drawback of this method [19,20,21,22].
Alternative methods involving diverse adjustments have also been documented in the literature [23,24,25,26]. While numerous variations of graphene have been utilized to design electrochemical sensors, it is primarily produced through chemical exfoliation [27,28,29].

Table 1.
Recent literature on E2 determination using various graphene-derivative sensors.
| Modifier/Electrode | Detection Technique | Linear Range (μM) | Limit of Detection (nM) | Ref. |
|---|---|---|---|---|
| Anti-E1/polyaniline (PANI)/graphene/SPE | EIS a | 0.37–0.76 | 0.0072 | [29] |
| Graphene quantum dots with poly-sulfosalicylic (PSSA/GO)/GCE | DPV b | 0.001–6.0 | 0.23 | [30] |
| Reduced graphene oxide/molecularly imprinted polymer/GCE | DPV | 0.16–15 | 27 | [31] |
| Reduced graphene oxide/di-hexadecyl phosphate/GCE | LSV c | 0.4–10 | 77 | [32] |
| Fe3O4 nanobeads/graphene-based molecularly imprinted polymer/GCE | DPV | 0.05–10 | 0.819 | [33] |
| Gold nanoparticle/graphene/molecularly imprinted polymer/GCE | DPV | 0.003–1 | 1 | [34] |
| Ultrasonicated exfoliated graphene in N-methyl-2-pyrrolidone/GCE | DPV | 0.01–15 | 4.9 | [35] |
| Reduced graphene oxide-platinum nanoparticles/MIP/GCE | DPV | 0.004–0.06 | 2 | [36] |
| Reduced graphene oxide on metallic Cu (II)-meso-tetra(thien-2-yl) porphyrin/GCE | DPV | 0.1–1.0 | 5.3 | [37] |
| Cysteamine/gold nanoparticle/fumed silica/graphene nanoribbon/GCE | DPV | 0.1–5.0 | 74 | [38] |
| Aptamer-reduced graphene oxide/GCE | EIS | 0.000012–0.00023 | 0.0005 | [39] |
a Electrochemical impedance spectroscopy (EIS); b differential pulse voltammetry (DPV); and c linear sweep voltammetry (LSV).
An alternative approach to synthesizing graphene involves the utilization of laser inscribing or inducing methods, which have recently emerged as a one-step technique for producing laser-induced graphene (LIG) or laser-scribed graphene (LSG) sensors [30,32].
This approach entails laser exposure on a polymeric precursor, specifically polyimide, to instigate a photochemical and thermal transformation process leading to graphene production. This represents an efficient and uncomplicated route for fabricating graphene architecture.
Another technique for producing graphene expeditiously involves using the electrical potential to exfoliate graphite electrodes [33].
Electrochemical exfoliation is becoming increasingly popular due to its uncomplicated nature, time efficiency, potential for scalability, and ability to perform a one-step process. This involves applying an electric voltage that enables solvated ions from the electrolyte to intercalate within the working electrode, weakening the interlayer forces and ensuring the subsequent separation of individual flakes into the electrolyte [33]. Despite the limited research on the application of electrolysis in producing sensor-grade graphene through exfoliation, this method remains attractive because it is rapid and cost-effective without necessitating additional purification or cleanroom technologies [34,35,36,37,38,39].
The integration of graphene and its derivatives has been previously documented [15,16,17,18,19,20,21]. Nevertheless, investigations on SPEs have been scarce in comparison, as most research focuses on modifying glassy carbon electrodes, with only a small number of studies concerning their application in the determination of other estrogens. Additionally, the adaptability of SPEs in terms of the conductive ink customization, substrates utilized, and design/geometry renders them highly versatile for various analytical applications [40,41,42,43,44,45].
The potential of utilizing graphene and SPEs to detect E2 has yet to be fully investigated. This presents an intriguing avenue for sensor design using the versatile properties of graphene-based nanomaterials (GBNs) [16].
The present study examined the amperometric determination of E2 through direct electrochemical oxidation on electrodes made from graphene-based materials. Specifically, three methods were investigated: graphene-ink SPE, laser-scribed graphene, and SPE modified with EEFGH as a comparative study. Notably, this research marks the first instance where E2 was detected via amperometric means on sensors constructed solely from graphene materials as disposable sensors. This strategy capitalizes on their unique properties and remarkable electrocatalytic performance, thus eliminating any further modification needs [17,46,47].
2. Materials and Methods
2.1. Chemicals and Reagents
17β-estradiol (E2), sodium hydroxide (NaOH), potassium ferricyanide (K3[Fe(CN)6]), potassium ferrocyanide (K4[Fe(CN)6]), potassium chloride (KCl) and polystyrene sulfonate (PSS) were purchased from Merck (Gillingham, UK). All the reagents and chemicals used were of analytical grade and used as received. Deionized water was obtained from a Suez Select Laboratory water purification system (SUEZ Water Purification Systems Ltd., Cambridgeshire, UK). Stock solutions of E2 (0.01 M) were prepared in ethanol and diluted with 10 mM phosphate buffer solution (PBS, pH 7). The potable water sample was obtained from tap water from the University of the West of England.
2.2. Experimental Instruments
Electrochemical measurement experiments were conducted using a PalmSens Em-Stat3 Potentiostat (PalmSens BV, Houten, Houten, The Netherlands) with data acquisition using PSTrace 5.8. Cyclic voltammetry (CV) and amperometry were carried out with a typical three-electrode system consisting of a working electrode (WE), a carbon counter electrode (CE) and a reference electrode (RE). Commercial graphite rods were employed as the precursor for graphene synthesis (EEFGH) and obtained from Findel Education Limited (UK). Graphene SPEs (GHPSPE) were obtained from Palintest Limited (Gateshead, UK) and designed using a graphene ink (Product Ink: C2171023D1; Gwent Electronic Materials Ltd., Pontypool, UK) and bare SPCE. In contrast, 3D graphene foam SPEs (3D-GFSPE) were purchased from Integrated Graphene (Stirling, Scotland).
The performance of the different types of electrodes was analyzed using a cyclic voltammetry test. The test was carried out in a redox probe solution of 5 mM equimolar K3Fe(CN)6/K4Fe(CN)6 as the supporting electrolyte. The electroactive areas of the electrodes were calculated using the Randles–Sevcik equation by means of cyclic voltammetry at various scan rates in the redox solution. The test was conducted by varying the voltage from −0.3 to 0.6 V. For the analytical performance using the amperometric method, a standard estradiol solution was added at a fixed potential of +0.65 V after electrochemical oxidation was carried out using CV scanning over the potential range of 0 to 0.8 V in PBS. All the measurements were carried out in a 30 mL cell at room temperature. All the measurements were carried out in triplicate for the 3 different electrodes.
Dynamic light scattering (DLS) measurements were carried out using the Zetasizer Nano Series (Malvern Instruments Ltd., Malvern, UK). Transmission electron microscopy (TEM) was carried out on an F.E.I. Tecnai 12 BioTwin transmission electron microscope (Thermo Fisher Scientific, Waltham, MA, USA). In addition, the morphology of the electrodes was analyzed using scanning electron microscopy (SEM) (Oxford Instruments AZtec EDS) to evaluate the morphological features of the electrode surfaces.
2.3. Synthesis of Electrochemically Exfoliated Graphene (EEFGH) and Electrode Fabrication
Electrochemical exfoliation synthesis of graphene was carried out according to the procedure described in prior reports [40,48], with some modifications. Briefly, the graphite rods serving as the anode and cathode were immersed in polystyrene sulfonate (PSS) electrolytes in a reactor cell. Then, a power source supplying a constant potential of 8 V was applied between the electrodes for 24 h. As a result, the anode slowly eroded and turned the electrolyte black, with sediments forming in the reactor as time went by. Finally, the final product was centrifuged at 4000 rpm (3220× g) to collect the synthesized graphene. Figure S1 shows the electrochemical exfoliation process. To fabricate the EEFGHSPE modified electrode, EEFGH (1 mg/mL) was suspended again in deionized water with a final concentration of 0.5 mg/mL and then ultrasonicated for three hours to ensure full dispersion of the EEFGH. Finally, the SPE was modified with EEFGH by drop-casting suspensions of either 0.3, 0.5, 0.7 or 1.0 µL on the working electrode of the SPE. These were then allowed to dry at room temperature.
3. Results and Discussion
3.1. Surface Characterization
Figure 1 shows schematic presentations of the various graphene sensors used in these studies. Scanning electron microscope images of the 3D-GFSPE graphene foam SPE surface at magnifications of 2500 are shown in Figure 2A, showing the formation of a porous network structure with numerous edge plane content. Figure 2A reveals that the 3D nature of the graphene foam is recognizable, as well as the graphene foam’s uniform pore size distribution. 3D-GFSPE appears to have a coarser particle grain surface than EEFGHSPE (Figure 2B) and GHPSPE (Figure 2C). Figure 2B depicts how the SEM image of the EEFGHP/SPE surface is also characterized by coarse particles but with a differing appearance to those observed on the 3D-GFSPE and less prominent than the latter, confirming graphene formation.
Figure 2C shows a flat sheet structure, a common feature of ink-formulated SPEs, which might be due to the binder present in the electrode ink formulation. The presence of the binder can impact the analyte’s behavior at the electrode surface [7,8,9,15,17,21,27,40,41,42,43,48,49]. Figure 2D shows the energy dispersive spectroscopy (EDS) spectrum of 3D-GFSPE. This is predominated by C and O, which was expected as this is a carbon-based material. At the same time, the EDS in Figure 2E reveals that the spectrum for EEFGHPSPE contains C, O, Si and Au. Figure 2F shows the EDS of EEGHPSPE, showing C, O, Ti, Si and Cl elements. The presence of Au was concluded to result from the preparation step used in the SEM analysis. This indicates that the impurities resulted from the graphite rod and were not a result of the modifications made to the synthesis method employed. No other impurities were determinable on the SPE surface using this approach. Overall, the surface morphology of the 3D-GFSPE has a higher roughness due to the non-agglomeration of the graphene particles, unlike the GHPSPE made with ink paste. Thus, electrodes surface features exhibit different electrochemical properties [50,51,52,53,54,55,56,57,58,59,60].
Dynamic light scattering (DLS) is a technique that is used to measure the size distribution of particles dispersed in a solution based on their Brownian motion [44]. Zetasizer measurements examined the synthesized EEFGH to confirm the size of the nanoparticles, average particle size and dispersion index (Figure S2). In addition, transmission electron microscopy (TEM) measurements were performed for the electrolytic exfoliated graphene (EEFGH). For the TEM, the EEFGH was suspended and diluted 200 times with a methanol/water mixture (final concentration of 0.1 wt %). The samples were sonicated for 5 min, and 5 µL of sample was drop-cast on a glow discharged carbon/pioloform coated E.M. mesh grid and allowed to incubate for 1–2 min. The excess was wicked away after air drying the sample. Moreover, 1 mg/mL solutions of the same material were further diluted (1:9) v/v then loaded into disposable cells and the data collected at 25 °C. Both DLS and TEM were used to analyze the electrochemically exfoliated graphene, which recorded particles with an average size of 398 nm. The polydispersity index (PdI) and z-average for the EEFGH were 0.77 (PdI) and 917 (Figure S2). From these results, the particles are highly polydispersed with large or sedimenting particles, indicating DLS may not be suitable for the analysis of the prepared material. In contrast, Kirchner et al. reported an average size of 363 nm with a PdI = 0.25 [44]. The TEM image indicates transparency, with a dark area showing a thick stacking structure of several graphene layers (Figure S3).
3.2. Electrochemical Measurements
The electroactivity of each electrode was determined by means of cyclic voltammetry in the presence of 5 mM [Fe(CN)6]-3/-4 (an inner-sphere redox species that is known to be sensitive to surface oxides [61]) at various scan rates. The cyclic voltammograms revealed the behavior of the SPE surfaces. Well-defined peaks for the oxidation and reduction of [Fe(CN)6]-3/4- were obtained and are shown in Figure 3A for the 3D-GFSPE, Figure 3B for the GHPSPE and Figure 3C for the EEFGHSPE for a 5 mM [Fe(CN)6]-3/4- solution in 0.1 M KCl. Figure 3D,E shows the plots of the peak current vs. square root of scan rate (υ1/2) (25–250 mV·s−1) for both the anodic peak current (Ipa) and cathodic peak current (Ipc). Both plots show the linear relationship in magnitude with the scan rates and are plotted versus υ1/2. The observed shift in the faradaic peaks (a measurement of the electrochemical reaction) is further apart, which is commonly attributed to the slow movement of analytes toward the electrode with slower diffusion rates. This demonstrates the electrochemical processes as being diffusion controlled. The observed shift in the faradaic peaks shifts further apart, commonly attributed to porous carbon materials when the analytes move slowly to the electrode that experiences slower target analyte diffusion rates [62]. The surface areas of the 3D-GFSPE, GHPSPE and EEFGHSPE were evaluated using CV. The Randles–Sevcik equation [63] was employed to calculate the electrochemically effective area of the electrodes using the equation:
Ip = (2.69 × 10⁵) AD1/2 n3⁄2 v1⁄2C
Here, Ip is the peak current, A is the electroactive area (cm2), and n refers to the number of electrons transferred. D is the diffusion coefficient of the ferricyanide redox marker ([Fe(CN)6] = 7.2 × 10⁻⁶ cm2 s−1) [64] in 0.1 M KCl solution, C is the ferricyanide concentration (molarity), and ν is the potential scan rate (Vs−1). The electroactive surface areas were estimated as 0.2, 0.079 and 0.0125 cm2 for the 3D-GFSPE, GHPSPE and EEFGHSPE, respectively, as given in Table 2. The CV profile peak-to-peak separations (ΔEp) were 83.76 mV for 3D-GFSPE, 160 mV for EEFGH, and 308 mV for GHPSPE (298 K) at 100 mVs−1, which are greater than the ideal ΔEp value of 59 mV. A greater ΔEp value of 371 mV for an SPCE has been previously reported for commercial SPEs, of 471 mV for EuroflashTM and 416 mV UltraTM, with poor reversibility [65]. The modification of bare SPCE with EEFGHP reduces the peak-to-peak separation from 336 mV to 163.76 mV. The graphene-like material Q-Graphene is reported to reduce the peak-to-peak separation by Randviir et al. [17] on modified edge plane pyrolytic graphite (EPPG) and basal plane pyrolytic graphite (BPPG). Another report shows electrochemically exfoliated graphene prepared in 0.1 M (NH4)2SO4 at an applied potential of 10 V exhibiting a peak-to-peak separation of 347 mV by Kirchner et al. [44].
This makes the 3D-GFSPE peak-to-peak separation closer to the ideal value when compared to the GHSPE and EEFGHSPE. The potential shift at a higher scan rate recorded for the GHSPE might result from the binder on the electrode surface hindering fast electron transfer. The Ipa vs. square root of the scan rate plot revealed a gradient of 20.26 μA μM−1 for 3D-GFSPE, 9.24 μA μM−1 for GHSPE and 1.098 μM−1 for EEFGHSPE. This would agree with the lower △Ep values recorded, indicating faster electron transfer at the 3D-GFSPE [28]. The performance of 3D-GFSPE is purely based on its graphenic nature, not as a composite reported for most of the reduced graphene oxide with other materials in the literature [47,48,49,50,51,52]. The CV profile of 3D-GFSPE shows reversibility in the redox probe due to the uniformity of the surface and the porosity.
In comparison, Figure 3B for the GHSPE shows a greater quasi-reversible nature, resulting from the greater prevalence of non-conductive binder at the electrode surface. Figure 4A–C shows the linearity of the Ipa vs. υ1/2, with R2 = 0.9994 for 3D-GFSPE, R2 = 0.9746 for EEFGHSPE and R2 = 0.9862 for EEFGHSPE. The 3D-GFSPE, GHPSPE and EEFGHSPE showed a linear relationship between the peak current and the υ1/2, indicating a diffusion-limited response in all cases (Figure 3D–F). From the results above, it can be speculated that there is an enclosure of the electroactive species within the porous structure of the graphene material in the electrodes, which could affect the electrodes’ performance. This behavior is typical of carbon materials [19,20,21,22].
4. Electro-Oxidation Behavior of Estradiol
To compare the performance of the graphene material modified electrode and unmodified electrodes, the electrochemical behavior of E2 was investigated by means of cyclic voltammetry. Figure 4 shows cyclic voltammograms of E2 for the 3D-GFSPE, EEFGHPSPE and GHPSPE in 10 mM phosphate buffer solution (pH 7). It can be observed that the electrodes have comparable potential windows, ranging from approximately 0.0 to +0.8 V (vs. Ag/AgCl). The electrochemical behavior of E2 at the electrodes shows a well-defined single oxidation peak at +0.5 V, with a slight shift to +0.52 V for the EEFGHSPE and with no reduction peak observed for the reverse scans for all the electrodes, indicating the irreversible oxidation nature of E2 and the formation of a ketone derivative [37]. Our results align with Moraes et al., as similar behavior was observed for estradiol at +0.54 V using reduced graphene oxide [37] and reported for liquid-phase exfoliated graphene-modified electrode oxidation of E2 at 0.49 V [35].
These are predominated by a single anodic peak with Ipa values of 0.26 µA, 1.3 µA and 2.28 µA for the EEFGHSPE, GHPSPE and 3D-GFSPE, respectively. The CV of the EEFGHSPE has a lower oxidation peak current, as expected, followed by the GHPSPE, EEFGHSPE, and 3D-GFSPE showing the highest oxidation peak current. This signifies an increased sensitivity resulting from the inherently large surface area and electrochemical conductivity exhibited by graphene electrodes. The plots indicate the electrode process to be irreversible in both scenarios.
This indicates that the 3D-GFSPE shows better performance characteristics for the oxidation of E2 than the other graphene-based EFFGHSPE and GHSPE. For the GHSPE, the slow oxidation process observed for both E2 and the redox solutions indicates the presence of other materials on the electrode surface, typical for SPEs, leading to the need for pretreatment and modification of the electrode [6]. Further information on the scan rate behavior is presented in the Supplementary Materials (Figures S4–S6).
The electrochemical behavior of E2 at the 3D-GFSPE was investigated at various scan rates, as shown in Figure S4A. An increased current with an increasing scan rate was observed between 25 and 170 mV/s. The plot of the peak current versus υ1/2 shown in Figure S4B, as expected for the catalytic reaction, indicates diffusion processes happening at the 3D-GFSPE surface with the following equation: Ipa (μA) = 0.278 − 0.709 A/Vs−1 (R2 = 0.9976). It indicates a diffusion-controlled process. Note that the peak–peak separation increases with an increasing scan rate, indicating the irreversible nature of the electron transfer kinetics. Most carbon material-modified electrodes for phenolic sensors reported diffusion-controlled processes [33,34,35,36,37,38,39]. The GHSPE was investigated at various scan rates, as shown in Figure S5, and the various scan rates were observed for the EEFGHSPE (Figure S6). From the obtained peaks, as plotted for the peak current versus υ1/2, a linear correlation was observed between the estradiol peak current and υ1/2 (Figures S5 and S6), implying that this is a diffusion-controlled oxidation process.
4.1. Amperometric Measurement and Calibration
Combining amperometry and SPEs provides an attractive way to offer low-cost sensing [54]. It is widely applied in the determination of phenol-type compounds [12]. A fixed potential is applied to the working electrode, leading to the added analyte oxidizing at the electrode surface, and the resulting current is monitored. The magnitude of the current is directly proportional to the concentration. Amperometry measurements were carried out in 30 mL 0.1 M phosphate buffer (pH 7.0) under magnetic stirring at a constant speed. The current intensity was measured after stabilization at room temperature for the determination of E2. The working potential was fixed at +0.65 V based on the oxidation peak observed in the cyclic voltammetry, where the maximum current was obtained at +0.5 V (Figure 4). The selected applied potential was based on the oxidation peak obtained for the E2 oxidation in the cyclic voltammetry, where the maximum current was obtained (Figure 4). Thus, this potential was used for all the amperometric experiments. The influence of the applied potential in the amperometric measurements was investigated, and the applied potentials of voltages of 0.3, 0.4, 0.55 and 0.65 V were also investigated for the comparative influence of the applied potentials in the amperometric measurements.
After establishing a stable baseline at 400 s, an aliquot of 50 µL of E2 (0.5 mM) was introduced to the cell, giving an overall concentration of 0.83 µM. Once the current response had stabilized, a further five additions of 50 μL (0.5 mM) E2 were made, allowing the current to stabilize before the next addition. The design of this sensor offers a quick response time, minimized fouling that could lead to measurement instability, and required frequent cleaning of the electrodes. To avoid the above-mentioned drawbacks, the amperometric method was only used to measure the current for a short duration during the pulse’s sampling interval. This results in less time for the electrode to get fouled, thus allowing measurement at the fastest time.
Higher applied potentials have previously been reported for the amperometric determination of E2 in other reports [54]. For example, Smajdor et al. [54] investigated the measurement of E2 in 0.1 M phosphate buffer (pH 6.0) at an applied potential of +0.8 V [54].
Figure 5A,C,E depicts the amperometric responses obtained for 3D-GFSPE, GHPSPE and EEFGHSPE for consecutive additions of 50 μL of 0.5 mM E2 in PBS (pH 7.0) at an applied potential of +0.65 V vs. Ag/AgCl at 60 s intervals with the resulting calibration plots (Figure 5B,D,F) of the current against concentration. Linear lines are fitted to obtain the sensitivity based on the slope (sensitivity = S/Aeff [11]).
Figure 5 shows a calibration plot obtained for the amperometric response gained with the GHPSPE. This exhibits a linear concentration range from 0.83 µM to 4.98 µM with R2 = 0.9943. This linear behavior has been observed in the literature concerning the electroanalytical behavior of E2 [8]. Table 3 shows a comparison of the limit of detection (LOD) and sensitivity of different electrodes. The calibration plots displayed in Figure 5 (average of the current plateau from three independent calibration curves of each electrode) with error bars represent three standard deviations. The LOD values obtained were computed as (3 × SD blank)/slope (n = 3). The LOD from the GHPSPE was better compared to the 3D-GFSPE (Figure 5B) and EEFGHSPE (Figure 5F), as shown in Table 3 with their analytical performance characteristics. From the various slopes from each electrode in the table, the values at the 3D-GFSPE, GHPSPE and EEFGHSPE were 0.0301 μAμM−1, 0.0339 μAμM−1, and 0.003414 μAμM−1. There is no comparison with the other electrodes as each behaves differently. This is similar to that reported by Kirchner et al., who showed that graphene-based electrodes’ behavior and performance depended greatly on the production method employed [44]. Thus, the preparation method guides the performance of the sensor material due to the different intrinsic characteristics [44]. A steady increase in the current response from each injection represents the behavior of the electrodes toward the E2 concentrations. Figures S7–S9 depict the raw amperometry data amperometric data for the 3D-GFSPE, GHPSPE and EEFGHSPE without smoothing and baseline correction, and they are shown in the Supplementary Materials. Figure S10 shows the amperometric response obtained for the three graphene-based electrodes.
As an interference study, Figure 6A,B shows the amperometric responses obtained for the 3D-GFSPE GHSPE and EEFGHSPE for successive additions of 50 µL of 0.5 mM E2, followed by citric acid and ibuprofen in PBS (pH 7.0), at an applied potential of +0.65 V vs. Ag/AgCl. A noticeable change in the current response was observed after the addition of each E2 made, whereas no apparent current response was observed after adding either citric acid or ibuprofen. Notably, even after adding both citric acid and ibuprofen, further additions of E2 still resulted in further increases in the current, demonstrating that the sensors were unaffected by the presence of both citric acid and ibuprofen. Thus, the sensors show both selectivity and sensitivity for E2 at an applied potential of +0.65 V vs. Ag/AgCl, verifying the practicality of the sensors. These interferences were found in water, and the electrochemical sensor has been investigated for their presence in water as emerging pollutants. Citric acid has been seen as part of pharmaceutical waste, phosphate-based detergents [55], explosives manufacturing [56], and illegal drug-making use. Ibuprofen is the third largest drug used globally, and its presence in water comes from both usage and deficient water treatment systems [57]. However, it is unlike structurally similar compounds (estrone, estriol, and bisphenol A), which are hydrophobic and contain a phenolic group and may undergo electrochemical oxidation. Thus, its oxidation at the electrode surface could result in an increase in the oxidation peak current recorded for E2. Figure 6C shows a current signal noticed for the EEFGHSPE after the injection of E2, although there was no signal generation in the current response at +0.65 V potential for citric acid, ibuprofen, and progesterone, suggesting the interference-free determination of E2 at +0.65V. In contrast, estrone, estriol, and bisphenol A (BPA) show a current peak as they are oxidized at the same potential as estradiol. Thus, the oxidation of structurally similar compounds at the electrode surface poses a challenge. Figure S11 shows the interference in sensing of estradiol using SPE as model electrode.
The performance of the 3D-GFSPE, GHSPE and EEFGHSPE sensors for determining E2 is given in Table 4, with a comparison of other recent reports on E2 sensors.
4.2. Analytical Application
An essential aspect of sensor design is its ability to determine the target analyte with an acceptable level of precision for an actual sample over the appropriate concentration range. Since the sensor is intended to serve as an alternative to conventional methods and with no sample pretreatment, we subjected the sensors to tap water samples (Bristol, UK) without any sample pretreatment or the addition of a supporting electrolyte. Figure S7 depicts the response of the 3D-GFSPE and GHSPE electrodes in tap water with consecutive injections of E2 stock solution.
5. Conclusions
We investigated three graphene electrodes with no modifications or pretreatment steps. The electrochemical behavior of 3D-GFSPE, EEFGHSPE and GHPSPE in the presence of E2 as standalone disposable sensors was investigated and compared to graphene production alternatives. Surprisingly, the performance of these electrodes in relation to the redox marker showed that GHPSPE performed poorly, followed by EEFGHPSPE, which is in line with the theory of a defect-free basal-plane structure [61]. GHSPE has increased sensitivity for E2 analysis compared to EEFGH and 3D-GFSPE, despite 3D-GFSPE having better electrochemical features using the redox probe. Using binders in graphene-based ink could add uncontrollable effects to the electrochemical performance. The detection limit for E2 was 0.0041 µM for GHPSPE, 0.018 µM for EEFGHSPE and 0.097 µM for 3D-GFSPE. Graphene applied to sensor design is well established but generally in conjunction with other materials forming composites. It has been revealed that the quality of graphene strongly depends on the preparation method [23]. The simple method of producing graphene using an applied potential electrochemically and laser scribing offers the production of standalone disposable sensors as cost-effective disposable electrochemical sensors suited to environmental testing and would open numerous opportunities in electrochemical sensing.
Supplementary Materials
The following supporting information can be downloaded at https://www.mdpi.com/article/10.3390/chemosensors11060337/s1, Figure S1: Photograph of (A) graphite rods in PSS electrolyte at the beginning of the electrochemical exfoliation and (B) after the electrochemical exfoliation process, Figure S2: Particle size analysis results of synthesized electrochemically exfoliated graphene (EEFGH), Figure S3: TEM image of electrochemically exfoliated graphene; scale bar: 200 nm, Figure S4: (A) Cyclic voltammetry electrochemical profile of estradiol of 3D-GFSPE in 20 µM estradiol PBS pH 7.0 at scan rates (25–175 mV·s−1) and (B) plot of the Ipa versus square root of the scan rate (υ1/2), Figure S5: (A) Cyclic voltammetry electrochemical profile of estradiol of GHPSPE in 20 µM estradiol PBS (pH 7) at scan rates (25–175 mV·s−1) and (B) plot of the Ipa versus square root of the scan rate (υ1/2), Figure S6: (A) Cyclic voltammetry electrochemical profile of estradiol of EEFGHSPE in 20 µM estradiol PBS (pH 7) at scan rates (25–175 mV·s−1) and (B) plot of the Ipa versus square root of the scan, Figure S7: (A) Raw amperometric data for 3D-GFSPE Figure 5A (main text) without the application of smoothing or baseline correction and (B) example of baseline correction; the solid line represents the raw data and the dashed line the fitted baseline, Figure S8: (A) Raw amperometric data for GHPSPE Figure 5B (main text) without the application of smoothing or baseline correction and (B) example of baseline correction; the solid line represents the raw data and the dashed line the fitted baseline, Figure S9: (A) Raw amperometric data for EEFGHSPE Figure 5C (main text) without the application of smoothing or baseline correction and (B) example of baseline correction; the solid line represents the raw data and the dashed line the fitted baseline, Figure S10: (A) Plot of the amperometric response obtained for three graphene-based electrodes, 3D-GFSPE, GHSPE, and EEFGHSPE, for estradiol with an injection of 50 μL at 0.5 mM at 60s intervals and (B) mean of the plateau current against E2 concentration; error bars represent three standard deviations. Figure S11: Amperometric response demonstrating the interference in sensing of estradiol. Estrone (E1), Estriol (E3), progesterone (P4) and Bisphenol A (BPA) of 0.5 mM each.
Author Contributions
Conceptualization, A.M.M.; writing, A.M.M.; data analysis; A.M.M.; writing—original draft preparation, K.C.H.; writing—review and editing, K.C.H.; supervision, R.L.; project administration, J.K. supervision, K.C.H., R.L. and J.K.; funding acquisition, J.K. All authors have read and agreed to the published version of the manuscript.
Funding
This research received funding from Palintest Ltd., United Kingdom and the Petroleum Technology Development Fund (PTDF), Nigeria (No. PTDF/ED/PHD/AMM/1519/19) for Auwal M. Musa.
Institutional Review Board Statement
Not applicable.
Informed Consent Statement
Not applicable.
Data Availability Statement
Not applicable.
Acknowledgments
The authors are grateful for the support of the University of the West of England and Palintest Limited. Thanks to James Iacobini and Samantha Lunn of Palintest for their support. Thanks to David C. Ferrier, University of the West of England, for the helpful discussions, comments and suggestions.
Conflicts of Interest
The authors declare no conflict of interest.
References
- Owen, R.; Jobling, S. The hidden costs of flexible fertility. Nature 2012, 485, 441. [Google Scholar] [CrossRef]
- Pu, H.; Huang, Z.; Sun, D.W.; Fu, H. Recent advances in the detection of 17β-estradiol in food matrices: A review. Crit. Rev. Food Sci. Nutr. 2019, 59, 2144–2157. [Google Scholar] [CrossRef] [PubMed]
- Liu, Q.; Zhou, Q.; Jiang, G. Nanomaterials for analysis and monitoring of emerging chemical pollutants. TrAC Trends Anal. Chem. 2014, 58, 10–22. [Google Scholar] [CrossRef]
- Adeel, M.; Song, X.; Wang, Y.; Francis, D.; Yang, Y. Environmental impact of estrogens on human, animal and plant life: A critical review. Environ. Int. 2017, 99, 107–119. [Google Scholar] [CrossRef]
- Li, C.; Wei, Y.; Zhang, S.; Tan, W. Advanced methods to analyse steroid estrogens in environmental samples. Environ. Chem. Lett. 2020, 18, 543–559. [Google Scholar] [CrossRef]
- Wei, H.; Zhang, H.; Song, B.; Yuan, K.; Xiao, H.; Cao, Y.; Cao, Q. Metal–Organic Framework (MOF) Derivatives as Promising Chemiresistive Gas Sensing Materials: A Review. Int. J. Environ. Res. Public Health 2023, 20, 4388. [Google Scholar] [CrossRef] [PubMed]
- Musa, A.M.; Kiely, J.; Luxton, R.; Honeychurch, K.C. Recent progress in screen-printed electrochemical sensors and biosensors for the detection of estrogens. TrAC Trends Anal. Chem. 2021, 139, 116254. [Google Scholar] [CrossRef]
- Musa, A.M.; Kiely, J.; Luxton, R.; Honeychurch, K.C. An Electrochemical Screen-Printed Sensor Based on Gold-Nanoparticle-Decorated Reduced Graphene Oxide–Carbon Nanotubes Composites for the Determination of 17-β Estradiol. Biosensors 2023, 13, 491. [Google Scholar] [CrossRef]
- Butler, D.; Guilbault, G.G. Disposable amperometric immunosensor for the detection of 17-β estradiol using screen-printed electrodes. Sens. Actuators B Chem. 2006, 113, 692–699. [Google Scholar] [CrossRef]
- Alam, A.U.; Clyne, D.; Jin, H.; Hu, N.X.; Deen, M.J. Fully Integrated, Simple, and Low-Cost Electrochemical Sensor Array for in Situ Water Quality Monitoring. ACS Sens. 2020, 5, 412–422. [Google Scholar] [CrossRef] [PubMed]
- Enache, T.A.; Oliveira-Brett, A.M. Phenol and para-substituted phenols electrochemical oxidation pathways. J. Electroanal. Chem. 2011, 655, 9–16. [Google Scholar] [CrossRef]
- Hashemnia, S.; Khayatzadeh, S.; Hashemnia, M. Electrochemical Detection of Phenolic Compounds Using Composite Film of Multiwall Carbon Nanotube/Surfactant/Tyrosinase on a Carbon Paste Electrode. J. Solid State Electrochem. 2012, 16, 473–479. [Google Scholar] [CrossRef]
- Brocenschi, R.F.; Rocha-Filho, R.C.; Duran, B.; Swain, G.M. The analysis of estrogenic compounds by flow injection analysis with amperometric detection using a boron-doped diamond electrode. Talanta 2014, 126, 12–19. [Google Scholar] [CrossRef] [PubMed]
- Seo, D.H.; Pineda, S.; Woo, Y.C.; Xie, M.; Murdock, A.T.; Ang, E.Y.M.; Jiao, Y.; Park, M.J.; Il Lim, S.; Lawn, M.; et al. Anti-fouling graphene-based membranes for effective water desalination. Nat. Commun. 2018, 9, 683. [Google Scholar] [CrossRef]
- Rowley-Neale, S.J.; Brownson, D.A.C.; Smith, G.; Banks, C.E. Graphene Oxide Bulk-Modified Screen-Printed Electrodes Provide Beneficial Electroanalytical Sensing Capabilities. Biosensors 2020, 10, 27. [Google Scholar] [CrossRef]
- Ferrand, A.; Siaj, M.; Claverie, J.P. Graphene, the Swiss Army Knife of Nanomaterials Science. ACS Appl. Nano Mater. 2020, 3, 7305–7313. [Google Scholar] [CrossRef]
- Randviir, E.P.; Brownson, D.A.C.; Metters, J.P.; Kadara, R.O.; Banks, C.E. The fabrication, characterisation and electrochemical investigation of screen-printed graphene electrodes. Phys. Chem. Chem. Phys. 2014, 16, 4598–4611. [Google Scholar] [CrossRef]
- Zhao, Q.; Faraj, Y.; Liu, L.Y.; Wang, W.; Xie, R.; Liu, Z.; Ju, X.J.; Wei, J.; Chu, L.Y. Simultaneous determination of dopamine, uric acid and estriol in maternal urine samples based on the synergetic effect of reduced graphene oxide, silver nanowires and silver nanoparticles in their ternary 3D nanocomposite. Microchem. J. 2020, 158, 105185. [Google Scholar] [CrossRef]
- Novoselov, K.S.; Fal’Ko, V.I.; Colombo, L.; Gellert, P.R.; Schwab, M.G.; Kim, K. A roadmap for grapheme. Nature 2012, 490, 192–200. [Google Scholar] [CrossRef] [PubMed]
- Novoselov, K.S.; Geim, A.K.; Morozov, S.V.; Jiang, D.; Zhang, Y.; Dubonos, S.V.; Grigorieva, I.V.; Firsov, A.A. Electric Field Effect in Atomically Thin Carbon Films. Science 2016, 306, 666–669. [Google Scholar] [CrossRef]
- Cinti, S.; Arduini, F. Graphene-based screen-printed electrochemical (bio)sensors and their applications: Efforts and criticisms, Biosens. Bioelectron 2017, 89, 107–122. [Google Scholar] [CrossRef] [PubMed]
- Mattevi, C.; Eda, G.; Agnoli, S.; Miller, S.; Mkhoyan, K.A.; Celik, O.; Mastrogiovanni, D.; Granozzi, G.; Carfunkel, E.; Chhowalla, M. Evolution of electrical, chemical, and structural properties of transparent and conducting chemically derived graphene thin films. Adv. Funct. Mater. 2009, 19, 2577–2583. [Google Scholar] [CrossRef]
- Shivaraman, S.; Barton, R.A.; Yu, X.; Alden, J.; Herman, L.; Chandrashekhar, M.S.V.; Park, J.; McEuen, P.L.; Parpia, J.M.; Craighead, H.G.; et al. Free-standing epitaxial grapheme. Nano Lett. 2009, 9, 3100–3105. [Google Scholar] [CrossRef] [PubMed]
- Nuvoli, D.; Alzari, V.; Sanna, R.; Scognamillo, S.; Alongi, J.; Malucelli, G.; Mariani, A. Synthesis and characterization of graphene-based nanocomposites with potential use for biomedical applications. J. Nanopart. Res. 2013, 15, 1512. [Google Scholar] [CrossRef]
- Keeley, G.P.; O’Neill, A.; Holzinger, M.; Cosnier, S.; Coleman, J.N.; Duesberg, G.S. DMF-exfoliated graphene for electrochemical NADH detection. Phys. Chem. Chem. Phys. 2011, 13, 7747–7750. [Google Scholar] [CrossRef] [PubMed]
- Coleman, J.N. Liquid exfoliation of defect-free grapheme. Acc. Chem. Res. 2013, 46, 14–22. [Google Scholar] [CrossRef]
- Baradoke, A.; Pastoriza-Santos, I.; González-Romero, E. Screen-printed GPH electrode modified with Ru nanoplates and PoPD polymer film for NADH sensing: Design and characterization. Electrochim. Acta 2019, 300, 316–323. [Google Scholar] [CrossRef]
- Fan, X.; Xu, Y.; Sheng, T.; Zhao, D.; Yuan, H.; Liu, F.; Liu, X.; Zhu, X.; Zhang, L.; Lu, J. Amperometric Sensor for Dopamine Based on Surface-Graphenization Pencil Graphite Electrode Prepared by In-situ Electrochemical Delamination. Microchim. Acta 2019, 186, 1–8. [Google Scholar] [CrossRef]
- Barton, H.; Berbel-Filho, W.M.; Consuegra, S.; Francis, L.; Tizaoui, C.; Conlan, R.S.; Teixeira, S.R. Ultrasensitive environmental assessment of xeno-estrogens in water samples using label-free graphene immunosensors. Anal. Biochem. 2018, 548, 102–108. [Google Scholar] [CrossRef] [PubMed]
- Arvand, M.; Hemmati, S. Analytical methodology for the electrocatalytic determination of estradiol and progesterone based on graphene quantum dots and poly(sulfosalicylic acid) co-modified electrode. Talanta 2017, 174, 243–255. [Google Scholar] [CrossRef]
- Braga, G.B.; Oliveira, A.E.F.; Pereira, A.C. Total Determination of Estrogenic Phenolic Compounds in River Water Using a Sensor Based on Reduced Graphene Oxide and Molecularly Imprinted Polymer. Electroanalysis 2018, 30, 2176–2184. [Google Scholar] [CrossRef]
- Janegitz, F.A.B.C.; Dos Santos, R.C.; Faria, V. Zucolotto, Electrochemical determination of estradiol using a thin film containing reduced graphene oxide and dihexadecylphosphate. Mater. Sci. Eng. C 2014, 37, 14–19. [Google Scholar] [CrossRef] [PubMed]
- Li, Y.; Zhao, X.; Li, P.; Huang, Y.; Wang, J.; Zhang, J. Highly sensitive Fe3O4 nanobeads/graphene-based molecularly imprinted electrochemical sensor for 17β-estradiol in water. Anal. Chim. Acta 2015, 884, 106–113. [Google Scholar] [CrossRef]
- Li, T.H.; Wang, D.; Lan, H.Z.; Gan, N. Determination of 17β-estradiol based on electropolymerized-molecularly imprinted polymer on gold nanoparticles-graphene modified electrode. Adv. Mater. Res. 2014, 881, 93–97. [Google Scholar] [CrossRef]
- Hu, L.; Cheng, Q.; Chen, D.; Ma, M.; Wu, K. Liquid-phase exfoliated graphene as highly sensitive sensor for simultaneous determination of endocrine disruptors: Diethylstilbestrol and estradiol. J. Hazard. Mater. 2015, 283, 157–163. [Google Scholar] [CrossRef]
- Wen, T.; Xue, C.; Li, Y.; Wang, Y.; Wang, R.; Hong, J.; Zhou, X.; Jiang, H. Reduced graphene oxide-platinum nanoparticles composites based imprinting sensor for sensitively electrochemical analysis of 17β-estradiol. J. Electroanal. Chem. 2012, 682, 121–127. [Google Scholar] [CrossRef]
- Moraes, F.C.; Rossi, B.; Donatoni, M.C.; De Oliveira, K.T.; Pereira, E.C. Sensitive determination of 17β-estradiol in river water using a graphene based electrochemical sensor. Anal. Chim. Acta 2015, 881, 37–43. [Google Scholar] [CrossRef]
- Özcan, A.; Topçuoğulları, D. Voltammetric determination of 17-Β-estradiol by cysteamine self-assembled gold nanoparticle modified fumed silica decorated graphene nanoribbon nanocomposite. Sens. Actuators B Chem. 2017, 250, 85–90. [Google Scholar] [CrossRef]
- Rather, J.A.; Khudaish, E.A.; Kannan, P. Graphene-amplified femtosensitive aptasensing of estradiol, an endocrine disruptor. Analyst 2018, 143, 1835–1845. [Google Scholar] [CrossRef] [PubMed]
- Karuwan, C.; Wisitsoraat, A.; Phokharatkul, D.; Sriprachuabwong, C.; Lomas, T.; Nacapricha, D.; Tuantranont, A. A disposable screen printed graphene-carbon paste electrode and its application in electrochemical sensing. RSC Adv. 2013, 3, 25792–25799. [Google Scholar] [CrossRef]
- Pasakon, P.; Mensing, J.P.; Phokaratkul, D.; Karuwan, C.; Lomas, T.; Wisitsoraat, A.; Tuantranont, A. A high-performance, disposable screen-printed carbon electrode modified with multi-walled carbon nanotubes/graphene for ultratrace level electrochemical sensors. J. Appl. Electrochem. 2019, 49, 217–227. [Google Scholar] [CrossRef]
- Santos, A.M.; Wong, A.; Prado, T.M.; Fava, E.L.; Fatibello-Filho, O.; Sotomayor, M.D.P.T.; Moraes, F.C. Voltammetric determination of ethinylestradiol using screen-printed electrode modified with functionalized graphene, graphene quantum dots and magnetic nanoparticles coated with molecularly imprinted polymers. Talanta 2021, 224, 121804. [Google Scholar] [CrossRef]
- Ferrari, A.G.M.; Foster, C.W.; Kelly, P.J.; Brownson, D.A.C.; Banks, C.E. Determination of the electrochemical area of screen-printed electrochemical sensing platforms. Biosensors 2018, 8, 53. [Google Scholar] [CrossRef] [PubMed]
- Kirchner, E.M. Electroanalysis and Raman Spectroscopy of Graphene-Modified Electrodes Influenced by the Synthesis and Transfer of the Two-Dimensional Nanomaterial. Ph.D. Thesis, University of Regensburg, Regensburg, Germany, June 2020. Available online: https://epub.uni-regensburg.de/43493/ (accessed on 5 May 2021).
- Marques, A.C.; Cardoso, A.R.; Martins, R.; Sales, M.G.F.; Fortunato, E. Laser-Induced Graphene-Based Platforms for Dual Biorecognition of Molecules. ACS Appl. Nano Mater. 2020, 3, 2795–2803. [Google Scholar] [CrossRef]
- Griffiths, K.; Dale, C.; Hedley, J.; Kowal, M.D.; Kaner, R.B.; Keegan, N. Laser-scribed graphene presents an opportunity to print a new generation of disposable electrochemical sensors. Nanoscale 2014, 6, 13613–13622. [Google Scholar] [CrossRef]
- Luo, J.; Dai, Z.; Feng, M.; Gu, M.; Xie, Y. Graphitic Carbon Nitride/Ferroferric Oxide/Reduced Graphene Oxide Nanocomposite as Highly Active Visible Light Photocatalyst. Nano Res. 2023, 16, 371–376. [Google Scholar] [CrossRef]
- Karuwan, C.; Sriprachuabwong, C.; Wisitsoraat, A.; Phokharatkul, D.; Sritongkham, P.; Tuantranont, A. Inkjet-printed gra-phene-poly(3,4-ethylenedioxythiophene):poly(styrene- sulfonate) modified on screen printed carbon electrode for electro-chemical sensing of salbutamol. Sens. Actuators B Chem. 2012, 161, 549–555. [Google Scholar] [CrossRef]
- Metters, J.P.; Kadara, R.O.; Banks, C.E. New Directions in Screen Printed Electroanalytical Sensors: An Overview of Recent Developments. Analyst 2011, 136, 1067–1076. [Google Scholar] [CrossRef]
- Settu, K.; Lai, Y.C.; Liao, C.T. Carbon Nanotube Modified Laser-Induced Graphene Electrode for Hydrogen Peroxide Sensing. Mater. Lett. 2021, 300, 130106. [Google Scholar] [CrossRef]
- Olowu, R.A.; Arotiba, O.; Mailu, S.N.; Waryo, T.T.; Baker, P.; Iwuoha, E. Electrochemical Aptasensor for Endocrine Disrupting 17β-Estradiol Based on a Poly(3,4-ethylenedioxylthiopene)-Gold Nanocomposite Platform. Sensors 2010, 10, 9872–9890. [Google Scholar] [CrossRef]
- Chang, Z.; Zhu, B.; Liu, J.J.; Zhu, X.; Xu, M.; Travas-Sejdic, J. Electrochemical aptasensor for 17β-estradiol using disposable Laser scribed graphene electrodes. Biosens. Bioelectron. 2021, 185, 113247. [Google Scholar] [CrossRef]
- Yoon, H.; Nah, J.; Kim, H.; Ko, S.; Sharifuzzaman, M.; Barman, S.C.; Xuan, X.; Kim, J.; Park, J.Y. A chemically modified laser-induced porous graphene based flexible and ultrasensitive electrochemical biosensor for sweat glucose detection. Sens. Actuators B Chem. 2020, 311, 127866. [Google Scholar] [CrossRef]
- Smajdor, J.; Piech, R.; Ławrywianiec, M.; Paczosa-Bator, B. Glassy Carbon Electrode Modified with Carbon Black for Sensitive Estradiol Determination by Means of Voltammetry and Flow Injection Analysis with Amperometric Detection. Anal. Biochem. 2018, 544, 7–12. [Google Scholar] [CrossRef] [PubMed]
- Berovic, M. Legisa, Citric acid production, Biotechnol. Annu. Rev. 2007, 13, 303–343. [Google Scholar] [CrossRef]
- Ambrosi, A.; Pumera, M. Electrochemically Exfoliated Graphene and Graphene Oxide for Energy Storage and Electrochemistry Applications. Chem. A Eur. J. 2016, 22, 153–159. [Google Scholar] [CrossRef] [PubMed]
- Lin, J.; Peng, Z.; Liu, Y.; Ruiz-Zepeda, F.; Ye, R.; Samuel, E.L.G.; Yacaman, M.J.; Yakobson, B.I.; Tour, J.M. Laser-induced porous graphene films from commercial polymers. Nat. Commun. 2014, 5, 5–12. [Google Scholar] [CrossRef] [PubMed]
- Yang, S.; Zhang, P.; Nia, A.S.; Feng, X. Emerging 2D Materials Produced via Electrochemistry. Adv. Mater. 2020, 32, 1907857. [Google Scholar] [CrossRef]
- Torrinha, Á.; Carneiro, P.; Dias, D.; Delerue-Matos, C.; Morais, S. The Simpler the Better: Highly Sensitive 17α-ethinylestradiol Sensor Based on an Unmodified Carbon Paper Transducer. Talanta 2022, 245, 123457. [Google Scholar] [CrossRef] [PubMed]
- Lin, X.; Li, Y. A Sensitive Determination of Estrogens with a Pt Nano-Clusters/Multi-Walled Carbon Nanotubes Modified Glassy Carbon Electrode. Biosens. Bioelectron. 2006, 22, 253–259. [Google Scholar] [CrossRef]
- McCreery, R.L.; McDermott, M.T. Comment on electrochemical kinetics at ordered graphite electrodes. Anal. Chem. 2012, 84, 2602–2605. [Google Scholar] [CrossRef]
- Batista, I.V.; Lanza, M.R.V.; Dias, I.L.T.; Tanaka, S.M.C.N.; Tanaka, A.A.; Sotomayor, M.D.P.T. Electrochemical Sensor Highly Selective for Estradiol Valerate Determination Based on a Modified Carbon Paste with Iron Tetrapyridinoporphyrazine. Analyst 2008, 133, 1692–1699. [Google Scholar] [CrossRef] [PubMed]
- Song, J.; Yang, J.; Hu, X. Electrochemical determination of estradiol using a poly (L-serine) film-modified electrode. J. Appl. Electrochem. 2008, 38, 833–836. [Google Scholar] [CrossRef]
- Konopka, S.J.; McDuffie, B. Diffusion Coefficients of Ferri- and Ferrocyanide Ions in Aqueous Media, Using Twin-Electrode Thin-Layer Electrochemistry. Anal. Chem. 1970, 42, 1741–1746. [Google Scholar] [CrossRef]
- Morrin, A.; Killard, A.J.; Smyth, M.R. Electrochemical characterization of commercial and home-made screen-printed carbon electrodes. Anal. Lett. 2003, 36, 2021–2039. [Google Scholar] [CrossRef]
Figure 1.
Schematic representation of the graphene-based sensor framework.

Figure 2.
SEM images of the (A) 3D-GFSPE surface at 2500× magnification, (B) EEFGHP/SPE surface at a magnification of 1000×, and (C) GHSPE surface at a magnification of 500×. (D) shows the EDS spectrum of the 3D-GFSPE, showing the C and O elements. (E) EEGHPSPE shows C, O, Ti, Si and Cl elements. (F) GHPSPE shows C, O, Si, Ti and Au elements.
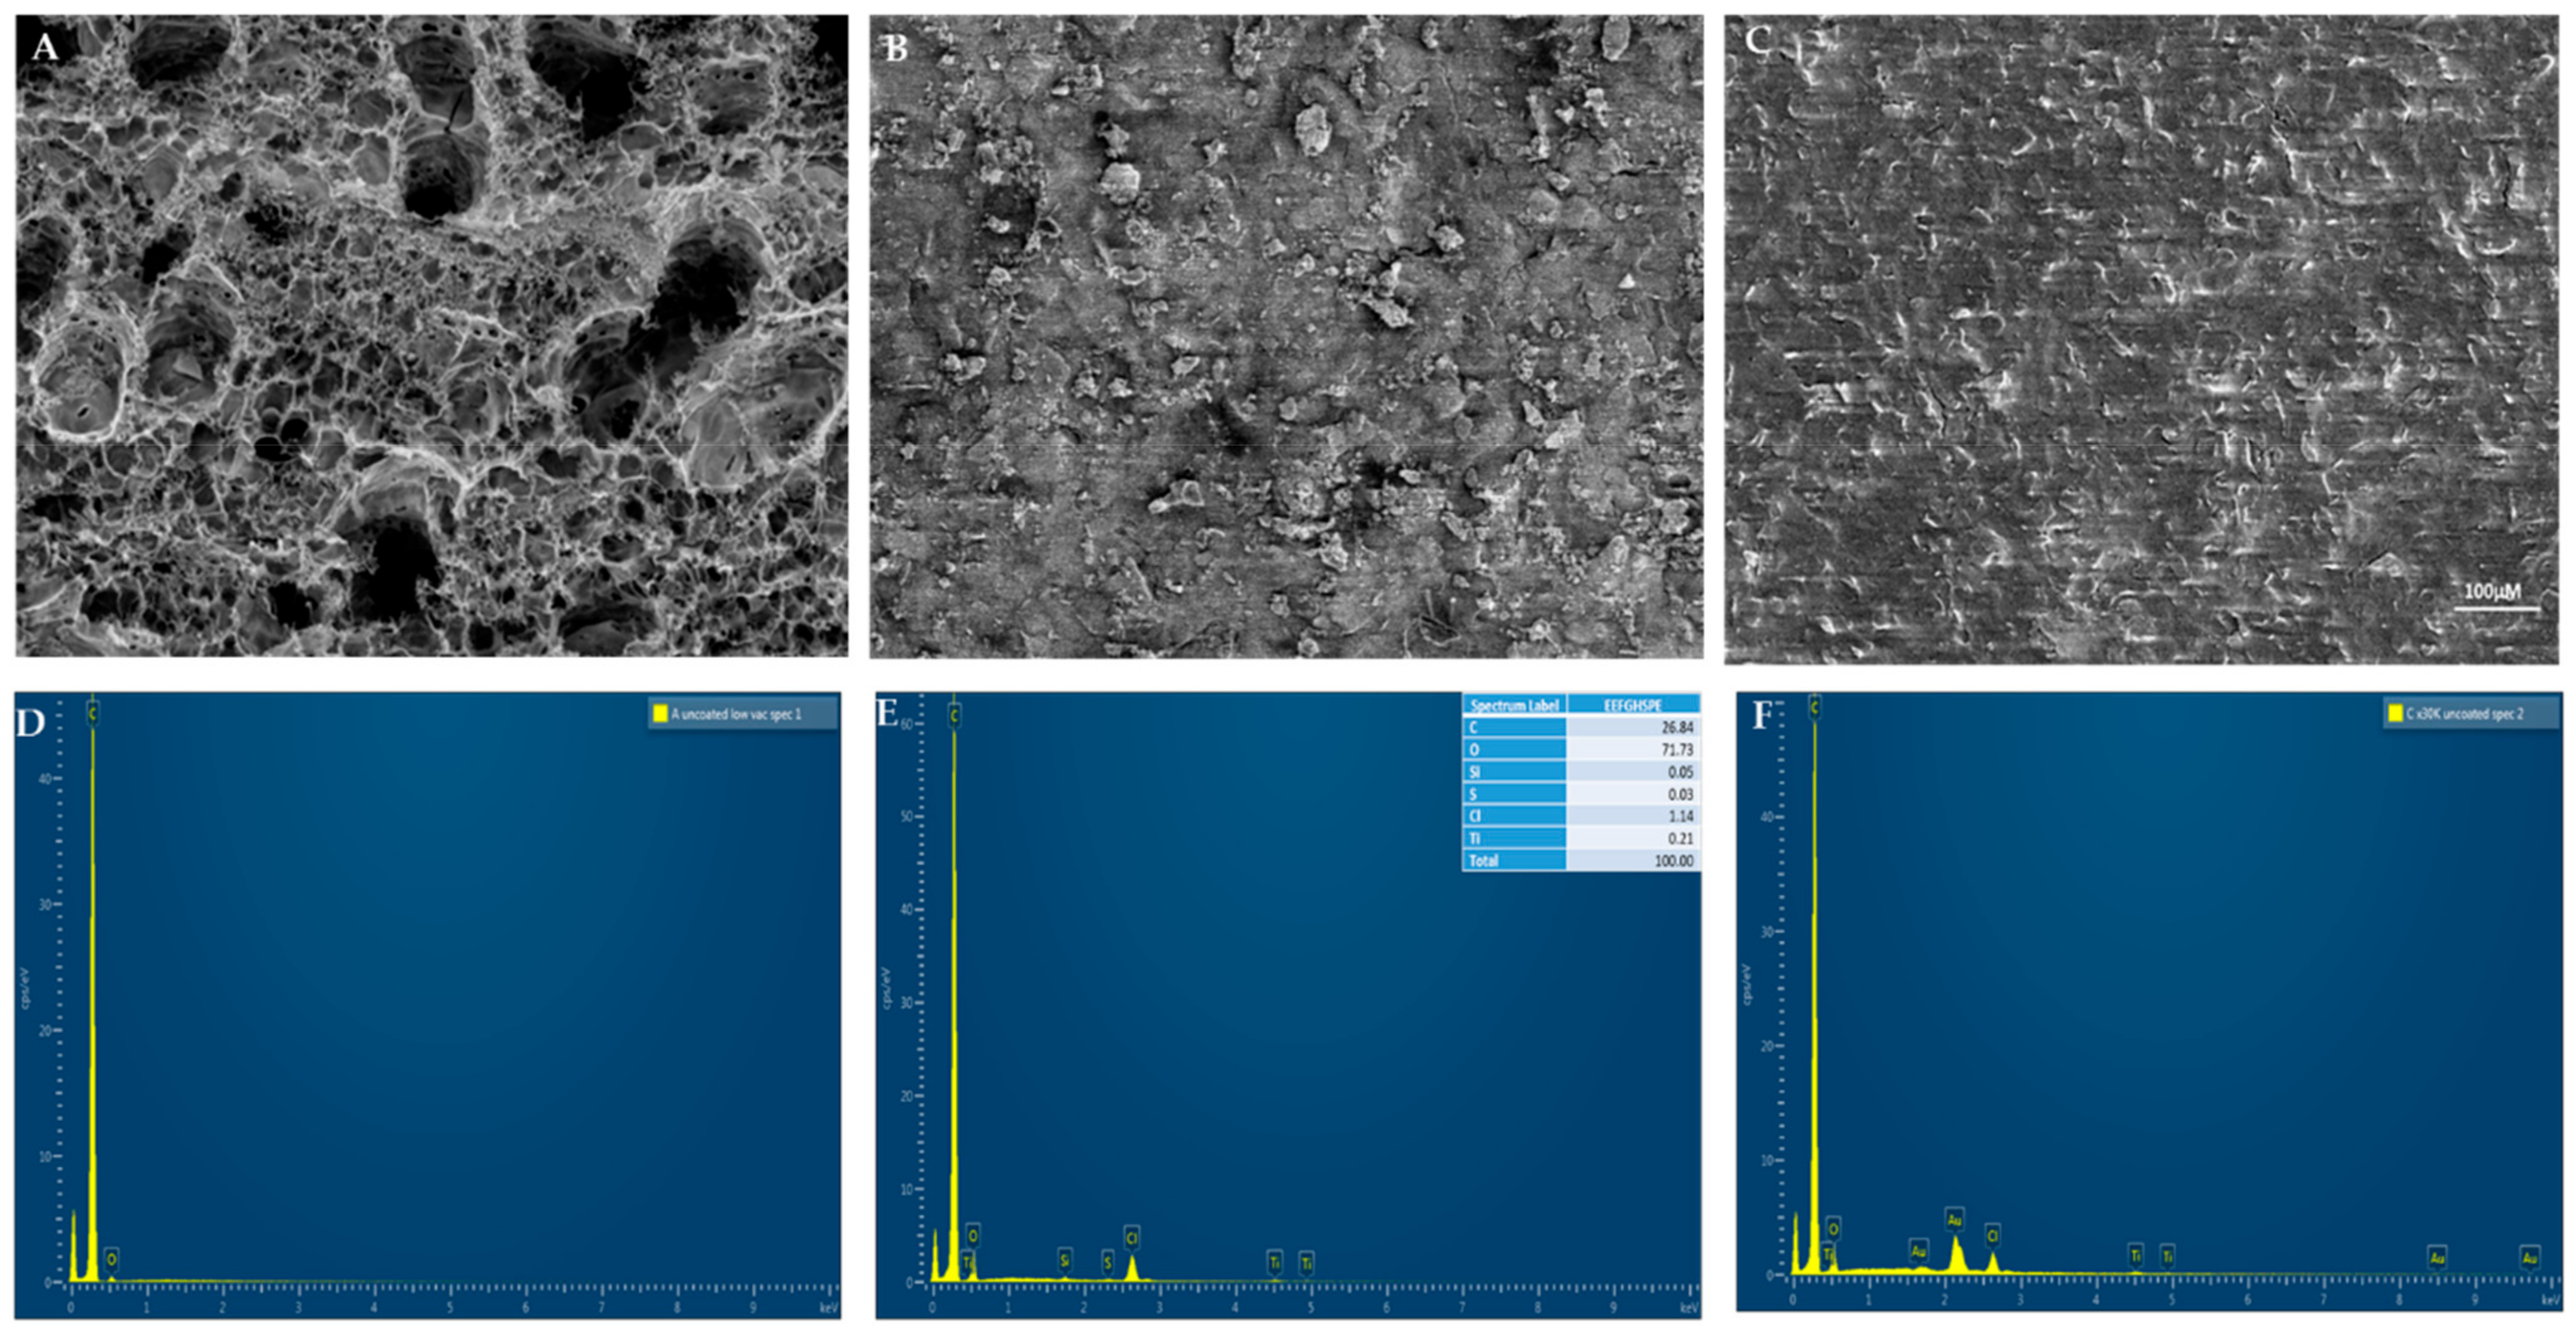
Figure 3.
Cyclic voltammograms of (A) 3D-GFSPE in 5 mM [Fe(CN)6]-3/4- 0.1 M KCl at potential scan rates (25–250 mVs−1), (B) GHSPE in 5 mM [Fe(CN)6]-3/4- in 0.1 M KCl at potential scan rates (25–250 mVs−1), and (C) EEFGHSPE in 5 mM [Fe(CN)6]-3/4- in 0.1 M KCl at potential scan rates (25–250 mVs−1), (D). A plot of the 3D-GFSPE Ipa and Ipc versus the square root of the scan rate (υ1/2) at potential scan rates (25–250 mVs−1). (E) Plot of the GHSPE Ipa and Ipc versus the square root of the scan rate (υ1/2) at potential scan rates (25–250 mVs−1) (F). Plot of the EEFGHSPE Ipa and Ipc versus the square root of the scan rate (υ1/2) at potential scan rates (25–250 mVs−1).
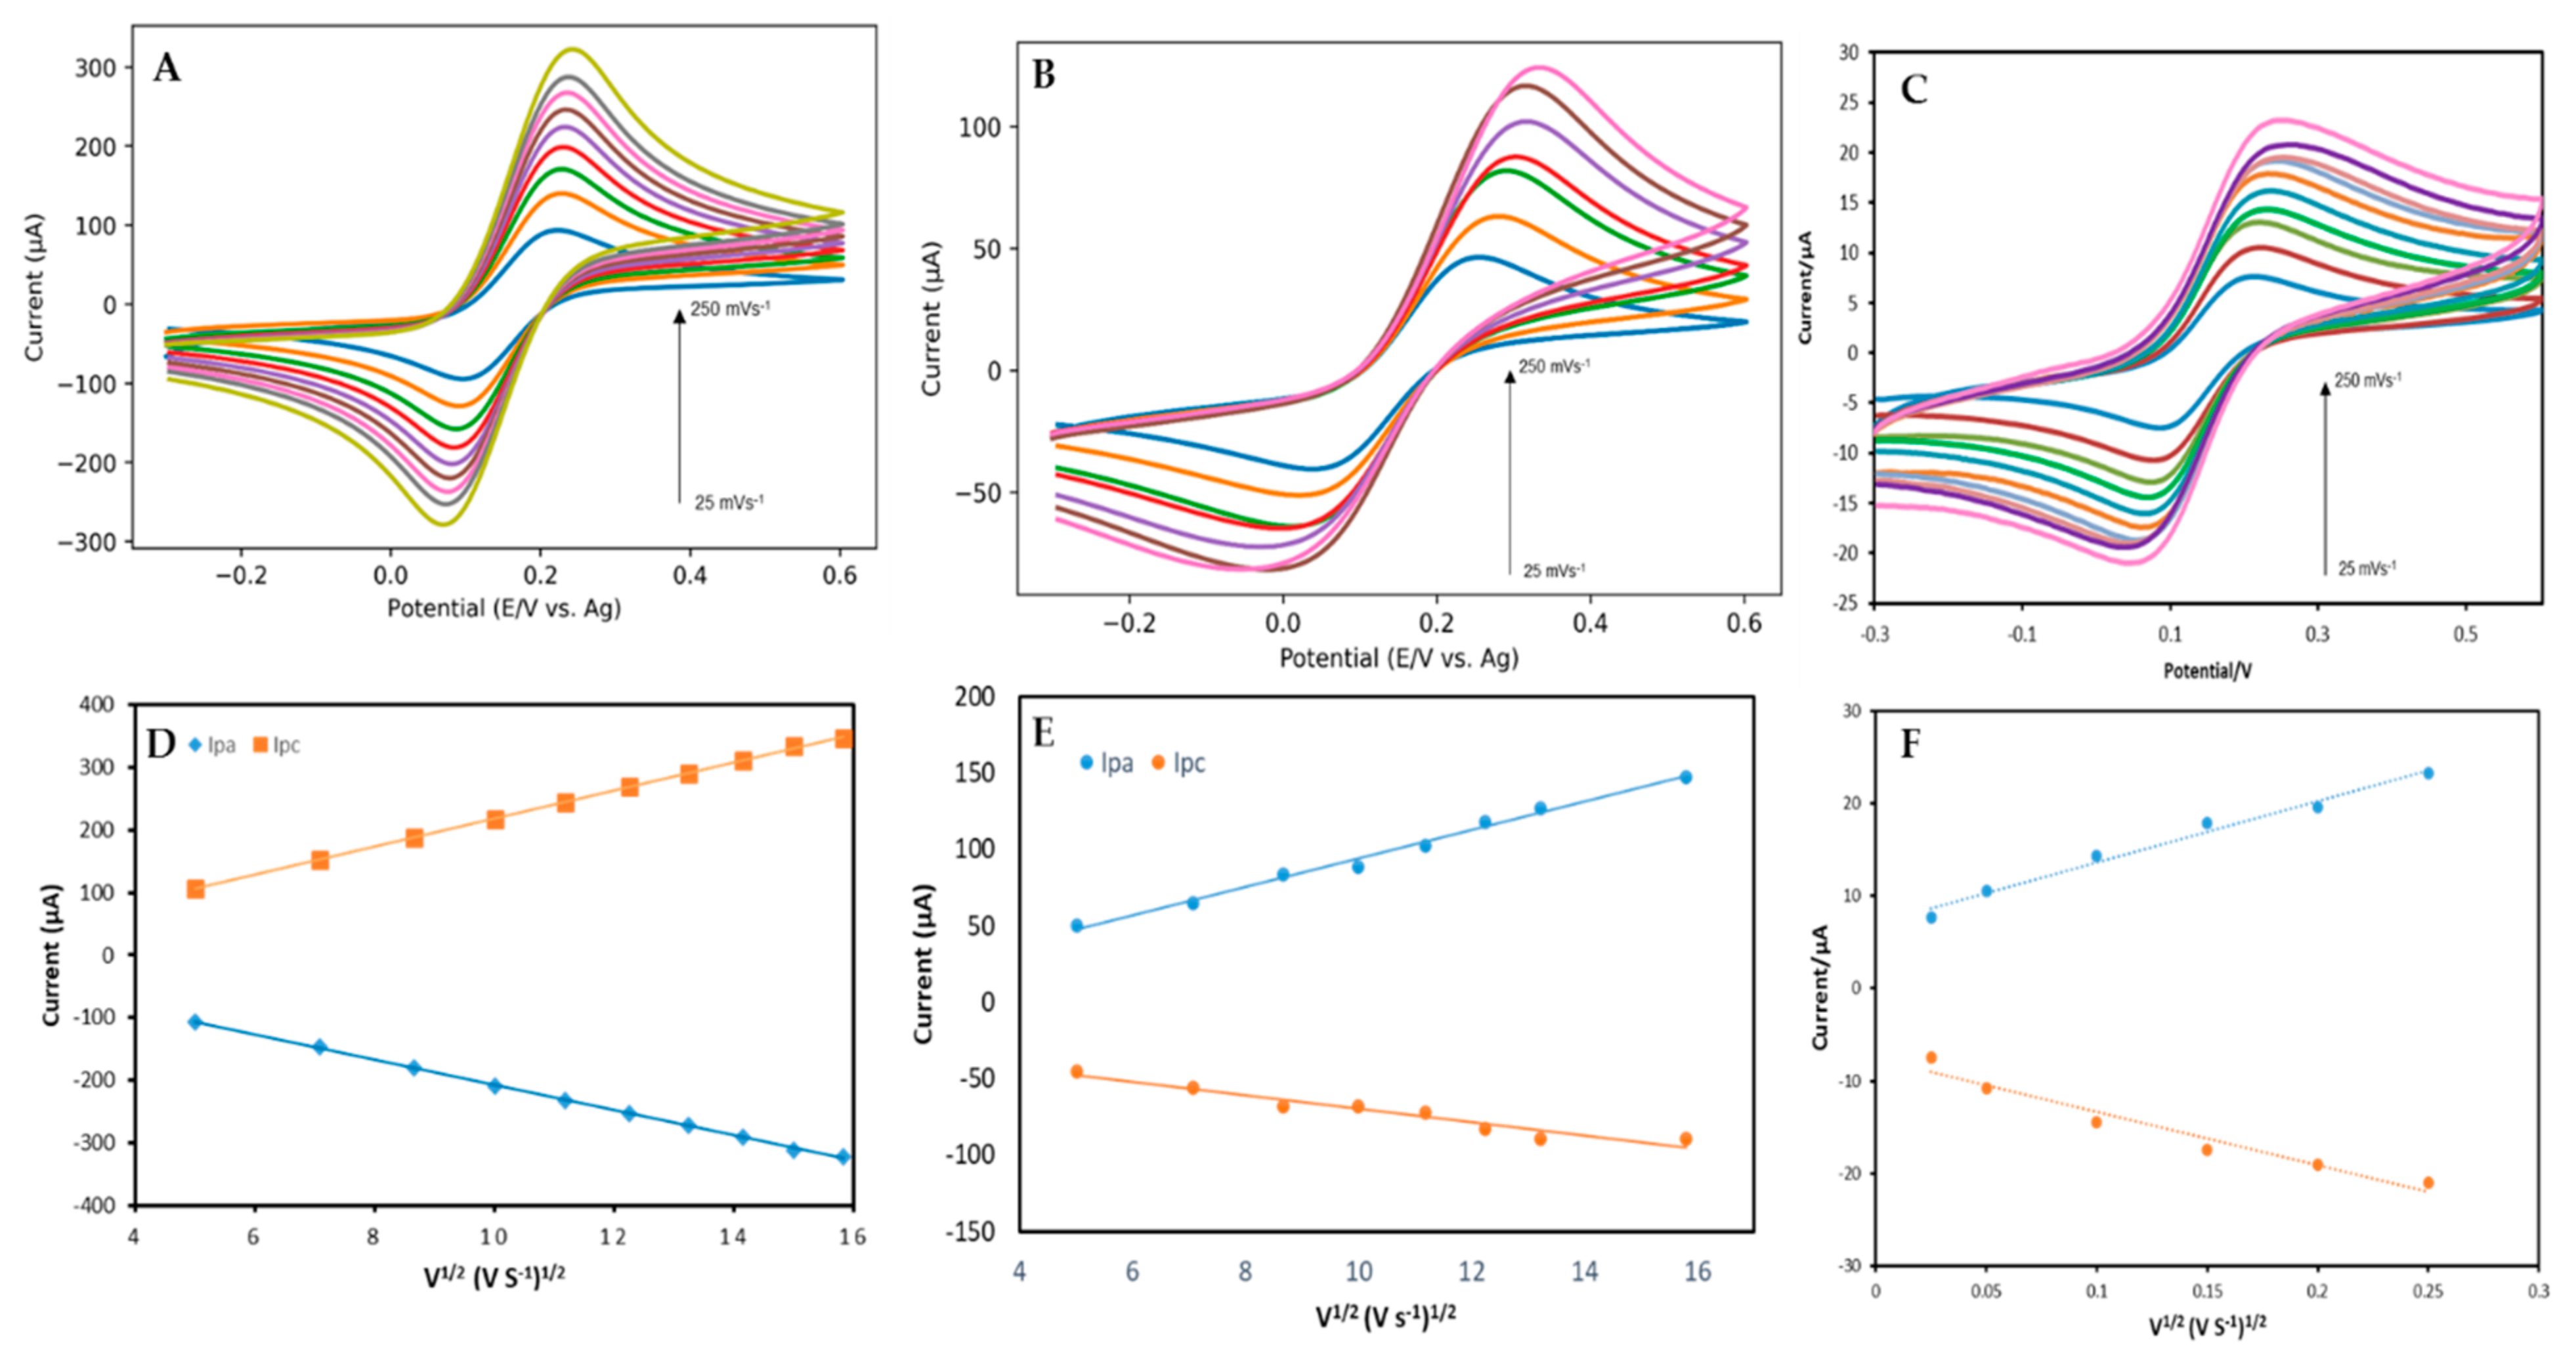
Figure 4.
Cyclic voltammograms obtained for 20 µM estradiol (E2) at EEGHSPE (a), GHPSPE (b), 3D-GFSPE (c) in PBS pH 7.0 at 0.1 Vs−1.
Figure 4.
Cyclic voltammograms obtained for 20 µM estradiol (E2) at EEGHSPE (a), GHPSPE (b), 3D-GFSPE (c) in PBS pH 7.0 at 0.1 Vs−1.

Figure 5.
The amperometric response for (A) 3D-GFSPE, (B) calibration plot of 3D-GFSPE, (C) amperometric response of GHPSPE, (D) calibration plot of GHPSPE, (E) amperometric response of EEFGHSPE, and (F) calibration plot of EEFGHSPE for the successive addition of 50 µL of 0.5 mM estradiol in PBS (pH 7.0) at an applied potential of +0.65 V vs. Ag/AgCl at 60 s intervals. Average of the current plateau (relative to baseline) against the concentration. Error bars represent three standard deviations.
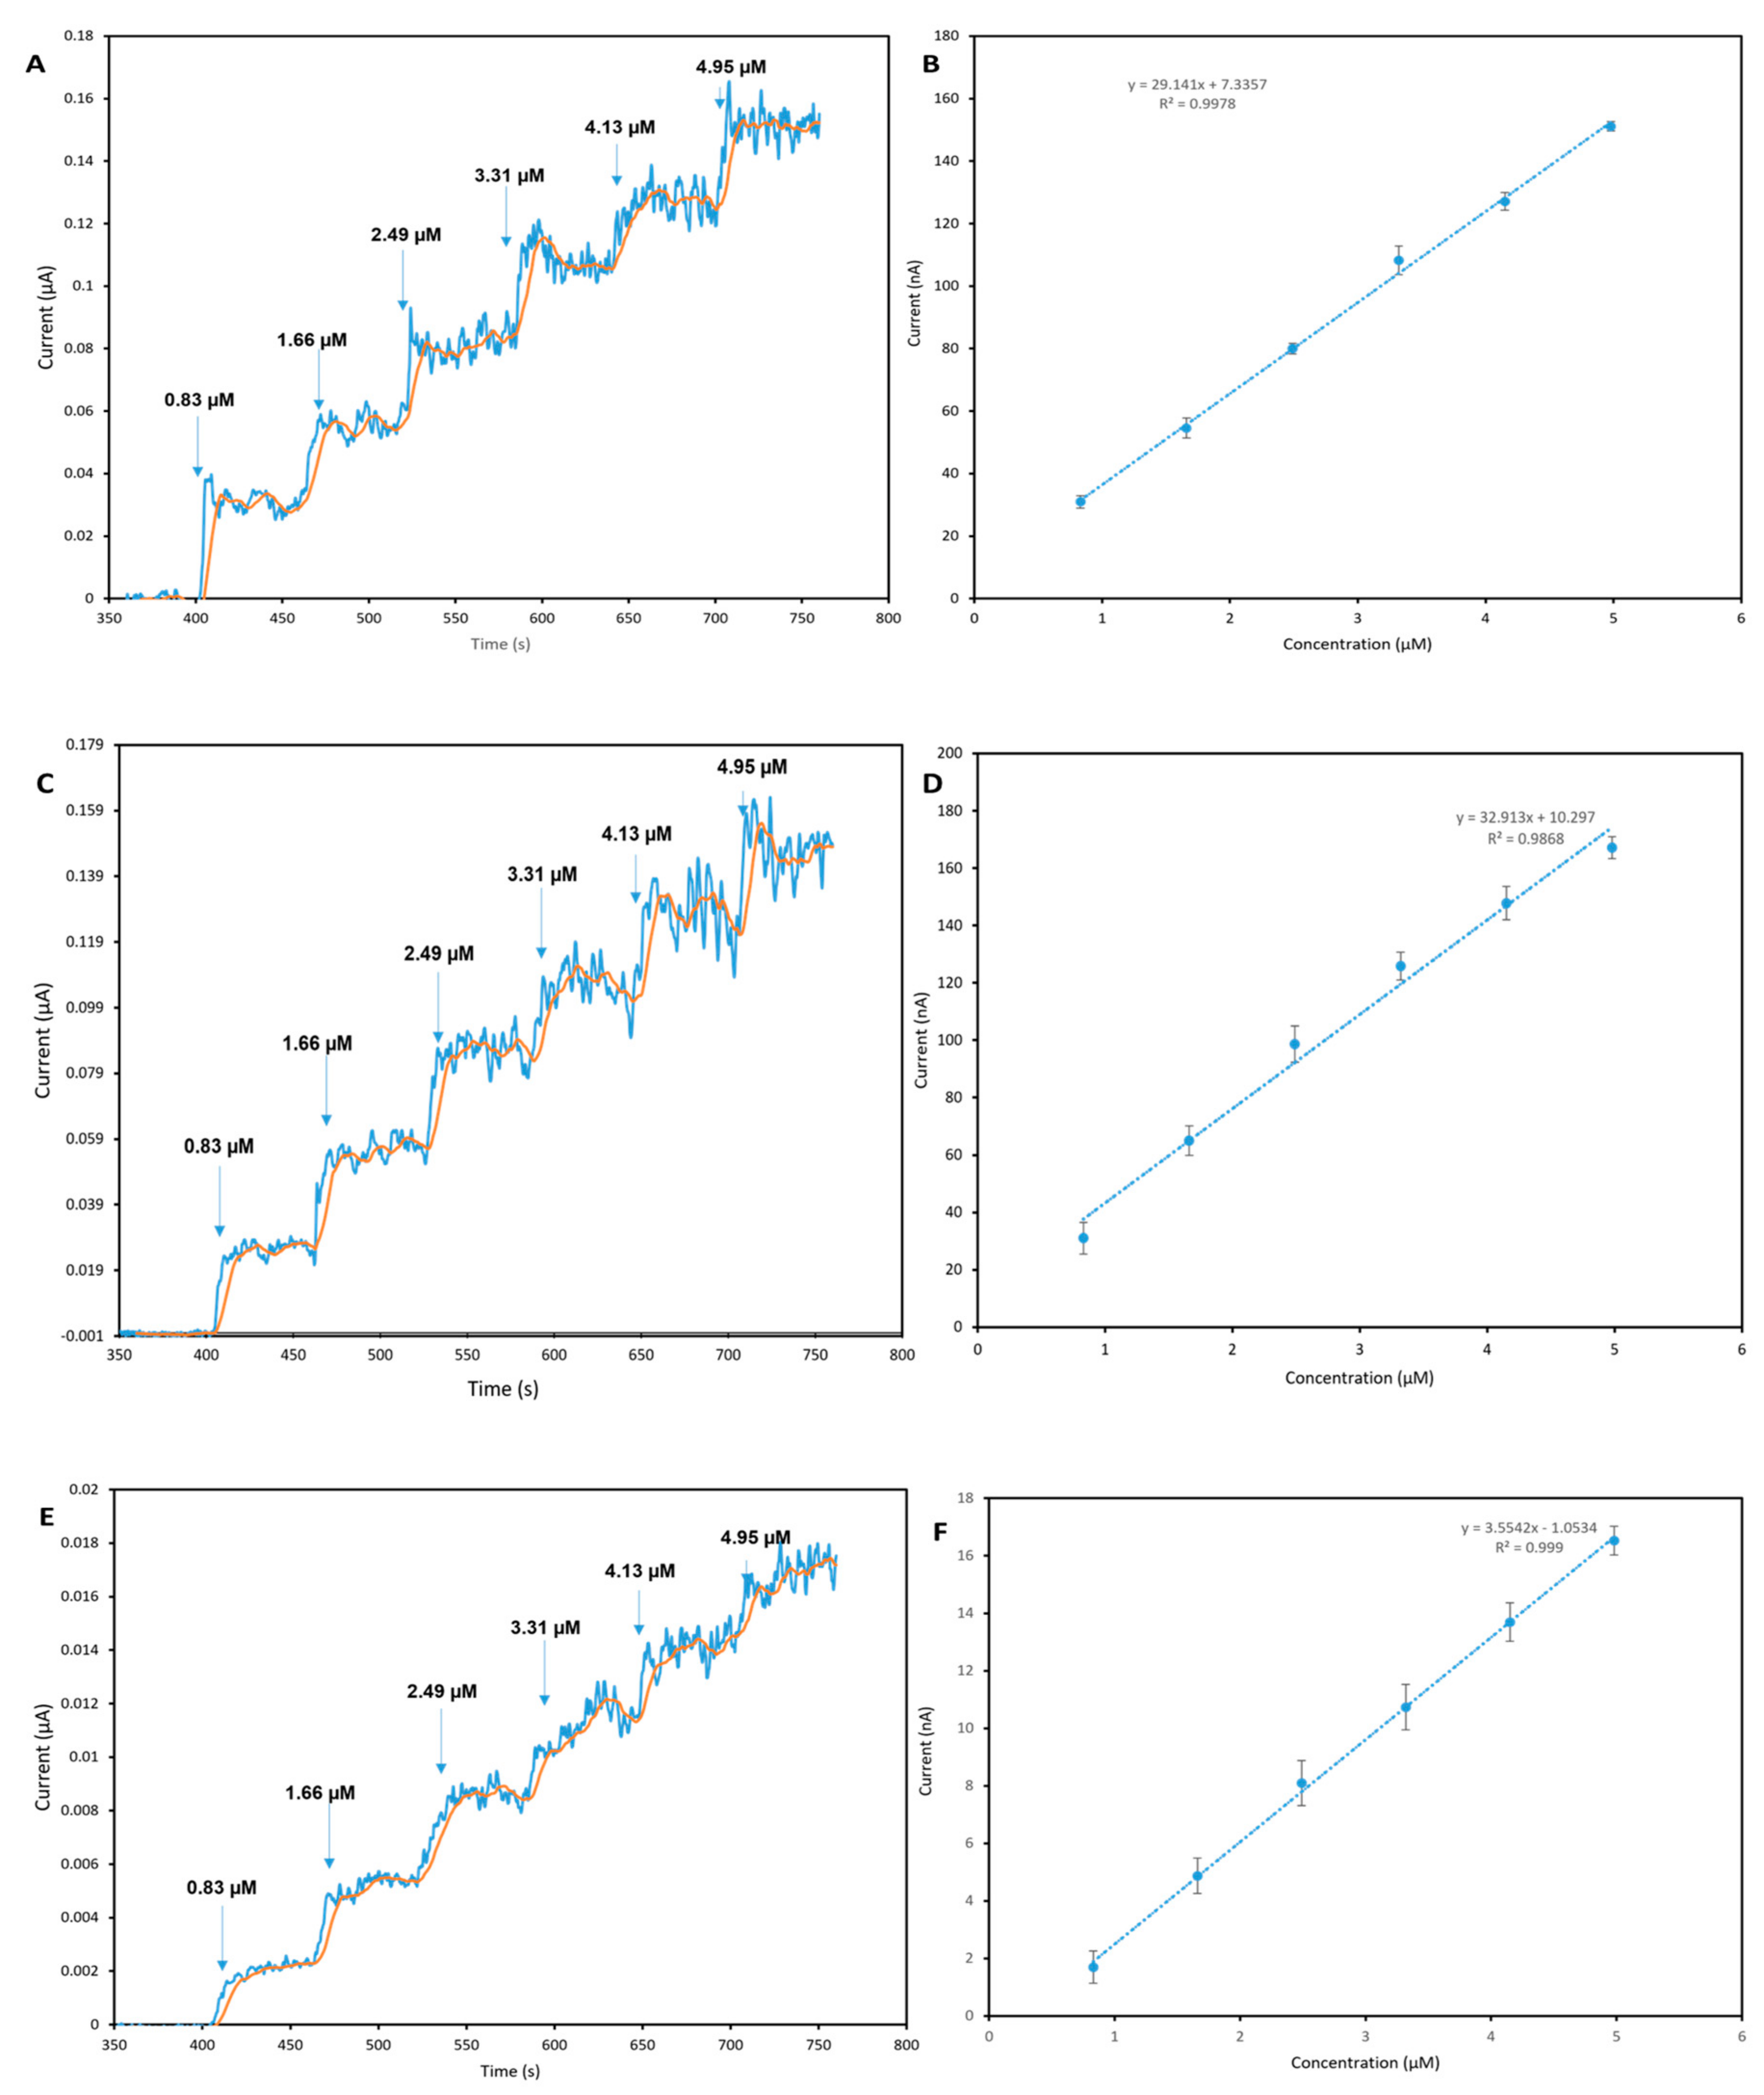
Figure 6.
(A) Amperometric response obtained for 3D-GFSPE for the successive addition of 50 µL of 0.5 mM E2, citric acid and ibuprofen in PBS (pH 7.0) at an applied potential +0.65 V at 60 s intervals. (B) Amperometric response obtained for GHPSPE for the successive addition of 50 µL of 0.5 mM E2, citric acid and ibuprofen in PBS (pH 7.0) at an applied potential of +0.65 V at 60 s intervals. (C). Amperometric response obtained for EEFGHPSPE for the successive addition of 50 µL of 0.5 mM E2, citric acid and ibuprofen in PBS (pH 7.0) at an applied potential of +0.65 V at 60 s intervals.

Table 2.
Summary of the cyclic voltammetric data (at 0.1 V s−1) for 5 mM [Fe(CN)6]-3/4- in 0.1 M KCl.
Table 2.
Summary of the cyclic voltammetric data (at 0.1 V s−1) for 5 mM [Fe(CN)6]-3/4- in 0.1 M KCl.
| GHSPE | 3D-GFSPE | EEFGH | |
|---|---|---|---|
| ΔEp/mV | 391 | 89 | 163 |
| Ipa/µA | 89 | 197 | 14.2 |
| a ECSA/cm2 | 0.2 | 0.079 | 0.0125 |
a Electrochemical active surface area (ECSA).
Table 3.
Performance of 3D-GFSPE, GHSPE and EEFGHSPE sensors for the determination of E2.
| GHSPE | 3D-GFSPE | EEFGH | |
|---|---|---|---|
| Working potential (V) | +0.65 | +0.65 | +0.65 |
| Linear range (µM) | 0.83–4.98 | 0.83–4.98 | 0.83–4.98 |
| Reproducibility (%RSD) | 5.7 | 4.45 | 6.3 |
| Detection limit (µM) | 0.0041 | 0.097 | 0.018 |
| Sensitivity (µAµM−1cm−2) | 0.151 | 0.429 | 0.273 |
Table 4.
Comparison of some recent reports on estradiol sensors.
| Electrode | Technique | Linear Range (μM) | LOD (μM) | Sample | Ref. |
|---|---|---|---|---|---|
| Boron-doped diamond electrode | Amperometry | 0.1–3.0 | 0.1 | River water | [13] |
| Carbon fiber paper | Differential pulse voltammetry | 0.001–0.0001 | 0.00014 | River Water | [59] |
| Glassy carbon electrode with platinum/multi-walled carbon nanotube MWCNTs | Square wave voltammetry | 0.5–1 | 0.018 | Serum | [60] |
| Carbon paste modified with iron tetrapyridinoporphyrazine | Amperometry | 45–450 | 0.013 | injection | [62] |
| Glassy carbon with poly(L-serine) | Square wave voltammetry | 0.10–30.0 | 0.02 | Serum | [63] |
| 3D graphene foam screen-printed electrode | Amperometry | 0.83–0.15 | 0.097 | Tap water | This work |
| Graphene ink screen-printed electrode | Amperometry | 0.83–4.98 | 0.0041 | Tap water | This work |
| Electrochemically exfoliated graphene (EEFGH) screen-printed electrode | Amperometry | 0.83–4.98 | 0.018 | Tap water | This work |
Disclaimer/Publisher’s Note: The statements, opinions and data contained in all publications are solely those of the individual author(s) and contributor(s) and not of MDPI and/or the editor(s). MDPI and/or the editor(s) disclaim responsibility for any injury to people or property resulting from any ideas, methods, instructions or products referred to in the content. |
© 2023 by the authors. Licensee MDPI, Basel, Switzerland. This article is an open access article distributed under the terms and conditions of the Creative Commons Attribution (CC BY) license (https://creativecommons.org/licenses/by/4.0/).
Share and Cite
MDPI and ACS Style
Musa, A.M.; Kiely, J.; Luxton, R.; Honeychurch, K.C. Graphene-Based Electrodes for Monitoring of Estradiol. Chemosensors 2023, 11, 337. https://doi.org/10.3390/chemosensors11060337
AMA Style
Musa AM, Kiely J, Luxton R, Honeychurch KC. Graphene-Based Electrodes for Monitoring of Estradiol. Chemosensors. 2023; 11(6):337. https://doi.org/10.3390/chemosensors11060337
Chicago/Turabian StyleMusa, Auwal M., Janice Kiely, Richard Luxton, and Kevin C. Honeychurch. 2023. "Graphene-Based Electrodes for Monitoring of Estradiol" Chemosensors 11, no. 6: 337. https://doi.org/10.3390/chemosensors11060337
Note that from the first issue of 2016, this journal uses article numbers instead of page numbers. See further details here.