Article

A Paper-Based Multicolor Colorimetric Aptasensor for the Visual Determination of Multiple Sulfonamides Based on Aptamer-Functionalized Magnetic Beads and NADH–Ascorbic Acid-Mediated Gold Nanobipyramids

1
Key Laboratory for Analytical Science of Food Safety and Biology of MOE, College of Chemistry, Fuzhou University, Fuzhou 350108, China
2
State Key Laboratory of Ecological Pest Control for Fujian and Taiwan Crops, College of Plant Protection, Fujian Agriculture and Forestry University, Fuzhou 350002, China
*
Authors to whom correspondence should be addressed.
Chemosensors 2023, 11(7), 386; https://doi.org/10.3390/chemosensors11070386
Submission received: 10 June 2023 / Revised: 7 July 2023 / Accepted: 8 July 2023 / Published: 9 July 2023

Abstract

:
It is crucial that simple and high-throughput methods for determining multiple, or groups of, sulfonamides (SAs) be developed since they are widely used in animal husbandry and aquaculture. We developed a paper-based multicolor colorimetric aptasensor to detect 3 SAs: sulfaquinoxaline (SQ), sulfamethoxypyridazine (SMP) and sulfamethoxydiazine (SMD). Using a broad-specificity aptamer as a bioreceptor, we reduced the growth of nicotinamide adenine dinucleotide I (NADH)–ascorbic acid (AA)-mediated gold nanobipyramids (AuNBPs) to generate a multicolor signal. We also used a paper-based analytical device (PAD) system to deposit AuNBPs for a sensitive color signal read out. The aptasensor can detect more color changes corresponding to the concentrations of SQ, SMP and SMD and has higher sensitivity, better specificity and stability. It can also be used to determine SQ, SMP and SDM individually, or collectively, or any two together with a visual detection limit of 0.3–1.0 µM, a spectrometry quantification limit (LOQ) of 0.3–0.5 µM and a spectrometry detection limits (LOD) of 0.09–0.15 µM. The aptasensor was successfully used to determine SQ, SMP and SDM in fish muscle with a recovery of 89–94% and a RSD n = 5) < 8%, making it a promising method for the rapid screening of total SQ, SMP and SDM residue in seafood.

1. Introduction

Sulfonamides (SAs), one of the oldest groups of synthetic antibiotics, offers low-cost and broad-spectrum activity against bacterial infection [1,2], and up to now they have been widely used as feed additives to treat infectious diseases in animal husbandry and aquaculture [3,4,5]. However, the inappropriate or excessive use of SAs inevitably results in excess residue in animal-derived food since animals cannot completely metabolize or degrade SAs [6,7,8]. Such excess residue poses a danger to human health [9,10], and thus a maximum SA residue limit (MRL) of 100 µg/Kg was established by the European Union to ensure consumption safety [11]. At present, the groups contain 19 commonly used SAs, and different SAs are usually used in rotation to avoid generating drug resistance. (Their full names, abbreviations and chemical structures are summarized in Figure S1 in Supporting Information, SI). Thus, it is essential to develop simple and high-throughput assays to determine multiple SAs, preferably groups of SAs, to achieve the rapid screening of residues in animal-derived food.
High-performance liquid chromatography–mass spectrometry (HPLC–MS) simultaneously determines groups of SAs with a high sensitivity, which makes it a main technique for determining SA residues [12,13,14,15]. However, HPLC–MS requires time-consuming pre-treatment of samples and a costly apparatus, which do not meet the requirements of rapid screening. An immunoassay, including enzyme-linked immunosorbent assay (ELISA), is easy to use and does not require a costly apparatus. Thus, some immunoassays, including a few high-throughput ELISAs that use broad-specificity anti-SA antibodies as bioreceptors, have been developed for the rapid screening of multiple SA residues [16,17,18,19,20,21]. However, immunoassays have obvious weaknesses such as poor thermal stability, higher cost and risk of false positives. Compared to antibodies, aptamers offer advantages such as a similar or higher affinity to target molecules, higher stability, lower cost, and ease of modification. So far, some aptamer-based methods have been developed for the rapid determination of SAs [22,23,24,25,26,27,28,29,30,31,32]. Unfortunately, most previous aptamer-based methods determined only one kind of SA such as sulfadimethoxine (SDM) or sulfamethazine (SMZ) [22,23,24,25,26,27,28,29,30,31,32], not multiple or groups of SAs, which means they did meet the requirements for the rapid screening of SA residues in food. Recently, we isolated a broad-specificity SA aptamer and further established a colorimetric method for the visual determination of multiple SAs by using the isolated aptamer as bioreceptor together with dye displacement [33]. However, the high-throughput colorimetric method has poorer sensitivity because of the dye displacement.
Gold nanobipyramids (AuNBPs) generate strong light absorption and vivid color changes in response to the tunable aspect ratio due to localized surface plasmon resonance (LSPR) [34,35]. Therefore, colorimetric assays based on AuNBPs can exhibit vivid multiple color changes, which can be distinguished more easily by naked eye observation, giving them higher visual sensitivity and accuracy [36,37]. In particular, AuNBPs with reduced nicotinamide adenine dinucleotide I (NADH)–ascorbic acid (AA)-mediated growth have more colorful and clearer color changes corresponding to AA concentrations in the lower range [38], which provides a promising color signal for developing sensitive colorimetric methods. Encouraged by the above results, we developed a paper-based multicolor colorimetric aptasensor based on a broad-specificity SA aptamer, the NADH–AA-mediated AuNBP growth system with a paper-based analytical device (PAD), to provide a sensitive, high-throughput assay for the rapid screening and semi-quantitative determination of multiple SA residues in animal-derived food by naked eye observation.

2. Materials and Methods

2.1. Chemicals and Apparatus

The 19 commonly used SAs—sulfaquinoxaline (SQ), sulfamethoxypyridazine (SMP), sulfamethoxydiazine (SMD), sulfachloropyridazine (SCP), sulfapyridine (SPD), sulfamethazine (SMZ), sulfadimethoxine (SDM), sulfisomidine (SIM), sulfamonomethoxine (SMM), sulfamerazine (SMR), sulfathiazole (ST), sulfabenzamide (SB), sulfadoxine (SDX), sulfadiazine (SD), sulfamethizole (SMT), sulfisoxazole (SIZ), sulfaguanidine (SG), sulfapyrazole (SPA) and sulfacetamide (SAA)—and 6 other antibiotics—cefotaxime (CTX), tetracycline (TC), enrofloxacin (ENR), kanamycin (KANA), ampicillin (AMP) and oxacillin (OXA)—were purchased from Aladdin Biochemical Technology Co., Ltd. (Shanghai, China). All oligonucleotides (see Table S1 in SI), which were purified with HPLC, were purchased from Sangon Biotech Co., Ltd. (Shanghai, China). The ELISA Kit for detection of SQ and SMD was obtained from Suzhou Kuaikang Biotechnology Co., Ltd. (Suzhou, China).
The buffers used in the experiment are as follow: TES buffer was a mixture of 10 mM Tris, 1.0 mM EDTA and 2.0 M NaCl (pH 9.5); TEST buffer is the TES buffer contained 0.01% Tween-20 (pH 9.5); binding buffer was a mixture of 10 mM Tris-HCl, 3.0 M NaCl, 10 mM MgCl2 and 0.05% Tween-20 (pH 7.35–7.45); PBST buffer was a mixture of 2.0 mM KH2PO4, 10 mM Na2HPO4·12H2O, 137 mM NaCl, 3.0 mM KCl and 0.01% Tween-20 (pH 7.4); PBST–BSA buffer was a PBST buffer containing 0.02% bovine serum albumin (BSA); substrate buffer was a mixture of 0.6 M Tris-HCl buffer and 0.005% of BSA (pH 9.5). Other reagents, materials and apparatuses used in the experiment are summarized in the SI.

2.2. Fabrication of the Paper-Based Analytical Device (PAD) and Preparation of Gold Seeds

The PAD used in the experiment was fabricated according to the previous method with a minor modification [39]. Briefly, a highly absorbent cotton layer and then a nylon membrane were laid flat on an acrylic plate, and then a processed 96-hole acrylic plate was placed on the top layer (see Figure S2 in SI).
The solution for the gold seeds was prepared using the previous method [40]. Briefly, 0.25 mL of 25 mM freshly prepared NaBH4 cold solution was fleetly added to a 10 mL solution, of 50 mM hexadecyl trimethyl ammonium chloride (CTAC), 5 mM citric acid and 0.25 mM HAuCl4, under vigorous stirring for 2 min. Subsequently, the solution was incubated at 80 °C for 90 min to form gold seeds and then stored at 5 °C in the dark and used within 60 days.

2.3. Detection of Multiple SAs with PAD-Based Multicolor Colorimetric Aptasensor

First, 1.5 µM of broad-specificity aptamer sequence (aptamer) and 1.5 µM of link DNA 1 (cDNA-1) modified by a biotin on its 3’ end were mixed at equal volume in a TES buffer, incubated for 10 min at 95 °C and naturally cooled to room temperature to form the aptamer/cDNA-1 conjugate. Meanwhile, 3.0 µL of streptavidin-modified magnetic beads (MBs, ~1 µm, 10 g/L) were taken, put into a vial, washed 3 times with 30 µL of TEST buffer and re-dispersed in 30 µL of TES buffer. Then, 30 µL of aptamer/cDNA-1 conjugate was added, and the whole was incubated for 30 min at room temperature and vigorously agitated to immobilize the aptamer/cDNA-1 conjugate on the MB surfaces (aptamer/cDNA-1/MBs). The aptamer/cDNA-1/MBs were washed 2 times with 60 µL of TEST buffer and then re-dispersed in 30 µL of binding buffer. The aptamer/cDNA-1/MBs dispersion was stored at 5 °C for use within one month.
In another vial, 3.0 µL of the same MBs were added and washed 3 times with 30 µL of TEST buffer and then re-dispersed in 30 µL of TES buffer. Subsequently, 30 µL of 2.0 µM cDNA-1 solution (dissolved in TES buffer) was added, and the whole was incubated for 30 min under room temperature and vigorous agitation to immobilize cDNA-1 on the MB surfaces (cDNA-1/MBs). The cDNA-1/MBs were then washed 2 times with 60 µL of TEST buffer and then re-dispersed in 30 µL of binding buffer. The cDNA-1/MBs dispersion was stored at 5 °C for use within one month.
To determine the target SAs (SQ, SMP and SMD), 30 µL of the above aptamer/cDNA-1/MBs dispersion and 20 µL of target SAs standard or sample solution were mixed in a vial for 45 min to perform the specific binding of the SAs and aptamer, which will release SAs/aptamer complex into the solution from the aptamer/cDNA-1/MBs. The solution was separated from the MBs by a magnet and collected into a vial. Subsequently, 30 µL of the cDNA-1/MBs dispersion, 50 µL of link DNA 2 (cDNA-2) modified with biotin on its 5’ end, and 15 µL of binding buffer were added, and the whole solution was incubated for 1 h under room temperature and vigorous agitation to obtain the conjugate of cDNA-1/MBs, aptamer and cDNA-2 (cDNA-1/MBs/aptamer/cDNA-2), which was separated and collected with a magnet. After being washed two times with 60 µL binding buffer, the cDNA-1/MBs/aptamer/cDNA-2 was re-dispersed in 45 µL of PBST buffer. Next, 15 µL of streptavidin-modified alkaline phosphatase (streptavidin-ALP) solution was added, and the whole solution was agitated for 30 min to bind streptavidin-ALP to cDNA-1/MBs/aptamer/cDNA-2 (cDNA-1/MBs/aptamer/cDNA-2/ALP), which was washed 3 times with PBST-BSA buffer. Then 100 µL of 6.0 mM L-ascorbic acid 2-phosphate trisodium salt (AAP) dissolved in substrate buffer was added, and the whole solution was incubated for 20 min at 37 °C to perform the ALP enzymolysis of AAP to obtain AA. Finally, 5 µL of 660 mM HCl was added to stop the enzymolysis, and the AAP solution was separated and collected with a magnet.
In 86.4 µL of AAP enzymolysis solution, 86 µL of AuNBP growth solution (190 mM cetyltrimethylammonium bromide, 730 μM HAuCl4, 200 μM AgNO3, 40 mM HCl, and 2.0 mM NADH) and 0.6 µL of the abovementioned gold seed solution were added. The mixture was incubated for 15 min at 50 °C to obtain AuNBPs. After that, 120 μL of the AuNBPs solution was dropwise added to the PAD with 5 min standing to deposit AuNBPs on a nylon membrane. After washing the membrane with pure water, the color of the deposited AuNBPs (in a wet state) was immediately observed by the naked eye and recorded by a camera. Simultaneously, the AuNBP-deposited nylon membrane was positioned in a 96-well plate frame, and the extinction spectra of the AuNBPs were measured by a microplate reader in the range of 400–1000 nm. The concentration of target SAs was calculated according to the AuNBPs color or the maximum localized surface plasmon resonance absorption wavelength (λLSPR).

2.4. Detection of Fish Muscle Sample

The SAs in the fish muscle samples were extracted using the Industry Standards for Entry-Exit Inspection and Quarantine of China (SN/T 5140-2019). Briefly, about 0.1 g of dried fish muscle, vacuum freeze-dried at −46 °C, was extracted with 5 mL of ethyl acetate for 10 min under ultrasonic agitation. Then, the extract was separated and collected via centrifugation, and the residue was extracted once again in the same manner. The two extracts were combined, and the total was evaporated to near dryness using a pressured nitrogen blowing concentrator. After dissolving the residue with 2 mL of binding buffer, 5 mL of hexane was added, and the whole extract was fully vortexed for 2 min to remove lipids by discarding the hexane solution. Finally, the remaining solution was filtered through a 0.22 μm filter and then directly used for the colorimetric detection of SAs according to the procedure in Section 2.3. The samples that spiked with SAs in advance were also analyzed by the same procedure to investigate the recovery. The concentration of each SQ, SMP and SMD in the sample was detected by using the corresponding SAs as calibration. The sum of SQ, SMP and SMD or the sum of any two was screened or semi-quantitatively detected using a mixture of SQ and SMD (1:1) as calibration.

3. Results and Discussion

3.1. The Principle of the PAD-Based Multicolor Colorimetric Aptasensor

The detailed strategy of the PAD-based multicolor colorimetric aptasensor is shown in Scheme 1. A competitive aptamer-binding system was employed to recognize the target SAs (SQ, SMP and SMD), a sensitive NADH-AA-mediated system was employed to regulate AuNBP growth to generate vivid multicolor signals, and a PAD system was used to deposit AuNBPs so that the color signals could be sensitively and stably read out. In the competitive aptamer-binding system, Xu et al. [33] reported a broad-specificity SA aptamer that was used as a bioreceptor and had binding affinity to SQ, SMP, SMD, SCP and SPD (higher to SQ, SMP and SMD and lower to SCP and SPD). A link probe 1 (cDNA-1) modified with biotin on the 3’ end, was designed to hybridize with part of the aptamer to form an aptamer/cDNA-1 conjugate. This was immobilized on the MB surfaces (aptamer/cDNA-1/MBs) via a specific interaction between the biotin and streptavidin to achieve convenient separation/collection. Upon the addition of target SAs (SQ, SMP and SMD), the aptamer specifically bound with the target SAs to form an SAs/aptamer complex and thus separated from the aptamer/cDNA-1/MBs. By removing the excess aptamer/cDNA-1/MBs with a magnet, the released SAs/aptamer in solution hybridized with the cDNA-1-modified MBs (MBs/cDNA-1) and link probe 2 (cDNA-2), modified with biotin on the 5’ end, to form an MB/cDNA-1/aptamer/cDNA-2 conjugate. It captured streptavidin-ALP via the biotin on the 5’ end of cDNA-2 to form an MB/cDNA-1/aptamer/cDNA-2/ALP conjugate, which specifically hydrolyzes AAP to generate AA. The presence of more target SAs resulted in more MBs/cDNA-1/aptamer/cDNA-2-ALP, thus generating more AA.
In the NADH-AA-mediated AuNBP growth system, the AA generated in a competitive aptamer-binding system sensitively promoted AuNBP growth to generate AA-corresponding colorful multicolor changes [38]. The PAD system was used to deposit AuNBPs on a nylon membrane to concentrate and stabilize its colors to achieve a sensitive read out of AuNBP multicolor changes. Thus, the combination of the above competitive aptamer-binding system, NADH–AA-mediated AuNBP growth system and PAD system provided high throughput and a sensitive and stable multicolor colorimetric sensing platform to determine each SQ, SMP and SMD, or the sum of the 3 SAs or the sum of any two.

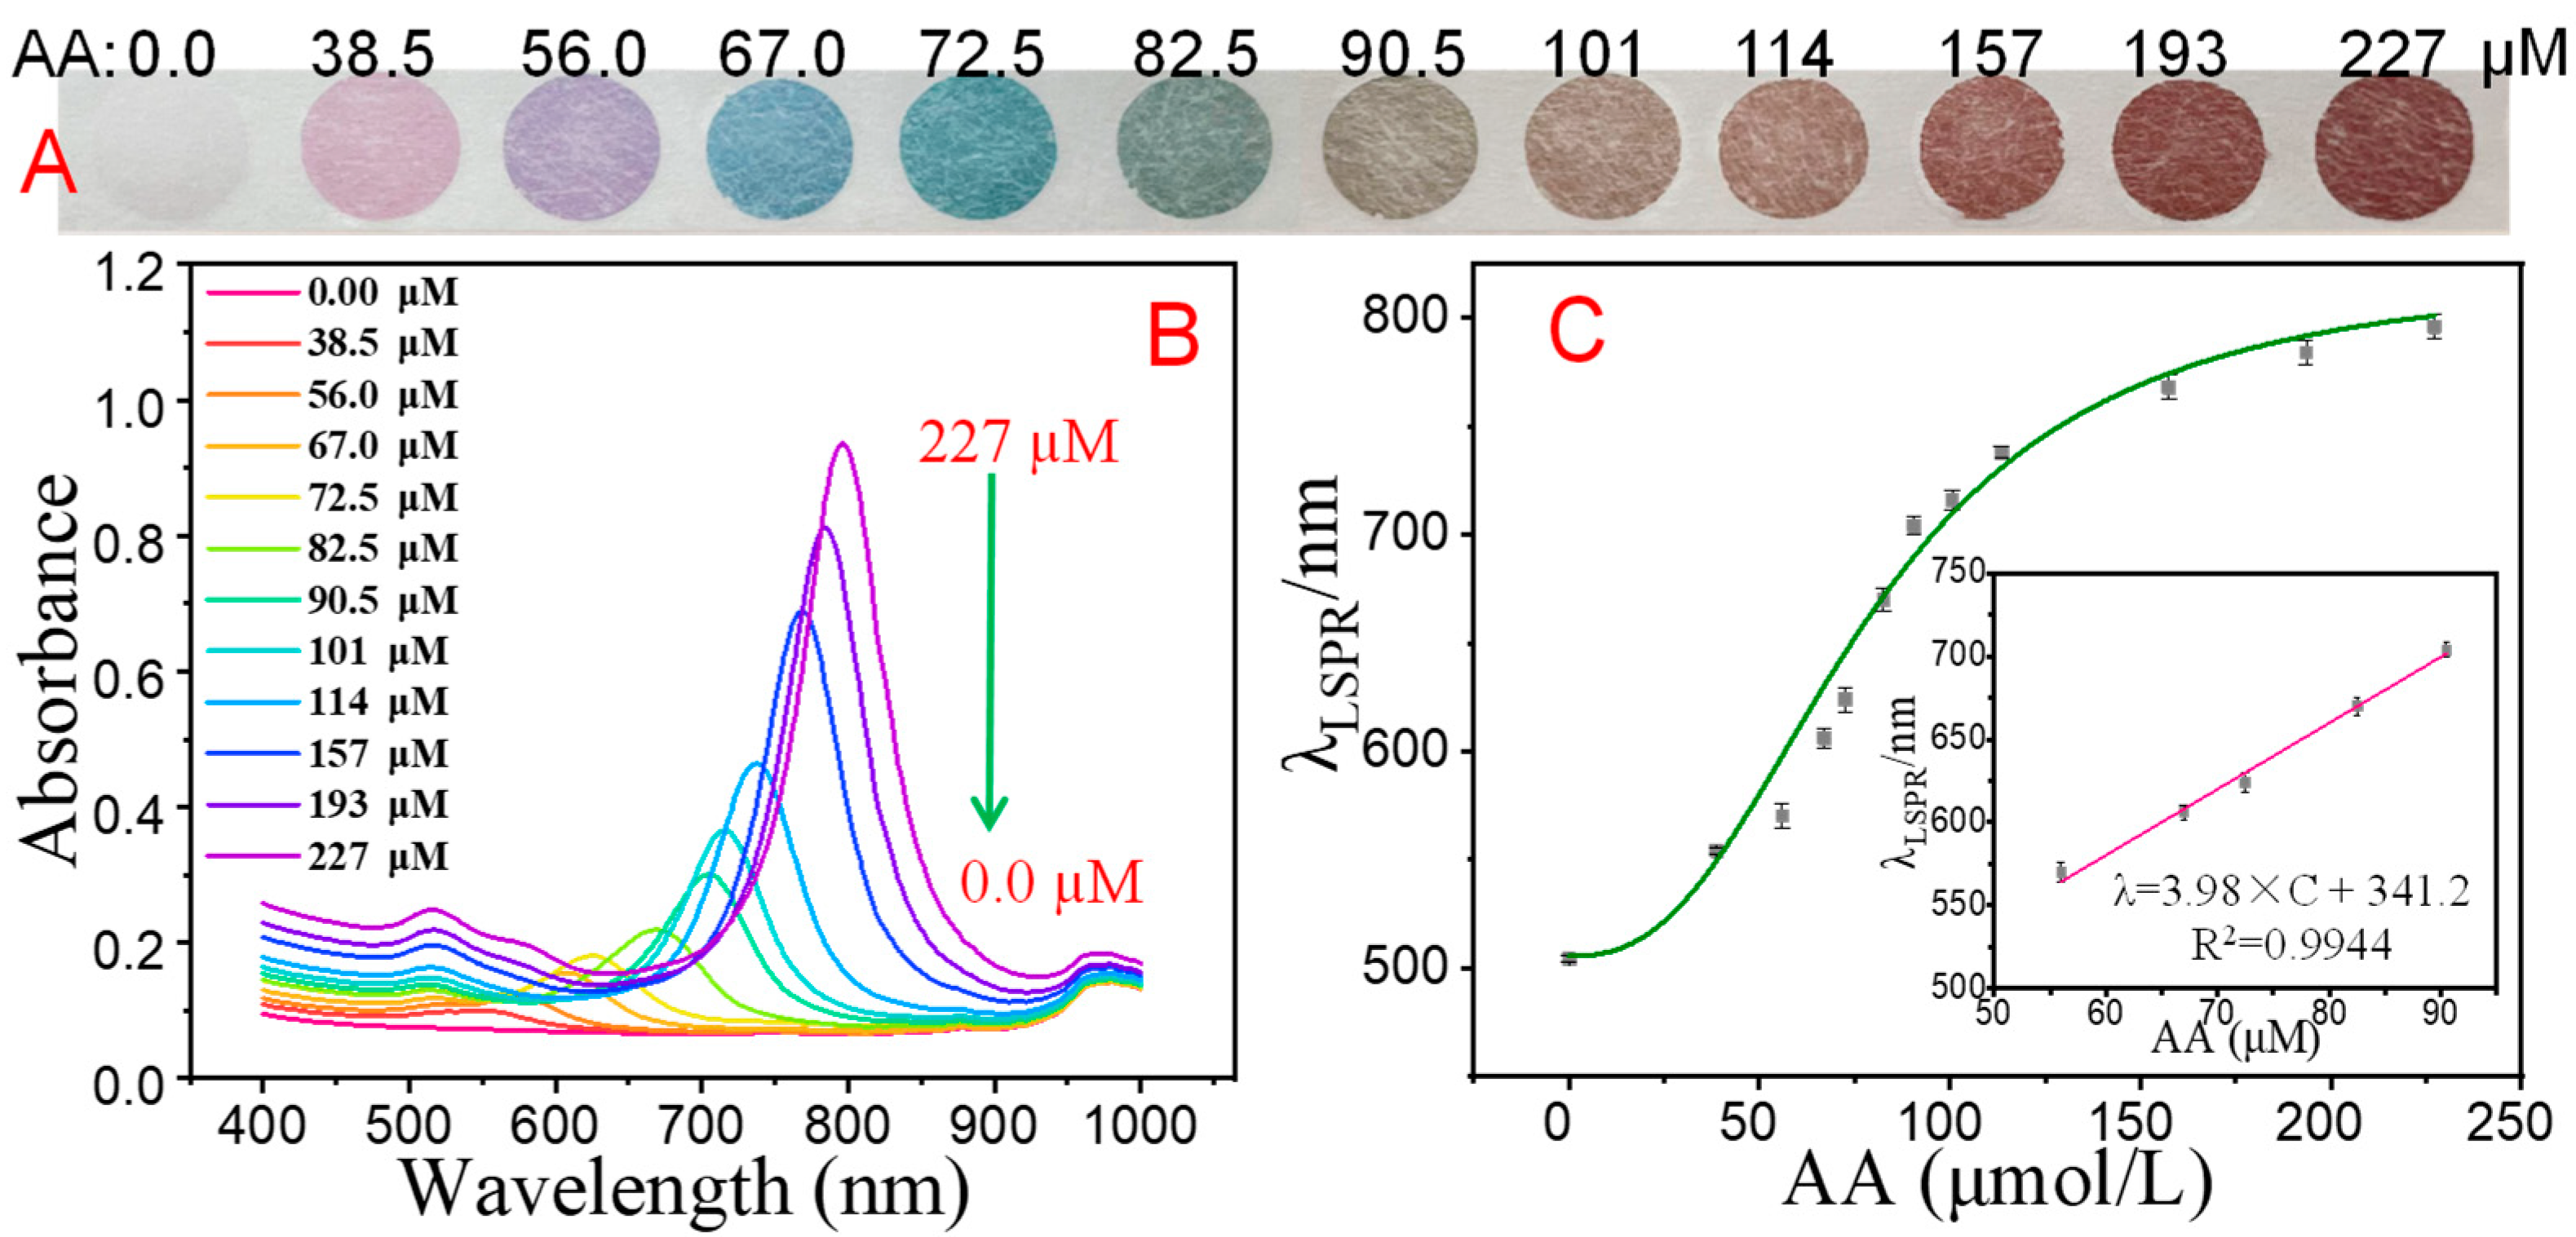
3.2. The Feasibility of the Experimental Strategy

In this study, the cDNA-1 and cDNA-2 were designed to hybridize from the 5’ and 3’ ends aptamer, respectively, to form the competitive aptamer-binding system. To confirm that the hybridization of the cDNA-1, cDNA-2 and aptamer was successful, gel electrophoresis was used to characterize each hybrid product. The results in Figure S3 (see SI), show that, compared with cDNA-1 and aptamer separately, their hybrid products showed a band on the site that had shorter migration distances (about 80 pb), indicating that the hybridization was successful. Meanwhile, after the addition of a target SA (SQ), the hybrid products of cDNA-1 and aptamer also showed a weak band on the near site of aptamer, indicating that SQ could bind specifically with an aptamer to produce SA/aptamer. Similarly, compared with cDNA-2 and aptamer separately, their hybrid products also showed a band on the site with shorter migration distances of about 80 pb. The hybrid products of cDNA-1, cDNA-2 and aptamer showed a band that had the shortest migration distances (about 100 pb), indicating the successful hybridization among cDNA-1, cDNA-2 and aptamer. These experimental results demonstrated the feasibility of a competitive aptamer-binding system.
The feasibility of the NADH-AA-mediated AuNBP growth system was confirmed by regulating AuNBP growth with different AA concentrations and investigating the morphologies of AuNBPs with transmission electron microscopy (TEM). The TEM images in Figure 1 show that as the AA concentration increased from 38.5 to 227 µM, the shape of the AuNBPs changed step by step from spheroid to rice-like oval, to truncated bipyramid, to standard bipyramid. Correspondingly, the AuNBP solution exhibited vivid color changes from pale pink to blue-green to brownish red. Meanwhile, the λLSPR of the AuNBP solution gradually shifted from 504 to 796 nm, and the λLSPR showed a good linear relationship with AA concentrations in the range of 56.0–90.5 µM (see Figure 2). All the above results demonstrated that the NADH-AA–mediated system can mediate AuNBPs growth sensitively to generate many more color changes, which could make naked-eye observation more accurate and sensitive.

3.3. Optimization of PAD-Based Multicolor Colorimetric Aptasensor

In the NADH–AA-mediated AuNBPs growth system, acidity lowered the reduction ability of AA, which affected the growth rate of the AuNBPs, which on turn affected the λLSPR of the AuNBPs, i.e., the sensitivity of the multicolor colorimetric aptasensor. In this study, HCl was used to control acidity, and the concentration was optimized in the range of 440–880 mM. The experimental results (Figure S4 in SI) showed that the λLSPR of the AuNBPs increased when the HCl concentration increased from 440 to 660 mM, whereas it decreased when the concentration was higher than 660 mM. Thus, the acidity of the NADH–AA-mediated AuNBP growth system was controlled by adding HCl in a final concentration of 660 mM.
The streptavidin–ALP concentration in the competitive aptamer-binding system directly affected the ALP amount loaded onto the MBs/cDNA-1/aptamer/cDNA-2/ALP, which was used to hydrolyze AAP to generate AA and affecting the sensitivity and linear range of the aptasensor. The streptavidin–ALP concentration was optimized in the range of 21–27 µg/L. The experimental results (Figure S5 in SI) show the λLSPR shift of the generated AuNBPs:
ΔλLSPR = λLSPR(+) − λLSPR(−),
where λLSPR (+) is the λLSPR of the generated AuNBPs in the presence of target SAs, and λLSPR (−) is the λLSPR in the absence of target SAs). The λLSPR shift had the largest value when the streptavidin–ALP concentration was 25.3 µg/L, which was selected as the optimal concentration.

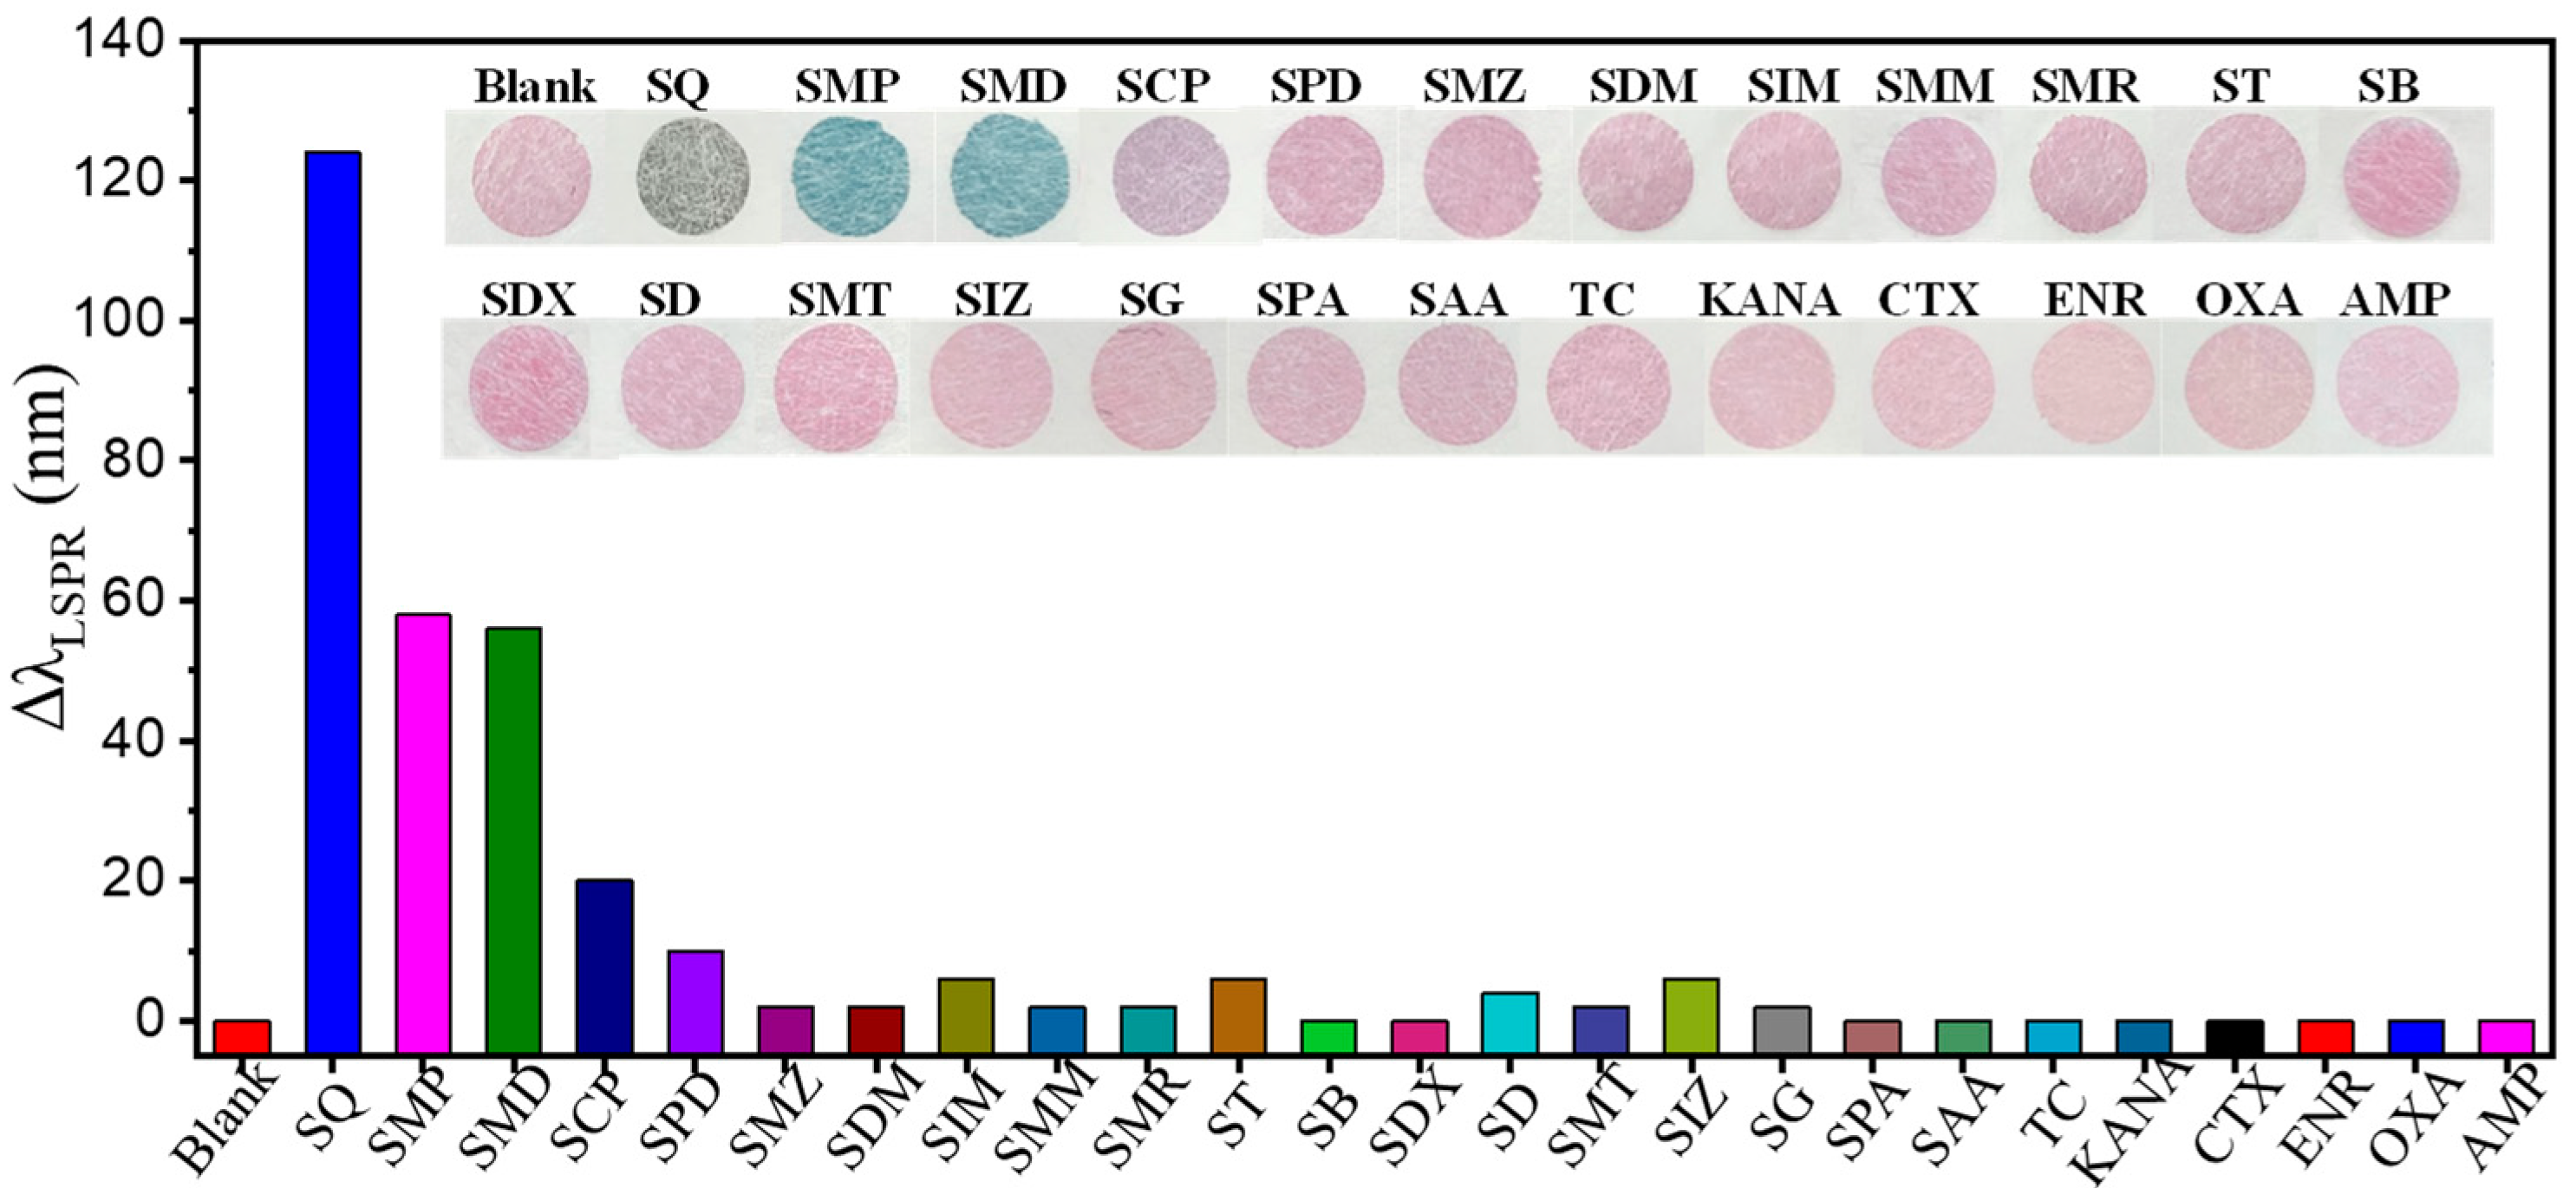
3.4. Specificity of the Multicolor Colorimetric Aptasensor

As we mentioned above, the aptamer used in this study had a higher binding affinity to SQ, SMP and SMD, and a relatively lower binding affinity to SCP and SPD [33]. To evaluate the specificity of the multicolor colorimetric aptasensor to the targeted SAs (SQ, SMP and SMD), it was used to test a 1.0 µM concentration of the 19 commonly used SAs and a 100 µM concentration of the 6 types of antibiotics mentioned in Section 2.1. As Figure 3 shows, only SQ, SMP and SMD induced an obvious λLSPR shift (ΔλLSPR) of the AuNBPs, and exhibited a blue or blue-green color. The other 16 SAs (SCP, SPD, SMZ, SDM, SIM, SMM, SMR, ST, SB, SDX, SD, SMT, SIZ, SG, SPA and SAA) exhibited the same color (pale pink) as that of the control AuNBPs with no λLSPR shift (ΔλLSPR ≈ 0). In particular, the 6 other antibiotics also did not induce an obvious λLSPR shift, and they exhibited the same color (pale pink) as that of the control AuNBPs even though the antibiotic concentrations were much higher than those of the 3 target SAs (SQ, SMP and SMD). The above results demonstrated that the proposed multicolor colorimetric aptasensor had good selectivity for SQ, SMP and SMD, and thus could be used to detect them singly, or the sum of all three or the sum of any two with no interference of other antibiotics.

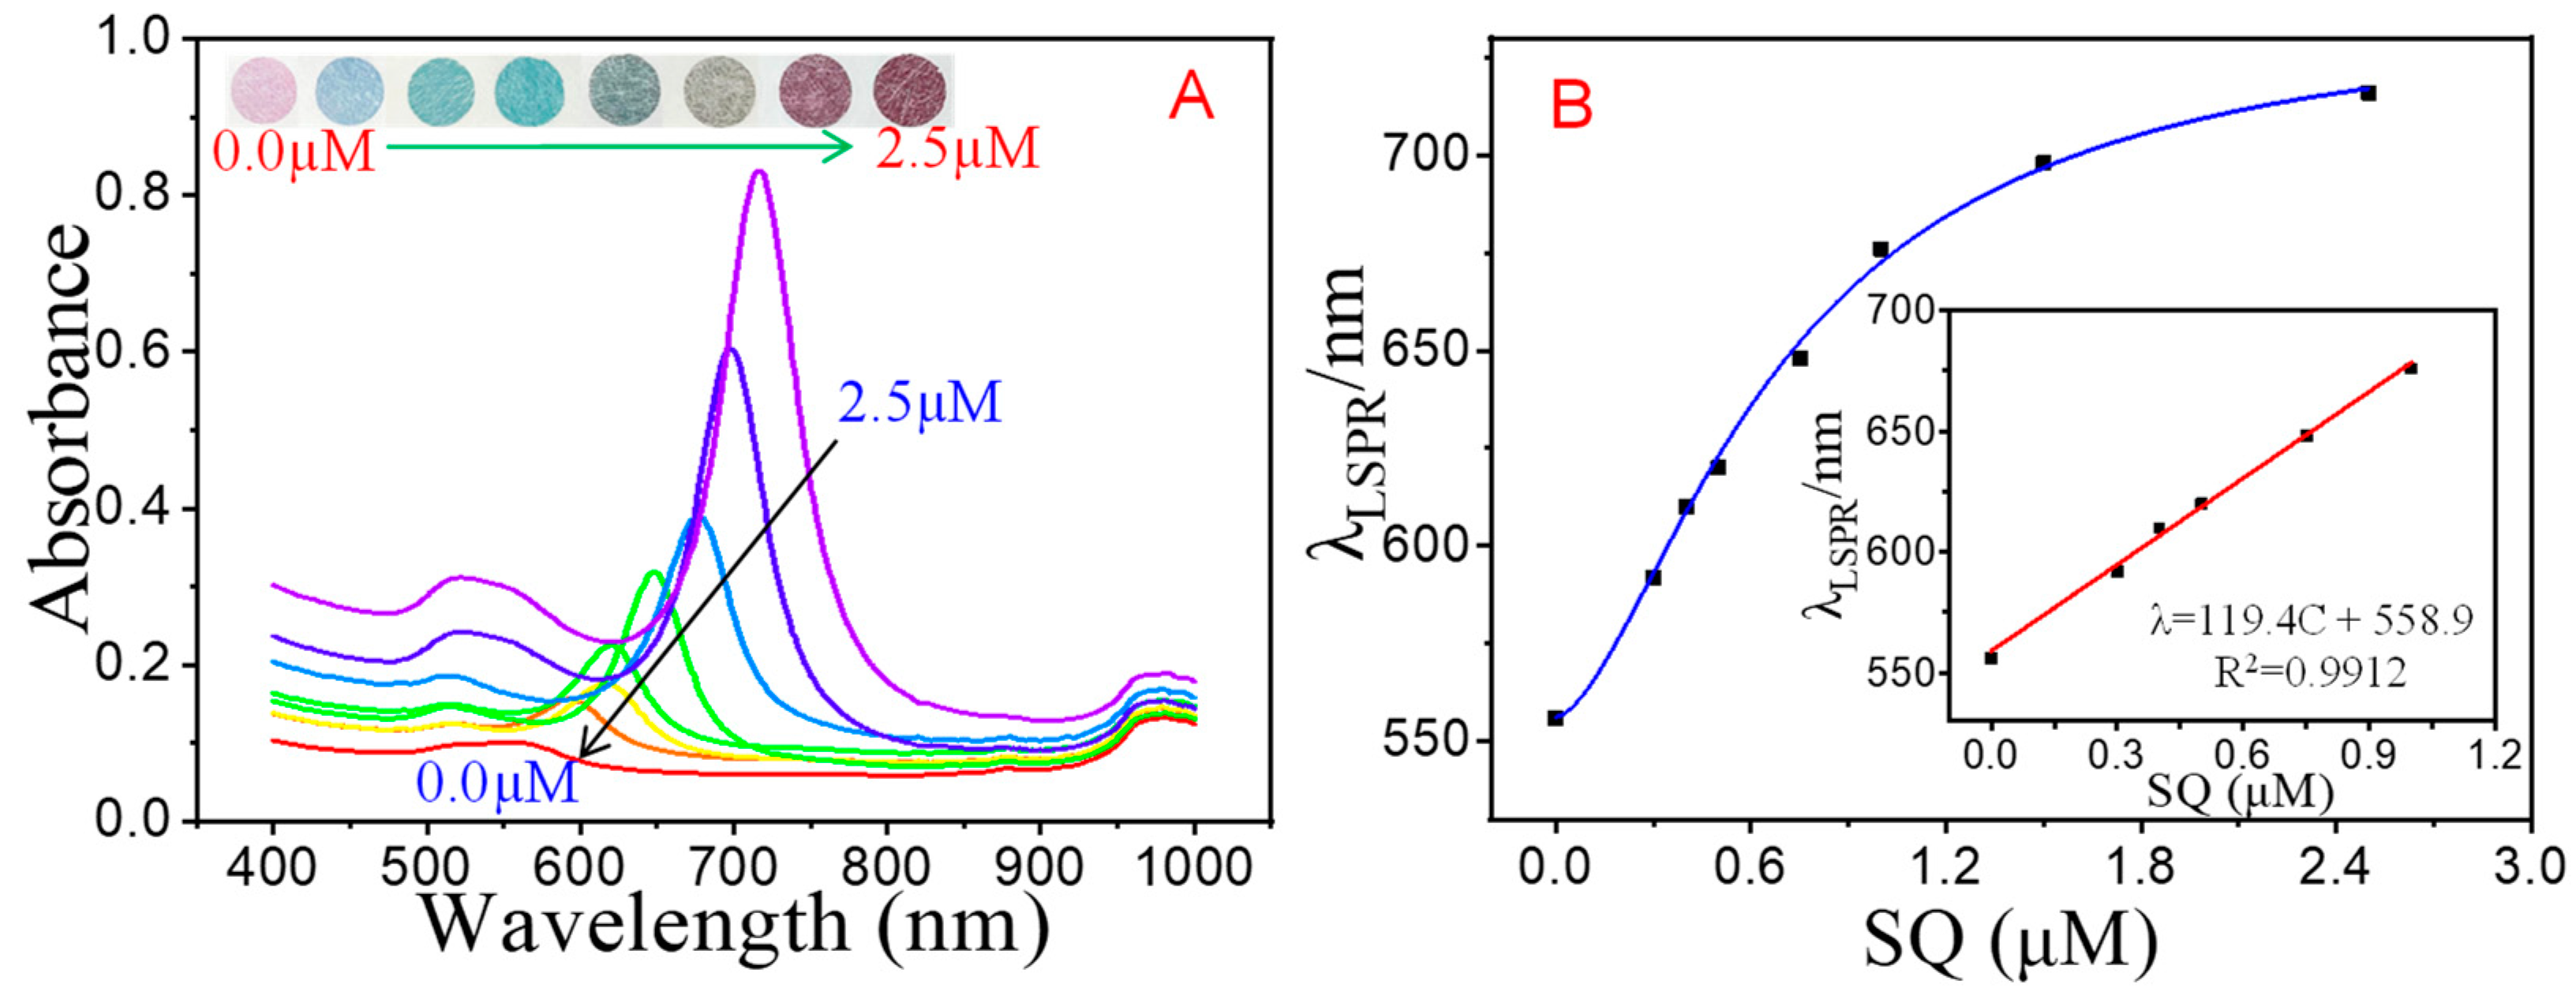
3.5. Analytical Performance of the Multicolor Colorimetric Aptasensor

To investigate the analytical performance of the multicolor colorimetric aptasensor, different concentrations of SQ, SMP and SMD were determined. As the photographs and extinction spectra in Figure 4 show, when the SQ concentration increased from 0.0 to 2.5 µM, the colors of the AuNBPs changed step by step from pale pink to bluish violet, to green-blue, to green, to atrovirens, to lime-green, to brownish red to deep brown, and were accompanied by an AuNBP λLSPR of shift from 557 to 716 nm. When the concentration of SQ was 0.3 µM, the color change int the AuNBPs could be clearly confirmed with the naked eye, i.e., the visual detection limit (LOD) of the aptasensor was 0.3 µM for SQ. The good linear relationship between the λLSPR of the AuNBPs and SQ concentrations was observed in the range of 0.3–1.0 µM; thus, the spectrometry quantification limit (LOQ) was 0.3 µM (the lowest concentration in the linear range) and the spectrometry LOD was 0.09 µM (LOQ/3.3) for SQ (Table 1). As the concentrations of SMP and SMD increased, the AuNBPs exhibited similar stepped color changes and were accompanied by a shift in the AuNBP λLSPR from about 550 to 700 nm (see Figures S6 and S7 in SI). The visual detection limit of the aptasensor was 0.5 µM for SMP and 1.0 µM for SMD. The spectrometry LOQ was 0.3 µM for SMP and 0.5 µM for SMD, and the spectrometry LOD was calculated to be 0.09 µM for SMP and 0.15 µM for SMD (Table 1). The stability of the multicolor aptasensor was investigated by repeatedly detecting 0.5 µM of SQ and SMP, and 2.0 µM of SMD 5 times. The relative standard deviation (RSD, n = 5) was calculated to be 5% for SQ, and 6% for SMP and SMD.
As mentioned above, some aptamer-based colorimetric methods have been reported for the rapid determination of SAs [22,32,33]. However, previous aptamer-based colorimetric methods suffered from one or more following disadvantages: the ability to determine only one kind of SA or color change and had lower sensitivity. Compared to previous colorimetric methods, the multicolor colorimetric aptasensor developed in this study has obvious analytical advantages such as the ability of determining multiple SAs and color changes with a higher sensitivity (see Table S2 in SI).

3.6. Determination of SQ, SMP and SMD in Fish Muscle Samples

The applicability and reliability of the proposed PAD-based multicolor colorimetric aptasensor was confirmed by determining SQ, SMP and SMD in fish muscle samples (Perca fluviatilis) collected from coastal waters of Fujian in China. The samples, which previously spiked with one or two or all three of SQ, SMP and SMD, were also determined in the same manner to investigate recovery. The results from our method were compared with those obtained by the commercial ELISA kit. As Table 2 shows, SQ, SMP and SMD were determined by naked eye observation or UV-visible spectrometry with a recovery of 89–94% and an RSD < 8% (n = 5). The results from the proposed colorimetric aptasensor were consistent with those from the commercial ELISA kit. All the above results indicated that our PAD-based multicolor colorimetric aptasensor is reliable and can be used for the rapid screening or semi-quantitative determination of SQ, SMP and SMD individually, the sum of all three or as the sum of any two.

4. Conclusions

In summary, we developed a PAD-based multicolor colorimetric aptasensor to detect 3 different SAs (SQ, SMP and SMD) by using a broad-specificity SA aptamer, functionalized magnetic beads as a bioreceptor, an NADH–AA-mediated AuNBP growth system to generate color signals, and a PAD system that deposited AuNBPs more sensitively and stably so that color signals could be read out. The colorimetric aptasensor had more color changes corresponding to the concentrations of SQ, SMP and SMD; higher sensitivity; better specificity and stability; and was used to determine SQ, SMP and SMD with a visual detection limit of 0.3, 0.5 and 1.0 µM, respectively. The detection limits of UV-visible spectrometry were calculated to be 0.09, 0.09 and 0.15 µM for SQ, SMP, and SMD, respectively. By using the established aptasensor, we successfully determined SQ, SMP, SMD, the sum of SQ and SMD, and the sum of all 3 SAs in the fish muscle samples with a recovery of 89–94% and an RSD (n = 5) < 8%. This simple method provides multiple color changes and higher sensitivity, which make it a promising method for the rapid and instrument-free screening of the total residue of SQ, SMP and SMD in seafood.

Supplementary Materials

The following supporting information can be downloaded at: https://www.mdpi.com/article/10.3390/chemosensors11070386/s1: Main chemicals and apparatus, supplementary tables including detailed DNA sequences (Table S1) and comparison with previous colorimetric aptasensors (Table S2), supplementary figures including chemical structures of the 19 commonly used sulfonamides and 6 other antibiotics (Figure S1), PAD structure (Figure S2), gel electrophoresis analysis (Figure S3), optimization parameters (Figures S4 and S5), and photographs and UV-vis extinction spectra for detecting SMP and SMD (Figures S6 and S7).

Author Contributions

Conceptualization, F.F. and Z.W.; methodology, M.P. and W.L.; validation, M.P., C.Y. and Q.C.; investigation, M.P., W.L, C.Y. and Q.C.; resources, F.F.; data curation, M.P.; writing—original draft preparation, F.F. and Z.W.; writing—review and editing, F.F.; supervision, Z.W. and F.F.; project administration, F.F.; funding acquisition, F.F. All authors have read and agreed to the published version of the manuscript.

Funding

The authors gratefully acknowledge National Natural Science Foundation of China (21976029, 22276032) and Fujian Provincial Department of Science and Technology (2023Y0005) for financial support.

Institutional Review Board Statement

Not applicable.

Informed Consent Statement

Not applicable.

Data Availability Statement

Any additional data in support of the findings of this study besides those provided as Supplementary Materials are available from the corresponding author upon reasonable request.

Conflicts of Interest

The authors declare no conflict of interest.

References

  1. Białk-Bielińska, A.; Stolte, S.; Arning, J.; Uebers, U.; Böschen, A.; Stepnowski, P.; Matzke, M. Ecotoxicity evaluation of selected sulfonamides. Chemosphere 2011, 85, 928–933. [Google Scholar] [CrossRef]
  2. Apaydin, S.; TöröK, M. Sulfonamide derivatives as multi-target agents for complex disease. Bioorganic Med. Chem. Lett. 2019, 29, 2042–2050. [Google Scholar] [CrossRef]
  3. Yu, L.; Song, C.; Zhang, C.; Fan, L.; Qiu, L.; Wu, W.; Meng, S.; Hu, G.; Chen, J. Occurrence of sulfonamides in fish in the lower reaches of Yangtze River, China and estimated daily intake for understanding human dietary exposure. Aquaculture 2018, 495, 538–544. [Google Scholar] [CrossRef]
  4. Tačić, A.; Nikolić, V.; Nikolić, L.; Savić, I. Antimicrobial sulfonamide drugs. Adv. Technol. 2017, 6, 58–71. [Google Scholar] [CrossRef] [Green Version]
  5. Sarmah, A.K.; Meyer, M.T.; Boxall, A.B. A global perspective on the use, sales, exposure pathways, occurrence, fate and effects of veterinary antibiotics (VAs) in the environment. Chemosphere 2006, 65, 725–759. [Google Scholar] [CrossRef]
  6. Hamscher, G.; Bachour, G. Veterinary drugs in the environment: Current knowledge and challenges for the future. J. Agric. Food Chem. 2018, 66, 751–752. [Google Scholar] [CrossRef] [PubMed]
  7. Suo, D.C.; Wang, P.L.; Xiao, Z.M.; Zhang, S.; Zhuang, H.T.; Li, Y.; Su, X.O. Multi-residue determination of 27 sulfonamides in poultry feathers and its application to a sulfamethazine pharmacokinetics study on laying hen feathers and sulfonamide residue monitoring on poultry feathers. J. Agric. Food Chem. 2019, 67, 11236–11243. [Google Scholar] [CrossRef]
  8. Kim, Y.; Jung, J.; Kim, M.; Park, J.; Boxall, A.B.A.; Choi, K. Prioritizing veterinary pharmaceuticals for aquatic environment in Korea. Environ. Toxicol. Pharmacol. 2008, 26, 167–176. [Google Scholar] [CrossRef]
  9. Baran, W.; Adamek, E.; Ziemiańska, J.; Sobczak, A. Effects of the presence of sulfonamides in the environment and their influence on human health. J. Hazard. Mater. 2011, 196, 1–15. [Google Scholar] [CrossRef] [PubMed]
  10. Lin, H.; Zhang, J.; Chen, H.; Wang, J.; Sun, W.; Zhang, X.; Yang, Y.; Wang, Q.; Ma, J. Effect of temperature on sulfonamide antibiotics degradation, and on antibiotic resistance determinants and hosts in animal manures. Sci. Total Environ. 2017, 607, 725–732. [Google Scholar] [CrossRef] [PubMed]
  11. Zhang, H.Y.; Duan, Z.J.; Wang, L.; Zhang, Y.; Wang, S. Hapten synthesis and development of polyclonal antibody-based multi-sulfonamide immunoassays. J. Agric. Food Chem. 2006, 54, 4499–4505. [Google Scholar] [CrossRef]
  12. Hu, S.P.; Zhao, M.; Xi, Y.Y.; Mao, Q.Q.; Zhou, X.D.; Chen, D.W.; Yan, P.C. Non-targeted screening and determination of sulfonamides: A dispersive micro solid-phase extraction approach to the analysis of milk and honey samples using liquid chromatography high-resolution mass spectrometry. J. Agric. Food Chem. 2017, 65, 1984–1991. [Google Scholar] [CrossRef]
  13. Li, T.; Wang, C.; Xu, Z.A.; Chakraborty, A. A coupled method of on-line solid phase extraction with the UHPLC-MS/MS for detection of sulfonamides antibiotics residues in aquaculture. Chemosphere 2020, 254, 126765. [Google Scholar] [CrossRef]
  14. Saxena, S.K.; Rangasamy, R.; Krishnan, A.A.; Singh, D.P.; Uke, S.P.; Malekadi, P.K.; Sengar, A.S.; Mohamed, D.P.; Gupta, A. Simultaneous determination of multi-residue and multi-class antibiotics in aquaculture shrimps by UPLC-MS/MS. Food Chem. 2018, 260, 336–343. [Google Scholar] [CrossRef]
  15. Zhao, X.L.; Wang, J.Y.; Wang, J.P.; Wang, S. Development of water-compatible molecularly imprinted solid-phase extraction coupled with high performance liquid chromatography-tandem mass spectrometry for the detection of six sulfonamides in animal-derived foods. J. Chromatogr. A 2018, 1574, 9–17. [Google Scholar] [CrossRef] [PubMed]
  16. Zhang, Z.; Yang, M.Y.; Wu, X.Y.; Dong, S.B.; Zhu, N.F.; Gyimah, E.; Wang, K.; Li, Y. A competitive immunosensor for ultrasensitive detection of sulphonamides from environmental waters using silver nanoparticles decorated single-walled carbon nanohorns as labels. Chemosphere 2019, 225, 282–287. [Google Scholar] [CrossRef]
  17. Li, Z.B.; Cui, P.L.; Liu, J.; Liu, J.X.; Wang, J.P. Production of generic monoclonal antibody and development of chemiluminescence immunoassay for determination of 32 sulfonamides in chicken muscle. Food Chem. 2020, 311, 125966. [Google Scholar] [CrossRef]
  18. Wang, Z.X.; Xing, K.Y.; Ding, N.S.; Wang, S.H.; Zhang, G.G.; Lai, W.H. Lateral flow immunoassay based on dual spectral-overlapped fluorescence quenching of polydopamine nanospheres for sensitive detection of sulfamethazine. J. Hazard. Mater. 2022, 423, 127204. [Google Scholar] [CrossRef] [PubMed]
  19. Galvidis, I.A.; Wang, Z.H.; Nuriev, R.I.; Burkin, M.A. Broadening the detection spectrum of small analytes using a two-antibody-designed hybrid immunoassay. Anal. Chem. 2018, 90, 4901–4908. [Google Scholar] [CrossRef] [PubMed]
  20. Chen, Y.N.; Guo, L.L.; Liu, L.Q.; Song, S.S.; Kuang, H.; Xu, C.L. Ultrasensitive immuno-chromatographic strip for fast screening of 27 sulfonamides in honey and pork liver samples based on a monoclonal antibody. J. Agric. Food Chem. 2017, 65, 8248–8255. [Google Scholar] [CrossRef]
  21. Jiang, W.X.; Wang, Z.H.; Beier, R.C.; Jiang, H.Y.; Wu, Y.N.; Shen, J.Z. Simultaneous determination of 13 fluoroquinolone and 22 sulfonamide residues in milk by a dual-colorimetric enzyme-linked immunosorbent assay. Anal. Chem. 2013, 85, 1995–1999. [Google Scholar] [CrossRef] [PubMed]
  22. Chen, X.-X.; Lin, Z.-Z.; Hong, C.-Y.; Yao, Q.-H.; Huang, Z.-Y. A dichromatic label-free aptasensor for sulfadimethoxine detection in fish and water based on AuNPs color and fluorescent dyeing of double-stranded DNA with SYBR Green I. Food Chem. 2020, 309, 125712. [Google Scholar] [CrossRef]
  23. Okoth, O.K.; Yan, K.; Liu, Y.; Zhang, J.D. Graphene-doped Bi2S3 nanorods as visible-light photoelectrochemical aptasensing platform for sulfadimethoxine detection. Biosens. Bioelectron. 2016, 86, 636–642. [Google Scholar] [CrossRef]
  24. You, H.; Bai, L.J.; Yuan, Y.H.; Zhou, J.; Bai, Y.; Mu, Z.D. An amperometric aptasensor for ultrasensitive detection of sulfadimethoxine based on exonuclease-assisted target recycling and new signal tracer for amplification. Biosens. Bioelectron. 2018, 117, 706–712. [Google Scholar] [CrossRef]
  25. Liu, Q.; Shi, T.Y.; Cheng, Y.; Wen, Z.R.; Ding, C.F.; Li, Y.Q.; Wang, K. Amplified photocurrent signal for fabricating photoelectrochemical sulfadimethoxine aptasensor based on carbon nitride photosensitization with visible/near-infrared light responsive zinc phthalocyanine. J. Hazard. Mater. 2021, 406, 124749. [Google Scholar] [CrossRef] [PubMed]
  26. Mohammad-Razdari, A.; Ghasemi-Varnamkhasti, M.; Izadi, Z.; Rostami, S.; Ensafi, A.A.; Siadat, M.; Losson, E. Detection of sulfadimethoxine in meat samples using a novel electrochemical biosensor as a rapid analysis method. J. Food Compos. Anal. 2019, 82, 103252. [Google Scholar] [CrossRef]
  27. Yang, Z.H.; Ding, X.F.; Guo, Q.; Wang, Y.; Lu, Z.W.; Ou, H.C.; Luo, Z.F.; Lou, X.H. Second generation of signaling-probe displacement electrochemical aptasensor for detection of picomolar ampicillin and sulfadimethoxine. Sens. Actuators B-Chem. 2017, 253, 1129–1136. [Google Scholar] [CrossRef]
  28. Yang, L.; Ni, H.J.; Li, C.L.; Zhang, X.Y.; Wen, K.; Ke, Y.B.; Yang, H.J.; Shi, W.M.; Zhang, S.X.; Shen, J.Z.; et al. Development of a highly specific chemiluminescence aptasensor for sulfamethazine detection in milk based on in vitro selected aptamers. Sens. Actuators B-Chem. 2019, 281, 801–811. [Google Scholar] [CrossRef]
  29. Chen, X.-X.; Lin, Z.-Z.; Yao, Q.-H.; Huang, Z.-Y. A practical aptaprobe for sulfadimethoxine residue detection in water and fish based on the fluorescence quenching of CdTe QDs by poly (dial-lyldimethylammonium chloride). J. Food Compos. Anal. 2020, 91, 103526. [Google Scholar] [CrossRef]
  30. Wang, Y.R.; Yan, X.-L.; Kou, Q.-M.; Sun, Q.; Wang, Y.-X.; Wu, P.; Yang, L.-L.; Tang, J.-M.; Le, T. An ultrasensitive label-free fluorescent aptasensor platform for detection of sulfamethazine. Int. J. Nanomed. 2021, 16, 2751–2758. [Google Scholar] [CrossRef]
  31. Song, K.-M.; Jeong, E.; Jeon, W.; Jo, H.; Ban, C. A coordination polymer nanobelt (CPNB)-based aptasensor for sulfadimethoxine. Biosens. Bioelectron. 2012, 33, 113–119. [Google Scholar] [CrossRef]
  32. Chen, A.L.; Jiang, X.L.; Zhang, W.W.; Chen, G.; Zhao, Y.; Tunio, T.M.; Liu, J.C.; Lv, Z.Z.; Li, C.; Yang, S.M. High sensitive rapid visual detection of sulfadimethoxine by label-free aptasensor. Biosens. Bioelectron. 2013, 42, 419–425. [Google Scholar] [CrossRef] [PubMed]
  33. Xu, R.-Y.; Yang, C.; Huang, L.; Lv, W.-C.; Yang, W.-J.; Wu, Y.-N.; Fu, F.-F. Broad-specificity aptamer of sulfonamides: Isolation and its application in simultaneous detection of multiple sulfonamides in fish sample. J. Agric. Food Chem. 2022, 70, 11804–11812. [Google Scholar] [CrossRef] [PubMed]
  34. Kirschner, M.S.; Lethies, C.M.; Lin, X.-M.; Schatz, G.C.; Chen, L.-X.; Schaller, R.D. Size-dependent coherent-phonon plasmon modulation and deformation characterization in gold bipyramids and nanojavelins. ACS Photonics 2016, 3, 758–763. [Google Scholar] [CrossRef]
  35. Lombardi, A.; Loumaigne, M.; Crut, A.I.; Maioli, P.; Del Fatti, N.; Vallée, F.; Spuch-Calvar, M.; Burgin, J.; Majimel, J.R.; Tréguer-Delapierre, M. Surface plasmon resonance properties of single elongated nano-objects: Gold nanobipyramids and nanorods. Langmuir 2012, 28, 9027–9033. [Google Scholar] [CrossRef] [PubMed]
  36. Wang, H.-Q.; Rao, H.-H.; Luo, M.-Y.; Xue, X.; Xue, Z.-H.; Lu, X.-Q. Noble metal nanoparticles growth-based colorimetric strategies: From monocolorimetric to multicolorimetric sensors. Coord. Chem. Rev. 2019, 398, 113003. [Google Scholar] [CrossRef]
  37. Zhang, Z.-Y.; Wang, H.; Chen, Z.-P.; Wang, X.-Y.; Choo, J.; Chen, L.-X. Plasmonic colorimetric sensors based on etching and growth of noble metal nanoparticles: Strategies and applications. Biosens. Bioelectron. 2018, 114, 52–65. [Google Scholar] [CrossRef]
  38. Wang, Z.-W.; Chen, Q.; Zhong, Y.-Y.; Yu, X.-H.; Wu, Y.-N.; Fu, F.-F. A multicolor immunosensor for sensitive visual detection of breast cancer biomarker based on sensitive NADH-ascorbic-acid-mediated growth of gold nanobipyramids. Anal. Chem. 2020, 92, 1534–1540. [Google Scholar] [CrossRef]
  39. Ye, X.-Y.; Zhang, F.; Yang, L.; Yang, W.-J.; Zhang, L.-Y.; Wang, Z.-W. Paper-based multicolor sensor for on-site quantitative detection of 2, 4-dichlorophenoxyacetic acid based on alkaline phosphatase-mediated gold nanobipyramids growth and colorimeter-assisted method for quantifying color. Talanta 2022, 245, 123489. [Google Scholar] [CrossRef]
  40. Wang, Z.-W.; Yang, L.; Ye, X.-Y.; Huang, C.-L.; Yang, W.-J.; Zhang, L.-Y.; Wu, Z.-J.; Fu, F.-F. Multicolor visual screening of total dithiocarbamate pesticides in foods based on sulfydryl-mediated growth of gold nanobipyramids. Anal. Chim. Acta 2020, 1139, 59–67. [Google Scholar] [CrossRef]
Scheme 1. Schematic illustration of the principle for the PAD-based multicolor aptasensor.
Chemosensors 11 00386 sch001
Figure 1. TEM images of AuNBPs obtained from a NADH–AA-mediated growth system at different AA concentrations. (A) 38.5, (B) 56.0, (C) 67.0, (D) 82.5, (E) 101, and (F) 227 µM. The inset is the color of the corresponding AuNBPs deposited on the PAD.
Chemosensors 11 00386 g001
Figure 2. Photographs (A) and the extinction spectra of AuNBPs (B) obtained from the NADH–AA-mediated growth system at different AA concentrations (0.0, 38.5, 56.0, 67.0, 72.5, 82.5, 90.5, 101, 114, 157, 193 and 227 μM) and the variation of the λLSPR of AuNBPs versus AA concentrations (C). The insert in (C) is the linear relationship between the λLSPR of the AuNBPs and AA concentrations in range of 56.0–90.5 μM.
Chemosensors 11 00386 g002
Figure 3. The photographs and ΔλLSPR of multicolor colorimetric aptasensor for detecting 19 commonly used different SAs and 6 other types of antibiotics. The SA concentration was 1.0 µM, and the that of the 6 other antibiotics was 100 µM.
Chemosensors 11 00386 g003
Figure 4. The photographs and UV-vis extinction spectra (A) of the multicolor colorimetric aptasensor for detecting different concentrations of SQ (0.0, 0.3, 0.4, 0.5, 0.75, 1.0, 1.5 and 2.5 μM), and the variation of the λLSPR of AuNBPs versus SQ concentrations (B). The insert in (B) is the linear relationship between the λLSPR of AuNBPs and SQ concentrations in the range of 0.0–1.0 μM.
Chemosensors 11 00386 g004
Table 1. Analytical performances of the proposed aptasensor for detecting SQ, SMP and SMD.
SAsLinear EquationCoefficient (R2)Linear RangeVisual LODSpectrometry
LOQLOD
SQλ = 119.4 × C + 558.90.99120.3–1.0 μM0.3 μM0.3 μM0.09 μM
SMPλ = 56.4 × C + 550.40.99410.3–1.0 μM0.5 μM0.3 μM0.09 μM
SMDλ = 20.4 × C + 550.10.99510.5–5.0 μM1.0 μM0.5 μM0.15 μM
Table 2. Analytical results of SQ, SMP and SMD in dried fish muscle samples.
Added SAs1 Added Con. (µg/g)2 SAs Detected
Our Multicolor Aptasensor5 ELISA Kit
Con. (µg/g)
ColorUV-Vis Spectrometry
Con. (µg/g)RSD (n = 5)Rec.
None0.0Chemosensors 11 00386 i001----
SQ3.6Chemosensors 11 00386 i0023.45%94%3.7
SMP5.7Chemosensors 11 00386 i0035.26%91%-
SMD5.6Chemosensors 11 00386 i0045.08%89%5.2
3 SQ + SMD5.8Chemosensors 11 00386 i0055.27%90%5.4
4 Mixture4.6Chemosensors 11 00386 i0064.16%90%3.3
1 The concentration of SAs in dried fish muscle sample; 2 The concentration of SAs obtained using our method and commercial ELISA kit in a dried fish muscle sample; 3 The mixture of SQ and SMD in equal proportion; 4 Mixture of SQ, SMP and SMD in equal proportion. 5 The ELISA kit could only be used to determine SQ and SMD, not SMP.
Disclaimer/Publisher’s Note: The statements, opinions and data contained in all publications are solely those of the individual author(s) and contributor(s) and not of MDPI and/or the editor(s). MDPI and/or the editor(s) disclaim responsibility for any injury to people or property resulting from any ideas, methods, instructions or products referred to in the content.

