Communication

Determination of Extra- and Intra-Cellular pH Using Characteristic Absorption of Water by Near-Infrared Spectroscopy

1
Research Center for Analytical Sciences, Tianjin Key Laboratory of Biosensing and Molecular Recognition, State Key Laboratory of Medicinal Chemical Biology, College of Chemistry, Nankai University, Tianjin 300071, China
2
Haihe Laboratory of Sustainable Chemical Transformations, Tianjin 300192, China
*
Author to whom correspondence should be addressed.
Chemosensors 2023, 11(8), 425; https://doi.org/10.3390/chemosensors11080425
Submission received: 23 June 2023 / Revised: 19 July 2023 / Accepted: 29 July 2023 / Published: 1 August 2023

Abstract

:
Accurate determination of extra-cellular pH (pHe) and intra-cellular pH (pHi) is important to cancer diagnosis and treatment because tumor cells exhibit a lower pHe and a slightly higher pHi than normal cells. In this work, the characteristic absorption of water in the near-infrared (NIR) region was utilized for the determination of pHe and pHi. Dulbecco’s modified eagle medium (DMEM) and bis (2-ethylhexyl) succinate sodium sulfonate reverse micelles (RM) were employed to simulate the extra- and intra-cellular fluids, respectively. Continuous wavelet transform (CWT) was used to enhance the resolution of the spectra. Quantitative models for pHe and pHi were established using partial least squares (PLS) regression, producing relative errors of validation samples in a range of −0.74–2.07% and −1.40–0.83%, respectively. Variable selection was performed, and the correspondence between the selected wavenumbers and water structures was obtained. Therefore, water with different hydrogen bonds may serve as a good probe to sense pH within biological systems.

1. Introduction

Cells are the basic structure and functional unit of organisms, and pH is one of the most significant physiological parameters that governs cellular activities and behaviors [1,2]. Even a slight change in pH can impact the activity of biological enzymes, which affects life processes such as ion transport, nucleic acid formation, and the release of metabolites [3]. Compared to normal cells, tumor cells exhibit a lower extra-cellular pH (pHe) and a slightly higher intra-cellular pH (pHi) [4,5]. Consequently, monitoring the pHe and pHi not only provides valuable insights into cellular behavior but also plays an important role in guiding the clinical diagnosis, treatment, and evaluation of the effectiveness of anticancer drugs [6,7].
Water is the primary component of living cells. Water molecules form a complex and flexible hydrogen bond network [8], which is highly sensitive to external factors such as pH, temperature, and solute concentration [9]. Near-infrared (NIR) spectroscopy has emerged as a powerful tool to investigate water structures [10,11,12] and has been well studied in experimental [13,14,15] and theoretical calculations [16,17,18]. Six absorption peaks were obtained from derivative spectra, corresponding to the rotational vibrational peak of water molecules (Sr) and the characteristic peaks of water molecules with zero to four hydrogen bonds (S0–S4) [19]. Gaussian fitting of NIR spectra was performed using a knowledge-based genetic algorithm, and the spectral features of nine water structures were obtained [20]. In addition, water can be applied as a probe to sense the structural variations of solutes [21,22,23]. Water structures in embryos with different bioactivities were investigated [24]. An increase in weakly hydrogen-bonded water molecules at lower embryonic bioactivity was found, which coincides with the changes in protein secondary structure from α-helix to β-sheet. Tsenkova et al. [25] explored the mechanism of prion protein (PrP) fibrosis induced by Mn and Cu ions through the spectral changes of water, and the PrP-Cu complex was found to prevent Cu from interacting with water, leading to an increase in protein stability, whereas PrP-Mn does not [25]. Water structures during the aggregation of the R2/wt fragment of the tau protein were investigated. It was revealed that the dissociation of hydrated water near the NH group on R2/wt facilitates the formation of β-sheet between the amide groups [26]. The nucleation of insulin fibers [27] and the diagnosis of soybean mosaic disease [28] were also studied by analyzing changes in the NIR spectra of water. In addition, water can also be used as a probe for the quantitative determinations of pH, temperature, and concentration [29,30,31]. Spectral changes of water were captured from temperature-dependent NIR spectra using multilevel simultaneous component analysis (MSCA). The quantitative spectra–temperature relationship (QSTR) and the quantitative spectra–concentration relationship (QSCR) were established [32]. Furthermore, MSCA was also utilized to quantitatively detect the isoelectric point, concentration, and temperature by extracting the spectral changes of proline solution [33].
In this work, the characteristic absorption of water was utilized for the determination of pHe and pHi by NIR spectra. Dulbecco’s modified eagle medium (DMEM) and bis (2-ethylhexyl) succinate sodium sulfonate reverse micelles (RM) were used to simulate extra- and intra-cellular fluids, respectively. The quantitative models for pHi and pHe were established using partial least squares (PLS) regression, and pH-dependent wavenumbers were selected to study the relationship between pH and the structures of water.

2. Materials and Methods

2.1. Reagents and Sample Preparation

DMEM (D5523) was produced from Sigma Aldrich. Fetal bovine serum (FBS) and penicillin-streptomycin solution (PS) were produced from Invitrogen Gbico. NaH2PO4·2H2O (99.9% purity) and Na2HPO4·12H2O (99% purity) were obtained from Macklin and Aladdin, respectively. Bis (2-ethylhexyl) succinate sodium sulfonate (AOT, 99% purity) from Klamar and isooctane (IO, >99.5% purity) from Concord were used. Water was purified using the Advantage A10TM ultra-pure water instrument (Millipore, Molsheim, France).
Three groups of samples were prepared in this study. The first group consists of 38 DMEM samples with different pH values. Firstly, 50 g of DMEM powder was dissolved in ultra-pure water, followed by the addition of 10 mL PS and 50 mL FBS to prepare a DMEM solution with a total volume of 1000 mL. Secondly, phosphate buffer (PB) solutions with different pH values were obtained by mixing 0.1 mol·L−1 Na2HPO4 and NaH2PO4 in different volume ratios. Finally, a total of 38 DMEM samples with different pH values were prepared by mixing PB with the DMEM solution in the volume ratio of V[PB]:V[DMEM] = 1:4.
The second group consists of 34 RM samples. Firstly, 0.2 mol·L−1 AOT/IO solution was prepared by dissolving AOT in IO. Subsequently, a total of 34 RM samples encapsulating PB solutions with different pH values were prepared by mixing PB with AOT/IO solution in the molar ratio of n[PB]:n[AOT] = 30.
The third group consists of three DMEM samples that have been used for cell cultivation. Three kinds of cells, namely 5637, N2A, and HUEVC, were cultured using the prepared DMEM solution. After 24 h of incubation, three DMEM samples were collected separately by centrifuging the cells.

2.2. Spectral Measurement

All NIR spectra were measured using a Vertex 70 spectrometer (Bruker Optics Inc., Ettlingen, Germany) equipped with a tungsten-halogen light source and InGaAs detector. The measurements were conducted using a quartz cuvette with an optical path of 0.5 mm. The measured spectra ranged from 12,000 to 4000 cm−1 with a resolution of 4 cm−1. The background spectrum was collected using an empty cuvette. To improve the signal-to-noise ratio, the number of scans was set to 64. The temperature control of the instrument was achieved using a temperature controller (Bruker Spectral Instruments, Ettlingen, Germany) equipped with a 2216e temperature module, ensuring a constant temperature of 30 °C throughout the measurement.

2.3. pH Measurement

The pH values of the samples were measured using a PHS-3E pH meter (Shanghai Leici Scientific Instrument Co., Ltd., Shanghai, China) equipped with an E-301-QC pH triple composite electrode. Before measuring pH of the samples, a calibration process was conducted using standard solutions of pH 4.00, pH 6.86, and pH 9.18.
The pH of the first and third group samples was directly measured using the pH meter, considering it as pHe. For the second group, the pH of PB solution was measured before being encapsulated within AOT RM, considering it as pHi. The variation in pHi before and after encapsulation is small enough to be neglected [34,35]. The measurement was performed three times for each sample, and the average value was taken as the final result.
The pH values of the first and second groups are from 8.03 to 5.78 with a mean and standard deviation of 6.89, 0.66, 6.90, and 0.67, respectively. The pH values of the three DMEM samples are 6.49, 6.32, and 6.22, respectively.

2.4. Calculation Method

Continuous wavelet transform (CWT) was utilized to enhance the spectral resolution and remove the background in the spectra [36]. A Symmlet filter with a vanishing moment of 4 (Sym4) was adopted, and the scale parameter was set to 40 for enhancing the smooth effect. CWT with Sym4 filter is an approximate equivalence of the fourth derivative [12,37].
PLS regression was used to establish the quantitative models. The first and second groups were used separately to develop models for pHe and pHi, respectively. The third group served as an external validation for the pHe model. The performances of models were evaluated by correlation coefficient (Rcv) and root mean squared error of cross validation (RMSECV). The prediction accuracy was evaluated by correlation coefficient (R) and root mean squared error of prediction set (RMSEP) [12,38,39]. The calibration and validation sets were divided by using the even distribution of the pH values. The ratio of the calibration set to the validation set was around 5:1.
Monte Carlo uninformative variable elimination (MC-UVE), randomization test (RT), and competitive adaptive reweighted sampling (CARS) were employed for the selection of variables, aiming to reduce the interference of uninformative variables and select the pH-dependent variables [40,41,42].

3. Results and Discussion

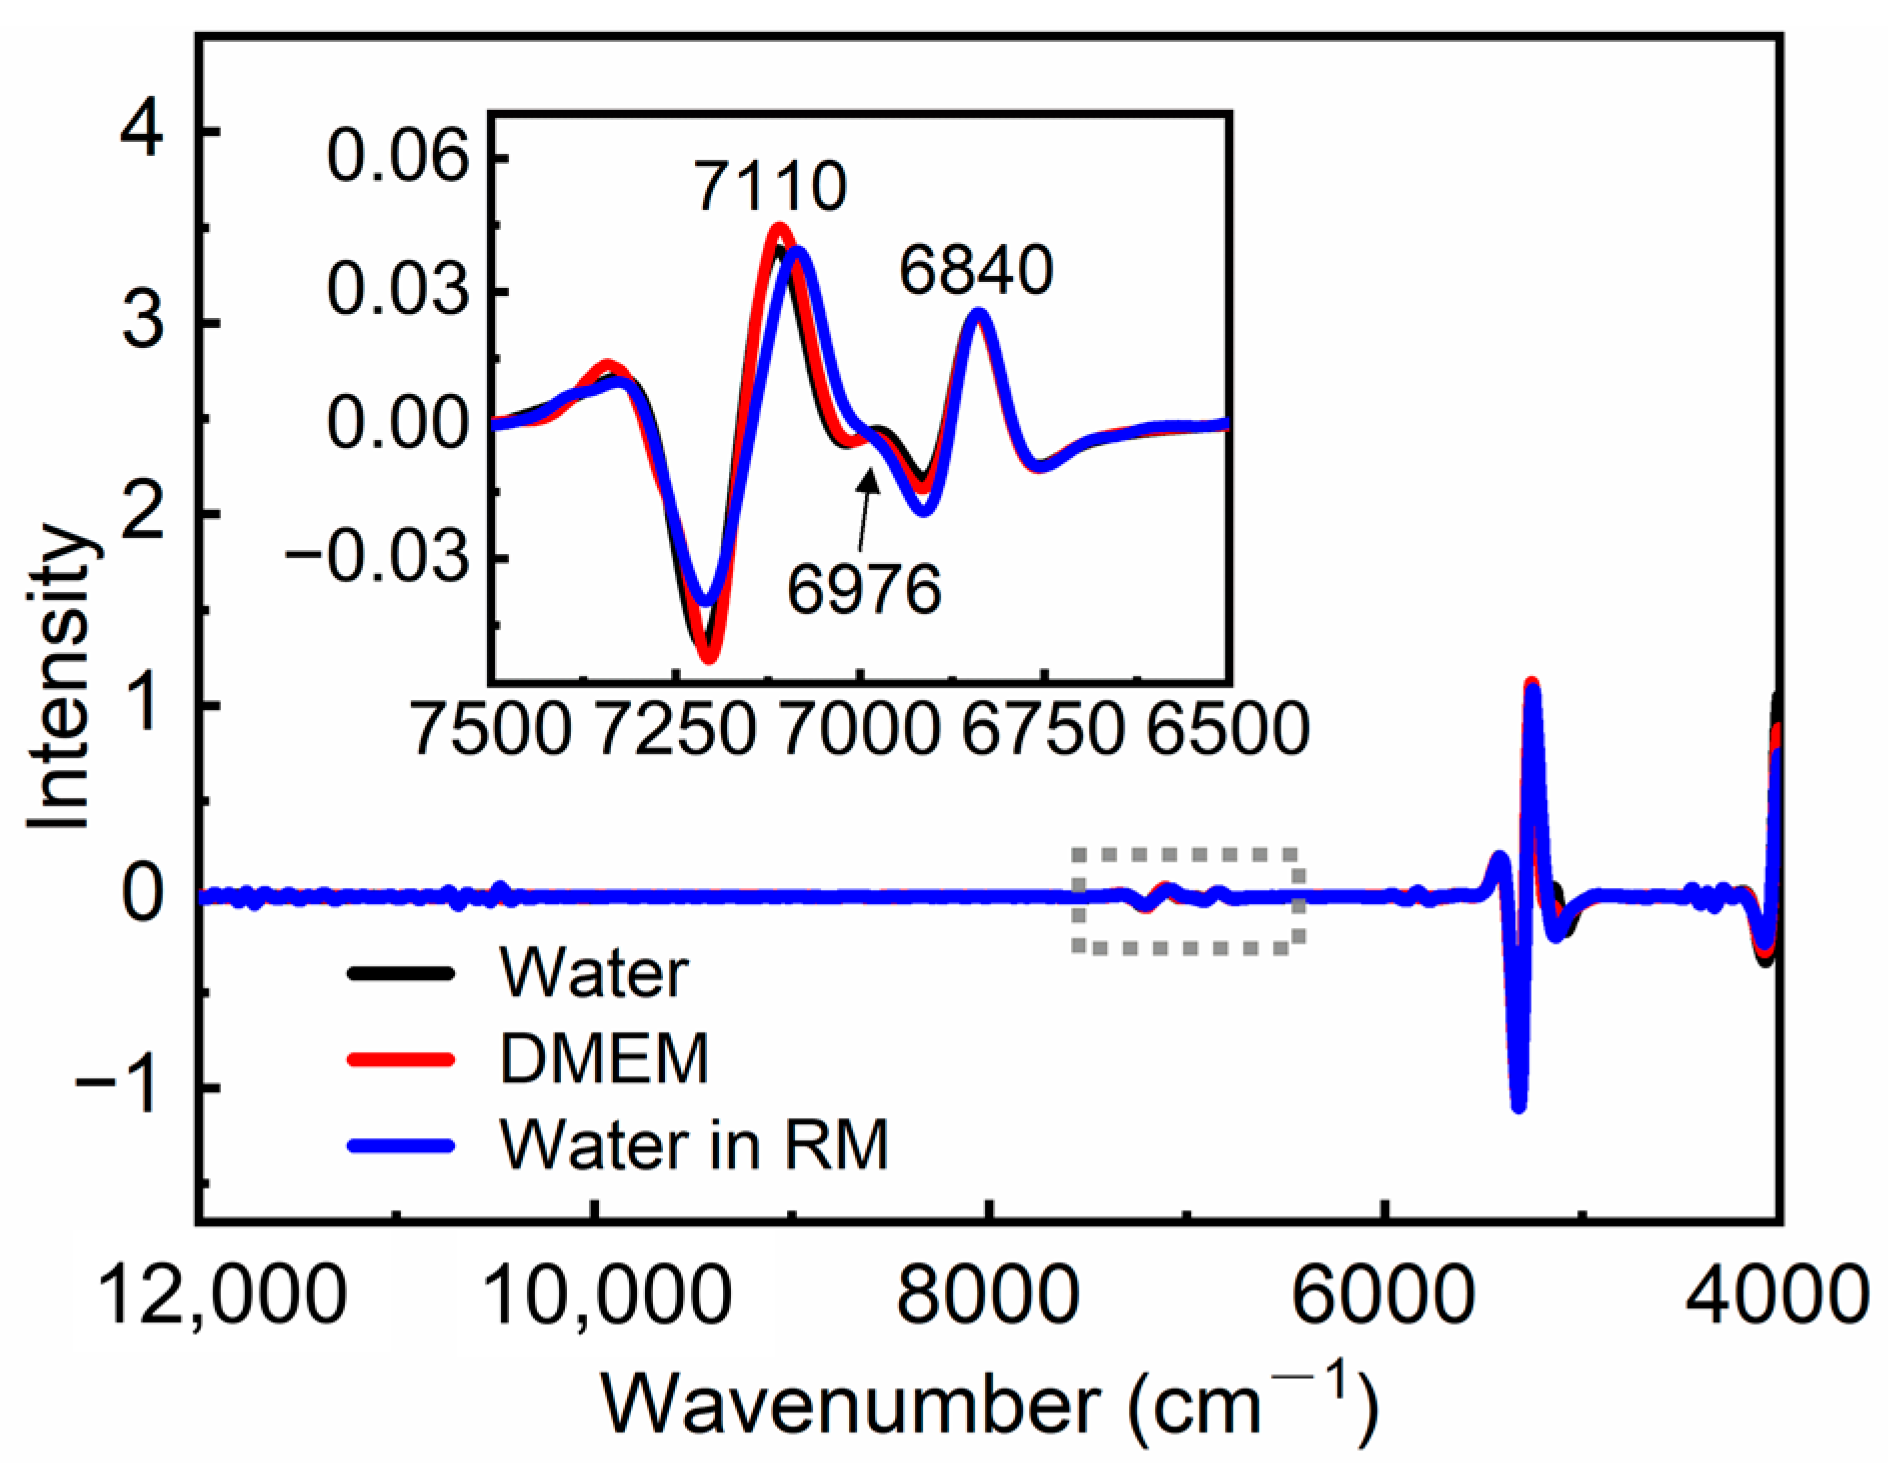
3.1. Spectral Analysis

Figure 1 shows the NIR spectra of water, DMEM, AOT/IO, and RM. In the spectra of water and DMEM, two main absorption peaks can be observed at 6900 and 5200 cm−1, corresponding to the first overtone of OH stretching and the combination of OH bending and stretching vibrations, respectively [19]. The peak around 6900 cm−1 is an overlapping absorption arising from OH groups in water molecules with different hydrogen bonds, which is sensitive to changes in concentration, temperature, and pH. Therefore, the subsequent analysis was mainly focused on the peak at 6900 cm−1. In the spectra of AOT/IO and RM, the water content is significantly reduced, which leads to weaker signals at 6900 and 5200 cm−1. The peaks around 5800 and 4312 cm−1 contain the vibrational absorption of CH groups in AOT and IO [43]. It is difficult to perform further analysis due to the broadness of the peaks. Resolution enhancement is needed.
CWT was used to enhance the resolution of spectra and remove the background [36,37]. Figure 2 presents the transformed spectra of water, DMEM, and water inside RM. The insert exhibits the enlarged spectra in the range of 7500–6500 cm−1, which mainly corresponds to the characteristic absorption of water. In the spectra of water and DMEM, three peaks were observed at 7110, 6976, and 6840 cm−1, which can be assigned to the absorption of OH in non-bonded (NHB), weakly hydrogen-bonded (WHB), and strongly hydrogen-bonded (SHB) water molecules, respectively [44,45]. The intensity of the peak at 7110 cm−1 in the spectrum of DMEM slightly exceeds that of water, while the intensity of the peak at 6976 cm−1 is slightly lower than water, which may be attributed to the hydrophobic interaction of organic compounds in DMEM [46]. In the RM system, the weak absorption of water is covered by the strong C-H absorption. To extract the absorption of water in RM, the transformed spectrum of AOT/IO was subtracted from the spectrum of RM. The blue curve in Figure 2 represents the amplified difference spectra, which mainly reflect the absorption of water inside RM. The peaks at 7110, 6976, and 6840 cm−1 remain and correspond to the absorption of NHB, WHB, and SHB water inside RM, respectively.

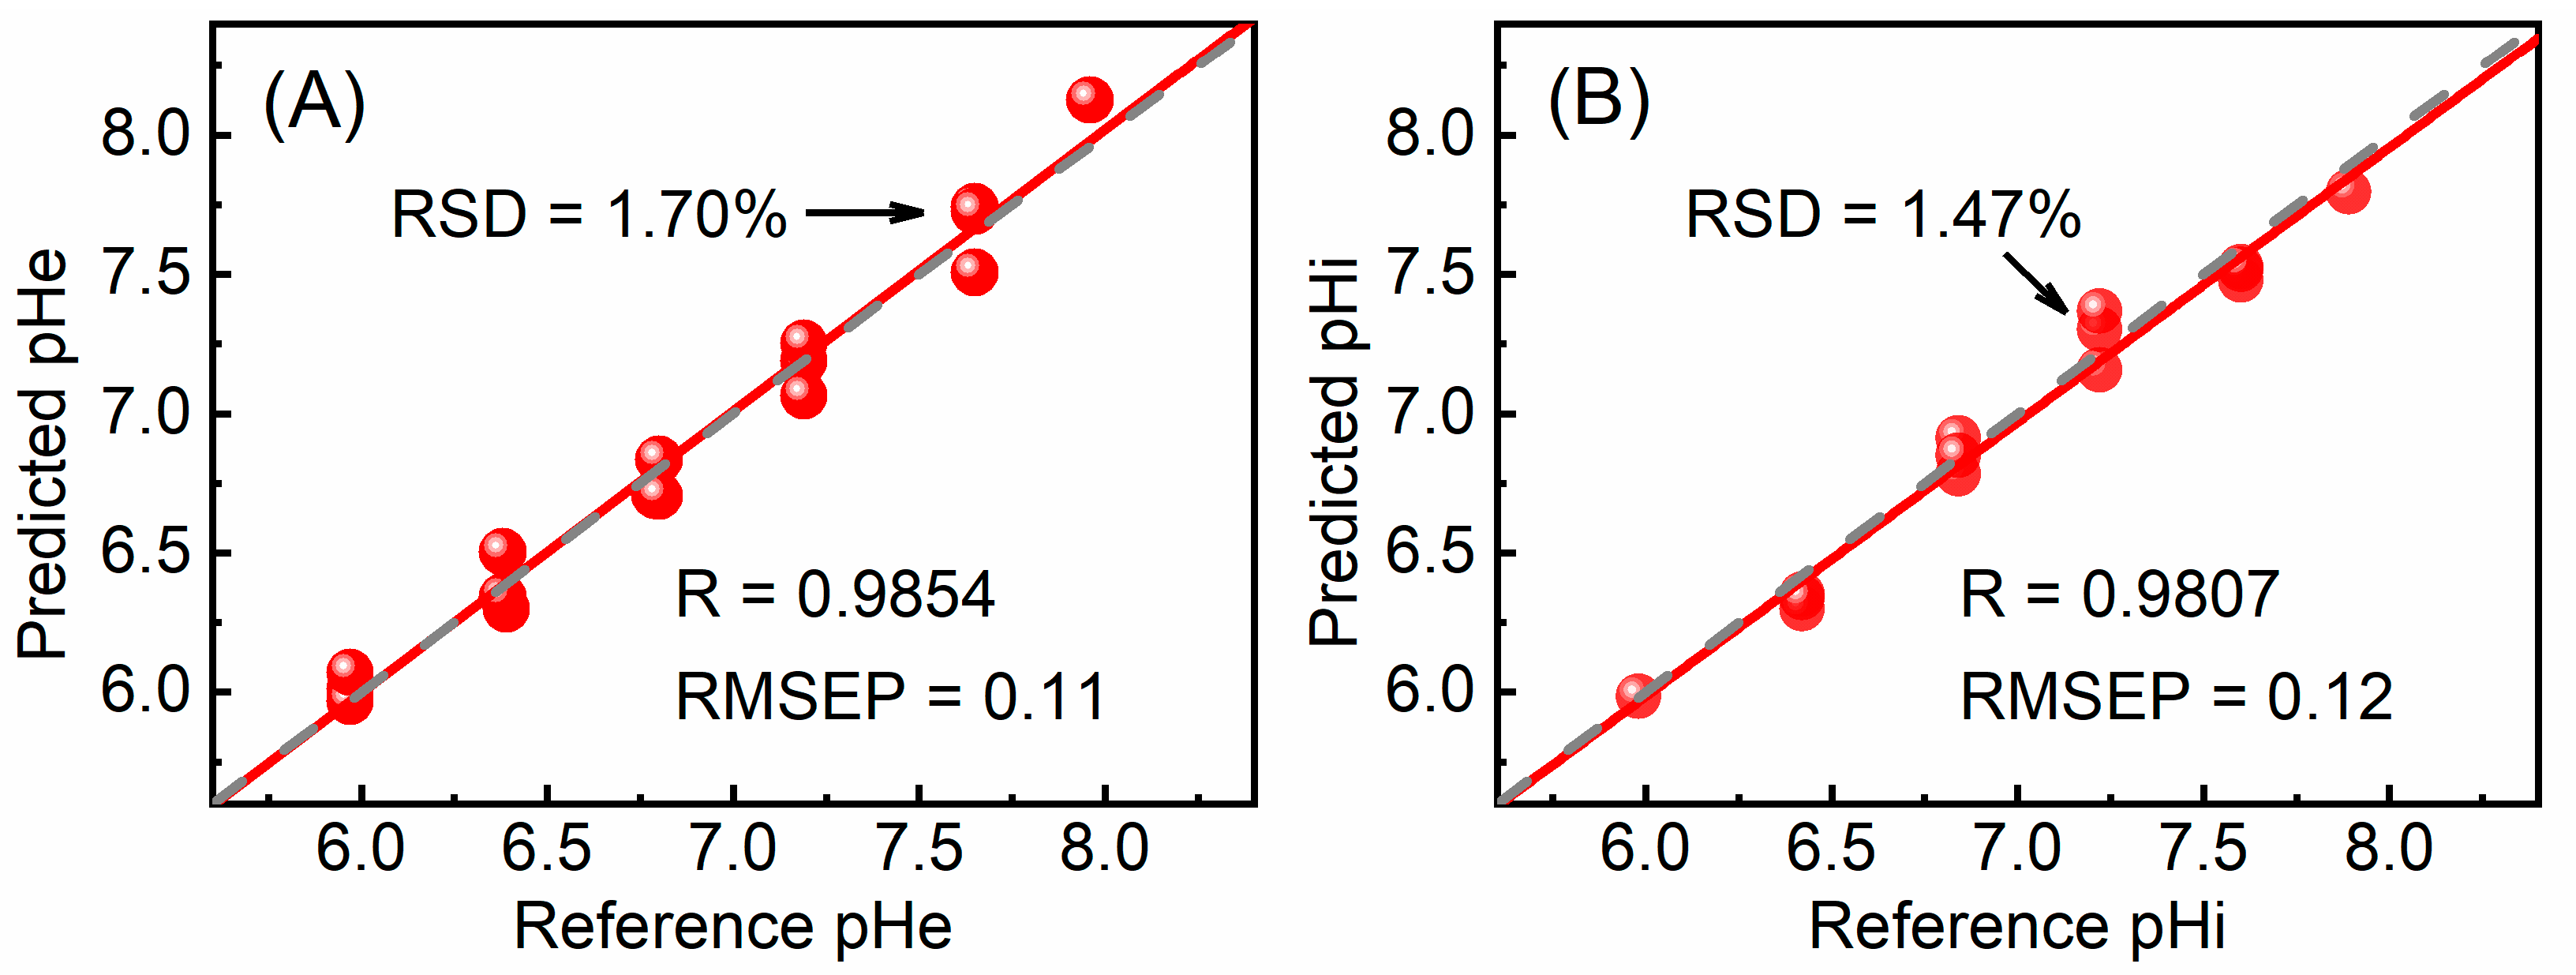
3.2. Quantitative Models and Validation

The quantitative relationships between the spectra of DMEM and pHe, as well as the spectra of water in RM and pHi, were established using PLS regression. Different spectral ranges were used to develop optimal PLS models, including the original spectra in the full range and in the range of 7500–6500 cm−1 and CWT spectra in the full range and in the range of 7500–6500 cm−1. Variable selection was performed by MC-UVE, RT, and CARS. Table 1 summarizes the PLS models and corresponding prediction results. Generally, a better model should have a higher value of R/Rcv and a lower value of RMSEP/RMSECV [12]. As shown in Table 1, for both pHe and pHi prediction, the CWT-MC-UVE, CWT-RT, and CWT-CARS models exhibit better performance compared to other models. In this study, the CWT-CARS models were adopted because of the fewest variables and good predictive performance.
To evaluate the prediction performance of the pHe and pHi models, internal validation was performed using 16 and 14 samples, respectively. The relationships between the reference and predicted pH are shown in Figure 3. It can be seen that both quantitative models exhibit a strong linear correlation between the reference and predicted values, despite the slight deviation between the fitted line and the diagonal line. The values of R and RMSEP for the pHe model are 0.9854 and 0.11, respectively. The values of R and RMSEP for the pHi model are 0.9807 and 0.12, respectively. For a more detailed analysis of the prediction results, the reference pH, predicted pH, absolute error, and relative error for each validation sample were listed in Table 2. For the pHe model, the absolute errors of the samples range from −0.05 to 0.16, with corresponding relative errors varying from −0.74% to 2.07%. For the samples repeated three times, the maximum value of the relative standard deviation (RSD) is 1.70%. For the pHi model, the absolute errors of the samples range from −0.09 to 0.06, with relative errors varying from −1.40% to 0.83%. For the samples repeated three times, the maximum value of RSD was 1.47%. The values of relative errors and RSD indicate that both models have good prediction performance and excellent repeatability.
To assess the practicality of the pHe model, external validation was conducted using three DMEM samples that had been used for cell cultivation, and the results were listed in Table 2. The absolute errors of the three samples are −0.13, −0.06, and 0.19. The relative errors are −2.00%, −0.95%, and 3.05%. The result indicates the good practicality of the pHe model. Due to the difficulty in obtaining actual intra-cellular fluid samples, no external validation for the pHi model was performed.

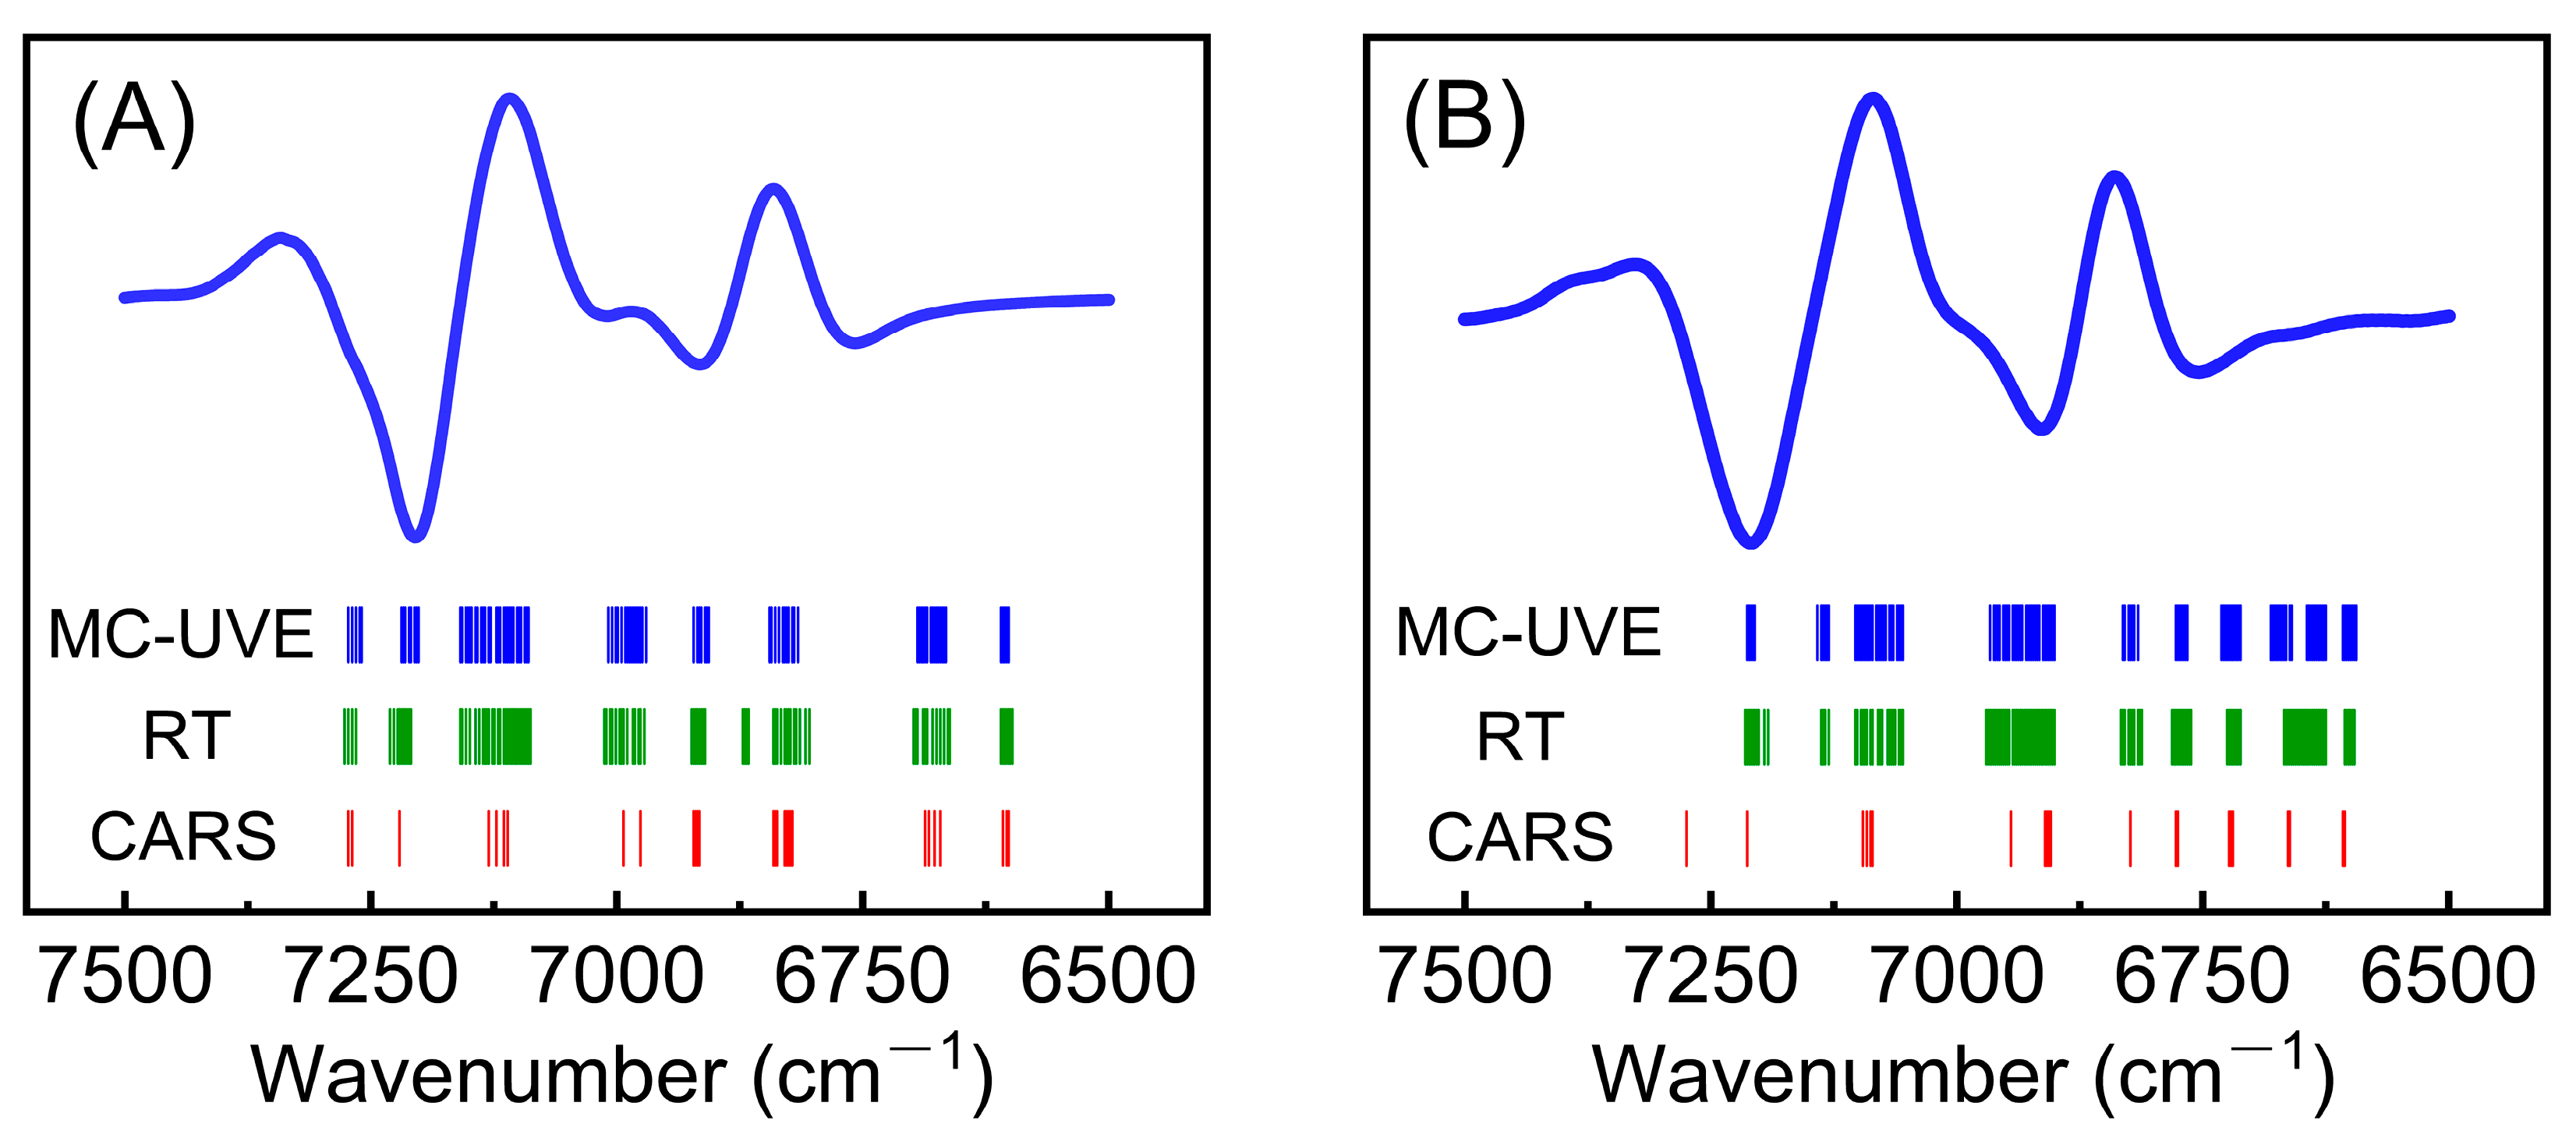
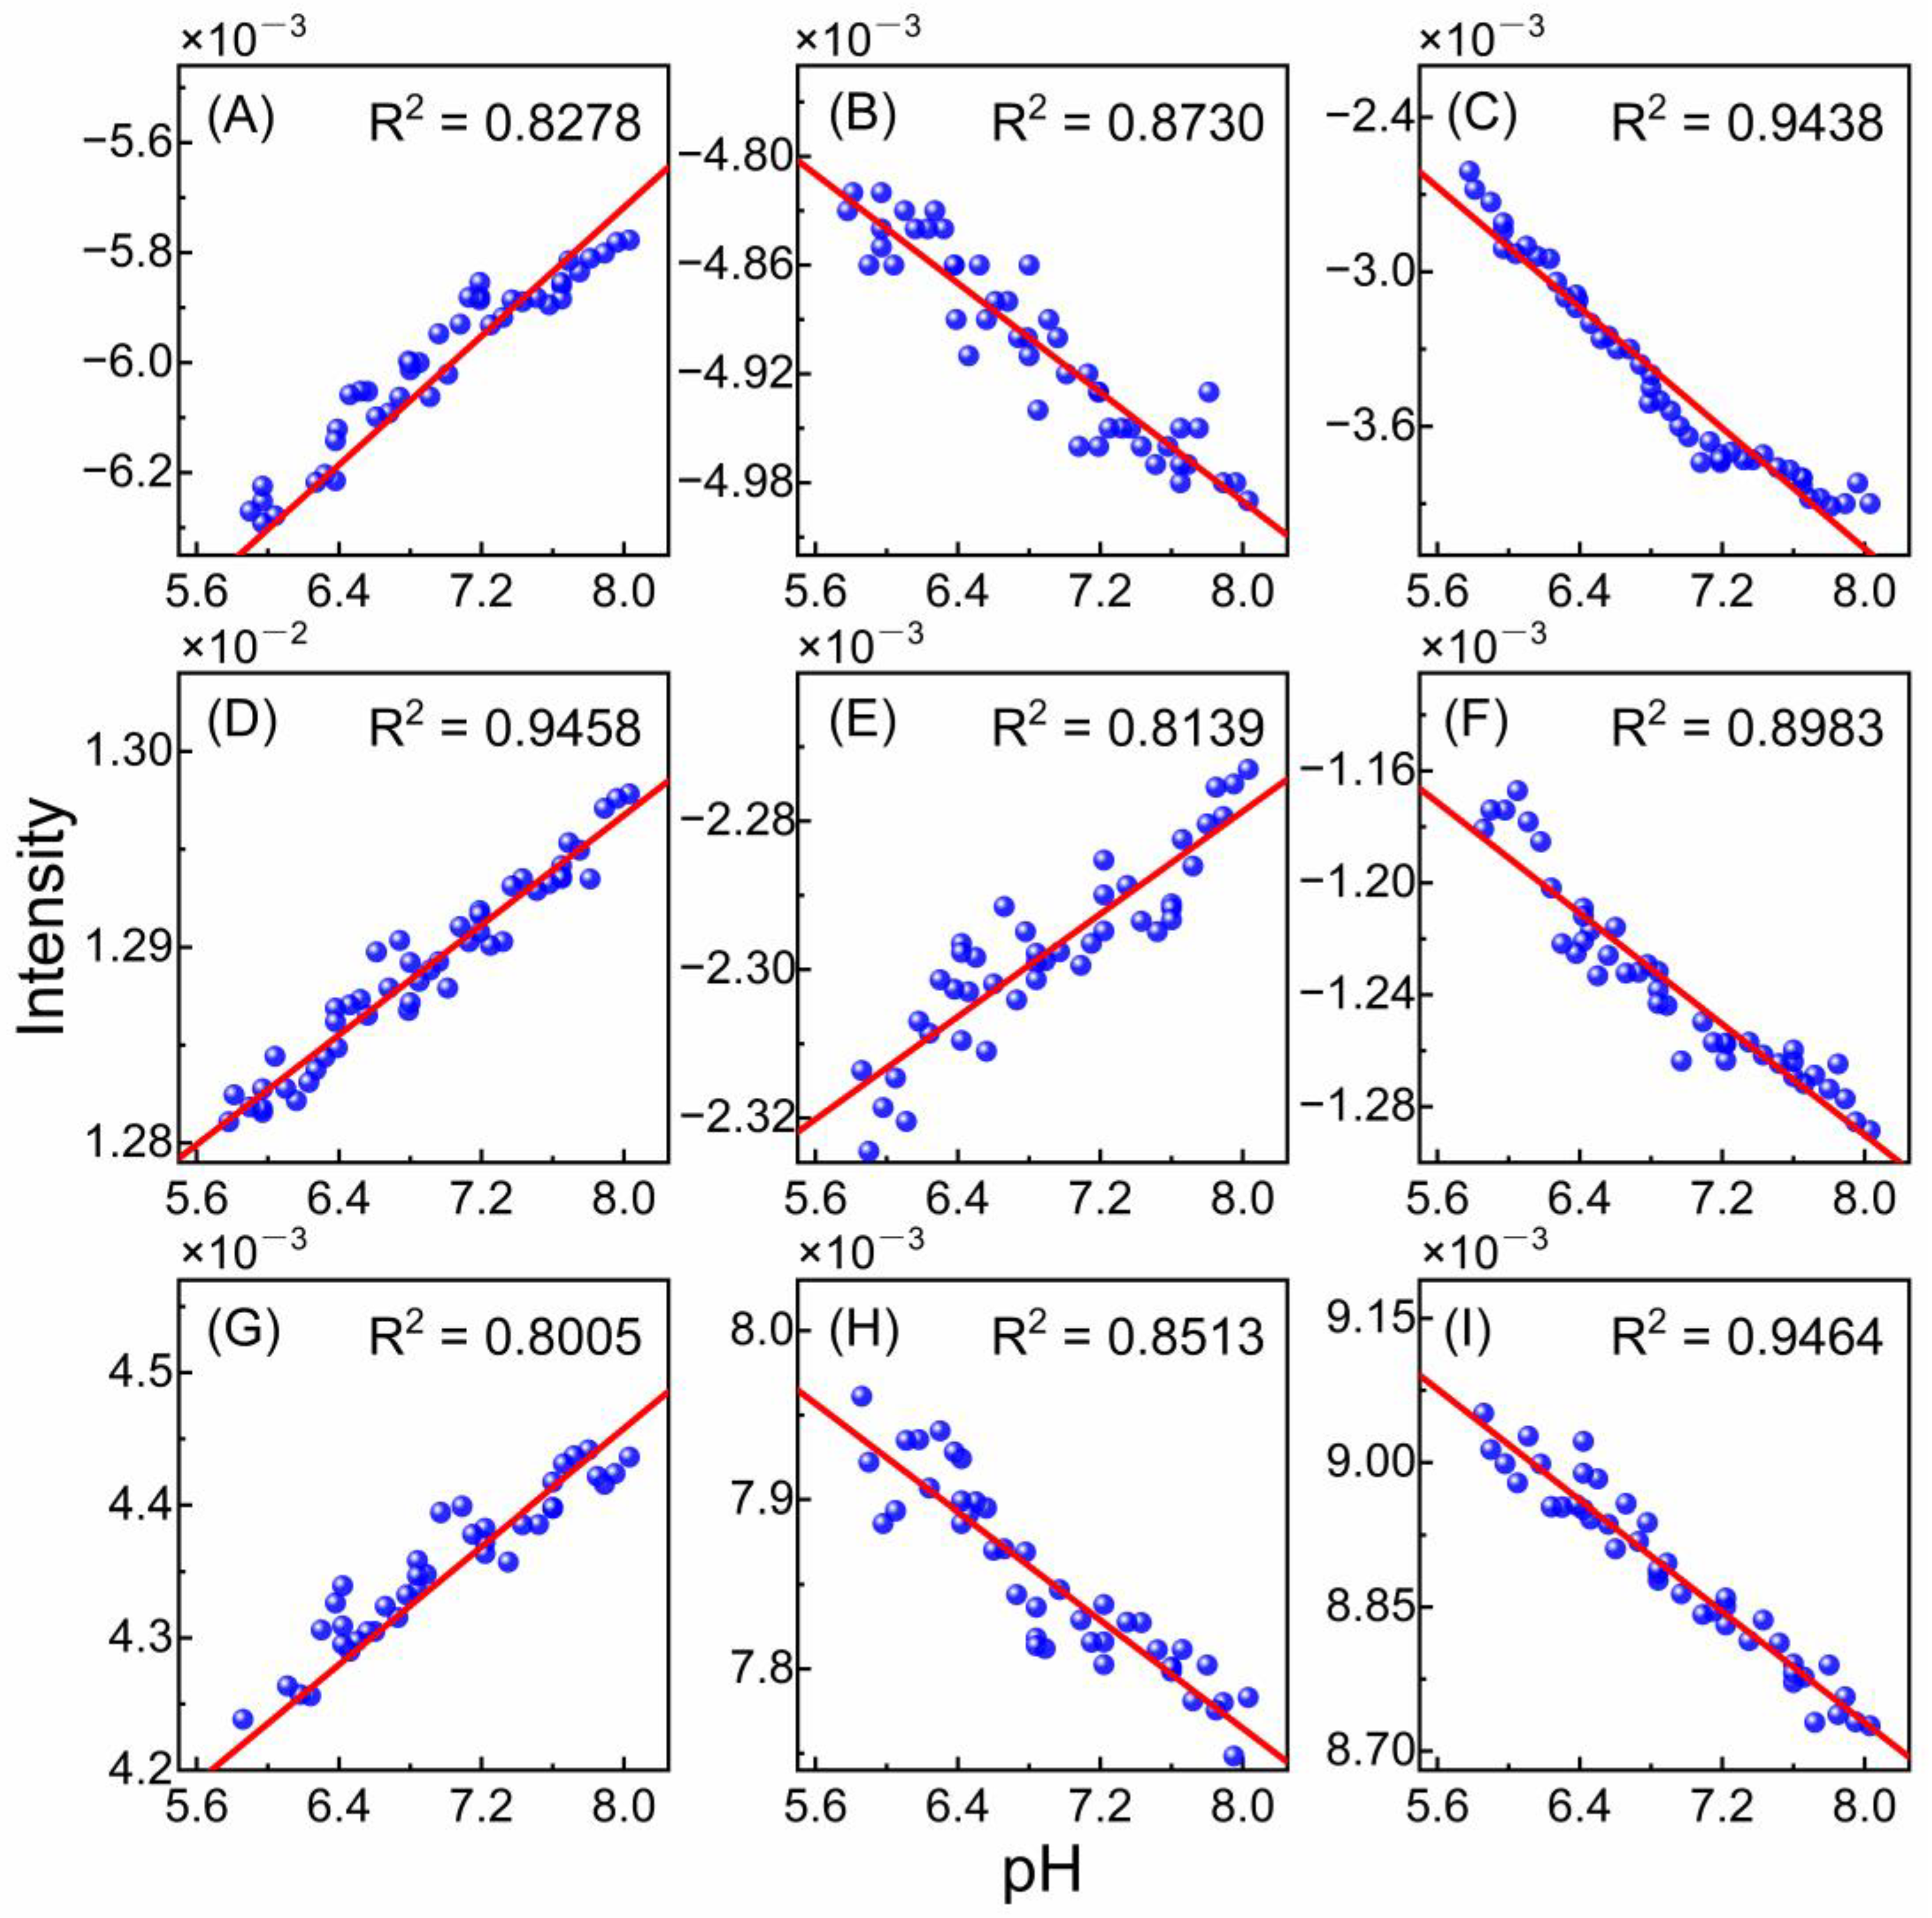
3.3. pH Dependence of Selected Wavenumbers

To better understand the selected variables (wavenumbers) by MC-UVE, RT, and CARS, the attribution of these wavenumbers was performed. Figure 4A shows the selected wavenumbers for the pHe model. Among the common variables selected by the three methods, 6671, 6828, 6916, and 7110 cm−1 are consistent with the peak positions of water molecules with three hydrogen bonds (S3), two hydrogen bonds (S2), one hydrogen bond (S1), and no hydrogen bond (S0), respectively [19,47,48,49]. Figure 4B depicts the selected wavenumbers for the pHi model: 6661, 6719/6823, 6904, and 7095 cm−1 belong to the common variables selected by the three methods and correspond to the peak positions of the S3, S2, and S1 water molecules, respectively [19,47,48,49]. In our previous studies, AmDn was used to describe water structures [20], where A and D represent the proton acceptor and proton donor, respectively, while m and n indicate the number of hydrogen bonds (m, n = 0, 1, or 2). Therefore, nine water structures can be defined, namely A0D0, A0D1, A1D0, A0D2, A1D1, A2D0, A1D2, A2D1, and A2D2. The possible AmDn water structures corresponding to the selected wavenumbers were summarized in Table 3. The correspondence between the water structure and the selected wavenumbers demonstrates that water molecules with different hydrogen bonds may serve as a probe to sense pH within the biological system.
In order to investigate the pH dependence of wavenumbers listed in Table 3, the variations in peak intensities with pH were plotted in Figure 5, and a linear fit was performed. Figure 5A–D represent the variations in intensities at 6671, 6828, 6916, and 7110 cm−1 with pHe, and R-squared (R2) values are 0.8278, 0.8730, 0.9438, and 0.9458, respectively. Figure 5E–I depict the variations in intensities at 6661, 6719, 6823, 6904, and 7095 cm−1 with pHi, and R2 values are 0.8139, 0.8983, 0.8005, 0.8513, and 0.9464, respectively. All R2 values exceed 0.80, indicating a good linear relationship between intensities and pH. It is demonstrated that the selected wavenumbers do have a good pH dependence. Obviously, the intensities at 7110 and 7095 cm−1 show a strong linear relationship with pH, with R2 close to 0.95, suggesting that the S0 water molecules may exhibit a greater accuracy and sensitivity than S3–S1 water molecules. However, due to the complexity of the spectra and overlapping of the peaks, the spectral intensities can only show an approximate dependency on pH, and the precise relationship between water structure and the respective pHe or pHi cannot be obtained. Additionally, considering the disparity between pHe and pHi systems, it is reasonable that the variation trends of peak intensities with pH for the same structure are different.

4. Conclusions

The characteristic absorption of water in the NIR region was applied to detect pHe and pHi. DMEM and RM were used to simulate the extra- and intra-cellular fluids with different pH values, respectively. With the help of CWT and CARS, optimal quantitative models for pHe and pHi were built separately and exhibited good prediction performance and excellent repeatability. The correspondence between the selected wavenumbers and S0–S3 water structures can be found, and the good pH dependence of the selected wavenumbers was demonstrated. The findings indicate that water with different hydrogen bonds may be used as a probe to sense pH within biological systems.

Author Contributions

Conceptualization, X.S. and D.L.; methodology, J.L., F.L. and L.H.; software, J.L.; validation, X.S. and W.C.; formal analysis, J.L., F.L. and X.Y.; investigation, J.L., F.L. and L.H.; resources, X.S. and D.L.; data curation, J.L., F.L. and X.Y.; writing—original draft preparation, J.L.; writing—review and editing, X.S.; visualization, J.L.; supervision, X.S., W.C. and D.L.; project administration, X.S., W.C. and D.L.; funding acquisition, X.S. and W.C. All authors have read and agreed to the published version of the manuscript.

Funding

This research was funded by the National Natural Science Foundation of China (No. 22174075) and the Haihe Laboratory of Sustainable Chemical Transformations.

Institutional Review Board Statement

Not applicable.

Informed Consent Statement

Not applicable.

Data Availability Statement

The data presented in this study are available on request from the corresponding author.

Conflicts of Interest

The authors declare no conflict of interest.

References

  1. Cialla, M.D.; Zheng, X.S.; Weber, K.; Popp, J. Recent progress in surface-enhanced Raman spectroscopy for biological and biomedical applications: From cells to clinics. Chem. Soc. Rev. 2017, 46, 3945–3961. [Google Scholar] [CrossRef]
  2. Kurkdjian, A.; Guern, J. Intracellular pH: Measurement and importance in cell activity. Annu. Rev. Plant Physiol. Plant Mol. Biol. 1989, 40, 271–303. [Google Scholar] [CrossRef]
  3. Sindhu, R.; Binod, P.; Pandey, A. Biological pretreatment of lignocellulosic biomass—An overview. Bioresour. Technol. 2016, 199, 76–82. [Google Scholar] [CrossRef]
  4. Persi, E.; Duran, F.M.; Damaghi, M.; Roush, W.R.; Aloy, P.; Cleveland, J.L.; Gillies, R.J.; Ruppin, E. Systems analysis of intracellular pH vulnerabilities for cancer therapy. Nat. Commun. 2018, 9, 2997. [Google Scholar] [CrossRef] [Green Version]
  5. Stubbs, M.; McSheehy, P.M.; Griffiths, J.R.; Bashford, C.L. Causes and consequences of tumour acidity and implications for treatment. Mol. Med. Today 2000, 6, 15–19. [Google Scholar] [CrossRef]
  6. Suffrian, K.; Schulz, K.G.; Gutowska, M.A.; Riebesell, U.; Bleich, M. Cellular pH measurements in Emiliania huxleyi reveal pronounced membrane proton permeability. New Phytol. 2011, 190, 595–608. [Google Scholar] [CrossRef] [Green Version]
  7. Shirmanova, M.V.; Druzhkova, I.N.; Lukina, M.M.; Dudenkova, V.V.; Ignatova, N.I.; Snopova, L.B.; Shcheslavskiy, V.I.; Belousov, V.V.; Zagaynova, E.V. Chemotherapy with cisplatin: Insights into intracellular pH and metabolic landscape of cancer cells in vitro and in vivo. Sci. Rep. 2017, 7, 8911. [Google Scholar] [CrossRef] [Green Version]
  8. Ball, P. Water—An enduring mystery. Nature 2008, 452, 291–292. [Google Scholar] [CrossRef]
  9. Ball, P. Water as an active constituent in cell biology. Chem. Rev. 2008, 108, 74–108. [Google Scholar] [CrossRef]
  10. Czarnik-Matusewicz, B.; Pilorz, S. Study of the temperature-dependent near-infrared spectra of water by two-dimensional correlation spectroscopy and principal components analysis. Vib. Spectrosc. 2006, 40, 235–245. [Google Scholar] [CrossRef]
  11. Dong, Q.; Guo, X.P.; Li, L.; Yu, C.; Nie, L.; Tian, W.L.; Zhang, H.; Huang, S.; Zang, H.C. Understanding hyaluronic acid induced variation of water structure by near-infrared spectroscopy. Sci. Rep. 2020, 10, 1387. [Google Scholar] [CrossRef] [Green Version]
  12. Su, C.L.; Han, L.; An, H.L.; Cai, W.S.; Shao, X.G. Structures of water on the surface of anatase TiO2 studied by diffuse reflectance near-infrared spectroscopy. Spectrochim. Acta Part A Mol. Biomol. Spectrosc. 2023, 296, 122674. [Google Scholar] [CrossRef]
  13. Han, G.; Yu, X.Y.; Xia, D.D.; Liu, R.; Liu, J.; Xu, K.X. Preliminary clinical validation of a differential correction method for improving measurement accuracy in noninvasive measurement of blood glucose using near-infrared spectroscopy. Appl. Spectrosc. 2017, 71, 2177–2186. [Google Scholar] [CrossRef]
  14. Eum, C.; Jang, D.; Kim, J.; Choi, S.; Cha, K.; Chung, H. Improving the accuracy of spectroscopic identification of geographical origins of agricultural samples through cooperative combination of near infrared and laser-induced breakdown spectroscopy. Spectrochim. Acta Part B At. Spectrosc. 2018, 149, 281–287. [Google Scholar] [CrossRef]
  15. Porep, J.U.; Kammerer, D.R.; Carle, R. On-line application of near infrared (NIR) spectroscopy in food production. Trends Food Sci. Technol. 2015, 46, 211–230. [Google Scholar] [CrossRef]
  16. Bec, K.B.; Huck, C.W. Breakthrough potential in near-infrared spectroscopy: Spectra simulation. A review of recent developments. Front. Chem. 2019, 7, 48. [Google Scholar] [CrossRef] [Green Version]
  17. Bec, K.B.; Grabska, J.; Huck, C.W. Current and future research directions in computer-aided near-infrared spectroscopy: A perspective. Spectrochim. Acta Part A Mol. Biomol. Spectrosc. 2021, 254, 119625. [Google Scholar] [CrossRef]
  18. Bec, K.B.; Futami, Y.; Wojcik, M.J.; Nakajima, T.; Ozaki, Y. Spectroscopic and computational study of acetic acid and its cyclic dimer in the near-infrared region. J. Phys. Chem. A 2016, 120, 6170–6183. [Google Scholar] [CrossRef]
  19. Maeda, H.; Ozaki, Y.; Tanaka, M.; Hayashi, N.; Kojima, T. Near infrared spectroscopy and chemometrics studies of temperature-dependent spectral variations of water: Relationship between spectral changes and hydrogen bonds. J. Near Infrared Spectrosc. 1995, 3, 191–201. [Google Scholar] [CrossRef]
  20. Tan, J.H.; Sun, Y.; Ma, L.; Feng, H.Y.; Guo, Y.C.; Cai, W.S.; Shao, X.G. Knowledge-based genetic algorithm for resolving the near-infrared spectrum and understanding the water structures in aqueous solution. Chemom. Intell. Lab. Syst. 2020, 206, 104150. [Google Scholar] [CrossRef]
  21. Wang, Y.; Murayama, K.; Myojo, Y.; Tsenkova, R.; Hayashi, N.; Ozaki, Y. Two-dimensional Fourier transform near-infrared spectroscopy study of heat denaturation of ovalbumin in aqueous solutions. J. Phys. Chem. B 1998, 102, 6655–6662. [Google Scholar] [CrossRef]
  22. Goto, N.; Bazar, G.; Kovacs, Z.; Kunisada, M.; Morita, H.; Kizaki, S.; Sugiyama, H.; Tsenkova, R.; Nishigori, C. Detection of UV-induced cyclobutane pyrimidine dimers by near-infrared spectroscopy and aquaphotomics. Sci. Rep. 2015, 5, 11808. [Google Scholar] [CrossRef] [Green Version]
  23. Gao, L.L.; Zhong, L.; Zhang, J.; Zhang, M.Q.; Zeng, Y.Z.; Li, L.; Zang, H.C. Water as a probe to understand the traditional Chinese medicine extraction process with near infrared spectroscopy: A case of Danshen (Salvia miltiorrhiza Bge) extraction process. Spectrochim. Acta Part A Mol. Biomol. Spectrosc. 2021, 244, 118854. [Google Scholar] [CrossRef]
  24. Ishigaki, M.; Yasui, Y.; Kajita, M.; Ozaki, Y. Assessment of embryonic bioactivity through changes in the water structure using near-infrared spectroscopy and imaging. Anal. Chem. 2020, 92, 8133–8141. [Google Scholar] [CrossRef]
  25. Tsenkova, R.N.; Iordanova, I.K.; Toyoda, K.; Brown, D.R. Prion protein fate governed by metal binding. Biochem. Biophys. Res. Commun. 2004, 325, 1005–1012. [Google Scholar] [CrossRef]
  26. Sun, Y.; Ma, L.; Cai, W.S.; Shao, X.G. Interaction between tau and water during the induced aggregation revealed by near-infrared spectroscopy. Spectrochim. Acta Part A Mol. Biomol. Spectrosc. 2020, 230, 118046. [Google Scholar] [CrossRef]
  27. Chatani, E.; Tsuchisaka, Y.; Masuda, Y.; Tsenkova, R. Water molecular system dynamics associated with amyloidogenic nucleation as revealed by real time near infrared spectroscopy and aquaphotomics. PLoS ONE 2014, 9, e101997. [Google Scholar] [CrossRef]
  28. Jinendra, B.; Tamaki, K.; Kuroki, S.; Vassileva, M.; Yoshida, S.; Tsenkova, R. Near infrared spectroscopy and aquaphotomics: Novel approach for rapid in vivo diagnosis of virus infected soybean. Biochem. Biophys. Res. Commun. 2010, 397, 685–690. [Google Scholar] [CrossRef]
  29. Alam, M.K.; Rohrscheib, M.R.; Franke, J.E.; Niemczyk, T.M.; Maynard, J.D.; Robinson, M.R. Measurement of pH in whole blood by near-infrared spectroscopy. Appl. Spectrosc. 1999, 53, 316–324. [Google Scholar] [CrossRef]
  30. Amerov, A.K.; Chen, J.; Small, G.W.; Arnold, M.A. Scattering and absorption effects in the determination of glucose in whole blood by near-infrared spectroscopy. Anal. Chem. 2005, 77, 4587–4594. [Google Scholar] [CrossRef]
  31. Yadav, J.; Rani, A.; Singh, V.; Murari, B.M. Prospects and limitations of non-invasive blood glucose monitoring using near-infrared spectroscopy. Biomed. Signal Process. Control 2015, 18, 214–227. [Google Scholar] [CrossRef]
  32. Cui, X.Y.; Liu, X.W.; Yu, X.M.; Cai, W.S.; Shao, X.G. Water can be a probe for sensing glucose in aqueous solutions by temperature dependent near infrared spectra. Anal. Chim. Acta 2017, 957, 47–54. [Google Scholar] [CrossRef]
  33. Han, L.; Cui, X.Y.; Cai, W.S.; Shao, X.G. Three-level simultaneous component analysis for analyzing the near-infrared spectra of aqueous solutions under multiple perturbations. Talanta 2020, 217, 121036. [Google Scholar] [CrossRef]
  34. Smith, R.E.; Luisi, P.L. Micellar solubilization of bio-polymers in hydrocarbon solvents III. Empirical definition of an acidity scale in reverse micelles. Helv. Chim. Acta 1980, 63, 2302–2311. [Google Scholar] [CrossRef]
  35. Fujii, H.; Kawai, T.; Nishikawa, H. Determination of pH in reversed micelles. Bull. Chem. Soc. Jpn. 1979, 52, 2051–2055. [Google Scholar] [CrossRef] [Green Version]
  36. Shao, X.G.; Leung, A.K.M.; Chau, F.T. Wavelet: A new trend in chemistry. Acc. Chem. Res. 2003, 36, 276–283. [Google Scholar] [CrossRef]
  37. Shao, X.G.; Ma, C.X. A general approach to derivative calculation using wavelet transform. Chemom. Intell. Lab. Syst. 2003, 69, 157–165. [Google Scholar] [CrossRef]
  38. Zhu, Z.Y.; Chen, S.B.; Wu, X.Y.; Xing, C.R.; Yuan, J. Determination of soybean routine quality parameters using near-infrared spectroscopy. Food Sci. Nutr. 2018, 6, 1109–1118. [Google Scholar] [CrossRef] [Green Version]
  39. Zhang, M.; Zhao, C.; Shao, Q.J.; Yang, Z.D.; Zhang, X.F.; Xu, X.F.; Hassan, M. Determination of water content in corn stover silage using near-infrared spectroscopy. Int. J. Agric. Biol. Eng. 2019, 12, 143–148. [Google Scholar] [CrossRef]
  40. Tang, G.; Huang, Y.; Tian, K.D.; Song, X.Z.; Yan, H.; Hu, J.; Xiong, Y.M.; Min, S.G. A new spectral variable selection pattern using competitive adaptive reweighted sampling combined with successive projections algorithm. Analyst 2014, 139, 4894–4902. [Google Scholar] [CrossRef]
  41. Zhang, X.; Li, W.; Yin, B.; Chen, W.Z.; Kelly, D.P.; Wang, X.X.; Zheng, K.Y.; Du, Y.P. Improvement of near infrared spectroscopic (NIRS) analysis of caffeine in roasted Arabica coffee by variable selection method of stability competitive adaptive reweighted sampling (SCARS). Spectrochim. Acta Part A Mol. Biomol. Spectrosc. 2013, 114, 350–356. [Google Scholar] [CrossRef]
  42. Zhang, M.J.; Zhang, S.Z.; Iqbal, J. Key wavelengths selection from near infrared spectra using Monte Carlo sampling–recursive partial least squares. Chemom. Intell. Lab. Syst. 2013, 128, 17–24. [Google Scholar] [CrossRef]
  43. Qi, L.H.; Cai, W.S.; Shao, X.G. Effect of temperature on near infrared spectra of n-alkanes. Acta Chim Sin. 2016, 74, 172–178. [Google Scholar] [CrossRef]
  44. Czarnecki, M.A.; Morisawa, Y.; Futami, Y.; Ozaki, Y. Advances in molecular structure and interaction studies using near-infrared spectroscopy. Chem. Rev. 2015, 115, 9707–9744. [Google Scholar] [CrossRef]
  45. Gowen, A.A.; Amigo, J.M.; Tsenkova, R. Characterisation of hydrogen bond perturbations in aqueous systems using aquaphotomics and multivariate curve resolution-alternating least squares. Anal. Chim. Acta 2013, 759, 8–20. [Google Scholar] [CrossRef]
  46. Takeuchi, M.; Kajimoto, S.; Nakabayashi, T. Experimental evaluation of the density of water in a cell by Raman microscopy. J. Phys. Chem. Lett. 2017, 8, 5241–5245. [Google Scholar] [CrossRef]
  47. Tsenkova, R. Aquaphotomics: Dynamic spectroscopy of aqueous and biological systems describes peculiarities of water. J. Near Infrared Spectrosc. 2009, 17, 303–314. [Google Scholar] [CrossRef]
  48. Muncan, J.; Anantawittayanon, S.; Furuta, T.; Kaneko, T.; Tsenkova, R. Aquaphotomics monitoring of strawberry fruit during cold storage-A comparison of two cooling systems. Front. Nutr. 2022, 9, 1058173. [Google Scholar] [CrossRef]
  49. Tsenkova, R.; Muncan, J.; Pollner, B.; Kovacs, Z. Essentials of aquaphotomics and its chemometrics approaches. Front. Chem. 2018, 6, 363. [Google Scholar] [CrossRef]
Figure 1. NIR spectra of water, DMEM, AOT/IO, and RM. The inset shows the enlarged spectra in the range of 7500–6000 cm−1.
Chemosensors 11 00425 g001
Figure 2. Transformed spectra of water, DMEM, and water inside RM. The inset shows the enlarged spectra in the range of 7500–6500 cm−1.
Chemosensors 11 00425 g002
Figure 3. Relationships between the reference and predicted values of the pHe (A) and pHi (B) models. The red line represents the linear fit of all points, and the gray dashed line represents the diagonal. The maximum value of RSD is labeled in the figure.
Chemosensors 11 00425 g003
Figure 4. Selected wavenumbers for the pHe (A) and pHi (B) models. The blue curve represents the average spectrum of samples, and the short line represents the selected wavenumber.
Chemosensors 11 00425 g004
Figure 5. Relationships between pH and intensities of the peaks at 6671 (A), 6828 (B), 6916 (C), and 7110 cm−1 (D) for the pHe model, and the peaks at 6661 (E), 6719 (F), 6823 (G), 6904 (H), and 7095 cm−1 (I) for the pHi model. The red line represents the linear fit of all points.
Chemosensors 11 00425 g005
Table 1. Parameters for the calibration and validation performance of PLS models.
MethodsSpectral
Range (cm−1)
nVar 1nLV 2RcvRMSECVRRMSEP
pHe
NoneFull spectra414870.97750.140.97870.15
None7500–650052070.98160.120.99030.10
CWTFull spectra414870.97430.150.97310.17
CWT7500–650052070.98530.110.98480.11
CWT-MC-UVE7500–65009540.98530.110.99100.09
CWT-RT7500–650010140.98610.110.99060.09
CWT-CARS7500–65002840.98900.080.98540.11
pHi
NoneFull spectra414840.90460.260.92400.24
None7500–650052040.96230.170.96110.15
CWTFull spectra414840.96280.170.96260.17
CWT7500–650052050.96390.160.96300.17
CWT-MC-UVE7500–650011950.97870.130.97950.12
CWT-RT7500–650012740.98020.120.98280.12
CWT-CARS7500–65002140.98340.110.98070.12
1. Number of spectral variables; 2. number of latent variables.
Table 2. Predicted results for the validation samples *.
Sample
Number
ReferencePredictionAbsolute
Error
Relative
Error (%)
RSD (%)
n = 3
pHe
 17.968.120.162.07-
 27.657.660.010.131.70
 37.197.17−0.02−0.281.36
 46.806.75−0.05−0.741.07
 56.386.450.071.101.66
 65.976.020.050.840.84
 76.496.36−0.13−2.00-
 86.326.26−0.06−0.95-
 96.226.410.193.05-
pHi
 17.897.80−0.09−1.18-
 27.607.51−0.09−1.180.35%
 37.227.280.060.831.47%
 46.846.850.010.151.45%
 56.426.33−0.09−1.400.42%
 65.985.990.010.17-
* For the pHe model, samples 1–6 are used for internal validation, and samples 7–9 are used for external validation; repetition (3 times) was conducted for samples 2–6 and 2–5, respectively, for pHi and pHe models.
Table 3. Possible water structures corresponding to the selected wavenumbers.
Wavenumber (cm−1)Water Structure
pHepHi
66716661S3 (A2D1)
-6719S2 (A2D0)
68286823S2 (A1D1)
69166904S1 (A0D1)
71107095S0 (A0D0)
Disclaimer/Publisher’s Note: The statements, opinions and data contained in all publications are solely those of the individual author(s) and contributor(s) and not of MDPI and/or the editor(s). MDPI and/or the editor(s) disclaim responsibility for any injury to people or property resulting from any ideas, methods, instructions or products referred to in the content.

